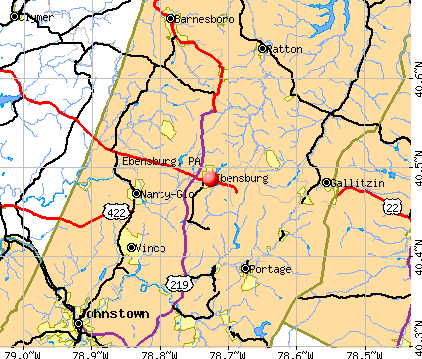
Ebensburg, Pennsylvania
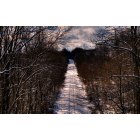
Ebensburg: This is a look off a bridge at the Ebensburg/Loretto line, shot with a Canon Rebel XS.
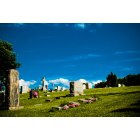
Ebensburg: The cemetery near one of Ebensburgs' main roads, shot with a Canon Rebel XS.

Ebensburg: Taken at the CCHS football field, shot with a Canon Rebel XS. For photography inquirees feel free to contact me at dellobob@live.com
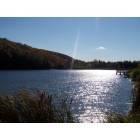
Ebensburg: Lake Rowena
- add
your
Submit your own pictures of this borough and show them to the world
- OSM Map
- General Map
- Google Map
- MSN Map
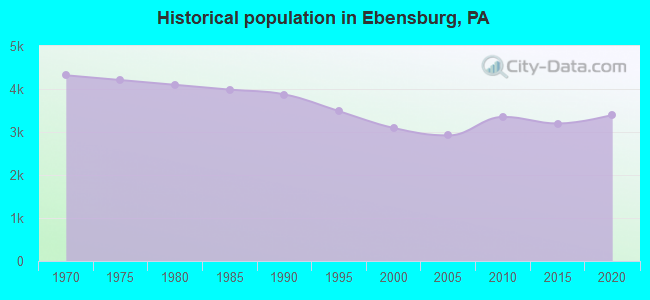
Population change since 2000: +8.5%
 |
| Males: 1,813 | |
| Females: 1,540 |
| Median resident age: | 41.6 years |
| Pennsylvania median age: | 40.9 years |
Zip codes: 15931.
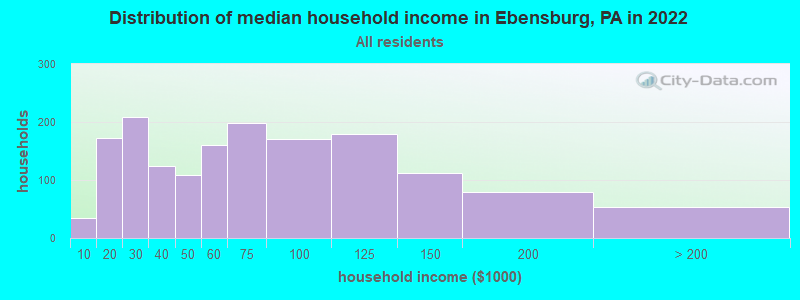
| Ebensburg: | $57,592 |
| PA: | $71,798 |
Estimated per capita income in 2022: $36,981 (it was $19,634 in 2000)
Ebensburg borough income, earnings, and wages data
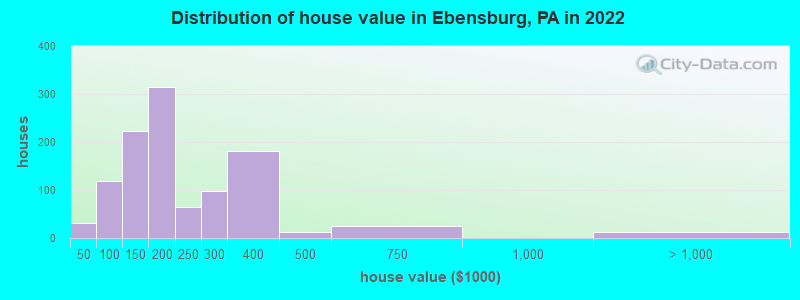
Estimated median house or condo value in 2022: $170,207 (it was $88,200 in 2000)
| Ebensburg: | $170,207 |
| PA: | $245,500 |
Mean prices in 2022: all housing units: $196,644; detached houses: $193,879; townhouses or other attached units: $305,159; in 2-unit structures: $193,039
Median gross rent in 2022: $786.
(6.4% for White Non-Hispanic residents, 100.0% for Black residents, 31.8% for Hispanic or Latino residents)
Detailed information about poverty and poor residents in Ebensburg, PA

Compare current foreclosures near Ebensburg, PA:
| Photo | Address | Area | Beds / Baths | Price | Details |
|---|---|---|---|---|---|

|
#1
E Crawford St
Ebensburg, PA 15931
|
- sq. feet
|
1 baths 4 beds |
show details | |

|
#2
E High St
Ebensburg, PA 15931
|
- sq. feet
|
- baths - beds |
show details | |

|
#3
Forest Dr
Ebensburg, PA 15931
|
- sq. feet
|
- baths - beds |
show details | |

|
#4
E High St
Ebensburg, PA 15931
|
- sq. feet
|
- baths - beds |
show details | |

|
#5
Avalon Rd
Altoona, PA 16601
|
1,962 sq. feet
|
2 baths 3 beds |
$47,500
|
show details |

|
#6
Old Mill Run Rd
Altoona, PA 16601
|
1,408 sq. feet
|
1 baths 2 beds |
$161,900
|
show details |

|
#7
Greenich St
Johnstown, PA 15902
|
1,105 sq. feet
|
1 baths 3 beds |
$145,500
|
show details |

|
#8
Vision St
Nanty Glo, PA 15943
|
2,216 sq. feet
|
2 baths 3 beds |
$236,500
|
show details |

|
#9
E Crawford St
Ebensburg, PA 15931
|
- sq. feet
|
- baths - beds |
show details | |

|
#10
W Lloyd St
Ebensburg, PA 15931
|
- sq. feet
|
- baths - beds |
show details |
| Photo | Address | Area | Beds / Baths | Price | Details |
|---|---|---|---|---|---|

|
#11
N Center St
Ebensburg, PA 15931
|
- sq. feet
|
- baths - beds |
show details | |

|
#12
Foster St
Gallitzin, PA 16641
|
2 sq. feet
|
2 baths 4 beds |
show details | |

|
#13
Pulaski Ln
Johnstown, PA 15906
|
1,028 sq. feet
|
2 baths 3 beds |
show details | |

|
#14
White Ln
Saint Benedict, PA 15773
|
954 sq. feet
|
1 baths 2 beds |
show details | |

|
#15
Harmony Dr
Flinton, PA 16640
|
1,080 sq. feet
|
1 baths 3 beds |
show details | |

|
#16
26th Ave
Altoona, PA 16601
|
1,582 sq. feet
|
1 baths 3 beds |
show details | |

|
#17
11 16th Avenue
Altoona, PA 16601
|
- sq. feet
|
- baths - beds |
$39,900
|
show details |

|
#18
Old Nanty Glo R
Nanty Glo, PA 15943
|
1,080 sq. feet
|
1 baths 3 beds |
show details | |

|
#19
Short St
Duncansville, PA 16635
|
1,566 sq. feet
|
1 baths 3 beds |
show details | |

|
#20
Colonial Dr
Duncansville, PA 16635
|
1,452 sq. feet
|
1 baths 3 beds |
show details |
| Photo | Address | Area | Beds / Baths | Price | Details |
|---|---|---|---|---|---|

|
#21
Alma Ave
Johnstown, PA 15902
|
640 sq. feet
|
1 baths 2 beds |
show details | |

|
#22
Maryland Ave
Altoona, PA 16602
|
1,188 sq. feet
|
1 baths 2 beds |
show details | |

|
#23
5th St
Colver, PA 15927
|
903 sq. feet
|
1 baths 2 beds |
show details | |

|
#24
Caroline St
Nanty Glo, PA 15943
|
- sq. feet
|
- baths - beds |
$34,900
|
show details |

|
#25
5th Ave
Duncansville, PA 16635
|
- sq. feet
|
1 baths 3 beds |
show details | |

|
#26
Blue Bird Ln
Portage, PA 15946
|
- sq. feet
|
- baths - beds |
$19,900
|
show details |

|
#27
Walnut Ave
Altoona, PA 16601
|
- sq. feet
|
1 baths 2 beds |
show details | |

|
#28
Broad Ave
Altoona, PA 16601
|
- sq. feet
|
2 baths 5 beds |
show details | |

|
#29
Bedford St
Johnstown, PA 15902
|
- sq. feet
|
2 baths 3 beds |
show details | |

|
#30
Sherwood Dr
Johnstown, PA 15905
|
- sq. feet
|
- baths - beds |
$39,900
|
show details |
| Photo | Address | Area | Beds / Baths | Price | Details |
|---|---|---|---|---|---|

|
#31
Ivy St
Parkhill, PA 15945
|
- sq. feet
|
- baths - beds |
$39,900
|
show details |

|
#32
Plummer Rd
Sidman, PA 15955
|
- sq. feet
|
2 baths 2 beds |
show details | |

|
#33
Turkey Ridge Rd
Flinton, PA 16640
|
- sq. feet
|
2 baths 3 beds |
show details | |

|
#34
18th Ave
Altoona, PA 16601
|
- sq. feet
|
1 baths 3 beds |
show details | |

|
#35
7th St
Seward, PA 15954
|
1,470 sq. feet
|
- baths - beds |
show details | |

|
#36
5th Ave
Altoona, PA 16602
|
- sq. feet
|
2 baths 4 beds |
show details | |

|
#37
Hull Ave
Johnstown, PA 15906
|
- sq. feet
|
- baths - beds |
show details | |

|
#38
Iron St
Johnstown, PA 15906
|
- sq. feet
|
- baths - beds |
show details | |

|
#39
Arthur St
Johnstown, PA 15902
|
- sq. feet
|
- baths - beds |
show details | |

|
#40
Skyline Dr
Dysart, PA 16636
|
- sq. feet
|
- baths - beds |
show details |
| Photo | Address | Area | Beds / Baths | Price | Details |
|---|---|---|---|---|---|

|
#41
Claruth Dr
Windber, PA 15963
|
- sq. feet
|
- baths - beds |
show details | |

|
#42
Penrod St # 1
Johnstown, PA 15902
|
- sq. feet
|
- baths - beds |
show details | |

|
#43
Main St Ste 101
Johnstown, PA 15901
|
- sq. feet
|
- baths - beds |
show details | |

|
#44
Spruce Grove Rd
Clymer, PA 15728
|
- sq. feet
|
- baths - beds |
show details | |

|
#45
Curtis Dr
Johnstown, PA 15904
|
- sq. feet
|
- baths - beds |
show details | |

|
#46
Route 403 Hwy S
Seward, PA 15954
|
- sq. feet
|
- baths - beds |
show details | |

|
#47
William Penn Ave
Johnstown, PA 15909
|
- sq. feet
|
- baths - beds |
show details | |

|
#48
Peaceful Place Dr
Portage, PA 15946
|
864 sq. feet
|
- baths - beds |
show details | |

|
#49
Oak St
Johnstown, PA 15902
|
- sq. feet
|
- baths - beds |
show details | |

|
Check over 1 million property listings on Foreclosure.com!
|
browse all offers | |||


- 3,23396.9%White alone
- 220.7%Two or more races
- 230.7%Hispanic
- 200.6%Asian alone
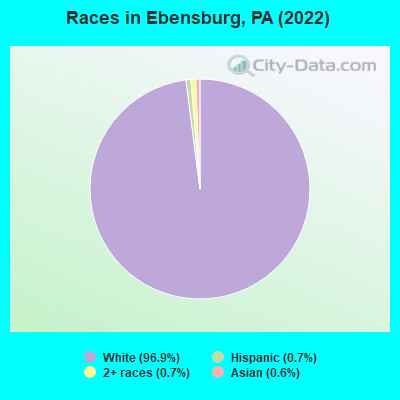
Races in Ebensburg detailed stats: ancestries, foreign born residents, place of birth
According to our research of Pennsylvania and other state lists, there were 29 registered sex offenders living in Ebensburg, Pennsylvania as of April 27, 2024.
The ratio of all residents to sex offenders in Ebensburg is 109 to 1.
Type |
2009 |
2010 |
2011 |
2012 |
2013 |
2014 |
2015 |
2016 |
2017 |
2018 |
2019 |
2020 |
2022 |
|---|---|---|---|---|---|---|---|---|---|---|---|---|---|
| Murders (per 100,000) | 0 (0.0) | 0 (0.0) | 0 (0.0) | 0 (0.0) | 0 (0.0) | 0 (0.0) | 0 (0.0) | 0 (0.0) | 0 (0.0) | 0 (0.0) | 0 (0.0) | 0 (0.0) | 0 (0.0) |
| Rapes (per 100,000) | 0 (0.0) | 0 (0.0) | 0 (0.0) | 1 (30.0) | 1 (30.5) | 1 (30.8) | 0 (0.0) | 0 (0.0) | 0 (0.0) | 1 (32.3) | 1 (32.7) | 0 (0.0) | 1 (29.8) |
| Robberies (per 100,000) | 2 (68.8) | 0 (0.0) | 0 (0.0) | 1 (30.0) | 2 (61.0) | 0 (0.0) | 0 (0.0) | 0 (0.0) | 0 (0.0) | 0 (0.0) | 1 (32.7) | 0 (0.0) | 0 (0.0) |
| Assaults (per 100,000) | 12 (412.8) | 16 (477.5) | 2 (59.5) | 8 (240.2) | 4 (122.0) | 0 (0.0) | 11 (342.6) | 7 (220.5) | 1 (31.9) | 1 (32.3) | 8 (261.4) | 0 (0.0) | 0 (0.0) |
| Burglaries (per 100,000) | 12 (412.8) | 16 (477.5) | 15 (446.2) | 7 (210.2) | 5 (152.5) | 25 (769.2) | 7 (218.0) | 1 (31.5) | 2 (63.8) | 2 (64.7) | 1 (32.7) | 2 (66.2) | 2 (59.5) |
| Thefts (per 100,000) | 41 (1,410) | 50 (1,492) | 44 (1,309) | 42 (1,261) | 36 (1,098) | 47 (1,446) | 29 (903.1) | 18 (566.9) | 14 (446.3) | 27 (872.9) | 13 (424.8) | 18 (595.4) | 13 (386.8) |
| Auto thefts (per 100,000) | 2 (68.8) | 2 (59.7) | 0 (0.0) | 2 (60.1) | 3 (91.5) | 3 (92.3) | 3 (93.4) | 2 (63.0) | 1 (31.9) | 6 (194.0) | 4 (130.7) | 0 (0.0) | 0 (0.0) |
| Arson (per 100,000) | 1 (34.4) | 0 (0.0) | 0 (0.0) | 1 (30.0) | 1 (30.5) | 0 (0.0) | 0 (0.0) | 0 (0.0) | 0 (0.0) | 0 (0.0) | 0 (0.0) | 0 (0.0) | 0 (0.0) |
| City-Data.com crime index | 194.0 | 193.4 | 95.5 | 151.1 | 129.0 | 143.7 | 127.4 | 74.0 | 31.2 | 87.3 | 118.0 | 28.4 | 43.4 |
The City-Data.com crime index weighs serious crimes and violent crimes more heavily. Higher means more crime, U.S. average is 246.1. It adjusts for the number of visitors and daily workers commuting into cities.
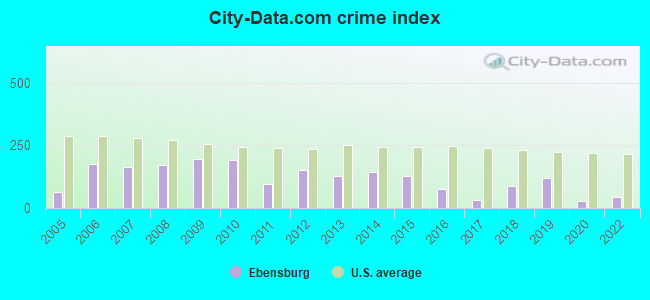
Crime rate in Ebensburg detailed stats: murders, rapes, robberies, assaults, burglaries, thefts, arson
Full-time law enforcement employees in 2021, including police officers: 5 (5 officers - 5 male; 0 female).
| Officers per 1,000 residents here: | 1.68 |
| Pennsylvania average: | 2.55 |
 Recent articles from our blog. Our writers, many of them Ph.D. graduates or candidates, create easy-to-read articles on a wide variety of topics.

 | Study into Route 28 expressway expansion to I-80 gets funding (83 replies) |
| Future of Johnstown/Cambria County (42 replies) |
| Best “back way” to Penn State? (9 replies) |
| Relocating family to Johnstown area, looking for recommendations (7 replies) |
| Tell me about Jefferson County - Reynoldsville, PA area. (11 replies) |
| Route 28: How will it be 4 lanes all the way to Kittanning? (65 replies) |
Latest news from Ebensburg, PA collected exclusively by city-data.com from local newspapers, TV, and radio stations
Ancestries: German (21.4%), American (18.0%), Polish (17.5%), Italian (12.6%), Irish (6.2%), Welsh (5.1%).
Current Local Time: EST time zone
Incorporated on 01/15/1825
Elevation: 2140 feet
Land area: 1.70 square miles.
Population density: 1,970 people per square mile (low).
48 residents are foreign born
| This borough: | 1.4% |
| Pennsylvania: | 7.3% |
Median real estate property taxes paid for housing units with mortgages in 2022: $1,966 (1.0%)
Median real estate property taxes paid for housing units with no mortgage in 2022: $1,644 (1.1%)
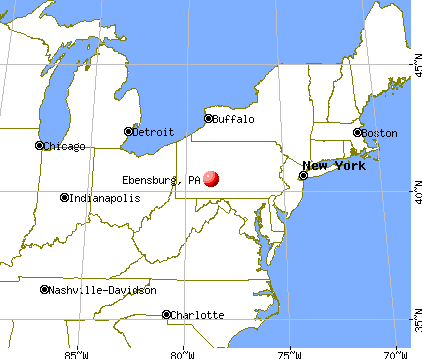
Nearest city with pop. 50,000+: Pittsburgh, PA  (65.9 miles , pop. 334,563).
Nearest city with pop. 1,000,000+: Philadelphia, PA (192.0 miles , pop. 1,517,550).
Nearest cities:
), ), ), ), ), Latitude: 40.49 N, Longitude: 78.73 W
Daytime population change due to commuting: +784 (+23.5%)
Workers who live and work in this borough: 454 (31.5%)
Area code: 814
Property values in Ebensburg, PA
Ebensburg, Pennsylvania accommodation & food services, waste management - Economy and Business Data
| Here: | 3.6% |
| Pennsylvania: | 2.9% |
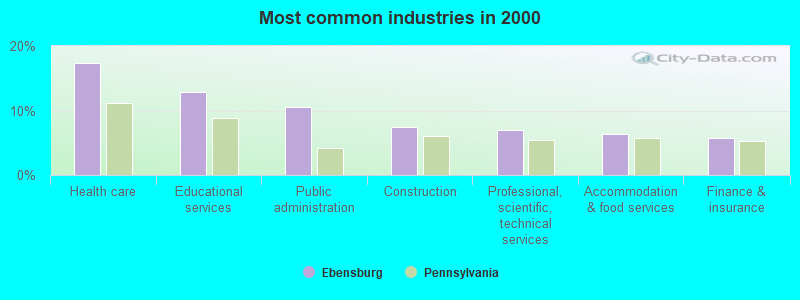
- Health care (17.4%)
- Educational services (12.9%)
- Public administration (10.5%)
- Construction (7.4%)
- Professional, scientific, technical services (6.9%)
- Accommodation & food services (6.3%)
- Finance & insurance (5.7%)
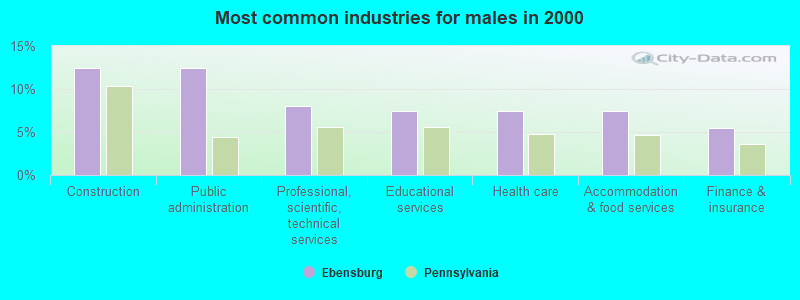
- Construction (12.4%)
- Public administration (12.4%)
- Professional, scientific, technical services (8.1%)
- Educational services (7.4%)
- Health care (7.4%)
- Accommodation & food services (7.4%)
- Finance & insurance (5.5%)
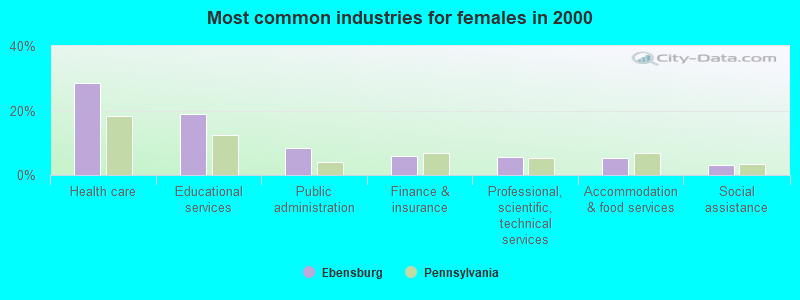
- Health care (28.5%)
- Educational services (18.9%)
- Public administration (8.4%)
- Finance & insurance (5.8%)
- Professional, scientific, technical services (5.7%)
- Accommodation & food services (5.1%)
- Social assistance (3.1%)
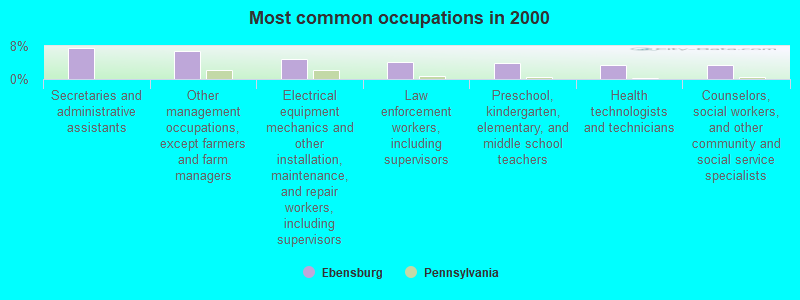
- Secretaries and administrative assistants (7.4%)
- Other management occupations, except farmers and farm managers (6.7%)
- Electrical equipment mechanics and other installation, maintenance, and repair workers, including supervisors (4.9%)
- Law enforcement workers, including supervisors (4.0%)
- Preschool, kindergarten, elementary, and middle school teachers (4.0%)
- Health technologists and technicians (3.4%)
- Counselors, social workers, and other community and social service specialists (3.3%)
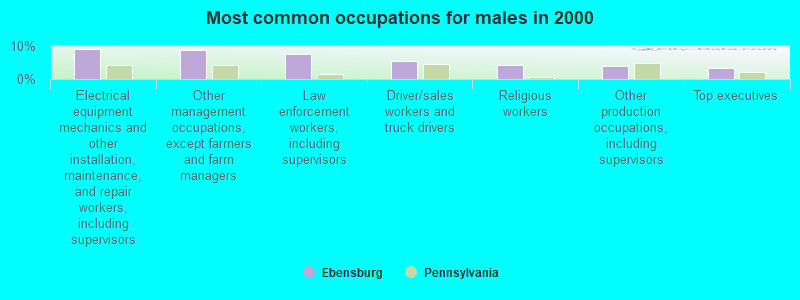
- Electrical equipment mechanics and other installation, maintenance, and repair workers, including supervisors (9.2%)
- Other management occupations, except farmers and farm managers (8.7%)
- Law enforcement workers, including supervisors (7.7%)
- Driver/sales workers and truck drivers (5.4%)
- Religious workers (4.4%)
- Other production occupations, including supervisors (3.8%)
- Top executives (3.2%)
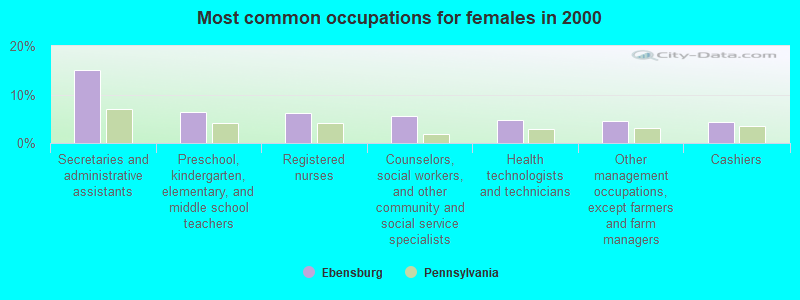
- Secretaries and administrative assistants (15.1%)
- Preschool, kindergarten, elementary, and middle school teachers (6.4%)
- Registered nurses (6.1%)
- Counselors, social workers, and other community and social service specialists (5.6%)
- Health technologists and technicians (4.7%)
- Other management occupations, except farmers and farm managers (4.6%)
- Cashiers (4.4%)
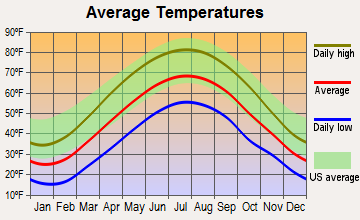
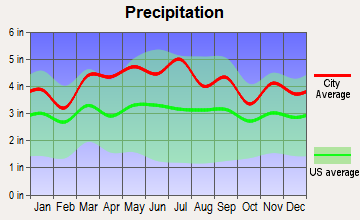
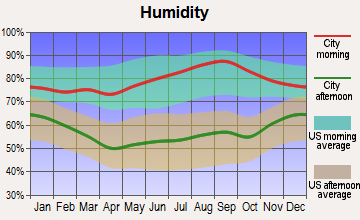
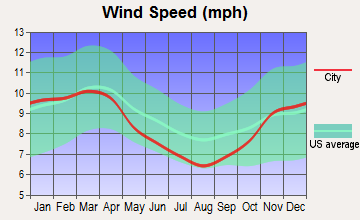
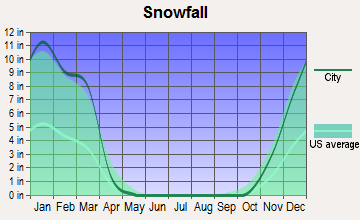
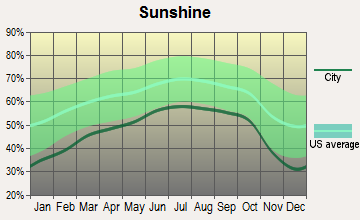
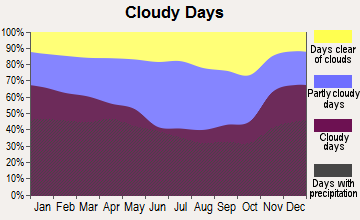
Average climate in Ebensburg, Pennsylvania
Based on data reported by over 4,000 weather stations
|
|

(lower is better)
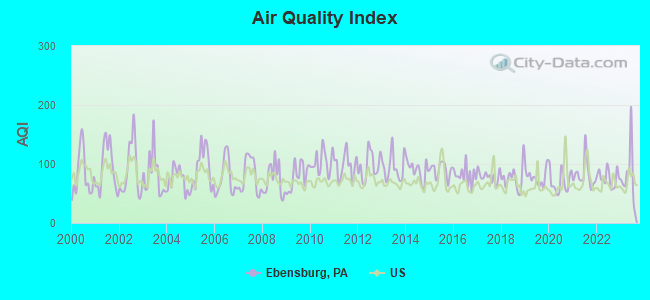
Air Quality Index (AQI) level in 2023 was 79.7. This is about average.
| City: | 79.7 |
| U.S.: | 72.6 |
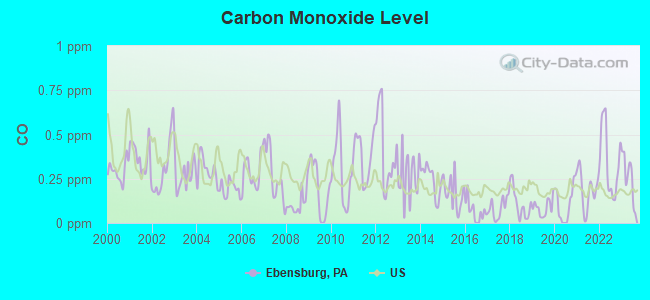
Carbon Monoxide (CO) [ppm] level in 2023 was 0.260. This is about average. Closest monitor was 15.8 miles away from the city center.
| City: | 0.260 |
| U.S.: | 0.251 |
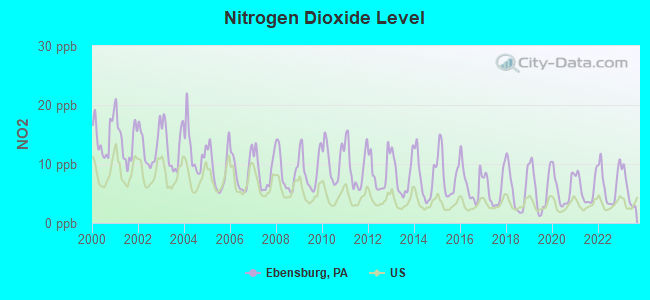
Nitrogen Dioxide (NO2) [ppb] level in 2023 was 5.60. This is about average. Closest monitor was 11.5 miles away from the city center.
| City: | 5.60 |
| U.S.: | 5.11 |
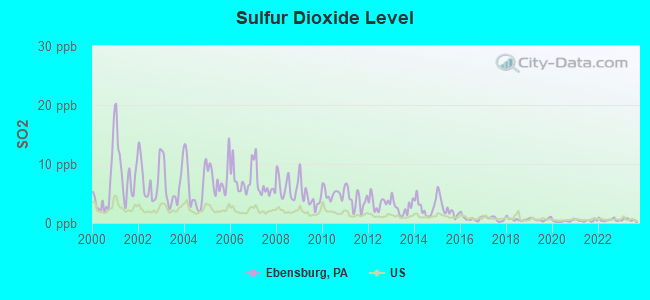
Sulfur Dioxide (SO2) [ppb] level in 2023 was 0.566. This is significantly better than average. Closest monitor was 11.5 miles away from the city center.
| City: | 0.566 |
| U.S.: | 1.515 |
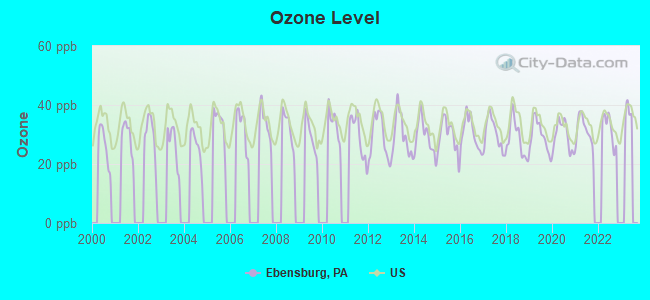
Ozone [ppb] level in 2022 was 32.0. This is about average. Closest monitor was 11.5 miles away from the city center.
| City: | 32.0 |
| U.S.: | 33.3 |
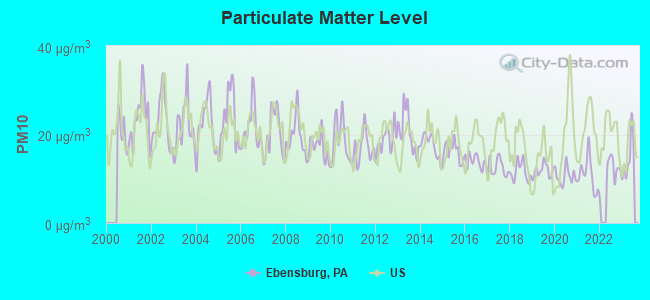
Particulate Matter (PM10) [µg/m3] level in 2023 was 14.7. This is better than average. Closest monitor was 15.0 miles away from the city center.
| City: | 14.7 |
| U.S.: | 19.2 |
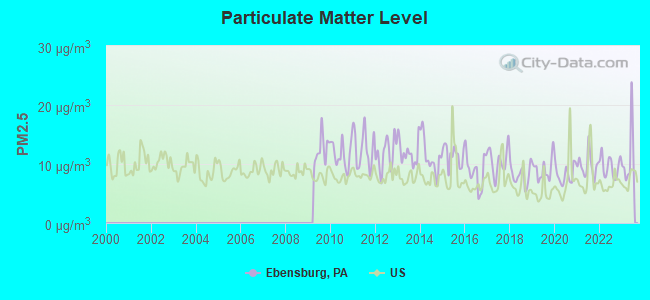
Particulate Matter (PM2.5) [µg/m3] level in 2023 was 11.1. This is worse than average. Closest monitor was 15.8 miles away from the city center.
| City: | 11.1 |
| U.S.: | 8.1 |
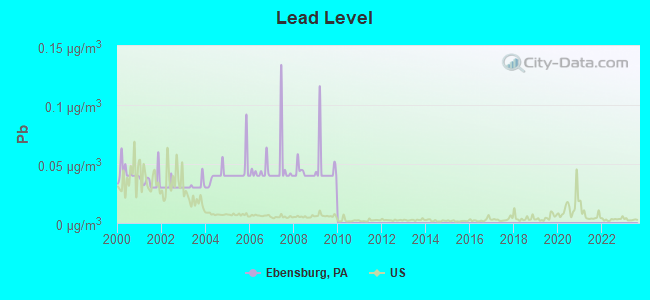
Lead (Pb) [µg/m3] level in 2009 was 0.0476. This is significantly worse than average. Closest monitor was 12.7 miles away from the city center.
| City: | 0.0476 |
| U.S.: | 0.0093 |
Tornado activity:
Ebensburg-area historical tornado activity is slightly below Pennsylvania state average. It is 37% smaller than the overall U.S. average.
On 6/2/1998, a category F4 (max. wind speeds 207-260 mph) tornado 39.9 miles away from the Ebensburg borough center injured 5 people and caused $6 million in damages.
On 6/3/1980, a category F4 tornado 41.2 miles away from the borough center injured 140 people and caused between $50,000,000 and $500,000,000 in damages.
Earthquake activity:
Ebensburg-area historical earthquake activity is significantly above Pennsylvania state average. It is 60% smaller than the overall U.S. average.On 8/23/2011 at 17:51:04, a magnitude 5.8 (5.8 MW, Depth: 3.7 mi, Class: Moderate, Intensity: VI - VII) earthquake occurred 183.2 miles away from Ebensburg center
On 9/25/1998 at 19:52:52, a magnitude 5.2 (4.8 MB, 4.3 MS, 5.2 LG, 4.5 MW, Depth: 3.1 mi) earthquake occurred 111.5 miles away from the city center
On 1/31/1986 at 16:46:43, a magnitude 5.0 (5.0 MB) earthquake occurred 148.6 miles away from Ebensburg center
On 1/16/1994 at 01:49:16, a magnitude 4.6 (4.6 MB, 4.6 LG, Depth: 3.1 mi, Class: Light, Intensity: IV - V) earthquake occurred 142.0 miles away from Ebensburg center
On 10/7/1983 at 10:18:46, a magnitude 5.3 (5.1 MB, 5.3 LG, 5.1 ML) earthquake occurred 328.4 miles away from Ebensburg center
On 8/25/2011 at 05:07:52, a magnitude 4.5 (4.5 ML, Depth: 4.2 mi) earthquake occurred 180.3 miles away from the city center
Magnitude types: regional Lg-wave magnitude (LG), body-wave magnitude (MB), local magnitude (ML), surface-wave magnitude (MS), moment magnitude (MW)
Natural disasters:
The number of natural disasters in Cambria County (14) is near the US average (15).Major Disasters (Presidential) Declared: 9
Emergencies Declared: 5
Causes of natural disasters: Floods: 3, Snowstorms: 3, Winter Storms: 3, Hurricanes: 2, Storms: 2, Tropical Storms: 2, Blizzard: 1, Snowfall: 1, Other: 1 (Note: some incidents may be assigned to more than one category).
Hospitals and medical centers in Ebensburg:
Airports located in Ebensburg:
- Ebensburg Airport (9G8) (Runways: 2, Itinerant Ops: 1,000, Local Ops: 5,000, Military Ops: 1,000)
- Hamilton Hill Airport (PS47) (Runways: 1)
- Strittmatter Airport (PN04) (Runways: 1)
Amtrak stations near Ebensburg:
- 15 miles: JOHNSTOWN (47 WALNUT ST.) . Services: ticket office, fully wheelchair accessible, enclosed waiting area, public restrooms, public payphones, vending machines, free short-term parking, free long-term parking, call for taxi service.
- 18 miles: ALTOONA (1231 11TH AVE.) . Services: ticket office, fully wheelchair accessible, enclosed waiting area, public restrooms, public payphones, snack bar, paid short-term parking, paid long-term parking, call for taxi service, intercity bus service, public transit connection.
College/University in Ebensburg:
Colleges/universities with over 2000 students nearest to Ebensburg:
- Saint Francis University (about 5 miles; Loretto, PA; Full-time enrollment: 2,636)
- University of Pittsburgh-Johnstown (about 17 miles; Johnstown, PA; FT enrollment: 2,815)
- Pennsylvania State University-Penn State Altoona (about 18 miles; Altoona, PA; FT enrollment: 3,656)
- Indiana University of Pennsylvania-Main Campus (about 25 miles; Indiana, PA; FT enrollment: 14,471)
- Wyo Tech-Blairsville (about 27 miles; Blairsville, PA; FT enrollment: 2,602)
- Seton Hill University (about 46 miles; Greensburg, PA; FT enrollment: 2,167)
- Westmoreland County Community College (about 48 miles; Youngwood, PA; FT enrollment: 4,669)
Public high schools in Ebensburg:
- CENTRAL CAMBRIA HS (Students: 639, Location: 204 SCHOOLHOUSE RD, Grades: 9-12)
- ADMIRAL PEARY AVTS (Students: 471, Location: 948 BEN FRANKLIN HIGHWAY, Grades: 9-12)
Private high school in Ebensburg:
Public elementary/middle schools in Ebensburg:
- CAMBRIA EL SCH (Students: 520, Location: 212 SCHOOLHOUSE RD, Grades: KG-5)
- CENTRAL CAMBRIA MS (Students: 433, Location: 206 SCHOOLHOUSE ROAD, Grades: 6-8)
Private elementary/middle school in Ebensburg:
Points of interest:
Notable locations in Ebensburg: Appledale Public Golf Course (A), Dauntless Volunteer Fire Company (B), Pennsylvania Conservation and Natural Resources District 6 Gallitzin (C). Display/hide their locations on the map
Reservoirs: City Reservoir (A), Lake Rowena (B), City Reservoir (C). Display/hide their locations on the map
Park in Ebensburg: Lovell Park (1). Display/hide its location on the map
Tourist attraction: Cambria County Historical Society Museum (615 North Center Street).
Hotels: Comfort Inn (Routes 22 & 219), Comfort Inn Ebensburg (111 Cook Road).
Birthplace of: Bill Hartack - Jockey, Harry Englehart - Politician, Jack Darragh (baseball) - Baseball player.
Drinking water stations with addresses in Ebensburg and their reported violations in the past:
DUMAN LAKE COUNTY PARK (Population served: 700, Groundwater):Past monitoring violations:ROCK RUN RECREATION AREA (Population served: 200, Groundwater):
- 2 regular monitoring violations
Past monitoring violations:LEMON DROP LOUNGE (Population served: 25, Groundwater):
- 2 routine major monitoring violations
Past monitoring violations:
- One routine major monitoring violation
- One regular monitoring violation
Drinking water stations with addresses in Ebensburg that have no violations reported:
- KEYSTONE RESTAURANT (Population served: 250, Primary Water Source Type: Groundwater)
| This borough: | 2.1 people |
| Pennsylvania: | 2.5 people |
| This borough: | 53.7% |
| Whole state: | 65.0% |
| This borough: | 6.1% |
| Whole state: | 6.6% |
Likely homosexual households (counted as self-reported same-sex unmarried-partner households)
- Lesbian couples: 0.2% of all households
- Gay men: 0.1% of all households
5 people in other noninstitutional facilities in 2010
People in group quarters in Ebensburg in 2000:
- 47 people in other noninstitutional group quarters
- 8 people in homes for the mentally retarded
- 7 people in religious group quarters
Banks with branches in Ebensburg (2011 data):
- First National Bank of Pennsylvania: Ebensburg Branch at 111 West High Street, branch established on 1897/08/25; Route 22 West Branch at 274 Jamesway Road, branch established on 1971/11/01. Info updated 2012/01/10: Bank assets: $9,581.0 mil, Deposits: $7,462.2 mil, headquarters in Greenville, PA, positive income, Commercial Lending Specialization, 291 total offices, Holding Company: F.N.b. Corporation
- Ameriserv Financial Bank: Lovell Park Branch at Sthy 160, branch established on 1974/10/28. Info updated 2010/05/21: Bank assets: $952.1 mil, Deposits: $816.6 mil, headquarters in Johnstown, PA, positive income, Commercial Lending Specialization, 18 total offices, Holding Company: Ameriserv Financial, Inc
- Northwest Savings Bank: Ebensburgh Branch at 176 Lovell Avenue, branch established on 2001/11/19. Info updated 2009/11/23: Bank assets: $7,975.9 mil, Deposits: $5,985.6 mil, headquarters in Warren, PA, positive income, Mortgage Lending Specialization, 172 total offices
- S&T Bank: Ebensburg Branch at 3135 New Germany Rd, branch established on 1986/06/16. Info updated 2012/03/14: Bank assets: $4,099.9 mil, Deposits: $3,349.5 mil, headquarters in Indiana, PA, positive income, Commercial Lending Specialization, 60 total offices, Holding Company: S & T Bancorp, Inc.
- First Commonwealth Bank: Ebensburg Branch at 708 West High Street, branch established on 1986/11/03. Info updated 2010/11/23: Bank assets: $5,779.0 mil, Deposits: $4,511.6 mil, headquarters in Indiana, PA, positive income, Commercial Lending Specialization, 112 total offices, Holding Company: First Commonwealth Financial Corporation
- Woodforest National Bank: Ebensburg Walmart Branch at 300 Walmart Drive, branch established on 2007/06/16. Info updated 2011/05/10: Bank assets: $3,488.9 mil, Deposits: $3,097.6 mil, headquarters in Houston, TX, positive income, Commercial Lending Specialization, 766 total offices, Holding Company: Woodforest Financial Group Employee Stock Ownership Plan (With 401(K) Provisions)
For population 15 years and over in Ebensburg:
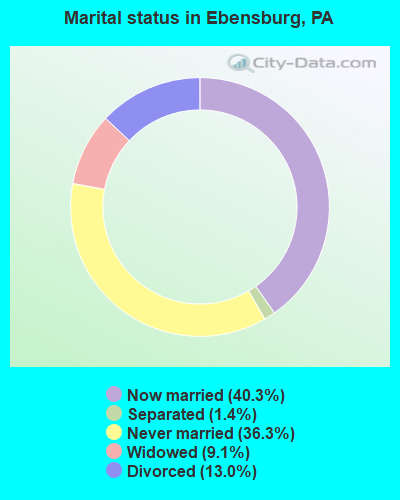
- Never married: 36.3%
- Now married: 40.3%
- Separated: 1.4%
- Widowed: 9.1%
- Divorced: 13.0%
For population 25 years and over in Ebensburg:
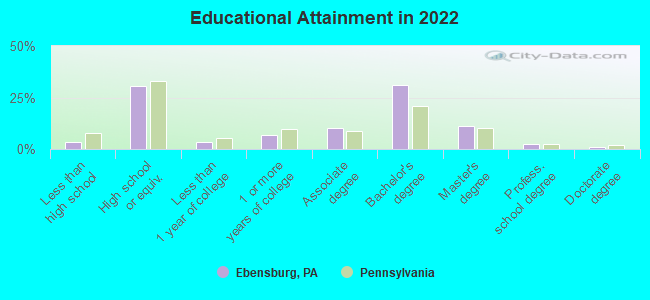
- High school or higher: 95.6%
- Bachelor's degree or higher: 44.8%
- Graduate or professional degree: 16.0%
- Unemployed: 4.3%
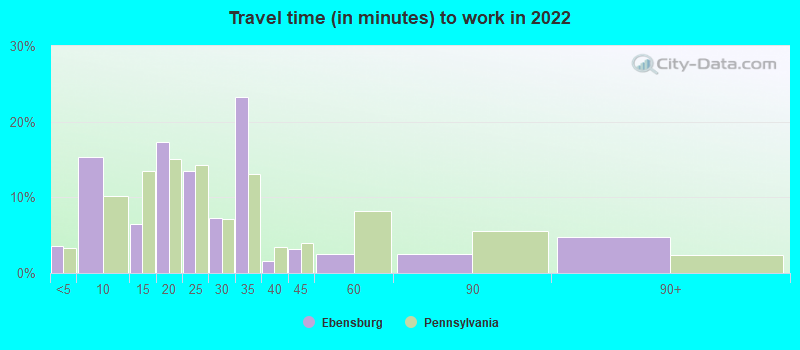
- Mean travel time to work (commute): 21.0 minutes
| Here: | 9.2 |
| Pennsylvania average: | 11.4 |
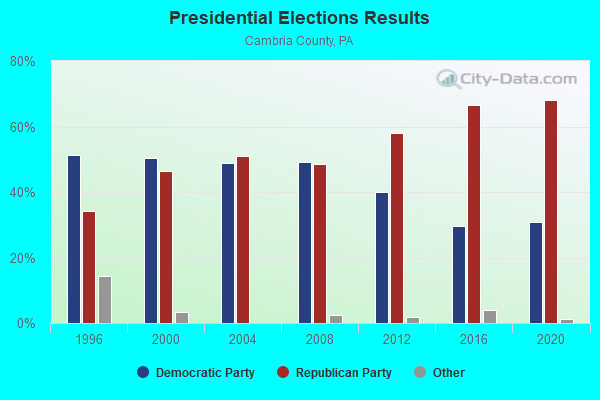
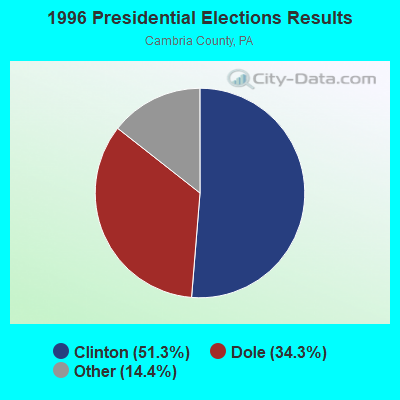
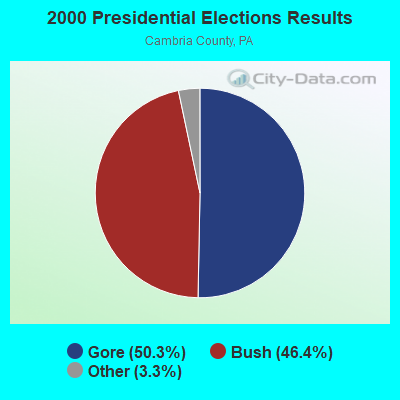
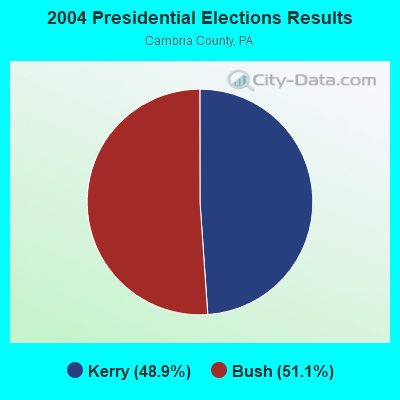

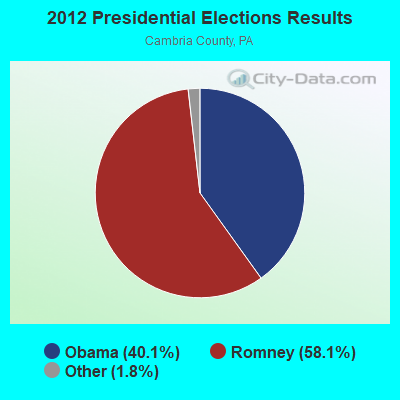
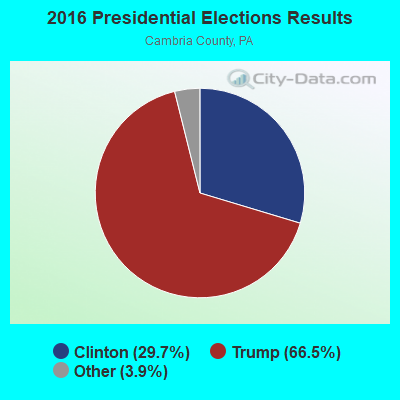
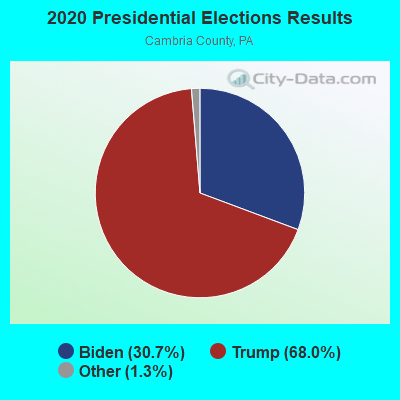
Graphs represent county-level data. Detailed 2008 Election Results
Religion statistics for Ebensburg, PA (based on Cambria County data)
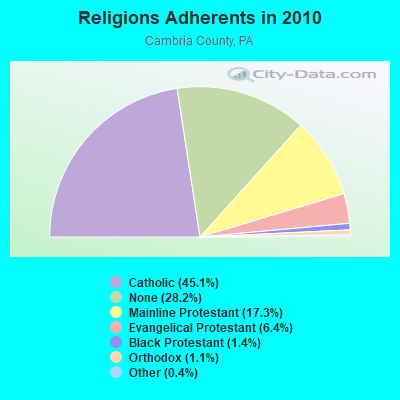
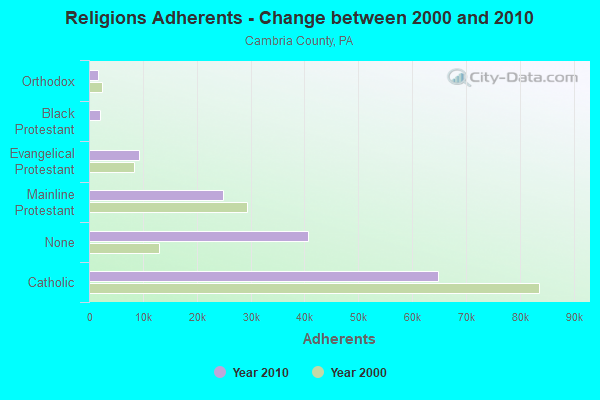
| Religion | Adherents | Congregations |
|---|---|---|
| Catholic | 64,831 | 56 |
| Mainline Protestant | 24,819 | 101 |
| Evangelical Protestant | 9,208 | 67 |
| Black Protestant | 2,066 | 6 |
| Orthodox | 1,581 | 12 |
| Other | 609 | 5 |
| None | 40,565 | - |
Food Environment Statistics:
| Cambria County: | 2.14 / 10,000 pop. |
| Pennsylvania: | 2.04 / 10,000 pop. |
| This county: | 0.07 / 10,000 pop. |
| State: | 0.09 / 10,000 pop. |
| Here: | 0.83 / 10,000 pop. |
| State: | 0.88 / 10,000 pop. |
| Cambria County: | 2.62 / 10,000 pop. |
| Pennsylvania: | 2.52 / 10,000 pop. |
| Cambria County: | 5.66 / 10,000 pop. |
| Pennsylvania: | 7.12 / 10,000 pop. |
| Cambria County: | 10.9% |
| Pennsylvania: | 9.1% |
| Cambria County: | 31.3% |
| State: | 27.2% |
| Here: | 8.7% |
| State: | 11.5% |
Health and Nutrition:
| This city: | 49.9% |
| State: | 50.2% |
| This city: | 43.6% |
| Pennsylvania: | 47.1% |
| Ebensburg: | 28.8 |
| Pennsylvania: | 28.7 |
| Ebensburg: | 18.1% |
| State: | 20.8% |
| Ebensburg: | 8.0% |
| State: | 10.9% |
| Ebensburg: | 6.9 |
| State: | 6.8 |
| This city: | 27.5% |
| Pennsylvania: | 34.3% |
| Ebensburg: | 57.5% |
| Pennsylvania: | 56.2% |
| Here: | 73.8% |
| Pennsylvania: | 78.3% |
More about Health and Nutrition of Ebensburg, PA Residents
| Local government employment and payroll (March 2022) | |||||
| Function | Full-time employees | Monthly full-time payroll | Average yearly full-time wage | Part-time employees | Monthly part-time payroll |
|---|---|---|---|---|---|
| Police Protection - Officers | 5 | $30,561 | $73,346 | 2 | $1,393 |
| Sewerage | 4 | $6,400 | $19,200 | 1 | $687 |
| Water Supply | 4 | $6,400 | $19,200 | 1 | $687 |
| Streets and Highways | 4 | $5,484 | $16,452 | 1 | $687 |
| Other Government Administration | 3 | $11,968 | $47,872 | 6 | $650 |
| Parks and Recreation | 2 | $9,311 | $55,866 | 17 | $4,352 |
| Housing and Community Development (Local) | 1 | $3,983 | $47,796 | 0 | $0 |
| Financial Administration | 1 | $3,446 | $41,352 | 0 | $0 |
| Other and Unallocable | 0 | $0 | 1 | $256 | |
| Police - Other | 0 | $0 | 1 | $1,669 | |
| Totals for Government | 24 | $77,555 | $38,778 | 30 | $10,381 |
Ebensburg government finances - Expenditure in 2017 (per resident):
- Current Operations - Water Utilities: $1,545,000 ($460.78)
Sewerage: $1,432,000 ($427.08)
Parks and Recreation: $562,000 ($167.61)
Police Protection: $502,000 ($149.72)
Regular Highways: $214,000 ($63.82)
Solid Waste Management: $146,000 ($43.54)
Housing and Community Development: $106,000 ($31.61)
Central Staff Services: $99,000 ($29.53)
General - Other: $91,000 ($27.14)
Local Fire Protection: $62,000 ($18.49)
Miscellaneous Commercial Activities - Other: $58,000 ($17.30)
Libraries: $5,000 ($1.49)
Protective Inspection and Regulation - Other: $3,000 ($0.89)
- General - Interest on Debt: $35,000 ($10.44)
Ebensburg government finances - Revenue in 2017 (per resident):
- Charges - Sewerage: $1,804,000 ($538.03)
Parks and Recreation: $580,000 ($172.98)
Other: $446,000 ($133.02)
Solid Waste Management: $229,000 ($68.30)
Parking Facilities: $50,000 ($14.91)
- Local Intergovernmental - Other: $8,000 ($2.39)
- Miscellaneous - Fines and Forfeits: $39,000 ($11.63)
Interest Earnings: $15,000 ($4.47)
- Revenue - Water Utilities: $1,528,000 ($455.71)
- State Intergovernmental - Other: $233,000 ($69.49)
- Tax - Property: $450,000 ($134.21)
Individual Income: $339,000 ($101.10)
Occupation and Business License - Other: $84,000 ($25.05)
Public Utility License: $59,000 ($17.60)
Documentary and Stock Transfer: $35,000 ($10.44)
Ebensburg government finances - Debt in 2017 (per resident):
- Long Term Debt - Retired Unspecified Public Purpose: $883,000 ($263.35)
Beginning Outstanding - Unspecified Public Purpose: $880,000 ($262.45)
Issue, Unspecified Public Purpose: $88,000 ($26.25)
Outstanding Unspecified Public Purpose: $84,000 ($25.05)
Ebensburg government finances - Cash and Securities in 2017 (per resident):
- Other Funds - Cash and Securities: $2,852,000 ($850.58)
| Businesses in Ebensburg, PA | ||||
| Name | Count | Name | Count | |
|---|---|---|---|---|
| Ace Hardware | 1 | KFC | 1 | |
| Advance Auto Parts | 1 | MasterBrand Cabinets | 1 | |
| Burger King | 1 | McDonald's | 1 | |
| Chevrolet | 1 | Pizza Hut | 1 | |
| Comfort Inn | 1 | RadioShack | 1 | |
| Curves | 1 | Rite Aid | 1 | |
| Dairy Queen | 1 | Sears | 1 | |
| Fashion Bug | 1 | Subway | 2 | |
| FedEx | 2 | U-Haul | 1 | |
| Ford | 1 | UPS | 2 | |
| GNC | 1 | Walmart | 1 | |
| H&R Block | 1 | Wendy's | 1 | |
Strongest AM radio stations in Ebensburg:
- WRDD (1580 AM; 1 kW; EBENSBURG, PA)
- WLYE (850 AM; 10 kW; JOHNSTOWN, PA; Owner: FOREVER OF JOHNSTOWN, INC.)
- WCCS (1160 AM; 10 kW; HOMER CITY, PA; Owner: RENDA RADIO, INC.)
- WFBG (1290 AM; 5 kW; ALTOONA, PA; Owner: FOREVER OF PA, LLC)
- WVAM (1430 AM; 5 kW; ALTOONA, PA; Owner: VITAL LICENSES, LLC)
- KDKA (1020 AM; 50 kW; PITTSBURGH, PA; Owner: INFINITY BROADCASTING OPERATIONS, INC.)
- WKMC (1370 AM; 5 kW; ROARING SPRING, PA; Owner: ALLEGHENY MOUNTAIN NETWORK)
- WVSC (990 AM; 10 kW; SOMERSET, PA; Owner: FOREVER OF JOHNSTOWN, INC.)
- WZSK (1040 AM; daytime; 10 kW; EVERETT, PA; Owner: NEW MILLENNIUM COMMUNICATIONS GROUP, INC.)
- WCBM (680 AM; 50 kW; BALTIMORE, MD; Owner: WCBM MARYLAND, INC.)
- WCRO (1230 AM; 1 kW; JOHNSTOWN, PA; Owner: GREATER JOHNSTOWN SCHOOL DISTRICT)
- WWVA (1170 AM; 53 kW; WHEELING, WV; Owner: CAPSTAR TX LIMITED PARTNERSHIP)
- WNTJ (1490 AM; 1 kW; JOHNSTOWN, PA; Owner: CLEAR CHANNEL BROADCASTING LICENSES, INC.)
Strongest FM radio stations in Ebensburg:
- WGLU (99.1 FM; EBENSBURG, PA; Owner: DAME BROADCASTING, LLC)
- WBXQ (94.7 FM; CRESSON, PA; Owner: SOUNDS GOOD, INC.)
- WHPA (93.5 FM; BARNESBORO, PA; Owner: VERNAL ENTERPRISES INC.)
- WQEJ (89.7 FM; JOHNSTOWN, PA; Owner: WQED MULTIMEDIA)
- WMAJ-FM (104.9 FM; HOLLIDAYSBURG, PA; Owner: FOREVER OF PA, LLC)
- WKYE (95.5 FM; JOHNSTOWN, PA; Owner: FOREVER OF JOHNSTOWN, INC.)
- WFRJ (88.9 FM; JOHNSTOWN, PA; Owner: FAMILY STATIONS, INC.)
- WPRR (100.1 FM; ALTOONA, PA; Owner: VITAL LICENSES, LLC)
- WQKK (92.1 FM; JOHNSTOWN, PA; Owner: DAME BROADCASTING, LLC)
- W294AE (106.7 FM; ALTOONA, PA; Owner: THE PENNSYLVANIA STATE UNIVERSITY)
- WFGY (98.1 FM; ALTOONA, PA; Owner: FOREVER OF PA, LLC)
- WKYE-FM1 (95.5 FM; JOHNSTOWN, PA; Owner: WINSTON RADIO CORPORATION)
- WPCL (97.3 FM; NORTHERN CAMBRIA, PA; Owner: HE'S ALIVE INCORPORATED)
- WALY (103.9 FM; BELLWOOD, PA; Owner: FOREVER OF JOHNSTOWN, INC.)
- W267AC (101.3 FM; ALTOONA, PA; Owner: ALLEGHENY MOUNTAIN NETWORK)
- WBRX-FM1 (94.7 FM; ALTOONA, PA; Owner: SHERLOCK BROADCASTING, INC)
- WBRX (94.3 FM; PATTON, PA; Owner: SHERLOCK BROADCASTING, INC)
- WUZI (105.7 FM; PORTAGE, PA; Owner: FOREVER BROADCASTING, LLC)
- WMTZ (96.5 FM; JOHNSTOWN, PA; Owner: CLEAR CHANNEL BROADCASTING LICENSES, INC.)
- WAYC (100.9 FM; BEDFORD, PA; Owner: CESSNA COMMUNICATIONS, INC.)
TV broadcast stations around Ebensburg:
- WJAC-TV (Channel 6; JOHNSTOWN, PA; Owner: WPXI-TV HOLDINGS, INC.)
- WLLS-LP (Channel 49; INDIANA, PA; Owner: LARRY L. SCHRECONGOST)
- W41CF (Channel 41; ALTOONA, PA; Owner: TRINITY BROADCASTING NETWORK)
- WATM-TV (Channel 23; ALTOONA, PA; Owner: PALM TELEVISION, L.P.)
- WTAJ-TV (Channel 10; ALTOONA, PA; Owner: TELEVISION STATION GROUP LICENSE SUBSIDIARY, LLC)
- W32AX (Channel 32; ALTOONA, PA; Owner: BENJAMIN PEREZ)
- W57AH (Channel 57; BROCKPORT, PA; Owner: PALM TELEVISION, L.P.)
- WKBS-TV (Channel 47; ALTOONA, PA; Owner: CORNERSTONE TELEVISION, INC.)
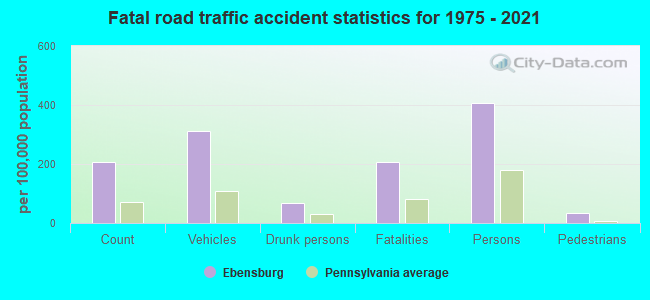
Ebensburg fatal accident list:
Feb 1, 2006 08:52 PM, Sr-4031, Lat: 40.481540, Lon: -78.735640, Vehicles: 1, Persons: 2, Pedestrians: 1, Fatalities: 1
May 5, 2006 11:45 PM, Sr-160, Lat: 40.478350, Lon: -78.735760, Vehicles: 1, Persons: 2, Fatalities: 1, Drunk persons involved: 1
Feb 12, 2000 10:52 PM, Park St, Vehicles: 1, Persons: 1, Fatalities: 1, Drunk persons involved: 1
Apr 13, 1995 07:24 PM, 4031, Vehicles: 2, Persons: 2, Fatalities: 1
Feb 2, 1985 01:42 AM, 00053, Vehicles: 2, Persons: 2, Fatalities: 1
Aug 16, 1980 01:00 PM, Vehicles: 2, Persons: 3, Fatalities: 1
- National Bridge Inventory (NBI) Statistics
- 21Number of bridges
- 112ft / 34.3mTotal length
- $4,840,000Total costs
- 123,206Total average daily traffic
- 19,769Total average daily truck traffic
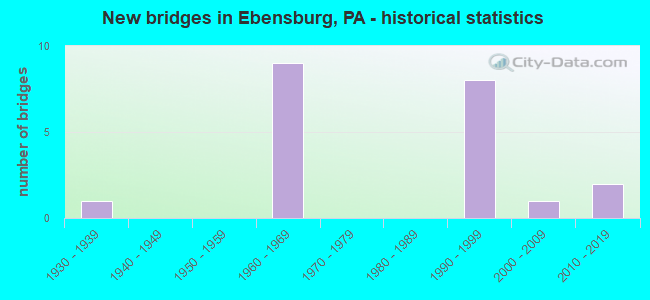
- New bridges - historical statistics
- 11930-1939
- 91960-1969
- 81990-1999
- 12000-2009
- 22010-2019
FCC Registered Antenna Towers: 92 (See the full list of FCC Registered Antenna Towers)
FCC Registered Commercial Land Mobile Towers: 1 (See the full list of FCC Registered Commercial Land Mobile Towers in Ebensburg, PA)
FCC Registered Private Land Mobile Towers: 3 (See the full list of FCC Registered Private Land Mobile Towers)
FCC Registered Broadcast Land Mobile Towers: 30 (See the full list of FCC Registered Broadcast Land Mobile Towers)
FCC Registered Microwave Towers: 20 (See the full list of FCC Registered Microwave Towers in this town)
FCC Registered Paging Towers: 1 (See the full list of FCC Registered Paging Towers)
FCC Registered Maritime Coast & Aviation Ground Towers: 1 (See the full list of FCC Registered Maritime Coast & Aviation Ground Towers)
FCC Registered Amateur Radio Licenses: 25 (See the full list of FCC Registered Amateur Radio Licenses in Ebensburg)
FAA Registered Aircraft: 11 (See the full list of FAA Registered Aircraft in Ebensburg)
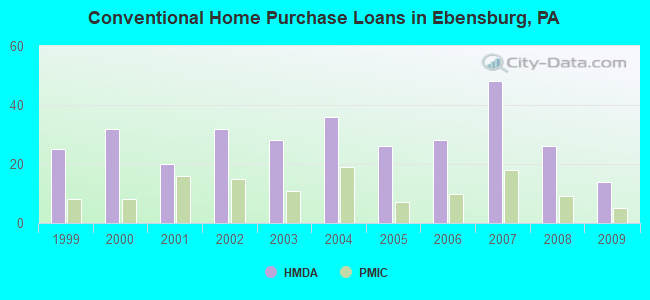
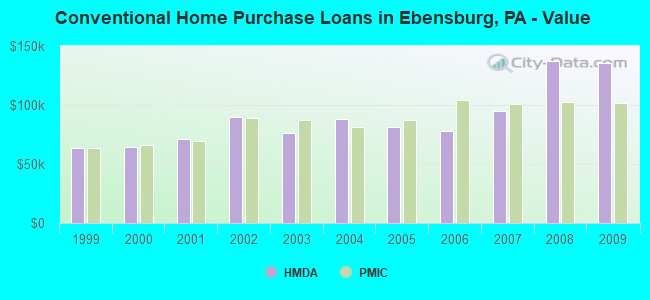
| Home Mortgage Disclosure Act Aggregated Statistics For Year 2009 (Based on 1 full tract) | ||||||||||||||
| A) FHA, FSA/RHS & VA Home Purchase Loans | B) Conventional Home Purchase Loans | C) Refinancings | D) Home Improvement Loans | E) Loans on Dwellings For 5+ Families | F) Non-occupant Loans on < 5 Family Dwellings (A B C & D) | G) Loans On Manufactured Home Dwelling (A B C & D) | ||||||||
|---|---|---|---|---|---|---|---|---|---|---|---|---|---|---|
| Number | Average Value | Number | Average Value | Number | Average Value | Number | Average Value | Number | Average Value | Number | Average Value | Number | Average Value | |
| LOANS ORIGINATED | 11 | $93,727 | 14 | $135,214 | 43 | $111,767 | 24 | $56,583 | 2 | $1,495,500 | 3 | $323,667 | 2 | $54,000 |
| APPLICATIONS APPROVED, NOT ACCEPTED | 0 | $0 | 0 | $0 | 5 | $98,400 | 1 | $10,000 | 0 | $0 | 1 | $97,000 | 0 | $0 |
| APPLICATIONS DENIED | 2 | $91,500 | 2 | $78,000 | 14 | $118,857 | 4 | $31,500 | 0 | $0 | 4 | $61,250 | 0 | $0 |
| APPLICATIONS WITHDRAWN | 0 | $0 | 3 | $47,333 | 8 | $118,125 | 4 | $117,500 | 0 | $0 | 0 | $0 | 0 | $0 |
| FILES CLOSED FOR INCOMPLETENESS | 0 | $0 | 0 | $0 | 2 | $104,500 | 0 | $0 | 0 | $0 | 0 | $0 | 0 | $0 |
Detailed HMDA statistics for the following Tracts: 0126.00
| Private Mortgage Insurance Companies Aggregated Statistics For Year 2009 (Based on 1 full tract) | ||||
| A) Conventional Home Purchase Loans | B) Refinancings | |||
|---|---|---|---|---|
| Number | Average Value | Number | Average Value | |
| LOANS ORIGINATED | 5 | $102,000 | 3 | $99,000 |
| APPLICATIONS APPROVED, NOT ACCEPTED | 1 | $176,000 | 0 | $0 |
| APPLICATIONS DENIED | 0 | $0 | 1 | $133,000 |
| APPLICATIONS WITHDRAWN | 1 | $68,000 | 0 | $0 |
| FILES CLOSED FOR INCOMPLETENESS | 0 | $0 | 0 | $0 |
Detailed PMIC statistics for the following Tracts: 0126.00
2003 - 2018 National Fire Incident Reporting System (NFIRS) incidents
- Fire incident types reported to NFIRS in Ebensburg, PA
- 10758.5%Structure Fires
- 4021.9%Outside Fires
- 2513.7%Mobile Property/Vehicle Fires
- 116.0%Other
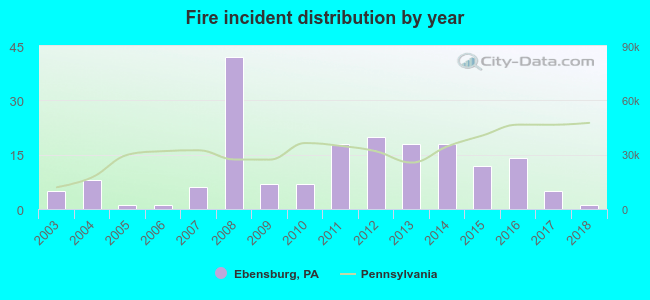 Based on the data from the years 2003 - 2018 the average number of fires per year is 11. The highest number of reported fire incidents - 42 took place in 2008, and the least - 1 in 2005. The data has a declining trend.
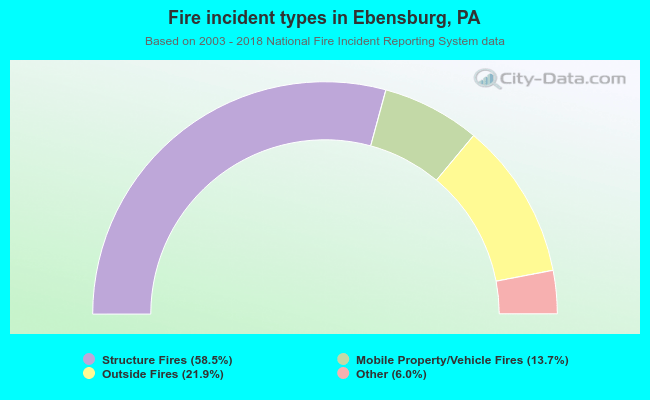 When looking into fire subcategories, the most reports belonged to: Structure Fires (58.5%), and Outside Fires (21.9%).
Fire-safe hotels and motels in Ebensburg, Pennsylvania:
- Howard Johnson Lodge, 4848 Admiral Perry Hwy, Ebensburg, Pennsylvania 15931 , Phone: (814) 472-7201, Fax: (814) 472-8992
- Comfort Inn, Ebensburg, Pa, 111 Cook Rd, Ebensburg, Pennsylvania 15931 , Phone: (814) 472-6100, Fax: (814) 472-4960
| Most common first names in Ebensburg, PA among deceased individuals | ||
| Name | Count | Lived (average) |
|---|---|---|
| Mary | 353 | 84.5 years |
| John | 218 | 78.7 years |
| Margaret | 148 | 83.2 years |
| Anna | 140 | 84.8 years |
| Joseph | 132 | 77.2 years |
| William | 126 | 77.0 years |
| James | 110 | 74.8 years |
| Helen | 103 | 82.3 years |
| Elizabeth | 92 | 84.2 years |
| Charles | 85 | 78.8 years |
| Most common last names in Ebensburg, PA among deceased individuals | ||
| Last name | Count | Lived (average) |
|---|---|---|
| Miller | 75 | 79.5 years |
| Smith | 50 | 80.4 years |
| Jones | 49 | 78.3 years |
| Evans | 38 | 80.2 years |
| Davis | 34 | 79.0 years |
| Williams | 32 | 75.7 years |
| Farabaugh | 28 | 76.2 years |
| Brown | 28 | 79.9 years |
| Griffith | 27 | 77.1 years |
| Thomas | 26 | 83.2 years |
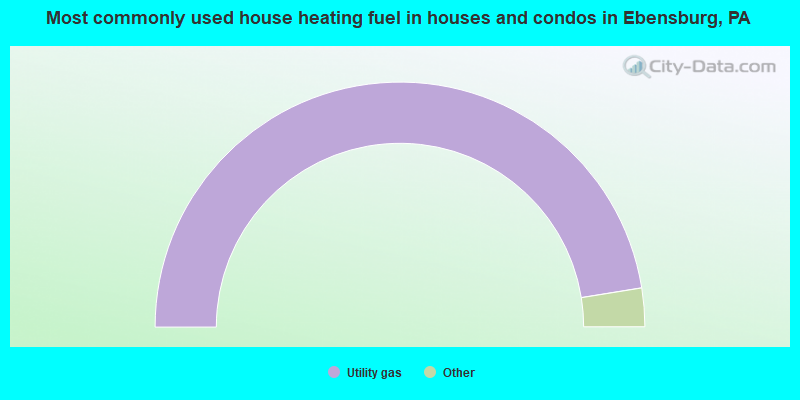
- 95.0%Utility gas
- 3.5%Electricity
- 1.5%Fuel oil, kerosene, etc.
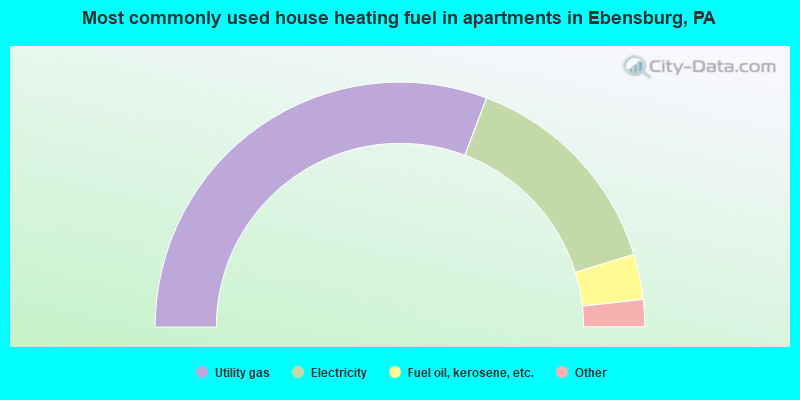
- 61.7%Utility gas
- 29.0%Electricity
- 6.0%Fuel oil, kerosene, etc.
- 2.3%No fuel used
- 1.1%Bottled, tank, or LP gas
Ebensburg compared to Pennsylvania state average:
- Unemployed percentage significantly below state average.
- Black race population percentage significantly below state average.
- Hispanic race population percentage significantly below state average.
- Foreign-born population percentage significantly below state average.
- Renting percentage above state average.
- Length of stay since moving in below state average.
- Percentage of population with a bachelor's degree or higher above state average.

|
|
Total of 21 patent applications in 2008-2024.