El Paso de Robles (Paso Robles), California Submit your own pictures of this city and show them to the world
OSM Map
General Map
Google Map
MSN Map
OSM Map
General Map
Google Map
MSN Map
OSM Map
General Map
Google Map
MSN Map
OSM Map
General Map
Google Map
MSN Map
Please wait while loading the map...
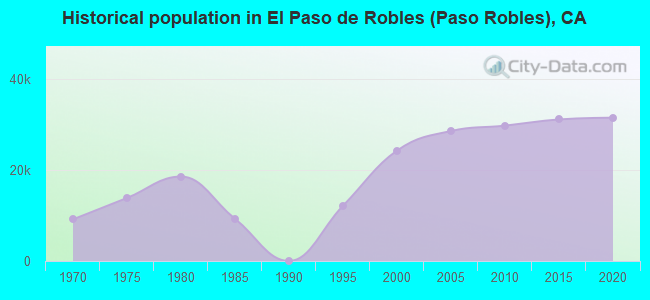
Population in 2022: 31,544 (97% urban, 3% rural). Population change since 2000: +29.8%Males: 15,405 Females: 16,139
March 2022 cost of living index in El Paso de Robles (Paso Robles): 107.0 (more than average, U.S. average is 100) Percentage of residents living in poverty in 2022: 11.0%for White Non-Hispanic residents , 0.7% for Black residents , 13.0% for Hispanic or Latino residents , 10.8% for American Indian residents , 16.8% for other race residents , 19.0% for two or more races residents )Business Search - 14 Million verified businesses
Data:
Median household income ($)
Median household income (% change since 2000)
Household income diversity
Ratio of average income to average house value (%)
Ratio of average income to average rent
Median household income ($) - White
Median household income ($) - Black or African American
Median household income ($) - Asian
Median household income ($) - Hispanic or Latino
Median household income ($) - American Indian and Alaska Native
Median household income ($) - Multirace
Median household income ($) - Other Race
Median household income for houses/condos with a mortgage ($)
Median household income for apartments without a mortgage ($)
Races - White alone (%)
Races - White alone (% change since 2000)
Races - Black alone (%)
Races - Black alone (% change since 2000)
Races - American Indian alone (%)
Races - American Indian alone (% change since 2000)
Races - Asian alone (%)
Races - Asian alone (% change since 2000)
Races - Hispanic (%)
Races - Hispanic (% change since 2000)
Races - Native Hawaiian and Other Pacific Islander alone (%)
Races - Native Hawaiian and Other Pacific Islander alone (% change since 2000)
Races - Two or more races (%)
Races - Two or more races (% change since 2000)
Races - Other race alone (%)
Races - Other race alone (% change since 2000)
Racial diversity
Unemployment (%)
Unemployment (% change since 2000)
Unemployment (%) - White
Unemployment (%) - Black or African American
Unemployment (%) - Asian
Unemployment (%) - Hispanic or Latino
Unemployment (%) - American Indian and Alaska Native
Unemployment (%) - Multirace
Unemployment (%) - Other Race
Population density (people per square mile)
Population - Males (%)
Population - Females (%)
Population - Males (%) - White
Population - Males (%) - Black or African American
Population - Males (%) - Asian
Population - Males (%) - Hispanic or Latino
Population - Males (%) - American Indian and Alaska Native
Population - Males (%) - Multirace
Population - Males (%) - Other Race
Population - Females (%) - White
Population - Females (%) - Black or African American
Population - Females (%) - Asian
Population - Females (%) - Hispanic or Latino
Population - Females (%) - American Indian and Alaska Native
Population - Females (%) - Multirace
Population - Females (%) - Other Race
Coronavirus confirmed cases (Apr 28, 2024)
Deaths caused by coronavirus (Apr 28, 2024)
Coronavirus confirmed cases (per 100k population) (Apr 28, 2024)
Deaths caused by coronavirus (per 100k population) (Apr 28, 2024)
Daily increase in number of cases (Apr 28, 2024)
Weekly increase in number of cases (Apr 28, 2024)
Cases doubled (in days) (Apr 28, 2024)
Hospitalized patients (Apr 18, 2022)
Negative test results (Apr 18, 2022)
Total test results (Apr 18, 2022)
COVID Vaccine doses distributed (per 100k population) (Sep 19, 2023)
COVID Vaccine doses administered (per 100k population) (Sep 19, 2023)
COVID Vaccine doses distributed (Sep 19, 2023)
COVID Vaccine doses administered (Sep 19, 2023)
Likely homosexual households (%)
Likely homosexual households (% change since 2000)
Likely homosexual households - Lesbian couples (%)
Likely homosexual households - Lesbian couples (% change since 2000)
Likely homosexual households - Gay men (%)
Likely homosexual households - Gay men (% change since 2000)
Cost of living index
Median gross rent ($)
Median contract rent ($)
Median monthly housing costs ($)
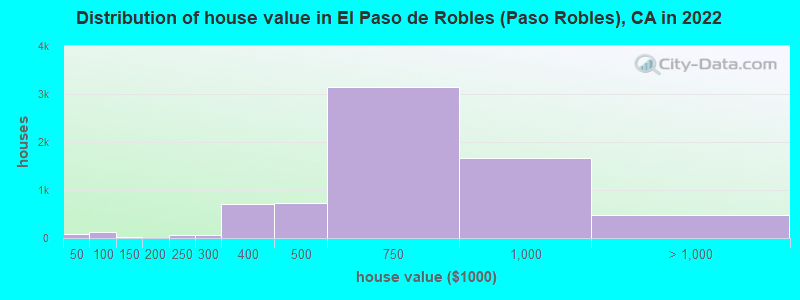
Median house or condo value ($)
Median house or condo value ($ change since 2000)
Mean house or condo value by units in structure - 1, detached ($)
Mean house or condo value by units in structure - 1, attached ($)
Mean house or condo value by units in structure - 2 ($)
Mean house or condo value by units in structure by units in structure - 3 or 4 ($)
Mean house or condo value by units in structure - 5 or more ($)
Mean house or condo value by units in structure - Boat, RV, van, etc. ($)
Mean house or condo value by units in structure - Mobile home ($)
Median house or condo value ($) - White
Median house or condo value ($) - Black or African American
Median house or condo value ($) - Asian
Median house or condo value ($) - Hispanic or Latino
Median house or condo value ($) - American Indian and Alaska Native
Median house or condo value ($) - Multirace
Median house or condo value ($) - Other Race
Median resident age
Resident age diversity
Median resident age - Males
Median resident age - Females
Median resident age - White
Median resident age - Black or African American
Median resident age - Asian
Median resident age - Hispanic or Latino
Median resident age - American Indian and Alaska Native
Median resident age - Multirace
Median resident age - Other Race
Median resident age - Males - White
Median resident age - Males - Black or African American
Median resident age - Males - Asian
Median resident age - Males - Hispanic or Latino
Median resident age - Males - American Indian and Alaska Native
Median resident age - Males - Multirace
Median resident age - Males - Other Race
Median resident age - Females - White
Median resident age - Females - Black or African American
Median resident age - Females - Asian
Median resident age - Females - Hispanic or Latino
Median resident age - Females - American Indian and Alaska Native
Median resident age - Females - Multirace
Median resident age - Females - Other Race
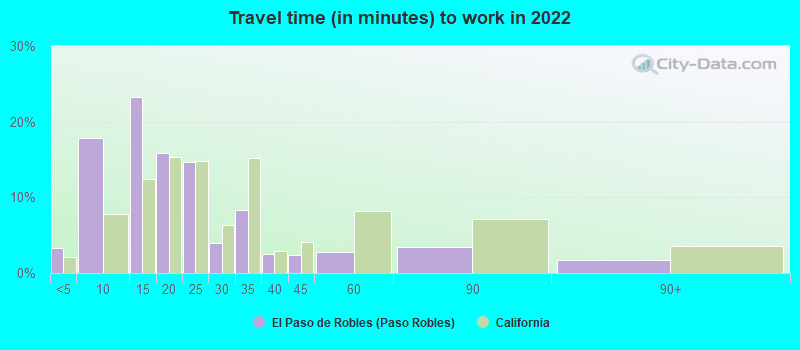
Commute - mean travel time to work (minutes)
Travel time to work - Less than 5 minutes (%)
Travel time to work - Less than 5 minutes (% change since 2000)
Travel time to work - 5 to 9 minutes (%)
Travel time to work - 5 to 9 minutes (% change since 2000)
Travel time to work - 10 to 19 minutes (%)
Travel time to work - 10 to 19 minutes (% change since 2000)
Travel time to work - 20 to 29 minutes (%)
Travel time to work - 20 to 29 minutes (% change since 2000)
Travel time to work - 30 to 39 minutes (%)
Travel time to work - 30 to 39 minutes (% change since 2000)
Travel time to work - 40 to 59 minutes (%)
Travel time to work - 40 to 59 minutes (% change since 2000)
Travel time to work - 60 to 89 minutes (%)
Travel time to work - 60 to 89 minutes (% change since 2000)
Travel time to work - 90 or more minutes (%)
Travel time to work - 90 or more minutes (% change since 2000)
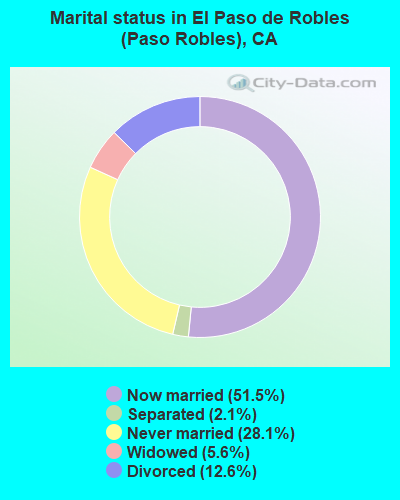
Marital status - Never married (%)
Marital status - Now married (%)
Marital status - Separated (%)
Marital status - Widowed (%)
Marital status - Divorced (%)
Median family income ($)
Median family income (% change since 2000)
Median non-family income ($)
Median non-family income (% change since 2000)
Median per capita income ($)
Median per capita income (% change since 2000)
Median family income ($) - White
Median family income ($) - Black or African American
Median family income ($) - Asian
Median family income ($) - Hispanic or Latino
Median family income ($) - American Indian and Alaska Native
Median family income ($) - Multirace
Median family income ($) - Other Race
Median year house/condo built
Median year apartment built
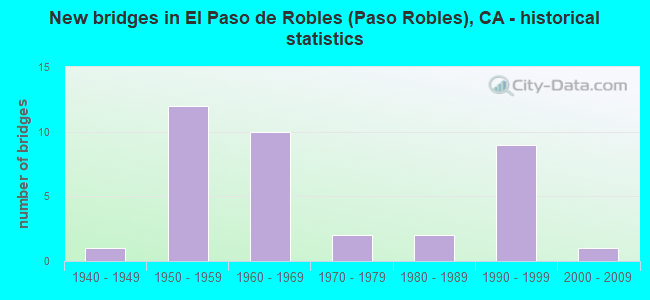
Year house built - Built 2005 or later (%)
Year house built - Built 2000 to 2004 (%)
Year house built - Built 1990 to 1999 (%)
Year house built - Built 1980 to 1989 (%)
Year house built - Built 1970 to 1979 (%)
Year house built - Built 1960 to 1969 (%)
Year house built - Built 1950 to 1959 (%)
Year house built - Built 1940 to 1949 (%)
Year house built - Built 1939 or earlier (%)
Average household size
Household density (households per square mile)
Average household size - White
Average household size - Black or African American
Average household size - Asian
Average household size - Hispanic or Latino
Average household size - American Indian and Alaska Native
Average household size - Multirace
Average household size - Other Race
Occupied housing units (%)
Vacant housing units (%)
Owner occupied housing units (%)
Renter occupied housing units (%)
Vacancy status - For rent (%)
Vacancy status - For sale only (%)
Vacancy status - Rented or sold, not occupied (%)
Vacancy status - For seasonal, recreational, or occasional use (%)
Vacancy status - For migrant workers (%)
Vacancy status - Other vacant (%)
Residents with income below the poverty level (%)
Residents with income below 50% of the poverty level (%)
Children below poverty level (%)
Poor families by family type - Married-couple family (%)
Poor families by family type - Male, no wife present (%)
Poor families by family type - Female, no husband present (%)
Poverty status for native-born residents (%)
Poverty status for foreign-born residents (%)
Poverty among high school graduates not in families (%)
Poverty among people who did not graduate high school not in families (%)
Residents with income below the poverty level (%) - White
Residents with income below the poverty level (%) - Black or African American
Residents with income below the poverty level (%) - Asian
Residents with income below the poverty level (%) - Hispanic or Latino
Residents with income below the poverty level (%) - American Indian and Alaska Native
Residents with income below the poverty level (%) - Multirace
Residents with income below the poverty level (%) - Other Race
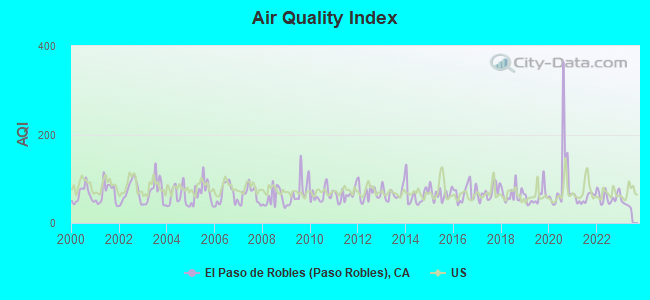
Air pollution - Air Quality Index (AQI)
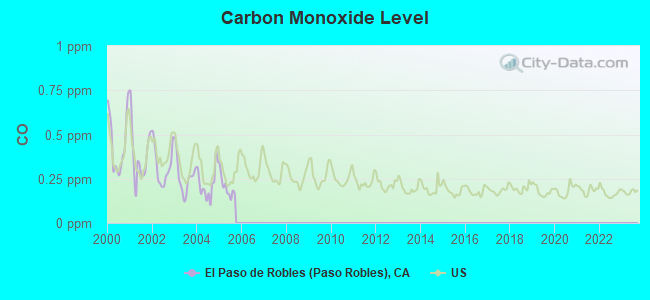
Air pollution - CO
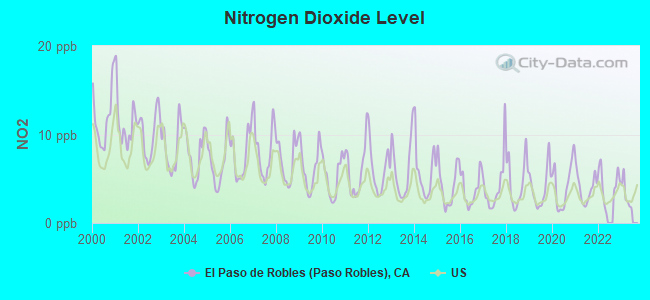
Air pollution - NO2
Air pollution - SO2
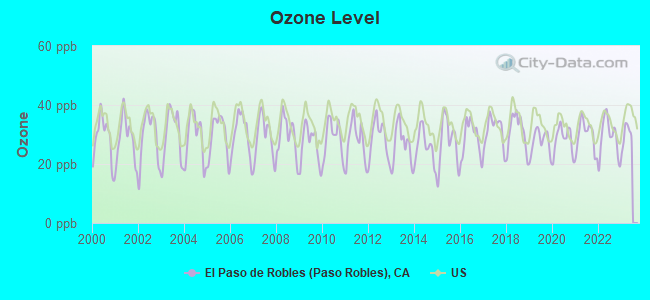
Air pollution - Ozone
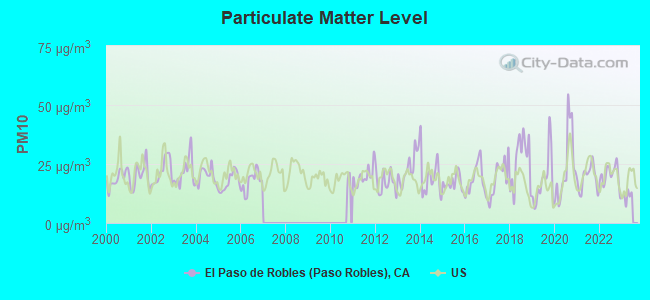
Air pollution - PM10
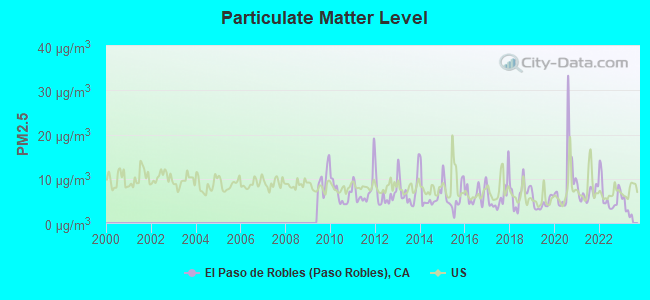
Air pollution - PM25
Air pollution - Pb
Crime - Murders per 100,000 population
Crime - Rapes per 100,000 population
Crime - Robberies per 100,000 population
Crime - Assaults per 100,000 population
Crime - Burglaries per 100,000 population
Crime - Thefts per 100,000 population
Crime - Auto thefts per 100,000 population
Crime - Arson per 100,000 population
Crime - City-data.com crime index
Crime - Violent crime index
Crime - Property crime index
Crime - Murders per 100,000 population (5 year average)
Crime - Rapes per 100,000 population (5 year average)
Crime - Robberies per 100,000 population (5 year average)
Crime - Assaults per 100,000 population (5 year average)
Crime - Burglaries per 100,000 population (5 year average)
Crime - Thefts per 100,000 population (5 year average)
Crime - Auto thefts per 100,000 population (5 year average)
Crime - Arson per 100,000 population (5 year average)
Crime - City-data.com crime index (5 year average)
Crime - Violent crime index (5 year average)
Crime - Property crime index (5 year average)
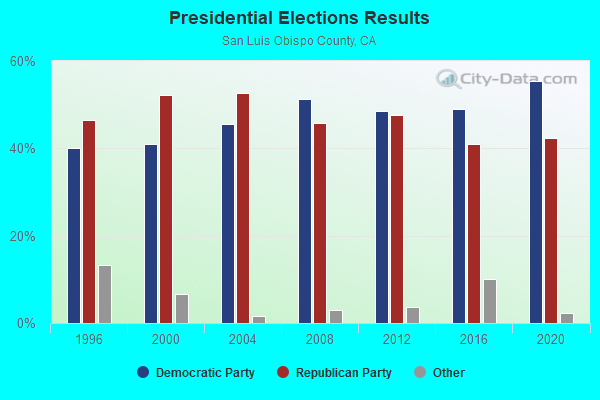
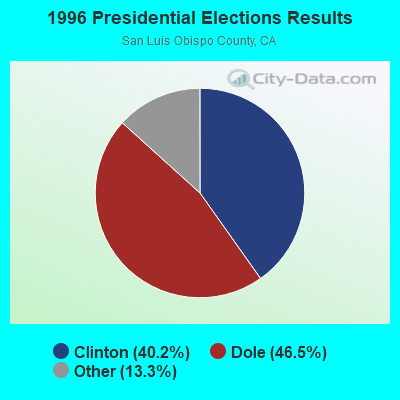
1996 Presidential Elections Results (%) - Democratic Party (Clinton)
1996 Presidential Elections Results (%) - Republican Party (Dole)
1996 Presidential Elections Results (%) - Other
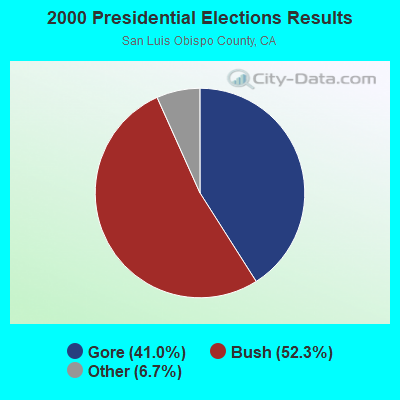
2000 Presidential Elections Results (%) - Democratic Party (Gore)
2000 Presidential Elections Results (%) - Republican Party (Bush)
2000 Presidential Elections Results (%) - Other
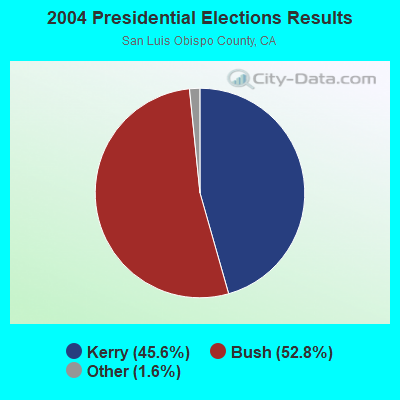
2004 Presidential Elections Results (%) - Democratic Party (Kerry)
2004 Presidential Elections Results (%) - Republican Party (Bush)
2004 Presidential Elections Results (%) - Other
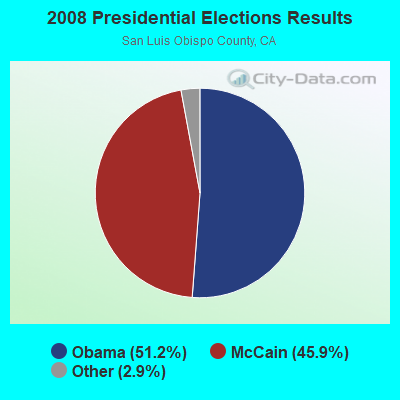
2008 Presidential Elections Results (%) - Democratic Party (Obama)
2008 Presidential Elections Results (%) - Republican Party (McCain)
2008 Presidential Elections Results (%) - Other
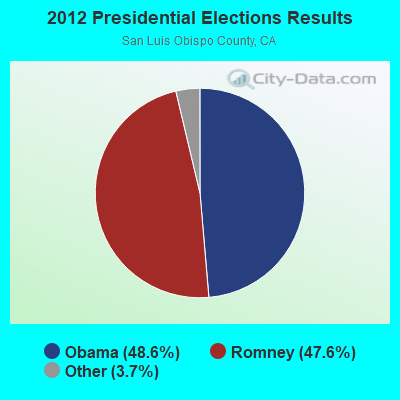
2012 Presidential Elections Results (%) - Democratic Party (Obama)
2012 Presidential Elections Results (%) - Republican Party (Romney)
2012 Presidential Elections Results (%) - Other
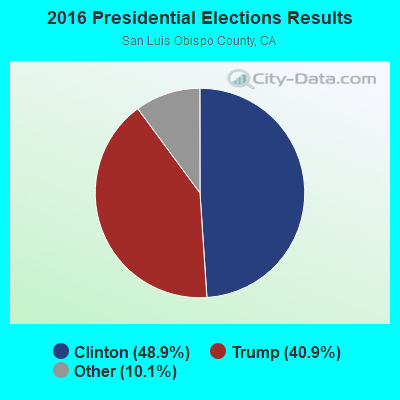
2016 Presidential Elections Results (%) - Democratic Party (Clinton)
2016 Presidential Elections Results (%) - Republican Party (Trump)
2016 Presidential Elections Results (%) - Other
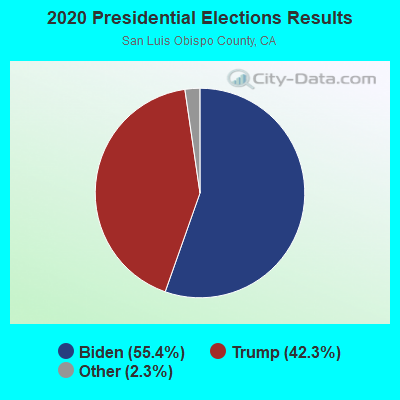
2020 Presidential Elections Results (%) - Democratic Party (Biden)
2020 Presidential Elections Results (%) - Republican Party (Trump)
2020 Presidential Elections Results (%) - Other
Ancestries Reported - Arab (%)
Ancestries Reported - Czech (%)
Ancestries Reported - Danish (%)
Ancestries Reported - Dutch (%)
Ancestries Reported - English (%)
Ancestries Reported - French (%)
Ancestries Reported - French Canadian (%)
Ancestries Reported - German (%)
Ancestries Reported - Greek (%)
Ancestries Reported - Hungarian (%)
Ancestries Reported - Irish (%)
Ancestries Reported - Italian (%)
Ancestries Reported - Lithuanian (%)
Ancestries Reported - Norwegian (%)
Ancestries Reported - Polish (%)
Ancestries Reported - Portuguese (%)
Ancestries Reported - Russian (%)
Ancestries Reported - Scotch-Irish (%)
Ancestries Reported - Scottish (%)
Ancestries Reported - Slovak (%)
Ancestries Reported - Subsaharan African (%)
Ancestries Reported - Swedish (%)
Ancestries Reported - Swiss (%)
Ancestries Reported - Ukrainian (%)
Ancestries Reported - United States (%)
Ancestries Reported - Welsh (%)
Ancestries Reported - West Indian (%)
Ancestries Reported - Other (%)
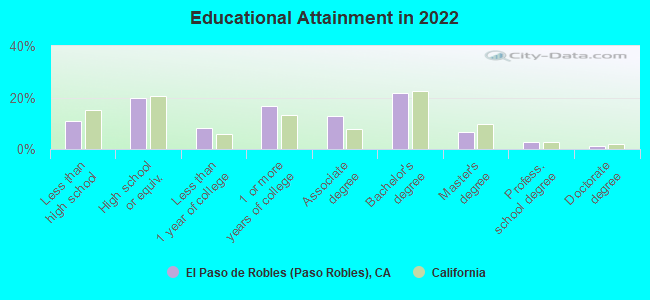
Educational Attainment - No schooling completed (%)
Educational Attainment - Less than high school (%)
Educational Attainment - High school or equivalent (%)
Educational Attainment - Less than 1 year of college (%)
Educational Attainment - 1 or more years of college (%)
Educational Attainment - Associate degree (%)
Educational Attainment - Bachelor's degree (%)
Educational Attainment - Master's degree (%)
Educational Attainment - Professional school degree (%)
Educational Attainment - Doctorate degree (%)
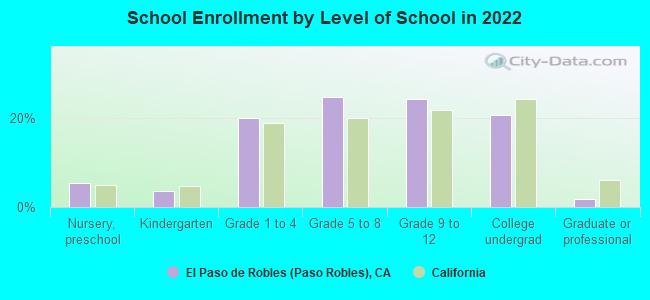
School Enrollment - Nursery, preschool (%)
School Enrollment - Kindergarten (%)
School Enrollment - Grade 1 to 4 (%)
School Enrollment - Grade 5 to 8 (%)
School Enrollment - Grade 9 to 12 (%)
School Enrollment - College undergrad (%)
School Enrollment - Graduate or professional (%)
School Enrollment - Not enrolled in school (%)
School enrollment - Public schools (%)
School enrollment - Private schools (%)
School enrollment - Not enrolled (%)
Median number of rooms in houses and condos
Median number of rooms in apartments
Housing units lacking complete plumbing facilities (%)
Housing units lacking complete kitchen facilities (%)
Density of houses
Urban houses (%)
Rural houses (%)
Households with people 60 years and over (%)
Households with people 65 years and over (%)
Households with people 75 years and over (%)
Households with one or more nonrelatives (%)
Households with no nonrelatives (%)
Population in households (%)
Family households (%)
Nonfamily households (%)
Population in families (%)
Family households with own children (%)
Median number of bedrooms in owner occupied houses
Mean number of bedrooms in owner occupied houses
Median number of bedrooms in renter occupied houses
Mean number of bedrooms in renter occupied houses
Median number of vehichles in owner occupied houses
Mean number of vehichles in owner occupied houses
Median number of vehichles in renter occupied houses
Mean number of vehichles in renter occupied houses
Mortgage status - with mortgage (%)
Mortgage status - with second mortgage (%)
Mortgage status - with home equity loan (%)
Mortgage status - with both second mortgage and home equity loan (%)
Mortgage status - without a mortgage (%)
Average family size
Average family size - White
Average family size - Black or African American
Average family size - Asian
Average family size - Hispanic or Latino
Average family size - American Indian and Alaska Native
Average family size - Multirace
Average family size - Other Race
Geographical mobility - Same house 1 year ago (%)
Geographical mobility - Moved within same county (%)
Geographical mobility - Moved from different county within same state (%)
Geographical mobility - Moved from different state (%)
Geographical mobility - Moved from abroad (%)
Place of birth - Born in state of residence (%)
Place of birth - Born in other state (%)
Place of birth - Native, outside of US (%)
Place of birth - Foreign born (%)
Housing units in structures - 1, detached (%)
Housing units in structures - 1, attached (%)
Housing units in structures - 2 (%)
Housing units in structures - 3 or 4 (%)
Housing units in structures - 5 to 9 (%)
Housing units in structures - 10 to 19 (%)
Housing units in structures - 20 to 49 (%)
Housing units in structures - 50 or more (%)
Housing units in structures - Mobile home (%)
Housing units in structures - Boat, RV, van, etc. (%)
House/condo owner moved in on average (years ago)
Renter moved in on average (years ago)
Year householder moved into unit - Moved in 1999 to March 2000 (%)
Year householder moved into unit - Moved in 1995 to 1998 (%)
Year householder moved into unit - Moved in 1990 to 1994 (%)
Year householder moved into unit - Moved in 1980 to 1989 (%)
Year householder moved into unit - Moved in 1970 to 1979 (%)
Year householder moved into unit - Moved in 1969 or earlier (%)
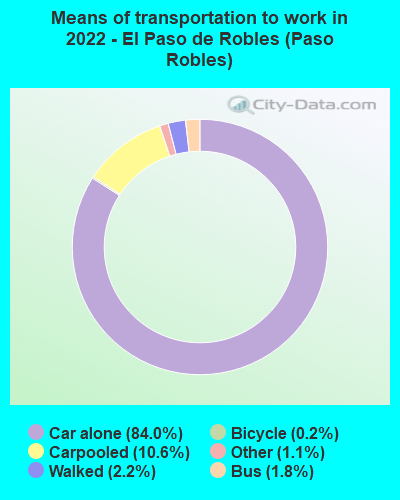
Means of transportation to work - Drove car alone (%)
Means of transportation to work - Carpooled (%)
Means of transportation to work - Public transportation (%)
Means of transportation to work - Bus or trolley bus (%)
Means of transportation to work - Streetcar or trolley car (%)
Means of transportation to work - Subway or elevated (%)
Means of transportation to work - Railroad (%)
Means of transportation to work - Ferryboat (%)
Means of transportation to work - Taxicab (%)
Means of transportation to work - Motorcycle (%)
Means of transportation to work - Bicycle (%)
Means of transportation to work - Walked (%)
Means of transportation to work - Other means (%)
Working at home (%)
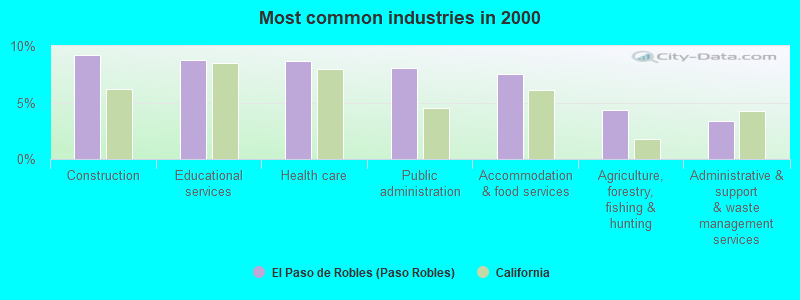
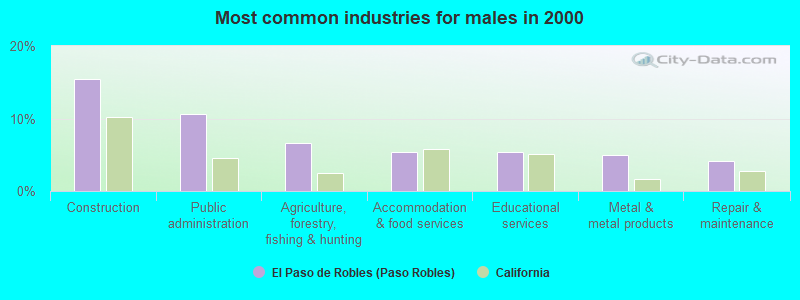
Industry diversity
Most Common Industries - Agriculture, forestry, fishing and hunting, and mining (%)
Most Common Industries - Agriculture, forestry, fishing and hunting (%)
Most Common Industries - Mining, quarrying, and oil and gas extraction (%)
Most Common Industries - Construction (%)
Most Common Industries - Manufacturing (%)
Most Common Industries - Wholesale trade (%)
Most Common Industries - Retail trade (%)
Most Common Industries - Transportation and warehousing, and utilities (%)
Most Common Industries - Transportation and warehousing (%)
Most Common Industries - Utilities (%)
Most Common Industries - Information (%)
Most Common Industries - Finance and insurance, and real estate and rental and leasing (%)
Most Common Industries - Finance and insurance (%)
Most Common Industries - Real estate and rental and leasing (%)
Most Common Industries - Professional, scientific, and management, and administrative and waste management services (%)
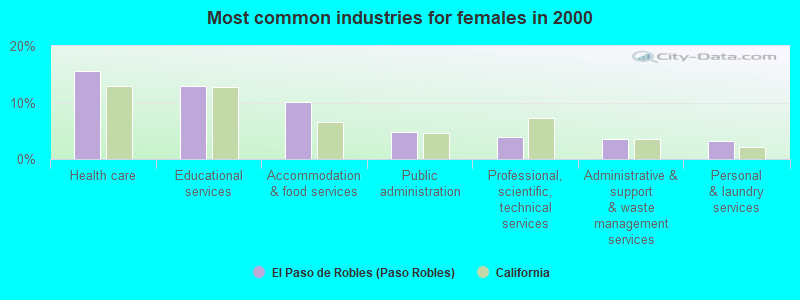
Most Common Industries - Professional, scientific, and technical services (%)
Most Common Industries - Management of companies and enterprises (%)
Most Common Industries - Administrative and support and waste management services (%)
Most Common Industries - Educational services, and health care and social assistance (%)
Most Common Industries - Educational services (%)
Most Common Industries - Health care and social assistance (%)
Most Common Industries - Arts, entertainment, and recreation, and accommodation and food services (%)
Most Common Industries - Arts, entertainment, and recreation (%)
Most Common Industries - Accommodation and food services (%)
Most Common Industries - Other services, except public administration (%)
Most Common Industries - Public administration (%)
Occupation diversity
Most Common Occupations - Management, business, science, and arts occupations (%)
Most Common Occupations - Management, business, and financial occupations (%)
Most Common Occupations - Management occupations (%)
Most Common Occupations - Business and financial operations occupations (%)
Most Common Occupations - Computer, engineering, and science occupations (%)
Most Common Occupations - Computer and mathematical occupations (%)
Most Common Occupations - Architecture and engineering occupations (%)
Most Common Occupations - Life, physical, and social science occupations (%)
Most Common Occupations - Education, legal, community service, arts, and media occupations (%)
Most Common Occupations - Community and social service occupations (%)
Most Common Occupations - Legal occupations (%)
Most Common Occupations - Education, training, and library occupations (%)
Most Common Occupations - Arts, design, entertainment, sports, and media occupations (%)
Most Common Occupations - Healthcare practitioners and technical occupations (%)
Most Common Occupations - Health diagnosing and treating practitioners and other technical occupations (%)
Most Common Occupations - Health technologists and technicians (%)
Most Common Occupations - Service occupations (%)
Most Common Occupations - Healthcare support occupations (%)
Most Common Occupations - Protective service occupations (%)
Most Common Occupations - Fire fighting and prevention, and other protective service workers including supervisors (%)
Most Common Occupations - Law enforcement workers including supervisors (%)
Most Common Occupations - Food preparation and serving related occupations (%)
Most Common Occupations - Building and grounds cleaning and maintenance occupations (%)
Most Common Occupations - Personal care and service occupations (%)
Most Common Occupations - Sales and office occupations (%)
Most Common Occupations - Sales and related occupations (%)
Most Common Occupations - Office and administrative support occupations (%)
Most Common Occupations - Natural resources, construction, and maintenance occupations (%)
Most Common Occupations - Farming, fishing, and forestry occupations (%)
Most Common Occupations - Construction and extraction occupations (%)
Most Common Occupations - Installation, maintenance, and repair occupations (%)
Most Common Occupations - Production, transportation, and material moving occupations (%)
Most Common Occupations - Production occupations (%)
Most Common Occupations - Transportation occupations (%)
Most Common Occupations - Material moving occupations (%)
People in Group quarters - Institutionalized population (%)
People in Group quarters - Correctional institutions (%)
People in Group quarters - Federal prisons and detention centers (%)
People in Group quarters - Halfway houses (%)
People in Group quarters - Local jails and other confinement facilities (including police lockups) (%)
People in Group quarters - Military disciplinary barracks (%)
People in Group quarters - State prisons (%)
People in Group quarters - Other types of correctional institutions (%)
People in Group quarters - Nursing homes (%)
People in Group quarters - Hospitals/wards, hospices, and schools for the handicapped (%)
People in Group quarters - Hospitals/wards and hospices for chronically ill (%)
People in Group quarters - Hospices or homes for chronically ill (%)
People in Group quarters - Military hospitals or wards for chronically ill (%)
People in Group quarters - Other hospitals or wards for chronically ill (%)
People in Group quarters - Hospitals or wards for drug/alcohol abuse (%)
People in Group quarters - Mental (Psychiatric) hospitals or wards (%)
People in Group quarters - Schools, hospitals, or wards for the mentally retarded (%)
People in Group quarters - Schools, hospitals, or wards for the physically handicapped (%)
People in Group quarters - Institutions for the deaf (%)
People in Group quarters - Institutions for the blind (%)
People in Group quarters - Orthopedic wards and institutions for the physically handicapped (%)
People in Group quarters - Wards in general hospitals for patients who have no usual home elsewhere (%)
People in Group quarters - Wards in military hospitals for patients who have no usual home elsewhere (%)
People in Group quarters - Juvenile institutions (%)
People in Group quarters - Long-term care (%)
People in Group quarters - Homes for abused, dependent, and neglected children (%)
People in Group quarters - Residential treatment centers for emotionally disturbed children (%)
People in Group quarters - Training schools for juvenile delinquents (%)
People in Group quarters - Short-term care, detention or diagnostic centers for delinquent children (%)
People in Group quarters - Type of juvenile institution unknown (%)
People in Group quarters - Noninstitutionalized population (%)
People in Group quarters - College dormitories (includes college quarters off campus) (%)
People in Group quarters - Military quarters (%)
People in Group quarters - On base (%)
People in Group quarters - Barracks, unaccompanied personnel housing (UPH), (Enlisted/Officer), ;and similar group living quarters for military personnel (%)
People in Group quarters - Transient quarters for temporary residents (%)
People in Group quarters - Military ships (%)
People in Group quarters - Group homes (%)
People in Group quarters - Homes or halfway houses for drug/alcohol abuse (%)
People in Group quarters - Homes for the mentally ill (%)
People in Group quarters - Homes for the mentally retarded (%)
People in Group quarters - Homes for the physically handicapped (%)
People in Group quarters - Other group homes (%)
People in Group quarters - Religious group quarters (%)
People in Group quarters - Dormitories (%)
People in Group quarters - Agriculture workers' dormitories on farms (%)
People in Group quarters - Job Corps and vocational training facilities (%)
People in Group quarters - Other workers' dormitories (%)
People in Group quarters - Crews of maritime vessels (%)
People in Group quarters - Other nonhousehold living situations (%)
People in Group quarters - Other noninstitutional group quarters (%)
Residents speaking English at home (%)
Residents speaking English at home - Born in the United States (%)
Residents speaking English at home - Native, born elsewhere (%)
Residents speaking English at home - Foreign born (%)
Residents speaking Spanish at home (%)
Residents speaking Spanish at home - Born in the United States (%)
Residents speaking Spanish at home - Native, born elsewhere (%)
Residents speaking Spanish at home - Foreign born (%)
Residents speaking other language at home (%)
Residents speaking other language at home - Born in the United States (%)
Residents speaking other language at home - Native, born elsewhere (%)
Residents speaking other language at home - Foreign born (%)
Class of Workers - Employee of private company (%)
Class of Workers - Self-employed in own incorporated business (%)
Class of Workers - Private not-for-profit wage and salary workers (%)
Class of Workers - Local government workers (%)
Class of Workers - State government workers (%)
Class of Workers - Federal government workers (%)
Class of Workers - Self-employed workers in own not incorporated business and Unpaid family workers (%)
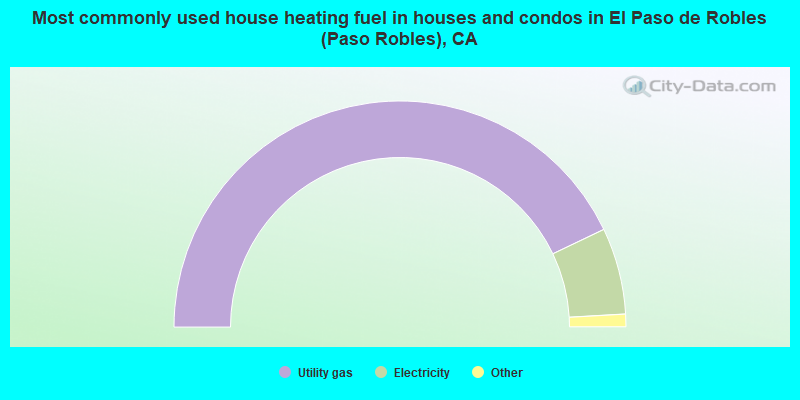
House heating fuel used in houses and condos - Utility gas (%)
House heating fuel used in houses and condos - Bottled, tank, or LP gas (%)
House heating fuel used in houses and condos - Electricity (%)
House heating fuel used in houses and condos - Fuel oil, kerosene, etc. (%)
House heating fuel used in houses and condos - Coal or coke (%)
House heating fuel used in houses and condos - Wood (%)
House heating fuel used in houses and condos - Solar energy (%)
House heating fuel used in houses and condos - Other fuel (%)
House heating fuel used in houses and condos - No fuel used (%)
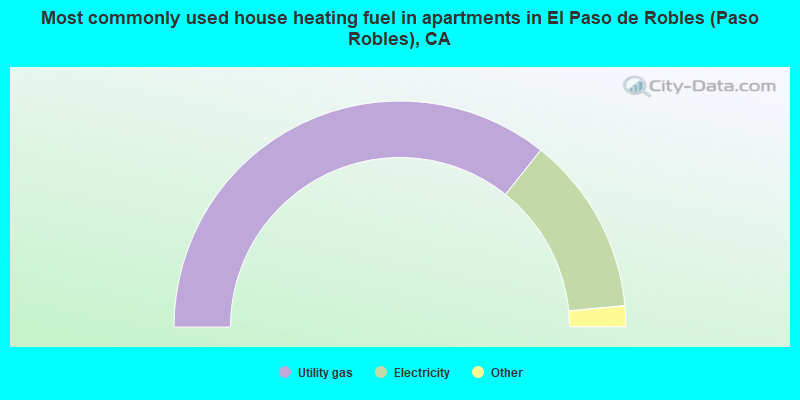
House heating fuel used in apartments - Utility gas (%)
House heating fuel used in apartments - Bottled, tank, or LP gas (%)
House heating fuel used in apartments - Electricity (%)
House heating fuel used in apartments - Fuel oil, kerosene, etc. (%)
House heating fuel used in apartments - Coal or coke (%)
House heating fuel used in apartments - Wood (%)
House heating fuel used in apartments - Solar energy (%)
House heating fuel used in apartments - Other fuel (%)
House heating fuel used in apartments - No fuel used (%)
Armed forces status - In Armed Forces (%)
Armed forces status - Civilian (%)
Armed forces status - Civilian - Veteran (%)
Armed forces status - Civilian - Nonveteran (%)
Fatal accidents locations in years 2005-2021
Fatal accidents locations in 2005
Fatal accidents locations in 2006
Fatal accidents locations in 2007
Fatal accidents locations in 2008
Fatal accidents locations in 2009
Fatal accidents locations in 2010
Fatal accidents locations in 2011
Fatal accidents locations in 2012
Fatal accidents locations in 2013
Fatal accidents locations in 2014
Fatal accidents locations in 2015
Fatal accidents locations in 2016
Fatal accidents locations in 2017
Fatal accidents locations in 2018
Fatal accidents locations in 2019
Fatal accidents locations in 2020
Fatal accidents locations in 2021
Alcohol use - People drinking some alcohol every month (%)
Alcohol use - People not drinking at all (%)
Alcohol use - Average days/month drinking alcohol
Alcohol use - Average drinks/week
Alcohol use - Average days/year people drink much
Audiometry - Average condition of hearing (%)
Audiometry - People that can hear a whisper from across a quiet room (%)
Audiometry - People that can hear normal voice from across a quiet room (%)
Audiometry - Ears ringing, roaring, buzzing (%)
Audiometry - Had a job exposure to loud noise (%)
Audiometry - Had off-work exposure to loud noise (%)
Blood Pressure & Cholesterol - Has high blood pressure (%)
Blood Pressure & Cholesterol - Checking blood pressure at home (%)
Blood Pressure & Cholesterol - Frequently checking blood cholesterol (%)
Blood Pressure & Cholesterol - Has high cholesterol level (%)
Consumer Behavior - Money monthly spent on food at supermarket/grocery store
Consumer Behavior - Money monthly spent on food at other stores
Consumer Behavior - Money monthly spent on eating out
Consumer Behavior - Money monthly spent on carryout/delivered foods
Consumer Behavior - Income spent on food at supermarket/grocery store (%)
Consumer Behavior - Income spent on food at other stores (%)
Consumer Behavior - Income spent on eating out (%)
Consumer Behavior - Income spent on carryout/delivered foods (%)
Current Health Status - General health condition (%)
Current Health Status - Blood donors (%)
Current Health Status - Has blood ever tested for HIV virus (%)
Current Health Status - Left-handed people (%)
Dermatology - People using sunscreen (%)
Diabetes - Diabetics (%)
Diabetes - Had a blood test for high blood sugar (%)
Diabetes - People taking insulin (%)
Diet Behavior & Nutrition - Diet health (%)
Diet Behavior & Nutrition - Milk product consumption (# of products/month)
Diet Behavior & Nutrition - Meals not home prepared (#/week)
Diet Behavior & Nutrition - Meals from fast food or pizza place (#/week)
Diet Behavior & Nutrition - Ready-to-eat foods (#/month)
Diet Behavior & Nutrition - Frozen meals/pizza (#/month)
Drug Use - People that ever used marijuana or hashish (%)
Drug Use - Ever used hard drugs (%)
Drug Use - Ever used any form of cocaine (%)
Drug Use - Ever used heroin (%)
Drug Use - Ever used methamphetamine (%)
Health Insurance - People covered by health insurance (%)
Kidney Conditions-Urology - Avg. # of times urinating at night
Medical Conditions - People with asthma (%)
Medical Conditions - People with anemia (%)
Medical Conditions - People with psoriasis (%)
Medical Conditions - People with overweight (%)
Medical Conditions - Elderly people having difficulties in thinking or remembering (%)
Medical Conditions - People who ever received blood transfusion (%)
Medical Conditions - People having trouble seeing even with glass/contacts (%)
Medical Conditions - People with arthritis (%)
Medical Conditions - People with gout (%)
Medical Conditions - People with congestive heart failure (%)
Medical Conditions - People with coronary heart disease (%)
Medical Conditions - People with angina pectoris (%)
Medical Conditions - People who ever had heart attack (%)
Medical Conditions - People who ever had stroke (%)
Medical Conditions - People with emphysema (%)
Medical Conditions - People with thyroid problem (%)
Medical Conditions - People with chronic bronchitis (%)
Medical Conditions - People with any liver condition (%)
Medical Conditions - People who ever had cancer or malignancy (%)
Mental Health - People who have little interest in doing things (%)
Mental Health - People feeling down, depressed, or hopeless (%)
Mental Health - People who have trouble sleeping or sleeping too much (%)
Mental Health - People feeling tired or having little energy (%)
Mental Health - People with poor appetite or overeating (%)
Mental Health - People feeling bad about themself (%)
Mental Health - People who have trouble concentrating on things (%)
Mental Health - People moving or speaking slowly or too fast (%)
Mental Health - People having thoughts they would be better off dead (%)
Oral Health - Average years since last visit a dentist
Oral Health - People embarrassed because of mouth (%)
Oral Health - People with gum disease (%)
Oral Health - General health of teeth and gums (%)
Oral Health - Average days a week using dental floss/device
Oral Health - Average days a week using mouthwash for dental problem
Oral Health - Average number of teeth
Pesticide Use - Households using pesticides to control insects (%)
Pesticide Use - Households using pesticides to kill weeds (%)
Physical Activity - People doing vigorous-intensity work activities (%)
Physical Activity - People doing moderate-intensity work activities (%)
Physical Activity - People walking or bicycling (%)
Physical Activity - People doing vigorous-intensity recreational activities (%)
Physical Activity - People doing moderate-intensity recreational activities (%)
Physical Activity - Average hours a day doing sedentary activities
Physical Activity - Average hours a day watching TV or videos
Physical Activity - Average hours a day using computer
Physical Functioning - People having limitations keeping them from working (%)
Physical Functioning - People limited in amount of work they can do (%)
Physical Functioning - People that need special equipment to walk (%)
Physical Functioning - People experiencing confusion/memory problems (%)
Physical Functioning - People requiring special healthcare equipment (%)
Prescription Medications - Average number of prescription medicines taking
Preventive Aspirin Use - Adults 40+ taking low-dose aspirin (%)
Reproductive Health - Vaginal deliveries (%)
Reproductive Health - Cesarean deliveries (%)
Reproductive Health - Deliveries resulted in a live birth (%)
Reproductive Health - Pregnancies resulted in a delivery (%)
Reproductive Health - Women breastfeeding newborns (%)
Reproductive Health - Women that had a hysterectomy (%)
Reproductive Health - Women that had both ovaries removed (%)
Reproductive Health - Women that have ever taken birth control pills (%)
Reproductive Health - Women taking birth control pills (%)
Reproductive Health - Women that have ever used Depo-Provera or injectables (%)
Reproductive Health - Women that have ever used female hormones (%)
Sexual Behavior - People 18+ that ever had sex (vaginal, anal, or oral) (%)
Sexual Behavior - Males 18+ that ever had vaginal sex with a woman (%)
Sexual Behavior - Males 18+ that ever performed oral sex on a woman (%)
Sexual Behavior - Males 18+ that ever had anal sex with a woman (%)
Sexual Behavior - Males 18+ that ever had any sex with a man (%)
Sexual Behavior - Females 18+ that ever had vaginal sex with a man (%)
Sexual Behavior - Females 18+ that ever performed oral sex on a man (%)
Sexual Behavior - Females 18+ that ever had anal sex with a man (%)
Sexual Behavior - Females 18+ that ever had any kind of sex with a woman (%)
Sexual Behavior - Average age people first had sex
Sexual Behavior - Average number of female sex partners in lifetime (males 18+)
Sexual Behavior - Average number of female vaginal sex partners in lifetime (males 18+)
Sexual Behavior - Average age people first performed oral sex on a woman (18+)
Sexual Behavior - Average number of woman performed oral sex on in lifetime (18+)
Sexual Behavior - Average number of male sex partners in lifetime (males 18+)
Sexual Behavior - Average number of male anal sex partners in lifetime (males 18+)
Sexual Behavior - Average age people first performed oral sex on a man (18+)
Sexual Behavior - Average number of male oral sex partners in lifetime (18+)
Sexual Behavior - People using protection when performing oral sex (%)
Sexual Behavior - Average number of times people have vaginal or anal sex a year
Sexual Behavior - People having sex without condom (%)
Sexual Behavior - Average number of male sex partners in lifetime (females 18+)
Sexual Behavior - Average number of male vaginal sex partners in lifetime (females 18+)
Sexual Behavior - Average number of female sex partners in lifetime (females 18+)
Sexual Behavior - Circumcised males 18+ (%)
Sleep Disorders - Average hours sleeping at night
Sleep Disorders - People that has trouble sleeping (%)
Smoking-Cigarette Use - People smoking cigarettes (%)
Taste & Smell - People 40+ having problems with smell (%)
Taste & Smell - People 40+ having problems with taste (%)
Taste & Smell - People 40+ that ever had wisdom teeth removed (%)
Taste & Smell - People 40+ that ever had tonsils teeth removed (%)
Taste & Smell - People 40+ that ever had a loss of consciousness because of a head injury (%)
Taste & Smell - People 40+ that ever had a broken nose or other serious injury to face or skull (%)
Taste & Smell - People 40+ that ever had two or more sinus infections (%)
Weight - Average height (inches)
Weight - Average weight (pounds)
Weight - Average BMI
Weight - People that are obese (%)
Weight - People that ever were obese (%)
Weight - People trying to lose weight (%)
17,153 54.2% White alone 10,965 34.7% Hispanic 1,987 6.3% Two or more races 1,142 3.6% Asian alone 340 1.1% Other race alone 145 0.5% Black alone 138 0.4% American Indian alone 9 0.03% Native Hawaiian and Other
Ancestries: English (7.2%), Irish (6.5%), American (5.0%), Italian (4.9%), German (4.6%), European (1.7%).
Current Local Time:
Land area: 17.3 square miles.
Population density: 1,820 people per square mile (low).
4,975 residents are foreign born (11.3% Latin America , 2.5% Asia ).
This city:
15.7%California:
26.5%
Median real estate property taxes paid for housing units with mortgages in 2022: $4,890 (0.8%)Median real estate property taxes paid for housing units with no mortgage in 2022: $3,581 (0.5%)
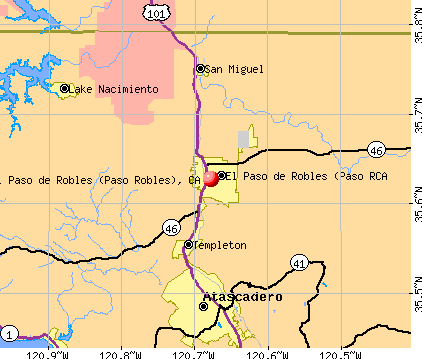
Nearest city with pop. 50,000+: Santa Maria, CA
Nearest city with pop. 200,000+: Fresno, CA
Nearest city with pop. 1,000,000+: Los Angeles, CA
Nearest cities:
Latitude: 35.63 N, Longitude: 120.68 W
Daytime population change due to commuting: +601 (+1.9%)Workers who live and work in this city: 7,700 (52.2%)
Area code commonly used in this area: 805
Unemployment in December 2023:
Population change in the 1990s: +4,754 (+24.3%).
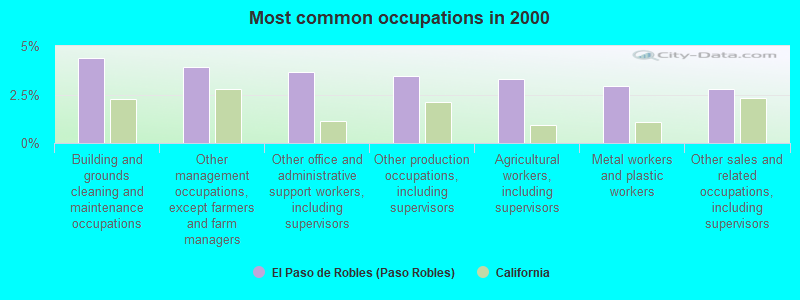
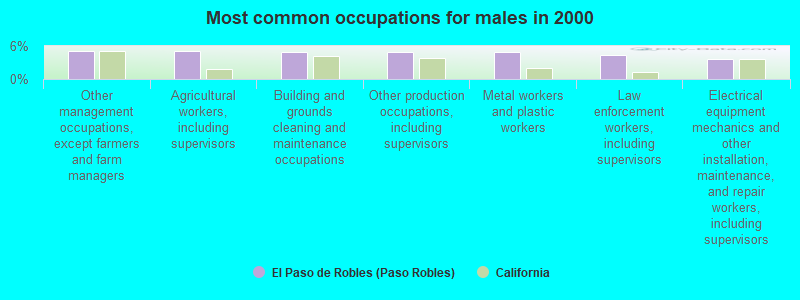
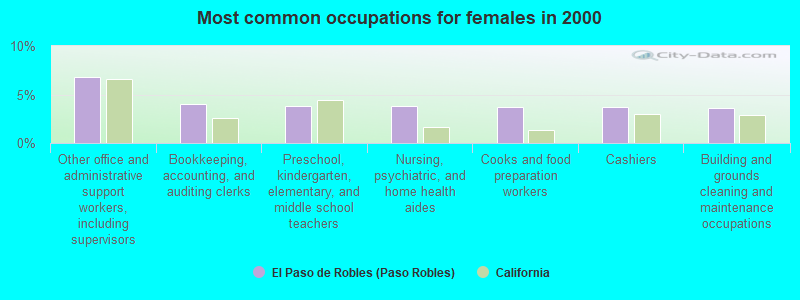
Most common occupations in El Paso de Robles (Paso Robles), CA (%)
Both Males Females
Building and grounds cleaning and maintenance occupations (4.4%)
Other management occupations, except farmers and farm managers (3.9%)
Other office and administrative support workers, including supervisors (3.6%)
Other production occupations, including supervisors (3.4%)
Agricultural workers, including supervisors (3.3%)
Metal workers and plastic workers (2.9%)
Other sales and related occupations, including supervisors (2.8%)
Other management occupations, except farmers and farm managers (5.1%)
Agricultural workers, including supervisors (5.0%)
Building and grounds cleaning and maintenance occupations (5.0%)
Other production occupations, including supervisors (4.9%)
Metal workers and plastic workers (4.9%)
Law enforcement workers, including supervisors (4.4%)
Electrical equipment mechanics and other installation, maintenance, and repair workers, including supervisors (3.6%)
Other office and administrative support workers, including supervisors (6.8%)
Bookkeeping, accounting, and auditing clerks (4.1%)
Preschool, kindergarten, elementary, and middle school teachers (3.9%)
Nursing, psychiatric, and home health aides (3.8%)
Cooks and food preparation workers (3.7%)
Cashiers (3.7%)
Building and grounds cleaning and maintenance occupations (3.6%)
Earthquake activity:
El Paso de Robles (Paso Robles)-area historical earthquake activity is significantly above California state average. It is 7580% greater than the overall U.S. average. On 7/21/1952 at 11:52:14, a magnitude 7.7 (7.7 UK, Class: Major, Intensity: VIII - XII) earthquake occurred 104.2 miles away from the city center, causing $50,000,000 total damage On 11/4/1927 at 13:51:53, a magnitude 7.5 (7.5 UK) earthquake occurred 53.1 miles away from the city center On 4/18/1906 at 13:12:21, a magnitude 7.9 (7.9 UK) earthquake occurred 208.5 miles away from El Paso de Robles (Paso Robles) center, causing $524,000,000 total damage On 10/18/1989 at 00:04:15, a magnitude 7.1 (6.5 MB, 7.1 MS, 6.9 MW, 7.0 ML) earthquake occurred 119.2 miles away from the city center, causing 62 deaths ( 62 shaking deaths) and 3757 injuries, causing $1,305,032,704 total damage On 6/28/1992 at 11:57:34, a magnitude 7.6 (6.2 MB, 7.6 MS, 7.3 MW, Depth: 0.7 mi) earthquake occurred 255.5 miles away from El Paso de Robles (Paso Robles) center, causing 3 deaths ( 1 shaking deaths, 2 other deaths) and 400 injuries, causing $100,000,000 total damage and $40,000,000 insured lossesOn 5/2/1983 at 23:42:37, a magnitude 6.7 (6.2 MB, 6.5 MS, 6.5 MW, 6.7 ML, Class: Strong, Intensity: VII - IX) earthquake occurred 45.9 miles away from El Paso de Robles (Paso Robles) center, causing $31,000,000 total damage Magnitude types: body-wave magnitude (MB), local magnitude (ML), surface-wave magnitude (MS), moment magnitude (MW) Natural disasters: The number of natural disasters in San Luis Obispo County (20) is greater than the US average (15).Major Disasters (Presidential) Declared: 14Emergencies Declared: 2Floods: 14, Storms: 7, Winter Storms: 7, Mudslides: 5, Landslides: 3, Drought: 1, Earthquake: 1, Fire: 1, Freeze: 1, Hurricane: 1, Tornado: 1, Other: 1 (Note: some incidents may be assigned to more than one category). Hospitals and medical centers near El Paso de Robles (Paso Robles): TWIN CITIES COMMUNITY HOSPITAL (about 6 miles away; TEMPLETON, CA)
VINEYARD HILLS HEALTH CENTER (Nursing Home, about 6 miles away; TEMPLETON, CA)
TEMPLETON DIALYSIS (Dialysis Facility, about 6 miles away; TEMPLETON, CA)
CENTRAL COAST NEUROBEHAVIOR CENTER - ADOLESCENTS (Hospital, about 11 miles away; ATASCADERO, CA)
DANISH CARE CENTER (Nursing Home, about 12 miles away; ATASCADERO, CA)
COUNTRY CARE CONVALESCENT HOSPITAL (Nursing Home, about 15 miles away; ATASCADERO, CA)
Amtrak stations near El Paso de Robles (Paso Robles): 1 miles: PASO ROBLES (8TH & PINE STS.) Services: fully wheelchair accessible, enclosed waiting area, public restrooms, public payphones, vending machines, free short-term parking, free long-term parking, call for taxi service, intercity bus service, public transit connection.
10 miles: ATASCADERO (EAST MALL & PALMA AVE.) - Bus Station Services: fully wheelchair accessible, public payphones, taxi stand.
Colleges/universities with over 2000 students nearest to El Paso de Robles (Paso Robles):
Cuesta College (about 21 miles; San Luis Obispo, CA ; Full-time enrollment: 6,518)
California Polytechnic State University-San Luis Obispo (about 23 miles; San Luis Obispo, CA ; FT enrollment: 17,345)
Allan Hancock College (about 50 miles; Santa Maria, CA ; FT enrollment: 6,639)
West Hills College-Lemoore (about 67 miles; Lemoore, CA ; FT enrollment: 2,314)
Taft College (about 77 miles; Taft, CA ; FT enrollment: 2,121)
San Joaquin Valley College-Visalia (about 88 miles; Visalia, CA ; FT enrollment: 2,386)
College of the Sequoias (about 91 miles; Visalia, CA ; FT enrollment: 6,982)
Notable locations in El Paso de Robles (Paso Robles): (A) , Eberle Winery (B) , Paso Robles Public Library (C) , Paso Robles City Hall (D) , Paso Robles Chamber of Commerce (E) , Pioneer Museum (F) , Paso Robles Department of Emergency Services Fire Station 3 Airport (G) , Paso Robles Department of Emergency Services Fire Station 2 Sherwood (H) , Paso Robles Department of Emergency Services Fire Station 1 Main (I) . Display/hide their locations on the map
Churches in El Paso de Robles (Paso Robles) include: (A) , Christian Life Center (B) , First Church of God (C) , Full Gospel Church (D) , Northside Church of Christ (E) , Second Baptist Church (F) , Covenant Community Church (G) , Dayspring Foursquare Church (H) , El Paso Calling Mission Church (I) . Display/hide their locations on the map
Creek: (A) . Display/hide its location on the map
Parks in El Paso de Robles (Paso Robles) include: (1) , Pioneer Park (2) , Barney Schwartz Park (3) , Downtown City Park (4) , Paso Robles Municipal Pool (5) , Caso Robles Park (6) , Centennial Park and Swimming Pool (7) , Melody Park (8) , Robbins Field Ball Park (9) . Display/hide their locations on the map
San Luis Obispo County has a predicted average indoor radon screening level between 2 and 4 pCi/L (pico curies per liter) - Moderate Potential Average household size: This city:
2.7 peopleCalifornia:
2.9 people
Percentage of family households: This city:
70.8%Whole state:
68.7%
Percentage of households with unmarried partners: This city:
7.7%Whole state:
7.2%
Likely homosexual households (counted as self-reported same-sex unmarried-partner households)
Lesbian couples: 0.4% of all households Gay men: 0.2% of all households
People in group quarters in El Paso de Robles (Paso Robles) in 2010:
102 people in other noninstitutional facilities
28 people in group homes intended for adults
19 people in workers' group living quarters and job corps centers
15 people in residential treatment centers for adults
5 people in group homes for juveniles (non-correctional)
People in group quarters in El Paso de Robles (Paso Robles) in 2000:
784 people in training schools for juvenile delinquents
56 people in other noninstitutional group quarters
45 people in nursing homes
32 people in homes for the mentally retarded
8 people in unknown juvenile institutions
2 people in religious group quarters
For population 15 years and over in El Paso de Robles (Paso Robles):
Never married: 28.1%Now married: 51.5%Separated: 2.1%Widowed: 5.6%Divorced: 12.6% For population 25 years and over in El Paso de Robles (Paso Robles):
High school or higher: 88.8%Bachelor's degree or higher: 29.2%Graduate or professional degree: 9.8%Unemployed: 6.1%Mean travel time to work (commute): 21.9 minutes
Education Gini index (Inequality in education) Here:
12.6California average:
15.5
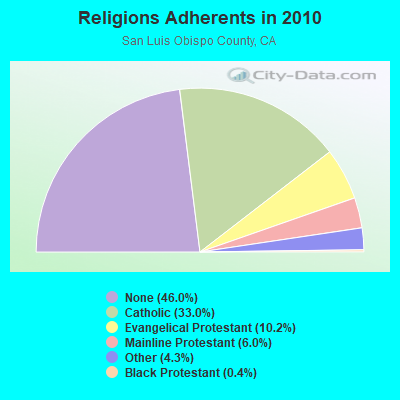
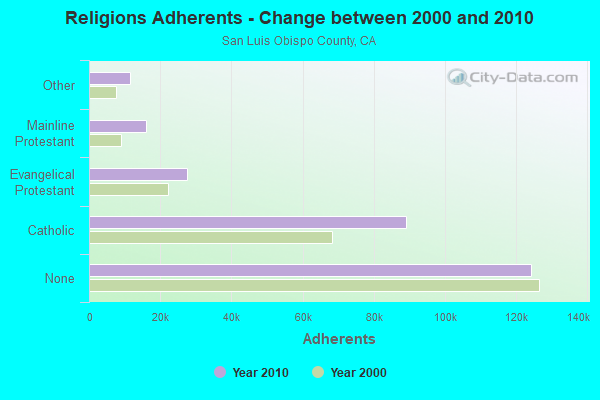
Religion statistics for El Paso de Robles (Paso Robles), CA (based on San Luis Obispo County data)
Religion Adherents Congregations Catholic 89,075 17 Evangelical Protestant 27,483 138 Mainline Protestant 16,099 56 Other 11,530 47 Black Protestant 1,078 3 Orthodox 205 2 None 124,167 -
Source: Clifford Grammich, Kirk Hadaway, Richard Houseal, Dale E.Jones, Alexei Krindatch, Richie Stanley and Richard H.Taylor. 2012. 2010 U.S.Religion Census: Religious Congregations & Membership Study. Association of Statisticians of American Religious Bodies. Jones, Dale E., et al. 2002. Congregations and Membership in the United States 2000. Nashville, TN: Glenmary Research Center. Graphs represent county-level data
Food Environment Statistics: Number of grocery stores : 60This county :
2.29 / 10,000 pop.California :
2.14 / 10,000 pop.
Number of supercenters and club stores : 1This county :
0.04 / 10,000 pop.California :
0.04 / 10,000 pop.
Number of convenience stores (no gas) : 18Here :
0.69 / 10,000 pop.California :
0.62 / 10,000 pop.
Number of convenience stores (with gas) : 58San Luis Obispo County :
2.22 / 10,000 pop.California :
1.49 / 10,000 pop.
Number of full-service restaurants : 288This county :
11.00 / 10,000 pop.California :
7.42 / 10,000 pop.
Adult diabetes rate : San Luis Obispo County :
6.1%California :
7.3%
Adult obesity rate : San Luis Obispo County :
21.5%State :
21.3%
Low-income preschool obesity rate : San Luis Obispo County :
14.5%California :
17.9%
Health and Nutrition: Healthy diet rate : This city:
48.4%State:
49.4%
Average overall health of teeth and gums : Here:
46.5%California:
48.0%
Average BMI : This city:
28.5California:
28.1
People feeling badly about themselves : El Paso de Robles (Paso Robles):
22.1%State:
20.2%
People not drinking alcohol at all : El Paso de Robles (Paso Robles):
10.3%California:
11.2%
Average hours sleeping at night : Overweight people : El Paso de Robles (Paso Robles):
33.6%State:
31.5%
General health condition : El Paso de Robles (Paso Robles):
55.1%State:
56.4%
Average condition of hearing : El Paso de Robles (Paso Robles):
78.8%California:
80.9%
More about Health and Nutrition of El Paso de Robles (Paso Robles), CA Residents
El Paso de Robles (Paso Robles) government finances - Expenditure in 2021 (per resident):
Construction - Regular Highways: $27,249,000 ($863.84)
Water Utilities: $2,663,000 ($84.42)Sewerage: $1,209,000 ($38.33)General - Other: $917,000 ($29.07)Police Protection: $849,000 ($26.91)Local Fire Protection: $389,000 ($12.33)Parks and Recreation: $160,000 ($5.07)Housing and Community Development: $121,000 ($3.84)Air Transportation: $23,000 ($0.73)Current Operations - Water Utilities: $12,417,000 ($393.64)
Police Protection: $10,787,000 ($341.97)Local Fire Protection: $8,184,000 ($259.45)Central Staff Services: $7,328,000 ($232.31)Sewerage: $5,485,000 ($173.88)Parks and Recreation: $3,994,000 ($126.62)Regular Highways: $3,864,000 ($122.50)Protective Inspection and Regulation - Other: $1,960,000 ($62.14)Libraries: $1,540,000 ($48.82)Financial Administration: $1,130,000 ($35.82)Air Transportation: $550,000 ($17.44)Judicial and Legal Services: $418,000 ($13.25)Parking Facilities: $255,000 ($8.08)Housing and Community Development: $174,000 ($5.52)General - Interest on Debt: $2,948,000 ($93.46)
Other Capital Outlay - General Public Building: $5,171,000 ($163.93)
Police Protection: $3,764,000 ($119.33)Regular Highways: $2,423,000 ($76.81)General - Other: $282,000 ($8.94)Water Utilities: $258,000 ($8.18)Sewerage: $254,000 ($8.05)Air Transportation: $198,000 ($6.28)Local Fire Protection: $177,000 ($5.61)Parks and Recreation: $142,000 ($4.50)Financial Administration: $9,000 ($0.29)Water Utilities - Interest on Debt: $213,000 ($6.75)
El Paso de Robles (Paso Robles) government finances - Revenue in 2021 (per resident):
Charges - Sewerage: $9,663,000 ($306.33)
Other: $4,698,000 ($148.93)Air Transportation: $940,000 ($29.80)Parks and Recreation: $194,000 ($6.15)Parking Facilities: $96,000 ($3.04)Federal Intergovernmental - Other: $1,191,000 ($37.76)
Housing and Community Development: $211,000 ($6.69)Sewerage: $4,000 ($0.13)Local Intergovernmental - Other: $37,000 ($1.17)
Miscellaneous - Sale of Property: $2,493,000 ($79.03)
Special Assessments: $1,298,000 ($41.15)General Revenue - Other: $1,267,000 ($40.17)Rents: $440,000 ($13.95)Interest Earnings: $430,000 ($13.63)Fines and Forfeits: $93,000 ($2.95)Donations From Private Sources: $47,000 ($1.49)Revenue - Water Utilities: $17,122,000 ($542.80)
State Intergovernmental - Other: $1,346,000 ($42.67)
Highways: $1,283,000 ($40.67)General Local Government Support: $63,000 ($2.00)Tax - Property: $13,867,000 ($439.61)
General Sales and Gross Receipts: $12,884,000 ($408.45)Other: $8,871,000 ($281.23)Other Selective Sales: $7,163,000 ($227.08)Public Utilities Sales: $3,796,000 ($120.34)Occupation and Business License - Other: $569,000 ($18.04)Other License: $562,000 ($17.82)Documentary and Stock Transfer: $247,000 ($7.83)
El Paso de Robles (Paso Robles) government finances - Debt in 2021 (per resident):
Long Term Debt - Beginning Outstanding - Unspecified Public Purpose: $82,805,000 ($2625.06)
Outstanding Unspecified Public Purpose: $73,806,000 ($2339.78)Retired Unspecified Public Purpose: $9,000,000 ($285.32)
El Paso de Robles (Paso Robles) government finances - Cash and Securities in 2021 (per resident):
Bond Funds - Cash and Securities: $34,030,000 ($1078.81)
Other Funds - Cash and Securities: $39,290,000 ($1245.56)
Sinking Funds - Cash and Securities: $6,013,000 ($190.62)
6.17% of this county's 2020 resident taxpayers moved to other counties in 2021 ($68,140 average adjusted gross income )
Here:
6.17%California average:
6.14%
0.02% of residents moved to foreign countries ($212 average AGI )San Luis Obispo County:
0.02%California average:
0.02%
Top counties to which taxpayers relocated from this county between 2020 and 2021: Strongest AM radio stations in El Paso de Robles (Paso Robles):
KPRL (1230 AM; 1 kW; PASO ROBLES, CA; Owner: DOUGLAS M. DAGGS, EXECUTOR)
KGDP (660 AM; 50 kW; ORCUTT, CA; Owner: RADIO REPRESENTATIVES, INC.)
KMJ (580 AM; 50 kW; FRESNO, CA; Owner: INFINITY RADIO OPERATIONS INC.)
KERI (1180 AM; 50 kW; WASCO-GREENACRES, CA; Owner: KWSO, INC.)
KXTK (1280 AM; 10 kW; ARROYO GRANDE, CA; Owner: PAMPLIN BROADCASTING, INC.)
KWRU (940 AM; 50 kW; FRESNO, CA)
KJDJ (1030 AM; 2 kW; SAN LUIS OBISPO, CA; Owner: PADRE SERRA COMMUNICATIONS, INC)
KLFF (890 AM; 5 kW; ARROYO GRANDE, CA; Owner: JERRY J. COLLINS)
KMBX (700 AM; 10 kW; SOLEDAD, CA; Owner: ENTRAVISION HOLDINGS, LLC)
KYAA (1200 AM; 25 kW; SOQUEL, CA; Owner: PEOPLE'S RADIO, INC.)
KNBR (680 AM; 50 kW; SAN FRANCISCO, CA; Owner: KNBR LICO, INC.)
KCBC (770 AM; 50 kW; RIVERBANK, CA; Owner: KIERTRON, INC.)
KGO (810 AM; 50 kW; SAN FRANCISCO, CA; Owner: KGO-AM RADIO, INC.)
Strongest FM radio stations in El Paso de Robles (Paso Robles):
KLUN (103.1 FM; PASO ROBLES, CA; Owner: LAZER BROADCASTING CORPORATION)
K295AG (106.9 FM; PASO ROBLES, CA; Owner: FAMILY STATIONS, INC.)
KXDZ (100.5 FM; TEMPLETON, CA; Owner: MAPLETON COMMUNICATIONS, LLC)
KSTT-FM (101.3 FM; LOS OSOS-BAYWOOD PAR, CA; Owner: CLEAR CHANNEL BROADCASTING LICENSES, INC.)
KSLY-FM (96.1 FM; SAN LUIS OBISPO, CA; Owner: CLEAR CHANNEL BROADCASTING LICENSES, INC.)
KKAL (99.7 FM; MORRO BAY, CA; Owner: SALISBURY BROADCASTING CORP.)
KZOZ (93.3 FM; SAN LUIS OBISPO, CA; Owner: AMERICAN GENERAL MEDIA-TEXAS, INC.)
KWSR (92.5 FM; PASO ROBLES, CA; Owner: LAGNIAPPE BROADCASTING, INC)
KKJG (98.1 FM; SAN LUIS OBISPO, CA; Owner: AGM SAN LUIS OBISPO, L.P.)
KWWV (106.1 FM; SANTA MARGARITA, CA; Owner: SALISBURY RADIO LLC)
K209CE (89.7 FM; SAN LUIS OBISPO, CA; Owner: FAMILY STATIONS, INC.)
KLRM (97.1 FM; SAN LUIS OBISPO, CA; Owner: GTM SAN LUIS OBISPO)
KIQO (104.5 FM; ATASCADERO, CA; Owner: AMERICAN GENERAL MEDIA OF TEXAS, INC)
KCBX (90.1 FM; SAN LUIS OBISPO, CA; Owner: KCBX, INC.)
KLVH (88.5 FM; SAN LUIS OBISPO, CA; Owner: EDUCATIONAL MEDIA FOUNDATION)
K213CO (90.5 FM; SAN LUIS OBISPO, CA; Owner: PENSACOLA CHRISTIAN COLLEGE, INC.)
KLMM (94.1 FM; MORRO BAY, CA; Owner: LAZER BROADCASTING CORPORATION)
KBDH (91.7 FM; SAN ARDO, CA; Owner: PATAPHYSICAL BROADCASTING FOUNDATION)
K206CC (89.1 FM; LOCKWOOD, CA; Owner: PRUNEDALE EDUC. F'DATION/CENTRAL CA)
KRKC-FM (102.1 FM; KING CITY, CA; Owner: KING CITY COMMUNICATIONS CORPORATION)
TV broadcast stations around El Paso de Robles (Paso Robles):
K17GD (Channel 17; PASO ROBLES, CA; Owner: ENTRAVISION HOLDINGS, LLC)
K19EF (Channel 19; PASO ROBLES, CA; Owner: J B BROADCASTING, INC.)
KSBY (Channel 6; SAN LUIS OBISPO, CA; Owner: NVG-SANTA BARBARA II, LLC)
K44DN (Channel 44; PASO ROBLES, CA; Owner: ACKERLEY MEDIA GROUP, INC.)
KPXA-LP (Channel 42; SAN LUIS OBISPO, CA; Owner: CAMINO REAL COMMUNICATIONS LLC)
K28FK (Channel 28; SAN LUIS OBISPO, CA; Owner: ENTRAVISION HOLDINGS, LLC)
K07WA (Channel 7; ATASCADERO, CA; Owner: CHARLES R. MEEKER)
KCCE-LP (Channel 50; SAN LUIS OBISPO, CA; Owner: ANET COMMUNICATIONS, INC.)
El Paso de Robles (Paso Robles) fatal accident list:
Jan 28, 2007 06:35 AM, Creston Rd, Lat: 35.628992, Lon: -120.682008, Vehicles: 1, Persons: 1, Fatalities: 1Lat: 35.634470, Lon: -120.685810, Vehicles: 1, Persons: 1, Fatalities: 1, Drunk persons involved: 1Lat: 35.632980, Lon: -120.686410, Vehicles: 1, Persons: 4, Fatalities: 1Lat: 35.639240, Lon: -120.691140, Vehicles: 2, Persons: 2, Fatalities: 1Lat: 35.642792, Lon: -120.700570, Vehicles: 1, Persons: 1, Fatalities: 1, Drunk persons involved: 1Vehicles: 2, Persons: 5, Fatalities: 2, Drunk persons involved: 2
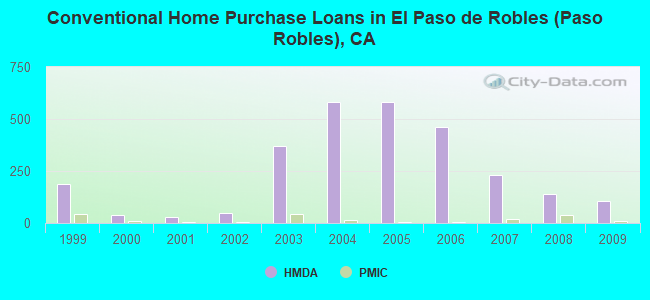
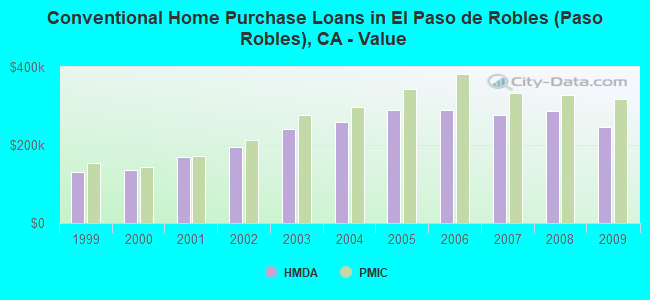
Home Mortgage Disclosure Act Aggregated Statistics For Year 2009(Based on 1 full and 3 partial tracts) A) FHA, FSA/RHS & VA B) Conventional C) Refinancings D) Home Improvement Loans F) Non-occupant Loans on G) Loans On Manufactured Number Average Value Number Average Value Number Average Value Number Average Value Number Average Value Number Average Value
LOANS ORIGINATED 88 $310,403 104 $245,545 474 $243,709 10 $187,251 63 $209,602 7 $151,801 APPLICATIONS APPROVED, NOT ACCEPTED 11 $263,803 11 $284,003 48 $272,668 0 $0 5 $265,220 1 $263,340 APPLICATIONS DENIED 10 $255,256 16 $259,311 148 $279,681 6 $158,303 20 $282,228 3 $156,167 APPLICATIONS WITHDRAWN 7 $310,494 15 $268,237 92 $261,239 5 $169,894 8 $261,658 4 $147,775 FILES CLOSED FOR INCOMPLETENESS 1 $473,920 1 $289,180 23 $294,533 1 $412,140 2 $216,000 1 $98,200
Aggregated Statistics For Year 2008(Based on 1 full and 3 partial tracts) A) FHA, FSA/RHS & VA B) Conventional C) Refinancings D) Home Improvement Loans E) Loans on Dwellings For 5+ Families F) Non-occupant Loans on G) Loans On Manufactured Number Average Value Number Average Value Number Average Value Number Average Value Number Average Value Number Average Value Number Average Value
LOANS ORIGINATED 34 $322,171 141 $286,527 216 $253,299 25 $137,946 1 $1,211,870 58 $249,101 4 $144,855 APPLICATIONS APPROVED, NOT ACCEPTED 4 $360,512 20 $310,781 45 $287,904 3 $129,633 0 $0 8 $289,209 1 $167,180 APPLICATIONS DENIED 4 $325,298 35 $273,858 183 $342,062 18 $150,216 0 $0 22 $266,078 5 $149,820 APPLICATIONS WITHDRAWN 8 $332,591 28 $245,673 68 $294,900 7 $166,861 0 $0 17 $206,083 1 $252,700 FILES CLOSED FOR INCOMPLETENESS 1 $208,070 5 $477,596 12 $298,452 4 $86,980 0 $0 2 $349,975 0 $0
Aggregated Statistics For Year 2007(Based on 1 full and 3 partial tracts) A) FHA, FSA/RHS & VA B) Conventional C) Refinancings D) Home Improvement Loans E) Loans on Dwellings For 5+ Families F) Non-occupant Loans on G) Loans On Manufactured Number Average Value Number Average Value Number Average Value Number Average Value Number Average Value Number Average Value Number Average Value
LOANS ORIGINATED 3 $374,880 231 $275,681 372 $274,209 38 $139,694 1 $1,742,290 84 $279,680 7 $170,567 APPLICATIONS APPROVED, NOT ACCEPTED 0 $0 33 $305,150 86 $313,949 12 $159,626 0 $0 12 $327,031 1 $135,110 APPLICATIONS DENIED 2 $253,120 53 $267,048 260 $333,707 21 $210,290 0 $0 27 $286,379 9 $174,560 APPLICATIONS WITHDRAWN 1 $175,140 36 $285,344 120 $331,653 7 $237,569 0 $0 17 $350,851 0 $0 FILES CLOSED FOR INCOMPLETENESS 0 $0 5 $255,360 35 $323,115 3 $128,710 0 $0 2 $358,135 0 $0
Aggregated Statistics For Year 2006(Based on 1 full and 3 partial tracts) B) Conventional C) Refinancings D) Home Improvement Loans E) Loans on Dwellings For 5+ Families F) Non-occupant Loans on G) Loans On Manufactured Number Average Value Number Average Value Number Average Value Number Average Value Number Average Value Number Average Value
LOANS ORIGINATED 462 $289,345 564 $288,855 77 $174,770 1 $1,225,320 106 $291,210 8 $119,022 APPLICATIONS APPROVED, NOT ACCEPTED 70 $283,980 96 $308,521 8 $185,529 0 $0 13 $301,556 5 $113,058 APPLICATIONS DENIED 112 $309,570 267 $327,609 47 $202,310 0 $0 30 $288,703 2 $135,700 APPLICATIONS WITHDRAWN 72 $297,191 192 $323,950 23 $251,333 0 $0 16 $304,182 1 $357,790 FILES CLOSED FOR INCOMPLETENESS 8 $264,890 38 $296,697 3 $342,917 0 $0 5 $254,454 0 $0
Aggregated Statistics For Year 2005(Based on 1 full and 3 partial tracts) A) FHA, FSA/RHS & VA B) Conventional C) Refinancings D) Home Improvement Loans E) Loans on Dwellings For 5+ Families F) Non-occupant Loans on G) Loans On Manufactured Number Average Value Number Average Value Number Average Value Number Average Value Number Average Value Number Average Value Number Average Value
LOANS ORIGINATED 1 $382,810 584 $289,262 662 $280,009 95 $180,161 1 $895,870 145 $277,456 11 $188,993 APPLICATIONS APPROVED, NOT ACCEPTED 0 $0 66 $285,515 93 $275,603 14 $105,424 0 $0 14 $261,159 4 $112,918 APPLICATIONS DENIED 0 $0 83 $310,106 201 $279,763 32 $130,762 0 $0 27 $306,407 5 $255,940 APPLICATIONS WITHDRAWN 1 $125,100 97 $262,081 186 $290,634 20 $164,034 0 $0 21 $292,228 4 $164,148 FILES CLOSED FOR INCOMPLETENESS 0 $0 40 $248,602 38 $308,744 3 $69,480 0 $0 4 $299,750 0 $0
Aggregated Statistics For Year 2004(Based on 1 full and 3 partial tracts) A) FHA, FSA/RHS & VA B) Conventional C) Refinancings D) Home Improvement Loans E) Loans on Dwellings For 5+ Families F) Non-occupant Loans on G) Loans On Manufactured Number Average Value Number Average Value Number Average Value Number Average Value Number Average Value Number Average Value Number Average Value
LOANS ORIGINATED 3 $228,837 581 $258,090 687 $229,283 57 $158,355 1 $1,219,000 155 $236,466 14 $137,361 APPLICATIONS APPROVED, NOT ACCEPTED 0 $0 60 $251,533 96 $221,433 12 $113,404 0 $0 12 $238,102 4 $134,658 APPLICATIONS DENIED 0 $0 81 $233,245 208 $225,340 30 $129,031 1 $3,000 24 $220,842 7 $161,769 APPLICATIONS WITHDRAWN 0 $0 67 $247,737 213 $232,192 16 $123,601 0 $0 14 $224,308 3 $143,240 FILES CLOSED FOR INCOMPLETENESS 0 $0 12 $249,751 41 $245,376 5 $60,136 0 $0 6 $196,542 1 $59,420
Aggregated Statistics For Year 2003(Based on 1 full and 3 partial tracts) A) FHA, FSA/RHS & VA B) Conventional C) Refinancings D) Home Improvement Loans E) Loans on Dwellings For 5+ Families F) Non-occupant Loans on Number Average Value Number Average Value Number Average Value Number Average Value Number Average Value Number Average Value
LOANS ORIGINATED 14 $240,331 371 $241,234 1,505 $192,359 42 $56,112 1 $1,523,860 198 $202,277 APPLICATIONS APPROVED, NOT ACCEPTED 1 $145,740 38 $199,505 180 $190,936 11 $37,819 0 $0 27 $171,240 APPLICATIONS DENIED 1 $251,980 48 $215,296 212 $203,223 20 $41,874 0 $0 23 $195,567 APPLICATIONS WITHDRAWN 3 $217,780 32 $229,817 216 $208,792 5 $118,810 0 $0 20 $188,312 FILES CLOSED FOR INCOMPLETENESS 1 $153,250 6 $223,457 37 $239,726 2 $49,340 0 $0 5 $179,696
Aggregated Statistics For Year 2002(Based on 1 partial tract) A) FHA, FSA/RHS & VA B) Conventional C) Refinancings D) Home Improvement Loans E) Loans on Dwellings For 5+ Families F) Non-occupant Loans on Number Average Value Number Average Value Number Average Value Number Average Value Number Average Value Number Average Value
LOANS ORIGINATED 2 $222,535 46 $194,230 83 $172,582 1 $73,760 1 $768,780 24 $168,968 APPLICATIONS APPROVED, NOT ACCEPTED 0 $0 5 $192,582 11 $155,659 0 $0 0 $0 2 $164,595 APPLICATIONS DENIED 0 $0 6 $176,807 17 $160,470 1 $36,130 0 $0 4 $160,485 APPLICATIONS WITHDRAWN 0 $0 2 $308,885 12 $164,555 1 $40,620 0 $0 1 $86,970 FILES CLOSED FOR INCOMPLETENESS 0 $0 0 $0 3 $196,287 0 $0 0 $0 1 $231,510
Aggregated Statistics For Year 2001(Based on 1 partial tract) A) FHA, FSA/RHS & VA B) Conventional C) Refinancings D) Home Improvement Loans E) Loans on Dwellings For 5+ Families F) Non-occupant Loans on Number Average Value Number Average Value Number Average Value Number Average Value Number Average Value Number Average Value
LOANS ORIGINATED 3 $173,443 31 $170,292 69 $152,951 2 $48,845 1 $127,090 19 $139,145 APPLICATIONS APPROVED, NOT ACCEPTED 0 $0 5 $158,192 6 $139,427 1 $65,790 0 $0 2 $164,100 APPLICATIONS DENIED 0 $0 4 $119,180 19 $143,421 2 $44,480 0 $0 2 $138,555 APPLICATIONS WITHDRAWN 0 $0 3 $149,437 12 $157,391 2 $62,925 0 $0 3 $123,770 FILES CLOSED FOR INCOMPLETENESS 0 $0 2 $116,125 3 $104,250 0 $0 0 $0 1 $88,220
Aggregated Statistics For Year 2000(Based on 1 partial tract) A) FHA, FSA/RHS & VA B) Conventional C) Refinancings D) Home Improvement Loans F) Non-occupant Loans on Number Average Value Number Average Value Number Average Value Number Average Value Number Average Value
LOANS ORIGINATED 5 $163,176 39 $136,370 18 $125,278 4 $40,060 10 $131,702 APPLICATIONS APPROVED, NOT ACCEPTED 0 $0 7 $118,227 3 $111,723 1 $89,210 2 $130,080 APPLICATIONS DENIED 1 $112,390 7 $131,720 10 $121,759 2 $29,030 2 $106,780 APPLICATIONS WITHDRAWN 0 $0 5 $171,648 10 $94,821 1 $62,050 1 $221,790 FILES CLOSED FOR INCOMPLETENESS 0 $0 0 $0 2 $100,550 0 $0 1 $66,040
Aggregated Statistics For Year 1999(Based on 2 partial tracts) A) FHA, FSA/RHS & VA B) Conventional C) Refinancings D) Home Improvement Loans E) Loans on Dwellings For 5+ Families F) Non-occupant Loans on Number Average Value Number Average Value Number Average Value Number Average Value Number Average Value Number Average Value
LOANS ORIGINATED 77 $138,526 186 $130,004 203 $113,361 20 $30,535 2 $168,550 38 $104,103 APPLICATIONS APPROVED, NOT ACCEPTED 5 $279,068 15 $105,951 32 $119,625 6 $23,678 1 $75,910 3 $113,147 APPLICATIONS DENIED 10 $132,531 24 $121,426 83 $100,440 16 $28,275 0 $0 4 $144,175 APPLICATIONS WITHDRAWN 4 $157,472 25 $144,160 57 $104,452 2 $9,900 1 $79,210 5 $250,536 FILES CLOSED FOR INCOMPLETENESS 0 $0 3 $144,150 12 $101,211 1 $12,890 0 $0 0 $0
Detailed HMDA statistics for the following Tracts:
0101.00
, 0102.01 , 0102.02 , 0102.03
Private Mortgage Insurance Companies Aggregated Statistics For Year 2009(Based on 1 full and 3 partial tracts) A) Conventional B) Refinancings Number Average Value Number Average Value
LOANS ORIGINATED 12 $318,143 9 $287,104 APPLICATIONS APPROVED, NOT ACCEPTED 4 $249,290 2 $397,545 APPLICATIONS DENIED 2 $268,535 3 $281,890 APPLICATIONS WITHDRAWN 1 $325,130 1 $319,000 FILES CLOSED FOR INCOMPLETENESS 1 $199,530 0 $0
Aggregated Statistics For Year 2008(Based on 1 full and 3 partial tracts) A) Conventional B) Refinancings C) Non-occupant Loans on Number Average Value Number Average Value Number Average Value
LOANS ORIGINATED 39 $329,328 12 $345,460 2 $339,680 APPLICATIONS APPROVED, NOT ACCEPTED 8 $301,836 11 $375,316 1 $351,620 APPLICATIONS DENIED 5 $347,896 0 $0 2 $381,820 APPLICATIONS WITHDRAWN 3 $399,200 0 $0 0 $0 FILES CLOSED FOR INCOMPLETENESS 1 $466,880 0 $0 0 $0
Aggregated Statistics For Year 2007(Based on 1 full and 3 partial tracts) A) Conventional B) Refinancings C) Non-occupant Loans on D) Loans On Manufactured Number Average Value Number Average Value Number Average Value Number Average Value
LOANS ORIGINATED 19 $332,061 9 $372,170 2 $254,515 1 $300,240 APPLICATIONS APPROVED, NOT ACCEPTED 2 $298,260 7 $360,413 0 $0 0 $0 APPLICATIONS DENIED 1 $582,970 0 $0 1 $190,780 0 $0 APPLICATIONS WITHDRAWN 0 $0 1 $305,000 0 $0 0 $0 FILES CLOSED FOR INCOMPLETENESS 0 $0 0 $0 0 $0 0 $0
Aggregated Statistics For Year 2006(Based on 1 full and 3 partial tracts) A) Conventional B) Refinancings C) Non-occupant Loans on Number Average Value Number Average Value Number Average Value
LOANS ORIGINATED 6 $380,858 4 $327,052 1 $218,920 APPLICATIONS APPROVED, NOT ACCEPTED 2 $385,435 1 $265,130 0 $0 APPLICATIONS DENIED 0 $0 0 $0 0 $0 APPLICATIONS WITHDRAWN 1 $272,090 0 $0 0 $0 FILES CLOSED FOR INCOMPLETENESS 0 $0 0 $0 0 $0
Aggregated Statistics For Year 2005(Based on 1 full and 3 partial tracts) A) Conventional B) Refinancings Number Average Value Number Average Value
LOANS ORIGINATED 7 $344,139 10 $361,492 APPLICATIONS APPROVED, NOT ACCEPTED 0 $0 4 $285,918 APPLICATIONS DENIED 0 $0 0 $0 APPLICATIONS WITHDRAWN 1 $228,310 0 $0 FILES CLOSED FOR INCOMPLETENESS 0 $0 0 $0
Aggregated Statistics For Year 2004(Based on 1 full and 3 partial tracts) A) Conventional B) Refinancings C) Non-occupant Loans on D) Loans On Manufactured Number Average Value Number Average Value Number Average Value Number Average Value
LOANS ORIGINATED 16 $297,731 6 $282,445 2 $294,110 1 $157,630 APPLICATIONS APPROVED, NOT ACCEPTED 4 $323,275 6 $287,003 0 $0 0 $0 APPLICATIONS DENIED 0 $0 0 $0 0 $0 0 $0 APPLICATIONS WITHDRAWN 1 $289,610 0 $0 0 $0 0 $0 FILES CLOSED FOR INCOMPLETENESS 1 $254,000 0 $0 0 $0 0 $0
Aggregated Statistics For Year 2003(Based on 1 full and 3 partial tracts) A) Conventional B) Refinancings C) Non-occupant Loans on Number Average Value Number Average Value Number Average Value
LOANS ORIGINATED 44 $277,006 38 $257,096 5 $202,964 APPLICATIONS APPROVED, NOT ACCEPTED 4 $250,372 11 $274,605 0 $0 APPLICATIONS DENIED 0 $0 0 $0 0 $0 APPLICATIONS WITHDRAWN 0 $0 3 $312,770 0 $0 FILES CLOSED FOR INCOMPLETENESS 0 $0 0 $0 0 $0
Aggregated Statistics For Year 2002(Based on 1 partial tract) A) Conventional B) Refinancings Number Average Value Number Average Value
LOANS ORIGINATED 4 $212,008 1 $203,100 APPLICATIONS APPROVED, NOT ACCEPTED 0 $0 1 $242,470 APPLICATIONS DENIED 0 $0 0 $0 APPLICATIONS WITHDRAWN 0 $0 0 $0 FILES CLOSED FOR INCOMPLETENESS 0 $0 0 $0
Aggregated Statistics For Year 2001(Based on 1 partial tract) A) Conventional B) Refinancings C) Non-occupant Loans on Number Average Value Number Average Value Number Average Value
LOANS ORIGINATED 6 $170,993 3 $219,960 1 $200,860 APPLICATIONS APPROVED, NOT ACCEPTED 1 $137,560 0 $0 0 $0 APPLICATIONS DENIED 0 $0 0 $0 0 $0 APPLICATIONS WITHDRAWN 0 $0 0 $0 0 $0 FILES CLOSED FOR INCOMPLETENESS 0 $0 0 $0 0 $0
Aggregated Statistics For Year 2000(Based on 1 partial tract) A) Conventional B) Refinancings C) Non-occupant Loans on Number Average Value Number Average Value Number Average Value
LOANS ORIGINATED 8 $143,290 1 $173,190 1 $140,800 APPLICATIONS APPROVED, NOT ACCEPTED 2 $182,915 0 $0 0 $0 APPLICATIONS DENIED 0 $0 0 $0 0 $0 APPLICATIONS WITHDRAWN 1 $96,940 0 $0 0 $0 FILES CLOSED FOR INCOMPLETENESS 0 $0 0 $0 0 $0
Aggregated Statistics For Year 1999(Based on 2 partial tracts) A) Conventional B) Refinancings C) Non-occupant Loans on Number Average Value Number Average Value Number Average Value
LOANS ORIGINATED 42 $153,197 24 $138,397 3 $138,123 APPLICATIONS APPROVED, NOT ACCEPTED 2 $124,325 4 $132,025 1 $117,720 APPLICATIONS DENIED 5 $156,650 4 $159,298 0 $0 APPLICATIONS WITHDRAWN 1 $105,520 1 $148,530 0 $0 FILES CLOSED FOR INCOMPLETENESS 0 $0 1 $69,860 0 $0
Detailed PMIC statistics for the following Tracts:
0101.00
, 0102.01 , 0102.02 , 0102.03 El Paso de Robles (Paso Robles) compared to California state average:
Unemployed percentage below state average. Black race population percentage significantly below state average. Length of stay since moving in above state average. House age below state average. El Paso de Robles (Paso Robles) on our top lists :
#19 on the list of "Top 101 cities with the largest percentage of people in training schools for juvenile delinquents (population 1,000+)"
#30 on the list of "Top 101 cities with the most local government spending on highway construction per resident (population 10,000+)"
#4 on the list of "Top 101 counties with the lowest Sulfur Oxides Annual air pollution readings in 2012 (µg/m3 )"
#39 on the list of "Top 101 counties with highest percentage of residents voting for 3rd party candidates in the 2012 Presidential Election (pop. 50,000+)"
#50 on the list of "Top 101 counties with the lowest number of births per 1000 residents 2007-2013"
#60 on the list of "Top 101 counties with the lowest Particulate Matter (PM2.5 ) Annual air pollution readings in 2012 (µg/m3 )"
#74 on the list of "Top 101 counties with the largest increase in the number of births per 1000 residents 2000-2006 to 2007-2013 (pop 50,000+)"


 Recent articles from our blog. Our writers, many of them Ph.D. graduates or candidates, create easy-to-read articles on a wide variety of topics.
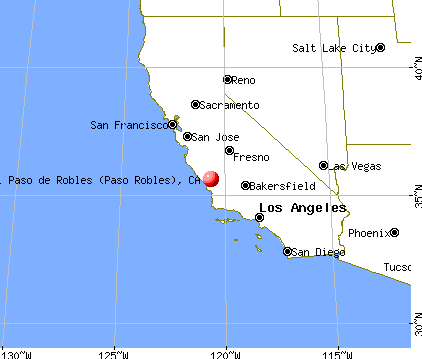
 (48.7 miles
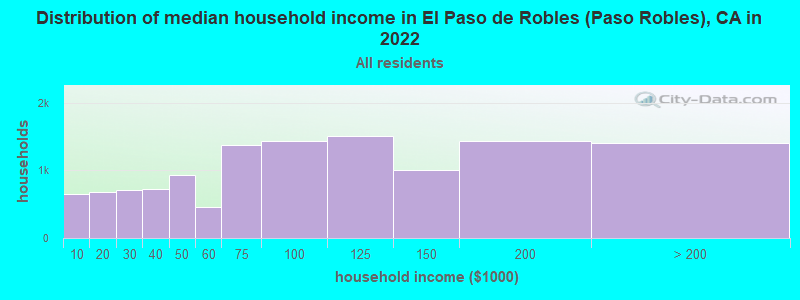
-CA.png)