Evanston, Illinois Submit your own pictures of this city and show them to the world
OSM Map
General Map
Google Map
MSN Map
OSM Map
General Map
Google Map
MSN Map
OSM Map
General Map
Google Map
MSN Map
OSM Map
General Map
Google Map
MSN Map
Please wait while loading the map...
Population in 2022: 75,544 (100% urban, 0% rural). Population change since 2000: +1.8%Males: 36,763 Females: 38,781
March 2022 cost of living index in Evanston: 104.3 (near average, U.S. average is 100) Percentage of residents living in poverty in 2022: 10.3%for White Non-Hispanic residents , 16.8% for Black residents , 8.2% for Hispanic or Latino residents , 14.7% for other race residents , 10.1% for two or more races residents )
Profiles of local businesses
Business Search - 14 Million verified businesses
Data:
Median household income ($)
Median household income (% change since 2000)
Household income diversity
Ratio of average income to average house value (%)
Ratio of average income to average rent
Median household income ($) - White
Median household income ($) - Black or African American
Median household income ($) - Asian
Median household income ($) - Hispanic or Latino
Median household income ($) - American Indian and Alaska Native
Median household income ($) - Multirace
Median household income ($) - Other Race
Median household income for houses/condos with a mortgage ($)
Median household income for apartments without a mortgage ($)
Races - White alone (%)
Races - White alone (% change since 2000)
Races - Black alone (%)
Races - Black alone (% change since 2000)
Races - American Indian alone (%)
Races - American Indian alone (% change since 2000)
Races - Asian alone (%)
Races - Asian alone (% change since 2000)
Races - Hispanic (%)
Races - Hispanic (% change since 2000)
Races - Native Hawaiian and Other Pacific Islander alone (%)
Races - Native Hawaiian and Other Pacific Islander alone (% change since 2000)
Races - Two or more races (%)
Races - Two or more races (% change since 2000)
Races - Other race alone (%)
Races - Other race alone (% change since 2000)
Racial diversity
Unemployment (%)
Unemployment (% change since 2000)
Unemployment (%) - White
Unemployment (%) - Black or African American
Unemployment (%) - Asian
Unemployment (%) - Hispanic or Latino
Unemployment (%) - American Indian and Alaska Native
Unemployment (%) - Multirace
Unemployment (%) - Other Race
Population density (people per square mile)
Population - Males (%)
Population - Females (%)
Population - Males (%) - White
Population - Males (%) - Black or African American
Population - Males (%) - Asian
Population - Males (%) - Hispanic or Latino
Population - Males (%) - American Indian and Alaska Native
Population - Males (%) - Multirace
Population - Males (%) - Other Race
Population - Females (%) - White
Population - Females (%) - Black or African American
Population - Females (%) - Asian
Population - Females (%) - Hispanic or Latino
Population - Females (%) - American Indian and Alaska Native
Population - Females (%) - Multirace
Population - Females (%) - Other Race
Coronavirus confirmed cases (Apr 27, 2024)
Deaths caused by coronavirus (Apr 27, 2024)
Coronavirus confirmed cases (per 100k population) (Apr 27, 2024)
Deaths caused by coronavirus (per 100k population) (Apr 27, 2024)
Daily increase in number of cases (Apr 27, 2024)
Weekly increase in number of cases (Apr 27, 2024)
Cases doubled (in days) (Apr 27, 2024)
Hospitalized patients (Apr 18, 2022)
Negative test results (Apr 18, 2022)
Total test results (Apr 18, 2022)
COVID Vaccine doses distributed (per 100k population) (Sep 19, 2023)
COVID Vaccine doses administered (per 100k population) (Sep 19, 2023)
COVID Vaccine doses distributed (Sep 19, 2023)
COVID Vaccine doses administered (Sep 19, 2023)
Likely homosexual households (%)
Likely homosexual households (% change since 2000)
Likely homosexual households - Lesbian couples (%)
Likely homosexual households - Lesbian couples (% change since 2000)
Likely homosexual households - Gay men (%)
Likely homosexual households - Gay men (% change since 2000)
Cost of living index
Median gross rent ($)
Median contract rent ($)
Median monthly housing costs ($)
Median house or condo value ($)
Median house or condo value ($ change since 2000)
Mean house or condo value by units in structure - 1, detached ($)
Mean house or condo value by units in structure - 1, attached ($)
Mean house or condo value by units in structure - 2 ($)
Mean house or condo value by units in structure by units in structure - 3 or 4 ($)
Mean house or condo value by units in structure - 5 or more ($)
Mean house or condo value by units in structure - Boat, RV, van, etc. ($)
Mean house or condo value by units in structure - Mobile home ($)
Median house or condo value ($) - White
Median house or condo value ($) - Black or African American
Median house or condo value ($) - Asian
Median house or condo value ($) - Hispanic or Latino
Median house or condo value ($) - American Indian and Alaska Native
Median house or condo value ($) - Multirace
Median house or condo value ($) - Other Race
Median resident age
Resident age diversity
Median resident age - Males
Median resident age - Females
Median resident age - White
Median resident age - Black or African American
Median resident age - Asian
Median resident age - Hispanic or Latino
Median resident age - American Indian and Alaska Native
Median resident age - Multirace
Median resident age - Other Race
Median resident age - Males - White
Median resident age - Males - Black or African American
Median resident age - Males - Asian
Median resident age - Males - Hispanic or Latino
Median resident age - Males - American Indian and Alaska Native
Median resident age - Males - Multirace
Median resident age - Males - Other Race
Median resident age - Females - White
Median resident age - Females - Black or African American
Median resident age - Females - Asian
Median resident age - Females - Hispanic or Latino
Median resident age - Females - American Indian and Alaska Native
Median resident age - Females - Multirace
Median resident age - Females - Other Race
Commute - mean travel time to work (minutes)
Travel time to work - Less than 5 minutes (%)
Travel time to work - Less than 5 minutes (% change since 2000)
Travel time to work - 5 to 9 minutes (%)
Travel time to work - 5 to 9 minutes (% change since 2000)
Travel time to work - 10 to 19 minutes (%)
Travel time to work - 10 to 19 minutes (% change since 2000)
Travel time to work - 20 to 29 minutes (%)
Travel time to work - 20 to 29 minutes (% change since 2000)
Travel time to work - 30 to 39 minutes (%)
Travel time to work - 30 to 39 minutes (% change since 2000)
Travel time to work - 40 to 59 minutes (%)
Travel time to work - 40 to 59 minutes (% change since 2000)
Travel time to work - 60 to 89 minutes (%)
Travel time to work - 60 to 89 minutes (% change since 2000)
Travel time to work - 90 or more minutes (%)
Travel time to work - 90 or more minutes (% change since 2000)
Marital status - Never married (%)
Marital status - Now married (%)
Marital status - Separated (%)
Marital status - Widowed (%)
Marital status - Divorced (%)
Median family income ($)
Median family income (% change since 2000)
Median non-family income ($)
Median non-family income (% change since 2000)
Median per capita income ($)
Median per capita income (% change since 2000)
Median family income ($) - White
Median family income ($) - Black or African American
Median family income ($) - Asian
Median family income ($) - Hispanic or Latino
Median family income ($) - American Indian and Alaska Native
Median family income ($) - Multirace
Median family income ($) - Other Race
Median year house/condo built
Median year apartment built
Year house built - Built 2005 or later (%)
Year house built - Built 2000 to 2004 (%)
Year house built - Built 1990 to 1999 (%)
Year house built - Built 1980 to 1989 (%)
Year house built - Built 1970 to 1979 (%)
Year house built - Built 1960 to 1969 (%)
Year house built - Built 1950 to 1959 (%)
Year house built - Built 1940 to 1949 (%)
Year house built - Built 1939 or earlier (%)
Average household size
Household density (households per square mile)
Average household size - White
Average household size - Black or African American
Average household size - Asian
Average household size - Hispanic or Latino
Average household size - American Indian and Alaska Native
Average household size - Multirace
Average household size - Other Race
Occupied housing units (%)
Vacant housing units (%)
Owner occupied housing units (%)
Renter occupied housing units (%)
Vacancy status - For rent (%)
Vacancy status - For sale only (%)
Vacancy status - Rented or sold, not occupied (%)
Vacancy status - For seasonal, recreational, or occasional use (%)
Vacancy status - For migrant workers (%)
Vacancy status - Other vacant (%)
Residents with income below the poverty level (%)
Residents with income below 50% of the poverty level (%)
Children below poverty level (%)
Poor families by family type - Married-couple family (%)
Poor families by family type - Male, no wife present (%)
Poor families by family type - Female, no husband present (%)
Poverty status for native-born residents (%)
Poverty status for foreign-born residents (%)
Poverty among high school graduates not in families (%)
Poverty among people who did not graduate high school not in families (%)
Residents with income below the poverty level (%) - White
Residents with income below the poverty level (%) - Black or African American
Residents with income below the poverty level (%) - Asian
Residents with income below the poverty level (%) - Hispanic or Latino
Residents with income below the poverty level (%) - American Indian and Alaska Native
Residents with income below the poverty level (%) - Multirace
Residents with income below the poverty level (%) - Other Race
Air pollution - Air Quality Index (AQI)
Air pollution - CO
Air pollution - NO2
Air pollution - SO2
Air pollution - Ozone
Air pollution - PM10
Air pollution - PM25
Air pollution - Pb
Crime - Murders per 100,000 population
Crime - Rapes per 100,000 population
Crime - Robberies per 100,000 population
Crime - Assaults per 100,000 population
Crime - Burglaries per 100,000 population
Crime - Thefts per 100,000 population
Crime - Auto thefts per 100,000 population
Crime - Arson per 100,000 population
Crime - City-data.com crime index
Crime - Violent crime index
Crime - Property crime index
Crime - Murders per 100,000 population (5 year average)
Crime - Rapes per 100,000 population (5 year average)
Crime - Robberies per 100,000 population (5 year average)
Crime - Assaults per 100,000 population (5 year average)
Crime - Burglaries per 100,000 population (5 year average)
Crime - Thefts per 100,000 population (5 year average)
Crime - Auto thefts per 100,000 population (5 year average)
Crime - Arson per 100,000 population (5 year average)
Crime - City-data.com crime index (5 year average)
Crime - Violent crime index (5 year average)
Crime - Property crime index (5 year average)
1996 Presidential Elections Results (%) - Democratic Party (Clinton)
1996 Presidential Elections Results (%) - Republican Party (Dole)
1996 Presidential Elections Results (%) - Other
2000 Presidential Elections Results (%) - Democratic Party (Gore)
2000 Presidential Elections Results (%) - Republican Party (Bush)
2000 Presidential Elections Results (%) - Other
2004 Presidential Elections Results (%) - Democratic Party (Kerry)
2004 Presidential Elections Results (%) - Republican Party (Bush)
2004 Presidential Elections Results (%) - Other
2008 Presidential Elections Results (%) - Democratic Party (Obama)
2008 Presidential Elections Results (%) - Republican Party (McCain)
2008 Presidential Elections Results (%) - Other
2012 Presidential Elections Results (%) - Democratic Party (Obama)
2012 Presidential Elections Results (%) - Republican Party (Romney)
2012 Presidential Elections Results (%) - Other
2016 Presidential Elections Results (%) - Democratic Party (Clinton)
2016 Presidential Elections Results (%) - Republican Party (Trump)
2016 Presidential Elections Results (%) - Other
2020 Presidential Elections Results (%) - Democratic Party (Biden)
2020 Presidential Elections Results (%) - Republican Party (Trump)
2020 Presidential Elections Results (%) - Other
Ancestries Reported - Arab (%)
Ancestries Reported - Czech (%)
Ancestries Reported - Danish (%)
Ancestries Reported - Dutch (%)
Ancestries Reported - English (%)
Ancestries Reported - French (%)
Ancestries Reported - French Canadian (%)
Ancestries Reported - German (%)
Ancestries Reported - Greek (%)
Ancestries Reported - Hungarian (%)
Ancestries Reported - Irish (%)
Ancestries Reported - Italian (%)
Ancestries Reported - Lithuanian (%)
Ancestries Reported - Norwegian (%)
Ancestries Reported - Polish (%)
Ancestries Reported - Portuguese (%)
Ancestries Reported - Russian (%)
Ancestries Reported - Scotch-Irish (%)
Ancestries Reported - Scottish (%)
Ancestries Reported - Slovak (%)
Ancestries Reported - Subsaharan African (%)
Ancestries Reported - Swedish (%)
Ancestries Reported - Swiss (%)
Ancestries Reported - Ukrainian (%)
Ancestries Reported - United States (%)
Ancestries Reported - Welsh (%)
Ancestries Reported - West Indian (%)
Ancestries Reported - Other (%)
Educational Attainment - No schooling completed (%)
Educational Attainment - Less than high school (%)
Educational Attainment - High school or equivalent (%)
Educational Attainment - Less than 1 year of college (%)
Educational Attainment - 1 or more years of college (%)
Educational Attainment - Associate degree (%)
Educational Attainment - Bachelor's degree (%)
Educational Attainment - Master's degree (%)
Educational Attainment - Professional school degree (%)
Educational Attainment - Doctorate degree (%)
School Enrollment - Nursery, preschool (%)
School Enrollment - Kindergarten (%)
School Enrollment - Grade 1 to 4 (%)
School Enrollment - Grade 5 to 8 (%)
School Enrollment - Grade 9 to 12 (%)
School Enrollment - College undergrad (%)
School Enrollment - Graduate or professional (%)
School Enrollment - Not enrolled in school (%)
School enrollment - Public schools (%)
School enrollment - Private schools (%)
School enrollment - Not enrolled (%)
Median number of rooms in houses and condos
Median number of rooms in apartments
Housing units lacking complete plumbing facilities (%)
Housing units lacking complete kitchen facilities (%)
Density of houses
Urban houses (%)
Rural houses (%)
Households with people 60 years and over (%)
Households with people 65 years and over (%)
Households with people 75 years and over (%)
Households with one or more nonrelatives (%)
Households with no nonrelatives (%)
Population in households (%)
Family households (%)
Nonfamily households (%)
Population in families (%)
Family households with own children (%)
Median number of bedrooms in owner occupied houses
Mean number of bedrooms in owner occupied houses
Median number of bedrooms in renter occupied houses
Mean number of bedrooms in renter occupied houses
Median number of vehichles in owner occupied houses
Mean number of vehichles in owner occupied houses
Median number of vehichles in renter occupied houses
Mean number of vehichles in renter occupied houses
Mortgage status - with mortgage (%)
Mortgage status - with second mortgage (%)
Mortgage status - with home equity loan (%)
Mortgage status - with both second mortgage and home equity loan (%)
Mortgage status - without a mortgage (%)
Average family size
Average family size - White
Average family size - Black or African American
Average family size - Asian
Average family size - Hispanic or Latino
Average family size - American Indian and Alaska Native
Average family size - Multirace
Average family size - Other Race
Geographical mobility - Same house 1 year ago (%)
Geographical mobility - Moved within same county (%)
Geographical mobility - Moved from different county within same state (%)
Geographical mobility - Moved from different state (%)
Geographical mobility - Moved from abroad (%)
Place of birth - Born in state of residence (%)
Place of birth - Born in other state (%)
Place of birth - Native, outside of US (%)
Place of birth - Foreign born (%)
Housing units in structures - 1, detached (%)
Housing units in structures - 1, attached (%)
Housing units in structures - 2 (%)
Housing units in structures - 3 or 4 (%)
Housing units in structures - 5 to 9 (%)
Housing units in structures - 10 to 19 (%)
Housing units in structures - 20 to 49 (%)
Housing units in structures - 50 or more (%)
Housing units in structures - Mobile home (%)
Housing units in structures - Boat, RV, van, etc. (%)
House/condo owner moved in on average (years ago)
Renter moved in on average (years ago)
Year householder moved into unit - Moved in 1999 to March 2000 (%)
Year householder moved into unit - Moved in 1995 to 1998 (%)
Year householder moved into unit - Moved in 1990 to 1994 (%)
Year householder moved into unit - Moved in 1980 to 1989 (%)
Year householder moved into unit - Moved in 1970 to 1979 (%)
Year householder moved into unit - Moved in 1969 or earlier (%)
Means of transportation to work - Drove car alone (%)
Means of transportation to work - Carpooled (%)
Means of transportation to work - Public transportation (%)
Means of transportation to work - Bus or trolley bus (%)
Means of transportation to work - Streetcar or trolley car (%)
Means of transportation to work - Subway or elevated (%)
Means of transportation to work - Railroad (%)
Means of transportation to work - Ferryboat (%)
Means of transportation to work - Taxicab (%)
Means of transportation to work - Motorcycle (%)
Means of transportation to work - Bicycle (%)
Means of transportation to work - Walked (%)
Means of transportation to work - Other means (%)
Working at home (%)
Industry diversity
Most Common Industries - Agriculture, forestry, fishing and hunting, and mining (%)
Most Common Industries - Agriculture, forestry, fishing and hunting (%)
Most Common Industries - Mining, quarrying, and oil and gas extraction (%)
Most Common Industries - Construction (%)
Most Common Industries - Manufacturing (%)
Most Common Industries - Wholesale trade (%)
Most Common Industries - Retail trade (%)
Most Common Industries - Transportation and warehousing, and utilities (%)
Most Common Industries - Transportation and warehousing (%)
Most Common Industries - Utilities (%)
Most Common Industries - Information (%)
Most Common Industries - Finance and insurance, and real estate and rental and leasing (%)
Most Common Industries - Finance and insurance (%)
Most Common Industries - Real estate and rental and leasing (%)
Most Common Industries - Professional, scientific, and management, and administrative and waste management services (%)
Most Common Industries - Professional, scientific, and technical services (%)
Most Common Industries - Management of companies and enterprises (%)
Most Common Industries - Administrative and support and waste management services (%)
Most Common Industries - Educational services, and health care and social assistance (%)
Most Common Industries - Educational services (%)
Most Common Industries - Health care and social assistance (%)
Most Common Industries - Arts, entertainment, and recreation, and accommodation and food services (%)
Most Common Industries - Arts, entertainment, and recreation (%)
Most Common Industries - Accommodation and food services (%)
Most Common Industries - Other services, except public administration (%)
Most Common Industries - Public administration (%)
Occupation diversity
Most Common Occupations - Management, business, science, and arts occupations (%)
Most Common Occupations - Management, business, and financial occupations (%)
Most Common Occupations - Management occupations (%)
Most Common Occupations - Business and financial operations occupations (%)
Most Common Occupations - Computer, engineering, and science occupations (%)
Most Common Occupations - Computer and mathematical occupations (%)
Most Common Occupations - Architecture and engineering occupations (%)
Most Common Occupations - Life, physical, and social science occupations (%)
Most Common Occupations - Education, legal, community service, arts, and media occupations (%)
Most Common Occupations - Community and social service occupations (%)
Most Common Occupations - Legal occupations (%)
Most Common Occupations - Education, training, and library occupations (%)
Most Common Occupations - Arts, design, entertainment, sports, and media occupations (%)
Most Common Occupations - Healthcare practitioners and technical occupations (%)
Most Common Occupations - Health diagnosing and treating practitioners and other technical occupations (%)
Most Common Occupations - Health technologists and technicians (%)
Most Common Occupations - Service occupations (%)
Most Common Occupations - Healthcare support occupations (%)
Most Common Occupations - Protective service occupations (%)
Most Common Occupations - Fire fighting and prevention, and other protective service workers including supervisors (%)
Most Common Occupations - Law enforcement workers including supervisors (%)
Most Common Occupations - Food preparation and serving related occupations (%)
Most Common Occupations - Building and grounds cleaning and maintenance occupations (%)
Most Common Occupations - Personal care and service occupations (%)
Most Common Occupations - Sales and office occupations (%)
Most Common Occupations - Sales and related occupations (%)
Most Common Occupations - Office and administrative support occupations (%)
Most Common Occupations - Natural resources, construction, and maintenance occupations (%)
Most Common Occupations - Farming, fishing, and forestry occupations (%)
Most Common Occupations - Construction and extraction occupations (%)
Most Common Occupations - Installation, maintenance, and repair occupations (%)
Most Common Occupations - Production, transportation, and material moving occupations (%)
Most Common Occupations - Production occupations (%)
Most Common Occupations - Transportation occupations (%)
Most Common Occupations - Material moving occupations (%)
People in Group quarters - Institutionalized population (%)
People in Group quarters - Correctional institutions (%)
People in Group quarters - Federal prisons and detention centers (%)
People in Group quarters - Halfway houses (%)
People in Group quarters - Local jails and other confinement facilities (including police lockups) (%)
People in Group quarters - Military disciplinary barracks (%)
People in Group quarters - State prisons (%)
People in Group quarters - Other types of correctional institutions (%)
People in Group quarters - Nursing homes (%)
People in Group quarters - Hospitals/wards, hospices, and schools for the handicapped (%)
People in Group quarters - Hospitals/wards and hospices for chronically ill (%)
People in Group quarters - Hospices or homes for chronically ill (%)
People in Group quarters - Military hospitals or wards for chronically ill (%)
People in Group quarters - Other hospitals or wards for chronically ill (%)
People in Group quarters - Hospitals or wards for drug/alcohol abuse (%)
People in Group quarters - Mental (Psychiatric) hospitals or wards (%)
People in Group quarters - Schools, hospitals, or wards for the mentally retarded (%)
People in Group quarters - Schools, hospitals, or wards for the physically handicapped (%)
People in Group quarters - Institutions for the deaf (%)
People in Group quarters - Institutions for the blind (%)
People in Group quarters - Orthopedic wards and institutions for the physically handicapped (%)
People in Group quarters - Wards in general hospitals for patients who have no usual home elsewhere (%)
People in Group quarters - Wards in military hospitals for patients who have no usual home elsewhere (%)
People in Group quarters - Juvenile institutions (%)
People in Group quarters - Long-term care (%)
People in Group quarters - Homes for abused, dependent, and neglected children (%)
People in Group quarters - Residential treatment centers for emotionally disturbed children (%)
People in Group quarters - Training schools for juvenile delinquents (%)
People in Group quarters - Short-term care, detention or diagnostic centers for delinquent children (%)
People in Group quarters - Type of juvenile institution unknown (%)
People in Group quarters - Noninstitutionalized population (%)
People in Group quarters - College dormitories (includes college quarters off campus) (%)
People in Group quarters - Military quarters (%)
People in Group quarters - On base (%)
People in Group quarters - Barracks, unaccompanied personnel housing (UPH), (Enlisted/Officer), ;and similar group living quarters for military personnel (%)
People in Group quarters - Transient quarters for temporary residents (%)
People in Group quarters - Military ships (%)
People in Group quarters - Group homes (%)
People in Group quarters - Homes or halfway houses for drug/alcohol abuse (%)
People in Group quarters - Homes for the mentally ill (%)
People in Group quarters - Homes for the mentally retarded (%)
People in Group quarters - Homes for the physically handicapped (%)
People in Group quarters - Other group homes (%)
People in Group quarters - Religious group quarters (%)
People in Group quarters - Dormitories (%)
People in Group quarters - Agriculture workers' dormitories on farms (%)
People in Group quarters - Job Corps and vocational training facilities (%)
People in Group quarters - Other workers' dormitories (%)
People in Group quarters - Crews of maritime vessels (%)
People in Group quarters - Other nonhousehold living situations (%)
People in Group quarters - Other noninstitutional group quarters (%)
Residents speaking English at home (%)
Residents speaking English at home - Born in the United States (%)
Residents speaking English at home - Native, born elsewhere (%)
Residents speaking English at home - Foreign born (%)
Residents speaking Spanish at home (%)
Residents speaking Spanish at home - Born in the United States (%)
Residents speaking Spanish at home - Native, born elsewhere (%)
Residents speaking Spanish at home - Foreign born (%)
Residents speaking other language at home (%)
Residents speaking other language at home - Born in the United States (%)
Residents speaking other language at home - Native, born elsewhere (%)
Residents speaking other language at home - Foreign born (%)
Class of Workers - Employee of private company (%)
Class of Workers - Self-employed in own incorporated business (%)
Class of Workers - Private not-for-profit wage and salary workers (%)
Class of Workers - Local government workers (%)
Class of Workers - State government workers (%)
Class of Workers - Federal government workers (%)
Class of Workers - Self-employed workers in own not incorporated business and Unpaid family workers (%)
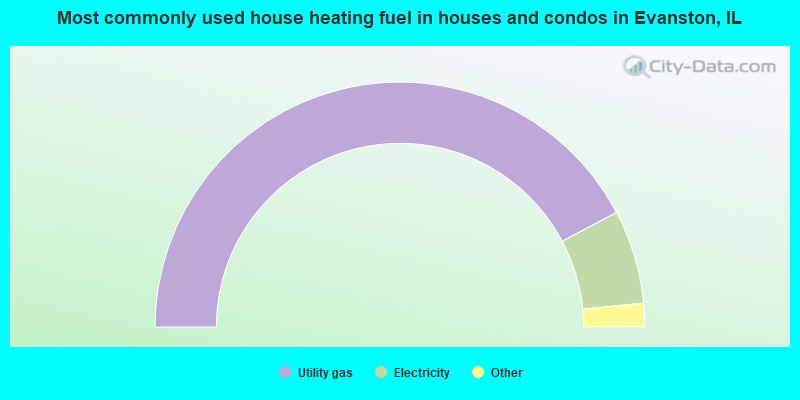
House heating fuel used in houses and condos - Utility gas (%)
House heating fuel used in houses and condos - Bottled, tank, or LP gas (%)
House heating fuel used in houses and condos - Electricity (%)
House heating fuel used in houses and condos - Fuel oil, kerosene, etc. (%)
House heating fuel used in houses and condos - Coal or coke (%)
House heating fuel used in houses and condos - Wood (%)
House heating fuel used in houses and condos - Solar energy (%)
House heating fuel used in houses and condos - Other fuel (%)
House heating fuel used in houses and condos - No fuel used (%)
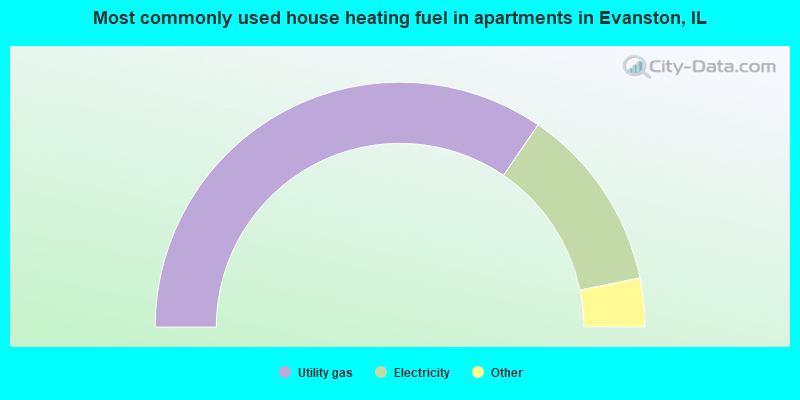
House heating fuel used in apartments - Utility gas (%)
House heating fuel used in apartments - Bottled, tank, or LP gas (%)
House heating fuel used in apartments - Electricity (%)
House heating fuel used in apartments - Fuel oil, kerosene, etc. (%)
House heating fuel used in apartments - Coal or coke (%)
House heating fuel used in apartments - Wood (%)
House heating fuel used in apartments - Solar energy (%)
House heating fuel used in apartments - Other fuel (%)
House heating fuel used in apartments - No fuel used (%)
Armed forces status - In Armed Forces (%)
Armed forces status - Civilian (%)
Armed forces status - Civilian - Veteran (%)
Armed forces status - Civilian - Nonveteran (%)
Fatal accidents locations in years 2005-2021
Fatal accidents locations in 2005
Fatal accidents locations in 2006
Fatal accidents locations in 2007
Fatal accidents locations in 2008
Fatal accidents locations in 2009
Fatal accidents locations in 2010
Fatal accidents locations in 2011
Fatal accidents locations in 2012
Fatal accidents locations in 2013
Fatal accidents locations in 2014
Fatal accidents locations in 2015
Fatal accidents locations in 2016
Fatal accidents locations in 2017
Fatal accidents locations in 2018
Fatal accidents locations in 2019
Fatal accidents locations in 2020
Fatal accidents locations in 2021
Alcohol use - People drinking some alcohol every month (%)
Alcohol use - People not drinking at all (%)
Alcohol use - Average days/month drinking alcohol
Alcohol use - Average drinks/week
Alcohol use - Average days/year people drink much
Audiometry - Average condition of hearing (%)
Audiometry - People that can hear a whisper from across a quiet room (%)
Audiometry - People that can hear normal voice from across a quiet room (%)
Audiometry - Ears ringing, roaring, buzzing (%)
Audiometry - Had a job exposure to loud noise (%)
Audiometry - Had off-work exposure to loud noise (%)
Blood Pressure & Cholesterol - Has high blood pressure (%)
Blood Pressure & Cholesterol - Checking blood pressure at home (%)
Blood Pressure & Cholesterol - Frequently checking blood cholesterol (%)
Blood Pressure & Cholesterol - Has high cholesterol level (%)
Consumer Behavior - Money monthly spent on food at supermarket/grocery store
Consumer Behavior - Money monthly spent on food at other stores
Consumer Behavior - Money monthly spent on eating out
Consumer Behavior - Money monthly spent on carryout/delivered foods
Consumer Behavior - Income spent on food at supermarket/grocery store (%)
Consumer Behavior - Income spent on food at other stores (%)
Consumer Behavior - Income spent on eating out (%)
Consumer Behavior - Income spent on carryout/delivered foods (%)
Current Health Status - General health condition (%)
Current Health Status - Blood donors (%)
Current Health Status - Has blood ever tested for HIV virus (%)
Current Health Status - Left-handed people (%)
Dermatology - People using sunscreen (%)
Diabetes - Diabetics (%)
Diabetes - Had a blood test for high blood sugar (%)
Diabetes - People taking insulin (%)
Diet Behavior & Nutrition - Diet health (%)
Diet Behavior & Nutrition - Milk product consumption (# of products/month)
Diet Behavior & Nutrition - Meals not home prepared (#/week)
Diet Behavior & Nutrition - Meals from fast food or pizza place (#/week)
Diet Behavior & Nutrition - Ready-to-eat foods (#/month)
Diet Behavior & Nutrition - Frozen meals/pizza (#/month)
Drug Use - People that ever used marijuana or hashish (%)
Drug Use - Ever used hard drugs (%)
Drug Use - Ever used any form of cocaine (%)
Drug Use - Ever used heroin (%)
Drug Use - Ever used methamphetamine (%)
Health Insurance - People covered by health insurance (%)
Kidney Conditions-Urology - Avg. # of times urinating at night
Medical Conditions - People with asthma (%)
Medical Conditions - People with anemia (%)
Medical Conditions - People with psoriasis (%)
Medical Conditions - People with overweight (%)
Medical Conditions - Elderly people having difficulties in thinking or remembering (%)
Medical Conditions - People who ever received blood transfusion (%)
Medical Conditions - People having trouble seeing even with glass/contacts (%)
Medical Conditions - People with arthritis (%)
Medical Conditions - People with gout (%)
Medical Conditions - People with congestive heart failure (%)
Medical Conditions - People with coronary heart disease (%)
Medical Conditions - People with angina pectoris (%)
Medical Conditions - People who ever had heart attack (%)
Medical Conditions - People who ever had stroke (%)
Medical Conditions - People with emphysema (%)
Medical Conditions - People with thyroid problem (%)
Medical Conditions - People with chronic bronchitis (%)
Medical Conditions - People with any liver condition (%)
Medical Conditions - People who ever had cancer or malignancy (%)
Mental Health - People who have little interest in doing things (%)
Mental Health - People feeling down, depressed, or hopeless (%)
Mental Health - People who have trouble sleeping or sleeping too much (%)
Mental Health - People feeling tired or having little energy (%)
Mental Health - People with poor appetite or overeating (%)
Mental Health - People feeling bad about themself (%)
Mental Health - People who have trouble concentrating on things (%)
Mental Health - People moving or speaking slowly or too fast (%)
Mental Health - People having thoughts they would be better off dead (%)
Oral Health - Average years since last visit a dentist
Oral Health - People embarrassed because of mouth (%)
Oral Health - People with gum disease (%)
Oral Health - General health of teeth and gums (%)
Oral Health - Average days a week using dental floss/device
Oral Health - Average days a week using mouthwash for dental problem
Oral Health - Average number of teeth
Pesticide Use - Households using pesticides to control insects (%)
Pesticide Use - Households using pesticides to kill weeds (%)
Physical Activity - People doing vigorous-intensity work activities (%)
Physical Activity - People doing moderate-intensity work activities (%)
Physical Activity - People walking or bicycling (%)
Physical Activity - People doing vigorous-intensity recreational activities (%)
Physical Activity - People doing moderate-intensity recreational activities (%)
Physical Activity - Average hours a day doing sedentary activities
Physical Activity - Average hours a day watching TV or videos
Physical Activity - Average hours a day using computer
Physical Functioning - People having limitations keeping them from working (%)
Physical Functioning - People limited in amount of work they can do (%)
Physical Functioning - People that need special equipment to walk (%)
Physical Functioning - People experiencing confusion/memory problems (%)
Physical Functioning - People requiring special healthcare equipment (%)
Prescription Medications - Average number of prescription medicines taking
Preventive Aspirin Use - Adults 40+ taking low-dose aspirin (%)
Reproductive Health - Vaginal deliveries (%)
Reproductive Health - Cesarean deliveries (%)
Reproductive Health - Deliveries resulted in a live birth (%)
Reproductive Health - Pregnancies resulted in a delivery (%)
Reproductive Health - Women breastfeeding newborns (%)
Reproductive Health - Women that had a hysterectomy (%)
Reproductive Health - Women that had both ovaries removed (%)
Reproductive Health - Women that have ever taken birth control pills (%)
Reproductive Health - Women taking birth control pills (%)
Reproductive Health - Women that have ever used Depo-Provera or injectables (%)
Reproductive Health - Women that have ever used female hormones (%)
Sexual Behavior - People 18+ that ever had sex (vaginal, anal, or oral) (%)
Sexual Behavior - Males 18+ that ever had vaginal sex with a woman (%)
Sexual Behavior - Males 18+ that ever performed oral sex on a woman (%)
Sexual Behavior - Males 18+ that ever had anal sex with a woman (%)
Sexual Behavior - Males 18+ that ever had any sex with a man (%)
Sexual Behavior - Females 18+ that ever had vaginal sex with a man (%)
Sexual Behavior - Females 18+ that ever performed oral sex on a man (%)
Sexual Behavior - Females 18+ that ever had anal sex with a man (%)
Sexual Behavior - Females 18+ that ever had any kind of sex with a woman (%)
Sexual Behavior - Average age people first had sex
Sexual Behavior - Average number of female sex partners in lifetime (males 18+)
Sexual Behavior - Average number of female vaginal sex partners in lifetime (males 18+)
Sexual Behavior - Average age people first performed oral sex on a woman (18+)
Sexual Behavior - Average number of woman performed oral sex on in lifetime (18+)
Sexual Behavior - Average number of male sex partners in lifetime (males 18+)
Sexual Behavior - Average number of male anal sex partners in lifetime (males 18+)
Sexual Behavior - Average age people first performed oral sex on a man (18+)
Sexual Behavior - Average number of male oral sex partners in lifetime (18+)
Sexual Behavior - People using protection when performing oral sex (%)
Sexual Behavior - Average number of times people have vaginal or anal sex a year
Sexual Behavior - People having sex without condom (%)
Sexual Behavior - Average number of male sex partners in lifetime (females 18+)
Sexual Behavior - Average number of male vaginal sex partners in lifetime (females 18+)
Sexual Behavior - Average number of female sex partners in lifetime (females 18+)
Sexual Behavior - Circumcised males 18+ (%)
Sleep Disorders - Average hours sleeping at night
Sleep Disorders - People that has trouble sleeping (%)
Smoking-Cigarette Use - People smoking cigarettes (%)
Taste & Smell - People 40+ having problems with smell (%)
Taste & Smell - People 40+ having problems with taste (%)
Taste & Smell - People 40+ that ever had wisdom teeth removed (%)
Taste & Smell - People 40+ that ever had tonsils teeth removed (%)
Taste & Smell - People 40+ that ever had a loss of consciousness because of a head injury (%)
Taste & Smell - People 40+ that ever had a broken nose or other serious injury to face or skull (%)
Taste & Smell - People 40+ that ever had two or more sinus infections (%)
Weight - Average height (inches)
Weight - Average weight (pounds)
Weight - Average BMI
Weight - People that are obese (%)
Weight - People that ever were obese (%)
Weight - People trying to lose weight (%)
According to our research of Illinois and other state lists, there were 17 registered sex offenders living in Evanston, Illinois as of April 27, 2024 . The ratio of all residents to sex offenders in Evanston is 4,419 to 1.The ratio of registered sex offenders to all residents in this city is much lower than the state average.
The City-Data.com crime index weighs serious crimes and violent crimes more heavily. Higher means more crime, U.S. average is 246.1. It adjusts for the number of visitors and daily workers commuting into cities.
- means the value is smaller than the state average.
- means the value is about the same as the state average.
- means the value is bigger than the state average.
- means the value is much bigger than the state average.
Crime rate in Evanston detailed stats: murders, rapes, robberies, assaults, burglaries, thefts, arson Officers per 1,000 residents here:
1.62Illinois average:
3.04
Latest news from Evanston, IL collected exclusively by city-data.com from local newspapers, TV, and radio stations
Ancestries: German (6.5%), Irish (4.0%), Polish (4.0%), European (3.3%), American (3.1%), English (3.1%).
Current Local Time:
Incorporated on 12/14/1872
Land area: 7.75 square miles.
Population density: 9,753 people per square mile (high).
12,482 residents are foreign born (6.2% Asia , 4.2% Latin America , 3.4% Europe , 2.1% Africa ).
This city:
16.5%Illinois:
14.1%
Median real estate property taxes paid for housing units with mortgages in 2022: $7,871 (1.8%)Median real estate property taxes paid for housing units with no mortgage in 2022: $9,430 (2.1%)
Nearest city with pop. 200,000+: Chicago, IL
Nearest cities:
Latitude: 42.05 N, Longitude: 87.69 W
Daytime population change due to commuting: +13,302 (+17.6%)Workers who live and work in this city: 20,235 (52.7%)
Evanston tourist attractions:
Single-family new house construction building permits:
2022: 6 buildings , average cost: $535,5002021: 11 buildings , average cost: $1,057,7002020: 5 buildings , average cost: $239,8002019: 14 buildings , average cost: $414,4002018: 4 buildings , average cost: $1,094,7002017: 8 buildings , average cost: $427,4002016: 12 buildings , average cost: $696,0002015: 17 buildings , average cost: $489,8002014: 19 buildings , average cost: $353,6002013: 7 buildings , average cost: $700,0002012: 7 buildings , average cost: $700,0002011: 11 buildings , average cost: $233,7002010: 10 buildings , average cost: $233,7002009: 9 buildings , average cost: $233,7002008: 10 buildings , average cost: $233,7002007: 16 buildings , average cost: $233,8002006: 19 buildings , average cost: $233,0002005: 25 buildings , average cost: $237,1002004: 29 buildings , average cost: $221,8002003: 13 buildings , average cost: $349,2002002: 10 buildings , average cost: $441,5002001: 18 buildings , average cost: $166,7002000: 2 buildings , average cost: $222,5001999: 3 buildings , average cost: $293,7001998: 5 buildings , average cost: $341,0001997: 7 buildings , average cost: $212,300Unemployment in December 2023:
Population change in the 1990s: +1,081 (+1.5%).
Most common industries in Evanston, IL (%)
Both Males Females
Educational services (20.2%)
Professional, scientific, technical services (14.7%)
Health care (10.0%)
Finance & insurance (6.1%)
Religious, grantmaking, civic, professional, similar organizations (3.3%)
Administrative & support & waste management services (3.1%)
Arts, entertainment, recreation (3.0%)
Professional, scientific, technical services (17.1%)
Educational services (16.6%)
Finance & insurance (7.8%)
Health care (5.5%)
Construction (3.3%)
Administrative & support & waste management services (3.1%)
Religious, grantmaking, civic, professional, similar organizations (3.0%)
Educational services (23.7%)
Health care (14.3%)
Professional, scientific, technical services (12.4%)
Finance & insurance (4.5%)
Social assistance (3.9%)
Religious, grantmaking, civic, professional, similar organizations (3.6%)
Arts, entertainment, recreation (3.2%)
Most common occupations in Evanston, IL (%)
Both Males Females
Postsecondary teachers (7.5%)
Other management occupations, except farmers and farm managers (6.4%)
Computer specialists (3.9%)
Other office and administrative support workers, including supervisors (3.0%)
Building and grounds cleaning and maintenance occupations (2.7%)
Cooks and food preparation workers (2.6%)
Counselors, social workers, and other community and social service specialists (2.6%)
Postsecondary teachers (9.4%)
Other management occupations, except farmers and farm managers (7.4%)
Computer specialists (6.1%)
Building and grounds cleaning and maintenance occupations (3.4%)
Cooks and food preparation workers (3.0%)
Entertainers and performers, sports, and related workers (3.0%)
Lawyers (2.8%)
Postsecondary teachers (5.6%)
Other management occupations, except farmers and farm managers (5.4%)
Other office and administrative support workers, including supervisors (4.1%)
Counselors, social workers, and other community and social service specialists (3.7%)
Secretaries and administrative assistants (3.7%)
Information and record clerks, except customer service representatives (2.8%)
Media and communications workers (2.8%)
Tornado activity:
Evanston-area historical tornado activity is slightly below Illinois state average. It is 35% greater than the overall U.S. average.
On 9/28/1972, a category F4 (max. wind speeds 207-260 mph) tornado 18.5 miles away from the Evanston city center injured 20 people and caused between $500,000 and $5,000,000 in damages.
On 4/21/1967, a category F4 tornado 23.1 miles away from the city center killed 33 people and injured 500 people and caused between $5,000,000 and $50,000,000 in damages.
Earthquake activity:
Evanston-area historical earthquake activity is significantly above Illinois state average. It is 31% greater than the overall U.S. average. On 4/18/2008 at 09:36:59, a magnitude 5.4 (5.1 MB, 4.8 MS, 5.4 MW, 5.2 MW, Class: Moderate, Intensity: VI - VII) earthquake occurred 248.8 miles away from Evanston center On 6/10/1987 at 23:48:54, a magnitude 5.1 (4.9 MB, 4.4 MS, 4.6 MS, 5.1 LG) earthquake occurred 223.3 miles away from the city center On 4/18/2008 at 09:36:59, a magnitude 5.2 (5.2 MW, Depth: 8.9 mi) earthquake occurred 248.9 miles away from the city center On 6/28/2004 at 06:10:52, a magnitude 4.2 (4.2 MW, Depth: 6.2 mi, Class: Light, Intensity: IV - V) earthquake occurred 74.3 miles away from the city center On 5/2/2015 at 16:23:07, a magnitude 4.2 (4.2 MW, Depth: 2.8 mi) earthquake occurred 117.0 miles away from Evanston center On 2/10/2010 at 09:59:35, a magnitude 3.8 (3.8 MW, Depth: 6.2 mi, Class: Light, Intensity: II - III) earthquake occurred 41.6 miles away from Evanston center Magnitude types: regional Lg-wave magnitude (LG), body-wave magnitude (MB), surface-wave magnitude (MS), moment magnitude (MW) Natural disasters: The number of natural disasters in Cook County (20) is greater than the US average (15).Major Disasters (Presidential) Declared: 15Emergencies Declared: 4Floods: 13, Storms: 12, Tornadoes: 3, Snowstorms: 2, Winter Storms: 2, Blizzard: 1, Hurricane: 1, Snow: 1, Wind: 1, Other: 1 (Note: some incidents may be assigned to more than one category). Main business address for: NORTHFIELD LABORATORIES INC /DE/ BIOLOGICAL PRODUCTS (NO DIAGNOSTIC SUBSTANCES) ), NATIONAL EQUIPMENT SERVICES INC SERVICES-EQUIPMENT RENTAL & LEASING, NEC ).
Hospitals in Evanston: EVANSTON HOSPITAL (Voluntary non-profit - Other, provides emergency services, 2650 RIDGE AVE) HOSPICE SERVICES OF PRESBYTERIAN HOMES (3200 GRANT STREET) PRESENCE SAINT FRANCIS HOSPITAL (Voluntary non-profit - Church, 355 RIDGE AVE) SAINT FRANCIS HOSPICE (355 RIDGE AVENUE) SHORE HOMES EAST (503 MICHIGAN AVENUE) Nursing Homes in Evanston: ALBANY CARE (901 MAPLE AVENUE) ALDEN ESTATES OF EVANSTON (2520 GROSS POINT ROAD) DOBSON PLAZA (120 DODGE AVENUE) EVANSTON NURSING AND REHAB CTR (1300 OAK AVENUE) GREENWOOD CARE (1406 CHICAGO AVENUE) KENSINGTON HEALTH CARE CTR (820 FOSTER ST) MATHER PAVILION (820 FOSTER STREET) MATHER, THE (425 DAVIS STREET) SARATOGA OF EVANSTON (820 FOSTER AVENUE) ST FRANCIS HSP OF EVANSTON (355 RIDGE AVENUE) Dialysis Facilities in Evanston: DAVITA - EVANSTON RENAL CENTER (1715 CENTRAL STREET) FMC - MIDAMERICA EVANSTON (2953 CENTRAL ST 1ST FLOOR) Home Health Centers in Evanston: ACCELERATED HOME CARE, LLC (828 DAVIS ST SUITE 204) HOME HEALTH SERVICES OF (3200 GRANT AVENUE) ST FRANCIS HOME HEALTH CARE (355 RIDGE AVE) Heliports located in Evanston: Amtrak stations near Evanston: 7 miles: GLENVIEW (1116 DEPOT ST.) Services: ticket office, fully wheelchair accessible, enclosed waiting area, public restrooms, public payphones, free short-term parking, free long-term parking, call for car rental service, taxi stand, public transit connection.
12 miles: CHICAGO (225 S. CANAL ST.) Services: ticket office, partially wheelchair accessible, enclosed waiting area, public restrooms, public payphones, snack bar, paid short-term parking, paid long-term parking, call for car rental service, taxi stand, public transit connection.
19 miles: LA GRANGE ROAD (LA GRANGE, 25 W. BURLINGTON AVE.) Services: enclosed waiting area, public payphones, taxi stand, public transit connection.
Colleges/Universities in Evanston: Northwestern University Full-time enrollment: 17,473; Location: 633 Clark St; Private, not-for-profit; Website: www.northwestern.edu; Offers Doctor's degree )
Garrett-Evangelical Theological Seminary Full-time enrollment: 276; Location: 2121 Sheridan Road; Private, not-for-profit; Website: www.garrett.edu; Offers Doctor's degree )
Pivot Point Academy-Evanston Full-time enrollment: 225; Location: 1560 Sherman Avenue - Suite 700; Private, for-profit; Website: www.pivotpoint.edu)
NorthShore University HealthSystem School of Nurse Anesthesia Full-time enrollment: 62; Location: 2650 Ridge Ave, Rm G603C; Private, not-for-profit; Website: www.northshore.org/academics/other-programs/school-of-nurse-anesthesia/)
Other colleges/universities with over 2000 students near Evanston:
Computer Systems Institute (about 4 miles; Skokie, IL ; Full-time enrollment: 2,311)
BIR Training Center (about 4 miles; Chicago, IL ; FT enrollment: 2,036)
Loyola University Chicago (about 4 miles; Chicago, IL ; FT enrollment: 13,233)
Northeastern Illinois University (about 5 miles; Chicago, IL ; FT enrollment: 8,004)
North Park University (about 5 miles; Chicago, IL ; FT enrollment: 2,622)
City Colleges of Chicago-Harry S Truman College (about 6 miles; Chicago, IL ; FT enrollment: 9,050)
DeVry University-Illinois (about 8 miles; Chicago, IL ; FT enrollment: 26,380)
Public high school in Evanston:
Private high school in Evanston: ROYCEMORE SCHOOL Students: 260, Location: 640 LINCOLN ST, Grades: PK-12)
Biggest public elementary/middle schools in Evanston: HAVEN MIDDLE SCHOOL Students: 631, Location: 2417 PRAIRIE AVE, Grades: 6-8)CHUTE MIDDLE SCHOOL Students: 538, Location: 1400 OAKTON ST, Grades: 6-8)NICHOLS MIDDLE SCHOOL Students: 493, Location: 800 GREENLEAF ST, Grades: 6-8)WASHINGTON ELEM SCHOOL Students: 437, Location: 914 ASHLAND AVE, Grades: KG-5)OAKTON ELEM SCHOOL Students: 420, Location: 436 RIDGE AVE, Grades: KG-5)LINCOLNWOOD ELEM SCHOOL Students: 385, Location: 2600 COLFAX ST, Grades: KG-5)DAWES ELEMENTARY SCHOOL Students: 358, Location: 440 DODGE AVE, Grades: KG-5)WILLARD ELEM SCHOOL Students: 347, Location: 2700 HURD AVE, Grades: KG-5)KINGSLEY ELEMENTARY SCHOOL Students: 344, Location: 2300 GREEN BAY RD, Grades: KG-5)ORRINGTON ELEM SCHOOL Students: 311, Location: 2636 ORRINGTON AVE, Grades: KG-5)Private elementary/middle schools in Evanston: CHIARAVALLE MONTESSORI SCHOOL Students: 363, Location: 425 DEMPSTER ST, Grades: PK-8)
ST ATHANASIUS ELEMENTARY SCHOOL Students: 342, Location: 2510 ASHLAND AVE, Grades: KG-8)
POPE JOHN XXIII SCHOOL Students: 292, Location: 1120 WASHINGTON ST, Grades: PK-8)
ST JOAN OF ARC ELEMENTARY SCHOOL Students: 214, Location: 9245 LAWNDALE AVE, Grades: PK-8)
THE BARBEREUX SCHOOL Students: 54, Location: 3333 CULVER ST, Grades: PK-T1)
See full list of schools located in Evanston Library in Evanston: EVANSTON PUBLIC LIBRARY Operating income: $5,742,583; Location: 1703 ORRINGTON AVENUE; 486,400 books ; 2,465 e-books ; 24,947 audio materials ; 15,391 video materials ; 12 local licensed databases ; 20 state licensed databases ; 2 other licensed databases ; 814 print serial subscriptions )
User-submitted facts and corrections:
Kendall College is no longer in Evanston
Notable locations in Evanston: (A) , Mens Quadrangle (B) , Peter Jans Golf Course (C) , Dearborn Observatory (D) , McGraw Memorial Hall (E) , Grosspoint Lighthouse (F) , Seeley G. Mudd Science and Engineering Library (G) , Leverone Hall (H) , Arthur Andersen Hall (I) , Donald Jacobs Center (J) , Evanston Fire and Life Safety Services Station 5 (K) , Thomas E Boswell Memorial Library (L) , University Hall (M) , Brown House (N) , Carter House (O) , Superior Air - Ground Ambulance Service (P) , Evanston City Hall (Q) , Fisk Hall (R) , Noyes Culture Arts Center (S) , James L Allen Center (T) . Display/hide their locations on the map
Main business address in Evanston include: (A) , NATIONAL EQUIPMENT SERVICES INC (B) . Display/hide their locations on the map
Churches in Evanston include: (A) , Christ Church of the North Shore (B) , Church of God the New Testament (C) , Faith Temple Church of God in Christ (D) , Saint James Evangelical Lutheran Church (E) , Shalom Center of the Assemblies of God (F) , Unitarian Church of Evanston (G) , Fisher Memorial African Methodist Episcopal Zion Church (H) , First Baptist Church (I) . Display/hide their locations on the map
Cemetery: (1) . Display/hide its location on the map
Parks in Evanston include: (1) , Walter S Lovelace Park (2) , Leahy Park (3) , Raymond Park (4) , Centennial Park (5) , Catherine Waugh McCulloch Park (6) , Ackerman Park (7) , Cawes Park (8) , Cartright Park (9) . Display/hide their locations on the map
Tourist attractions:
Hotels:
Court:
Birthplace of: Reiko Aylesworth - Film actor, Charles Gibson - Broadcast news analyst, Charles L. Mee - Dramatists and playwright, Patrick Stump - Male singer, Charlton Heston - (born 1924), actor, Christopher Calvin Harrison - Choreographer, Marc Dann - Politician, Donald Rumsfeld - (born 1932), defense minister, Eddie Vedder - Musician, Edmund Phelps - Economist.
Cook County has a predicted average indoor radon screening level between 2 and 4 pCi/L (pico curies per liter) - Moderate Potential Drinking water stations with addresses in Evanston that have no violations reported:
EVANSTON (Population served: 74,486, Primary Water Source Type: Surface water)
Average household size: This city:
2.2 peopleIllinois:
2.6 people
Percentage of family households: This city:
52.0%Whole state:
65.8%
Percentage of households with unmarried partners: This city:
5.2%Whole state:
6.3%
Likely homosexual households (counted as self-reported same-sex unmarried-partner households)
Lesbian couples: 0.6% of all households Gay men: 0.5% of all households
People in group quarters in Evanston in 2010:
5,460 people in college/university student housing
1,150 people in nursing facilities/skilled-nursing facilities
155 people in other noninstitutional facilities
59 people in group homes intended for adults
45 people in residential treatment centers for juveniles (non-correctional)
45 people in hospitals with patients who have no usual home elsewhere
45 people in emergency and transitional shelters (with sleeping facilities) for people experiencing homelessness
31 people in local jails and other municipal confinement facilities
16 people in group homes for juveniles (non-correctional)
8 people in workers' group living quarters and job corps centers
5 people in mental (psychiatric) hospitals and psychiatric units in other hospitals
5 people in in-patient hospice facilities
People in group quarters in Evanston in 2000:
5,396 people in college dormitories (includes college quarters off campus)
730 people in other nonhousehold living situations
559 people in nursing homes
104 people in other noninstitutional group quarters
103 people in other group homes
41 people in homes for the mentally retarded
21 people in homes for the mentally ill
10 people in religious group quarters
Arenas or stadiums:
Ryan Field. Capacity: 49,256. Northwestern Wildcats football.
Welsh-Ryan Arena. Northwestern University.
Banks with most branches in Evanston (2011 data):
JPMorgan Chase Bank, National Association: Mcdaniel Banking Center, North Evanston Facility, Evanston-Grove, Orrington, Chicago Avenue Banking Center Branch, Evanston Dominick's. Info updated 2011/11/10: Bank assets: $1,811,678.0 mil, Deposits: $1,190,738.0 mil, headquarters in Columbus, OH, positive income , International Specialization, 5577 total offices , Holding Company: Jpmorgan Chase & Co.
First Bank & Trust: Central Street Branch, at 820 Church Street, Main Street Office Branch, Emerson Street Branch. Info updated 2006/11/03: Bank assets: $745.5 mil, Deposits: $682.8 mil, local headquarters , positive income , Commercial Lending Specialization, 7 total offices , Holding Company: First Evanston Bancorp, Inc.
RBS Citizens, National Association: Evanston Branch, Evanston Branch, Evanston Drive Thru Branch. Info updated 2007/09/19: Bank assets: $106,940.6 mil, Deposits: $75,690.2 mil, headquarters in Providence, RI, positive income , 1135 total offices , Holding Company: Uk Financial Investments Limited
TCF National Bank: Chicago/Greenleaf Jewel Branch #2243 at 1128 Chicago Avenue, branch established on 1996/09/27; Howard/Mccormick Jewel Branch #2241 at 2485 Howard Street, branch established on 1996/09/19. Info updated 2009/11/23: Bank assets: $19,007.0 mil, Deposits: $12,377.0 mil, headquarters in Sioux Falls, SD, positive income , Commercial Lending Specialization, 441 total offices , Holding Company: Tcf Financial Corporation
BMO Harris Bank National Association: Harris Evanston-Central Branch at 2821 East Central Street, branch established on 2007/06/28; Evanston Branch at 1638 Maple Avenue, branch established on 2003/06/30. Info updated 2011/07/14: Bank assets: $97,264.0 mil, Deposits: $75,624.6 mil, headquarters in Chicago, IL, positive income , 717 total offices , Holding Company: Bank Of Montreal
Fifth Third Bank: Evanston Banking Center Branch at 1710 Maple Avenue, branch established on 2004/01/12; Evanston Main Branch at 2440 Main Street, branch established on 2007/12/17. Info updated 2009/10/05: Bank assets: $114,540.4 mil, Deposits: $89,689.1 mil, headquarters in Cincinnati, OH, positive income , Commercial Lending Specialization, 1378 total offices , Holding Company: Fifth Third Bancorp
Bank of America, National Association: Evanston - Sherman And Church Branch at 1705 Sherman Avenue, branch established on 2005/12/27; Evanston Branch at 1336 Chicago Avenue, branch established on 1990/09/24. Info updated 2009/11/18: Bank assets: $1,451,969.3 mil, Deposits: $1,077,176.8 mil, headquarters in Charlotte, NC, positive income , 5782 total offices , Holding Company: Bank Of America Corporation
U.S. Bank National Association: Northwestern University Branch at 2001 Campus Drive, branch established on 2004/08/16. Info updated 2012/01/30: Bank assets: $330,470.8 mil, Deposits: $236,091.5 mil, headquarters in Cincinnati, OH, positive income , 3121 total offices , Holding Company: U.S. Bancorp
PNC Bank, National Association: Evanston Branch at Chicago Avenue, branch established on 2005/01/03. Info updated 2012/03/20: Bank assets: $263,309.6 mil, Deposits: $197,343.0 mil, headquarters in Wilmington, DE, positive income , Commercial Lending Specialization, 3085 total offices , Holding Company: Pnc Financial Services Group, Inc., The
3 other banks with 3 local branches
For population 15 years and over in Evanston:
Never married: 43.9%Now married: 41.1%Separated: 0.4%Widowed: 4.2%Divorced: 10.5% For population 25 years and over in Evanston:
High school or higher: 95.3%Bachelor's degree or higher: 72.1%Graduate or professional degree: 39.7%Unemployed: 4.1%Mean travel time to work (commute): 20.1 minutes
Education Gini index (Inequality in education) Here:
10.5Illinois average:
12.5
Religion statistics for Evanston, IL (based on Cook County data)
Religion Adherents Congregations Catholic 1,947,223 376 Evangelical Protestant 432,975 1,484 Other 312,636 403 Mainline Protestant 202,114 630 Black Protestant 148,895 395 Orthodox 53,276 66 None 2,097,556 -
Source: Clifford Grammich, Kirk Hadaway, Richard Houseal, Dale E.Jones, Alexei Krindatch, Richie Stanley and Richard H.Taylor. 2012. 2010 U.S.Religion Census: Religious Congregations & Membership Study. Association of Statisticians of American Religious Bodies. Jones, Dale E., et al. 2002. Congregations and Membership in the United States 2000. Nashville, TN: Glenmary Research Center. Graphs represent county-level data
Food Environment Statistics: Number of grocery stores : 1,460Cook County :
2.77 / 10,000 pop.State :
2.24 / 10,000 pop.
Number of supercenters and club stores : 23Cook County :
0.04 / 10,000 pop.Illinois :
0.08 / 10,000 pop.
Number of convenience stores (no gas) : 490Here :
0.93 / 10,000 pop.Illinois :
0.75 / 10,000 pop.
Number of convenience stores (with gas) : 806This county :
1.53 / 10,000 pop.Illinois :
2.61 / 10,000 pop.
Number of full-service restaurants : 3,516Cook County :
6.67 / 10,000 pop.State :
6.86 / 10,000 pop.
Adult diabetes rate : Cook County :
8.4%State :
8.3%
Adult obesity rate : Cook County :
23.5%Illinois :
25.2%
Low-income preschool obesity rate : Health and Nutrition:
Average overall health of teeth and gums : This city:
54.3%State:
47.2%
Average BMI : This city:
27.9Illinois:
28.6
People feeling badly about themselves : This city:
18.1%Illinois:
20.5%
People not drinking alcohol at all : Evanston:
9.9%Illinois:
10.8%
Average hours sleeping at night : This city:
6.9Illinois:
6.8
Overweight people : Evanston:
31.4%State:
33.4%
General health condition : Average condition of hearing : Evanston:
83.0%Illinois:
79.9%
More about Health and Nutrition of Evanston, IL Residents
Local government employment and payroll (March 2022)
Function
Full-time employees
Monthly full-time payroll
Average yearly full-time wage
Part-time employees
Monthly part-time payroll
Police Protection - Officers
166 $1,453,874 $105,099 2 $2,715 Firefighters
106 $1,011,432 $114,502 0 $0 Parks and Recreation
57 $262,029 $55,164 151 $228,272 Water Supply
52 $482,524 $111,352 0 $0 Local Libraries
42 $271,572 $77,592 58 $103,200 Natural Resources
35 $274,039 $93,956 1 $571 Streets and Highways
29 $244,801 $101,297 0 $0 Financial Administration
26 $203,288 $93,825 1 $4,207 Solid Waste Management
20 $127,349 $76,409 2 $5,066 Other Government Administration
18 $175,584 $117,056 0 $0 Housing and Community Development (Local)
13 $99,141 $91,515 1 $2,526 Welfare
10 $70,900 $85,080 1 $841 Health
8 $52,022 $78,033 12 $39,890 Police - Other
8 $83,204 $124,806 0 $0 Judicial and Legal
6 $56,431 $112,862 0 $0 Fire - Other
2 $5,346 $32,076 0 $0
Totals for Government
598 $4,873,537 $97,797 229 $387,288
Evanston government finances - Expenditure in 2021 (per resident):
Construction - Regular Highways: $39,482,000 ($522.64)
Solid Waste Management: $16,430,000 ($217.49)General - Other: $5,271,000 ($69.77)Central Staff Services: $25,000 ($0.33)Current Operations - Police Protection: $38,746,000 ($512.89)
Local Fire Protection: $26,819,000 ($355.01)Central Staff Services: $17,519,000 ($231.90)General - Other: $13,807,000 ($182.77)Water Utilities: $9,706,000 ($128.48)Parks and Recreation: $9,351,000 ($123.78)Housing and Community Development: $9,043,000 ($119.71)Libraries: $7,471,000 ($98.90)Parking Facilities: $6,047,000 ($80.05)Solid Waste Management: $5,275,000 ($69.83)Health - Other: $3,749,000 ($49.63)Regular Highways: $2,338,000 ($30.95)Sewerage: $2,318,000 ($30.68)General - Interest on Debt: $18,721,000 ($247.82)
Other Capital Outlay - Solid Waste Management: $3,415,000 ($45.21)
Regular Highways: $3,296,000 ($43.63)Sewerage: $1,787,000 ($23.66)Parking Facilities: $1,724,000 ($22.82)Libraries: $688,000 ($9.11)Central Staff Services: $375,000 ($4.96)Total Salaries and Wages: $72,377,000 ($958.08)
Evanston government finances - Revenue in 2021 (per resident):
Charges - Sewerage: $10,217,000 ($135.25)
Other: $7,879,000 ($104.30)Parking Facilities: $7,070,000 ($93.59)Solid Waste Management: $4,612,000 ($61.05)Parks and Recreation: $64,000 ($0.85)Local Intergovernmental - Other: $20,172,000 ($267.02)
Miscellaneous - General Revenue - Other: $8,511,000 ($112.66)
Fines and Forfeits: $2,983,000 ($39.49)Interest Earnings: $1,243,000 ($16.45)Revenue - Water Utilities: $22,243,000 ($294.44)
State Intergovernmental - General Local Government Support: $16,447,000 ($217.71)
Highways: $770,000 ($10.19)Tax - Property: $60,737,000 ($804.00)
Other Selective Sales: $15,685,000 ($207.63)Other License: $11,853,000 ($156.90)Public Utilities Sales: $5,856,000 ($77.52)
Evanston government finances - Debt in 2021 (per resident):
Long Term Debt - Beginning Outstanding - Unspecified Public Purpose: $468,016,000 ($6195.28)
Outstanding Unspecified Public Purpose: $439,931,000 ($5823.51)Retired Unspecified Public Purpose: $67,709,000 ($896.29)Issue, Unspecified Public Purpose: $39,624,000 ($524.52)
Evanston government finances - Cash and Securities in 2021 (per resident):
Other Funds - Cash and Securities: $71,718,000 ($949.35)
3.53% of this county's 2021 resident taxpayers lived in other counties in 2020 ($82,405 average adjusted gross income )
Here:
3.53%Illinois average:
5.09%
0.01% of residents moved from foreign countries ($114 average AGI )Cook County:
0.01%Illinois average:
0.01%
Top counties from which taxpayers relocated into this county between 2020 and 2021:
5.44% of this county's 2020 resident taxpayers moved to other counties in 2021 ($120,340 average adjusted gross income )
Here:
5.44%Illinois average:
6.10%
0.01% of residents moved to foreign countries ($140 average AGI )Cook County:
0.01%Illinois average:
0.01%
Top counties to which taxpayers relocated from this county between 2020 and 2021:
Businesses in Evanston, IL
Name Count Name Count
7-Eleven 4 MasterBrand Cabinets 2 ALDI 1 Mazda 1 AT&T 1 McDonald's 2 Ace Hardware 1 New Balance 1 Ann Taylor 1 Nike 3 Barnes & Noble 1 Nissan 1 Baskin-Robbins 2 Office Depot 1 Best Western 1 OfficeMax 1 Budget Car Rental 1 Panera Bread 1 Buffalo Wild Wings 1 Papa John's Pizza 1 Burger King 2 Penske 1 CVS 3 PetSmart 1 Chipotle 1 Pizza Hut 1 Cold Stone Creamery 1 RadioShack 2 Cricket Wireless 2 Safeway 2 DHL 3 Sam's Club 1 Dunkin Donuts 4 Sprint Nextel 1 FedEx 19 Starbucks 9 GameStop 1 Steak 'n Shake 1 Gap 1 Subway 1 H&R Block 1 T-Mobile 4 Hilton 2 Target 1 Home Depot 1 The Athlete's Foot 1 IHOP 1 True Value 1 Jamba Juice 2 U-Haul 3 Jewel-Osco 2 U.S. Cellular 1 Jimmy John's 1 UPS 21 JoS. A. Bank 1 Urban Outfitters 1 KFC 1 Volkswagen 1 Kroger 1 Vons 2 LA Fitness 1 Walgreens 3 Levi Strauss & Co. 1 Whole Foods Market 2 Marshalls 1 YMCA 2
Strongest AM radio stations in Evanston:
WONX (1590 AM; 4 kW; EVANSTON, IL; Owner: KOVAS COMMUNICATIONS, INC.)
WGN (720 AM; 50 kW; CHICAGO, IL; Owner: WGN CONTINENTAL BROADCASTING CO.)
WBBM (780 AM; 50 kW; CHICAGO, IL; Owner: INFINITY BROADCASTING OPERATIONS, INC.)
WSCR (670 AM; 50 kW; CHICAGO, IL; Owner: INFINITY BROADCASTING OPERATIONS, INC.)
WMVP (1000 AM; 50 kW; CHICAGO, IL; Owner: ABC, INC.)
WCSN (820 AM; 5 kW; CHICAGO, IL; Owner: WYPA, INC.)
WLS (890 AM; 50 kW; CHICAGO, IL; Owner: WLS, INC.)
WYLL (1160 AM; 50 kW; CHICAGO, IL; Owner: SCA LICENSE CORPORATION)
WTMJ (620 AM; 50 kW; MILWAUKEE, WI; Owner: JOURNAL BROADCAST CORPORATION)
WKTA (1330 AM; 5 kW; EVANSTON, IL; Owner: POLNET COMMUNICATIONS, LTD.)
WVIV (1200 AM; 20 kW; CHICAGO, IL; Owner: WLXX-AM LICENSE CORP.)
WCRW (1240 AM; 1 kW; CHICAGO, IL; Owner: WSBC BROADCASTING, L.L.C.)
WEDC (1240 AM; 1 kW; CHICAGO, IL; Owner: FOREIGN LANGUAGE BROADCASTS, INC.)
Strongest FM radio stations in Evanston:
WNUR-FM (89.3 FM; EVANSTON, IL; Owner: NORTHWESTERN UNIVERSITY)
WGCI-FM (107.5 FM; CHICAGO, IL; Owner: AMFM RADIO LICENSES, L.L.C.)
WBEZ (91.5 FM; CHICAGO, IL; Owner: THE WBEZ ALLIANCE, INC.)
WKQX (101.1 FM; CHICAGO, IL; Owner: EMMIS RADIO LICENSE CORPORATION)
WLUP-FM (97.9 FM; CHICAGO, IL; Owner: BONNEVILLE HOLDING COMPANY)
WNND (100.3 FM; CHICAGO, IL; Owner: BONNEVILLE HOLDING COMPANY)
WOJO (105.1 FM; EVANSTON, IL; Owner: TICHENOR LICENSE CORPORATION ("TLC"))
WUSN (99.5 FM; CHICAGO, IL; Owner: INFINITY BROADCASTING CORPORATION OF CHICAGO)
WVAZ (102.7 FM; OAK PARK, IL; Owner: AMFM RADIO LICENSES, L.L.C.)
WCKG (105.9 FM; ELMWOOD PARK, IL; Owner: INFINITY HOLDINGS CORPORATION OF ORLANDO)
WLIT-FM (93.9 FM; CHICAGO, IL; Owner: AMFM RADIO LICENSES, L.L.C.)
WJMK (104.3 FM; CHICAGO, IL; Owner: INFINITY BROADCASTING CORP. OF ILLINOIS)
WNUA (95.5 FM; CHICAGO, IL; Owner: AMFM RADIO LICENSES, L.L.C.)
WTMX (101.9 FM; SKOKIE, IL; Owner: BONNEVILLE HOLDING COMPANY)
WBBM-FM (96.3 FM; CHICAGO, IL; Owner: INFINITY BROADCASTING OPERATIONS, INC.)
WKSC-FM (103.5 FM; CHICAGO, IL; Owner: AMFM RADIO LICENSES, L.L.C.)
WFMT (98.7 FM; CHICAGO, IL; Owner: WINDOW TO THE WORLD COMMUNICATIONS)
WZZN (94.7 FM; CHICAGO, IL; Owner: ABC CHICAGO FM RADIO,INC.)
WXRT-FM (93.1 FM; CHICAGO, IL; Owner: INFINITY BROADCASTING OPERATIONS, INC.)
WDRV (97.1 FM; CHICAGO, IL; Owner: BONNEVILLE HOLDING COMPANY)
TV broadcast stations around Evanston:
WGBO-TV (Channel 66; JOLIET, IL; Owner: WGBO LICENSE PARTNERSHIP, G.P.)
WBBM-TV (Channel 2; CHICAGO, IL; Owner: CBS BROADCASTING INC.)
WLS-TV (Channel 7; CHICAGO, IL; Owner: WLS TELEVISION, INC.)
WMAQ-TV (Channel 5; CHICAGO, IL; Owner: NBC SUBSIDIARY (WMAQ-TV), INC.)
WTTW (Channel 11; CHICAGO, IL; Owner: WINDOW TO THE WORLD COMMUNICATIONS, INC.)
WGN-TV (Channel 9; CHICAGO, IL; Owner: WGN CONTINENTAL BROADCASTING COMPANY)
WSNS-TV (Channel 44; CHICAGO, IL; Owner: TELEMUNDO OF CHICAGO, INC.)
WPWR-TV (Channel 50; GARY, IN; Owner: FOX TELEVISION STATIONS, INC.)
WXFT (Channel 60; AURORA, IL; Owner: TELEFUTURA CHICAGO LLC)
WCIU-TV (Channel 26; CHICAGO, IL; Owner: WCIU-TV LIMITED PARTNERSHIP)
WCPX (Channel 38; CHICAGO, IL; Owner: PAXSON CHICAGO LICENSE, INC.)
WFLD (Channel 32; CHICAGO, IL; Owner: FOX TELEVISION STATIONS, INC.)
W68DO (Channel 68; PALATINE, IL; Owner: TRINITY BROADCASTING NETWORK)
WFBT-CA (Channel 23; CHICAGO, IL; Owner: CHANNEL 23 LIMITED PARTNERSHIP)
WJYS (Channel 62; HAMMOND, IN; Owner: JOVON BROADCASTING CORPORATION)
WOCH-LP (Channel 28; CHICAGO, IL; Owner: KM LPTV OF CHICAGO-28, L.L.C.)
WYCC (Channel 20; CHICAGO, IL; Owner: COLLEGE DIST. #508, COUNTY OF COOK)
WOCK-CA (Channel 13; CHICAGO, IL; Owner: KM LPTV OF CHICAGO-13, L.L.C.)
W34CK (Channel 34; ARLINGTON HEIGHTS, IL; Owner: FIRST UNITED, INC.)
W64CQ (Channel 64; ARLINGTON HEIGHTS, IL; Owner: TRINITY BROADCASTING NETWORK)
WYIN (Channel 56; GARY, IN; Owner: NORTHWEST INDIANA PUBLIC BROADCASTING, INC.)
W57DN (Channel 57; ELGIN, IL; Owner: TRINITY BROADCASTING NETWORK)
National Bridge Inventory (NBI) Statistics 24 Number of bridges164ft / 50.3m Total length $6,224,000 Total costs201,000 Total average daily traffic8,744 Total average daily truck traffic
New bridges - historical statistics
13 1900-1909 2 1930-1939 2 1940-1949 2 1950-1959 1 1980-1989 1 1990-1999 3 2000-2009
See full National Bridge Inventory statistics for Evanston, IL
Home Mortgage Disclosure Act Aggregated Statistics For Year 2009(Based on 18 full tracts) A) FHA, FSA/RHS & VA B) Conventional C) Refinancings D) Home Improvement Loans E) Loans on Dwellings For 5+ Families F) Non-occupant Loans on G) Loans On Manufactured Number Average Value Number Average Value Number Average Value Number Average Value Number Average Value Number Average Value Number Average Value
LOANS ORIGINATED 102 $224,322 519 $286,574 2,185 $293,877 53 $124,641 12 $2,081,724 112 $224,960 4 $223,250 APPLICATIONS APPROVED, NOT ACCEPTED 7 $265,164 41 $413,661 180 $295,857 8 $131,839 0 $0 8 $215,000 0 $0 APPLICATIONS DENIED 23 $199,810 79 $294,452 504 $324,140 30 $86,898 0 $0 46 $309,219 0 $0 APPLICATIONS WITHDRAWN 15 $164,261 42 $294,779 218 $269,139 5 $107,400 1 $244,000 25 $210,735 0 $0 FILES CLOSED FOR INCOMPLETENESS 10 $163,074 9 $267,778 99 $316,883 2 $248,000 2 $1,240,000 8 $252,578 0 $0
Aggregated Statistics For Year 2008(Based on 18 full tracts) A) FHA, FSA/RHS & VA B) Conventional C) Refinancings D) Home Improvement Loans E) Loans on Dwellings For 5+ Families F) Non-occupant Loans on G) Loans On Manufactured Number Average Value Number Average Value Number Average Value Number Average Value Number Average Value Number Average Value Number Average Value
LOANS ORIGINATED 32 $247,502 696 $315,229 1,365 $306,084 75 $124,747 36 $1,692,399 153 $274,370 0 $0 APPLICATIONS APPROVED, NOT ACCEPTED 8 $251,991 72 $337,564 172 $271,457 6 $96,920 0 $0 28 $215,619 0 $0 APPLICATIONS DENIED 13 $228,918 111 $291,154 466 $292,585 50 $83,732 0 $0 50 $238,711 1 $69,000 APPLICATIONS WITHDRAWN 9 $287,931 56 $369,880 163 $267,827 9 $209,168 1 $1,000,000 20 $262,020 0 $0 FILES CLOSED FOR INCOMPLETENESS 5 $214,568 21 $269,206 72 $301,711 3 $394,933 0 $0 12 $227,401 0 $0
Aggregated Statistics For Year 2007(Based on 18 full tracts) A) FHA, FSA/RHS & VA B) Conventional C) Refinancings D) Home Improvement Loans E) Loans on Dwellings For 5+ Families F) Non-occupant Loans on G) Loans On Manufactured Number Average Value Number Average Value Number Average Value Number Average Value Number Average Value Number Average Value Number Average Value
LOANS ORIGINATED 6 $240,270 1,140 $287,173 1,359 $288,732 108 $198,467 45 $2,652,191 286 $300,297 0 $0 APPLICATIONS APPROVED, NOT ACCEPTED 0 $0 129 $285,483 206 $273,195 39 $121,318 1 $1,720,000 39 $274,813 2 $164,500 APPLICATIONS DENIED 1 $274,590 216 $267,297 714 $294,374 78 $137,512 2 $667,500 105 $280,246 1 $32,830 APPLICATIONS WITHDRAWN 0 $0 108 $272,238 216 $277,653 12 $262,650 1 $50,000 23 $262,003 0 $0 FILES CLOSED FOR INCOMPLETENESS 0 $0 27 $280,209 120 $305,799 4 $141,000 0 $0 12 $231,415 0 $0
Aggregated Statistics For Year 2006(Based on 18 full tracts) A) FHA, FSA/RHS & VA B) Conventional C) Refinancings D) Home Improvement Loans E) Loans on Dwellings For 5+ Families F) Non-occupant Loans on G) Loans On Manufactured Number Average Value Number Average Value Number Average Value Number Average Value Number Average Value Number Average Value Number Average Value
LOANS ORIGINATED 3 $232,000 1,613 $260,147 1,495 $274,938 130 $161,103 37 $1,500,811 283 $255,817 0 $0 APPLICATIONS APPROVED, NOT ACCEPTED 0 $0 211 $215,208 212 $254,288 26 $133,197 3 $315,667 30 $248,049 1 $128,000 APPLICATIONS DENIED 2 $201,045 360 $231,074 694 $263,907 97 $114,405 1 $1,130,000 106 $267,854 0 $0 APPLICATIONS WITHDRAWN 1 $245,000 192 $234,766 312 $266,272 19 $201,688 3 $297,797 46 $213,020 0 $0 FILES CLOSED FOR INCOMPLETENESS 2 $205,500 64 $277,308 130 $246,289 5 $258,800 0 $0 15 $331,683 0 $0
Aggregated Statistics For Year 2005(Based on 18 full tracts) A) FHA, FSA/RHS & VA B) Conventional C) Refinancings D) Home Improvement Loans E) Loans on Dwellings For 5+ Families F) Non-occupant Loans on G) Loans On Manufactured Number Average Value Number Average Value Number Average Value Number Average Value Number Average Value Number Average Value Number Average Value
LOANS ORIGINATED 2 $187,000 1,833 $253,979 1,817 $266,120 124 $181,763 36 $1,358,376 357 $243,274 5 $61,372 APPLICATIONS APPROVED, NOT ACCEPTED 1 $225,000 224 $236,172 224 $223,067 23 $141,603 2 $544,500 38 $223,922 0 $0 APPLICATIONS DENIED 0 $0 319 $223,136 622 $234,493 105 $85,882 2 $465,500 99 $243,073 0 $0 APPLICATIONS WITHDRAWN 2 $313,500 204 $253,941 465 $255,602 35 $213,477 4 $1,038,750 61 $255,989 0 $0 FILES CLOSED FOR INCOMPLETENESS 2 $176,500 73 $222,411 110 $231,167 4 $155,178 0 $0 16 $234,509 0 $0
Aggregated Statistics For Year 2004(Based on 18 full tracts) A) FHA, FSA/RHS & VA B) Conventional C) Refinancings D) Home Improvement Loans E) Loans on Dwellings For 5+ Families F) Non-occupant Loans on G) Loans On Manufactured Number Average Value Number Average Value Number Average Value Number Average Value Number Average Value Number Average Value Number Average Value
LOANS ORIGINATED 12 $186,802 1,716 $258,770 2,138 $258,251 135 $134,681 35 $831,686 303 $240,478 10 $58,100 APPLICATIONS APPROVED, NOT ACCEPTED 0 $0 207 $248,899 334 $236,151 40 $77,401 1 $411,000 49 $250,621 0 $0 APPLICATIONS DENIED 4 $207,000 207 $233,330 660 $232,926 106 $94,358 1 $349,000 79 $237,221 4 $48,250 APPLICATIONS WITHDRAWN 4 $162,002 136 $269,015 380 $244,564 23 $140,790 2 $1,128,500 40 $230,727 0 $0 FILES CLOSED FOR INCOMPLETENESS 2 $118,000 40 $306,804 179 $277,658 6 $143,500 0 $0 14 $230,621 0 $0
Aggregated Statistics For Year 2003(Based on 18 full tracts) A) FHA, FSA/RHS & VA B) Conventional C) Refinancings D) Home Improvement Loans E) Loans on Dwellings For 5+ Families F) Non-occupant Loans on Number Average Value Number Average Value Number Average Value Number Average Value Number Average Value Number Average Value
LOANS ORIGINATED 16 $205,876 1,712 $246,953 5,425 $231,801 76 $96,439 74 $1,911,071 381 $207,940 APPLICATIONS APPROVED, NOT ACCEPTED 2 $219,945 151 $228,721 510 $211,097 26 $54,098 3 $2,706,000 41 $191,781 APPLICATIONS DENIED 4 $197,750 187 $227,294 1,022 $216,566 70 $41,281 6 $1,029,167 86 $233,275 APPLICATIONS WITHDRAWN 4 $177,750 129 $222,694 504 $216,947 13 $69,915 3 $1,615,000 30 $192,313 FILES CLOSED FOR INCOMPLETENESS 0 $0 42 $271,390 151 $225,210 3 $50,667 0 $0 7 $157,107
Aggregated Statistics For Year 2002(Based on 18 full tracts) A) FHA, FSA/RHS & VA B) Conventional C) Refinancings D) Home Improvement Loans E) Loans on Dwellings For 5+ Families F) Non-occupant Loans on Number Average Value Number Average Value Number Average Value Number Average Value Number Average Value Number Average Value
LOANS ORIGINATED 23 $186,567 1,576 $227,654 3,749 $236,026 76 $72,641 49 $741,852 220 $197,779 APPLICATIONS APPROVED, NOT ACCEPTED 4 $171,420 161 $231,790 420 $199,304 31 $54,691 4 $444,250 28 $185,148 APPLICATIONS DENIED 9 $170,501 113 $200,998 480 $181,320 64 $35,783 3 $1,214,667 54 $186,856 APPLICATIONS WITHDRAWN 3 $173,667 87 $209,189 309 $204,564 12 $58,248 7 $854,671 27 $234,013 FILES CLOSED FOR INCOMPLETENESS 1 $122,000 63 $248,664 349 $206,110 1 $100,000 3 $407,910 14 $206,149
Aggregated Statistics For Year 2001(Based on 18 full tracts) A) FHA, FSA/RHS & VA B) Conventional C) Refinancings D) Home Improvement Loans E) Loans on Dwellings For 5+ Families F) Non-occupant Loans on Number Average Value Number Average Value Number Average Value Number Average Value Number Average Value Number Average Value
LOANS ORIGINATED 50 $177,449 1,424 $200,800 2,656 $214,647 138 $136,922 28 $834,874 184 $185,132 APPLICATIONS APPROVED, NOT ACCEPTED 2 $152,885 108 $203,983 259 $171,197 42 $42,611 5 $441,678 13 $166,892 APPLICATIONS DENIED 12 $159,944 164 $177,441 543 $157,117 91 $35,922 0 $0 45 $205,381 APPLICATIONS WITHDRAWN 10 $168,541 71 $256,951 285 $175,767 25 $69,517 3 $233,457 18 $177,663 FILES CLOSED FOR INCOMPLETENESS 1 $126,000 38 $221,242 148 $174,660 5 $37,200 0 $0 11 $172,931
Aggregated Statistics For Year 2000(Based on 18 full tracts) A) FHA, FSA/RHS & VA B) Conventional C) Refinancings D) Home Improvement Loans E) Loans on Dwellings For 5+ Families F) Non-occupant Loans on Number Average Value Number Average Value Number Average Value Number Average Value Number Average Value Number Average Value
LOANS ORIGINATED 59 $159,407 1,357 $196,773 719 $172,328 150 $59,411 25 $1,009,226 111 $154,000 APPLICATIONS APPROVED, NOT ACCEPTED 1 $165,150 116 $175,432 166 $128,980 51 $38,789 1 $488,000 26 $111,300 APPLICATIONS DENIED 10 $147,777 149 $170,999 396 $128,896 108 $39,120 1 $472,000 51 $149,855 APPLICATIONS WITHDRAWN 3 $148,700 91 $191,279 186 $128,640 33 $65,390 0 $0 16 $153,236 FILES CLOSED FOR INCOMPLETENESS 0 $0 32 $141,305 121 $151,406 10 $33,967 0 $0 4 $163,560
Aggregated Statistics For Year 1999(Based on 18 full and 1 partial tracts) A) FHA, FSA/RHS & VA B) Conventional C) Refinancings D) Home Improvement Loans E) Loans on Dwellings For 5+ Families F) Non-occupant Loans on Number Average Value Number Average Value Number Average Value Number Average Value Number Average Value Number Average Value
LOANS ORIGINATED 73 $147,325 1,278 $188,150 1,381 $170,466 204 $28,198 40 $645,486 174 $149,210 APPLICATIONS APPROVED, NOT ACCEPTED 3 $160,677 108 $166,126 219 $130,223 52 $25,468 3 $316,593 31 $113,356 APPLICATIONS DENIED 8 $135,058 163 $144,193 524 $139,516 88 $30,115 4 $190,000 90 $145,128 APPLICATIONS WITHDRAWN 6 $129,367 100 $171,253 300 $132,829 31 $59,731 4 $252,000 27 $190,151 FILES CLOSED FOR INCOMPLETENESS 1 $135,000 28 $144,285 112 $148,400 10 $41,763 0 $0 12 $148,852
Detailed mortgage data for all 18 tracts in Evanston, IL
Private Mortgage Insurance Companies Aggregated Statistics For Year 2009(Based on 18 full tracts) A) Conventional B) Refinancings C) Non-occupant Loans on Number Average Value Number Average Value Number Average Value
LOANS ORIGINATED 77 $255,119 33 $279,701 0 $0 APPLICATIONS APPROVED, NOT ACCEPTED 15 $195,800 13 $244,856 2 $230,500 APPLICATIONS DENIED 17 $276,882 14 $252,286 0 $0 APPLICATIONS WITHDRAWN 8 $218,500 10 $261,200 0 $0 FILES CLOSED FOR INCOMPLETENESS 1 $151,000 0 $0 0 $0
Aggregated Statistics For Year 2008(Based on 18 full tracts) A) Conventional B) Refinancings C) Non-occupant Loans on Number Average Value Number Average Value Number Average Value
LOANS ORIGINATED 145 $268,160 60 $261,654 10 $229,302 APPLICATIONS APPROVED, NOT ACCEPTED 46 $293,252 29 $287,649 6 $336,312 APPLICATIONS DENIED 20 $251,667 11 $286,690 6 $205,265 APPLICATIONS WITHDRAWN 11 $251,455 6 $274,000 1 $200,000 FILES CLOSED FOR INCOMPLETENESS 2 $172,500 2 $232,795 0 $0
Aggregated Statistics For Year 2007(Based on 18 full tracts) A) Conventional B) Refinancings C) Non-occupant Loans on Number Average Value Number Average Value Number Average Value
LOANS ORIGINATED 143 $254,016 69 $274,997 10 $326,648 APPLICATIONS APPROVED, NOT ACCEPTED 18 $240,446 21 $294,131 3 $280,697 APPLICATIONS DENIED 4 $248,022 3 $333,033 0 $0 APPLICATIONS WITHDRAWN 10 $329,875 8 $248,750 4 $387,188 FILES CLOSED FOR INCOMPLETENESS 2 $320,000 0 $0 0 $0
Aggregated Statistics For Year 2006(Based on 18 full tracts) A) Conventional B) Refinancings C) Non-occupant Loans on Number Average Value Number Average Value Number Average Value
LOANS ORIGINATED 115 $247,474 50 $262,674 14 $275,449 APPLICATIONS APPROVED, NOT ACCEPTED 18 $299,500 14 $250,414 1 $204,000 APPLICATIONS DENIED 1 $150,000 2 $235,000 0 $0 APPLICATIONS WITHDRAWN 4 $232,750 4 $265,308 2 $270,615 FILES CLOSED FOR INCOMPLETENESS 0 $0 1 $202,000 0 $0
Aggregated Statistics For Year 2005(Based on 17 full tracts) A) Conventional B) Refinancings C) Non-occupant Loans on Number Average Value Number Average Value Number Average Value
LOANS ORIGINATED 142 $229,896 52 $244,117 19 $230,201 APPLICATIONS APPROVED, NOT ACCEPTED 27 $248,327 18 $229,118 2 $288,500 APPLICATIONS DENIED 3 $319,000 1 $274,590 0 $0 APPLICATIONS WITHDRAWN 8 $319,750 6 $262,667 0 $0 FILES CLOSED FOR INCOMPLETENESS 1 $208,000 0 $0 0 $0
Aggregated Statistics For Year 2004(Based on 18 full tracts) A) Conventional B) Refinancings C) Non-occupant Loans on Number Average Value Number Average Value Number Average Value
LOANS ORIGINATED 208 $218,173 82 $222,028 16 $222,496 APPLICATIONS APPROVED, NOT ACCEPTED 55 $231,982 33 $206,800 3 $231,710 APPLICATIONS DENIED 9 $265,344 4 $205,195 3 $312,333 APPLICATIONS WITHDRAWN 9 $334,889 11 $226,063 2 $267,845 FILES CLOSED FOR INCOMPLETENESS 1 $323,000 3 $338,263 1 $236,790
Aggregated Statistics For Year 2003(Based on 17 full tracts) A) Conventional B) Refinancings C) Non-occupant Loans on Number Average Value Number Average Value Number Average Value
LOANS ORIGINATED 312 $218,871 198 $204,135 14 $238,496 APPLICATIONS APPROVED, NOT ACCEPTED 54 $207,775 61 $206,649 2 $243,000 APPLICATIONS DENIED 11 $222,672 4 $551,500 0 $0 APPLICATIONS WITHDRAWN 13 $235,930 9 $250,220 4 $265,522 FILES CLOSED FOR INCOMPLETENESS 6 $232,287 0 $0 1 $358,000
Aggregated Statistics For Year 2002(Based on 18 full tracts) A) Conventional B) Refinancings C) Non-occupant Loans on Number Average Value Number Average Value Number Average Value
LOANS ORIGINATED 361 $198,045 147 $189,483 17 $175,954 APPLICATIONS APPROVED, NOT ACCEPTED 83 $185,157 33 $221,436 11 $147,704 APPLICATIONS DENIED 6 $231,167 4 $197,000 0 $0 APPLICATIONS WITHDRAWN 18 $196,353 7 $242,571 3 $208,000 FILES CLOSED FOR INCOMPLETENESS 2 $170,500 0 $0 0 $0
Aggregated Statistics For Year 2001(Based on 18 full tracts) A) Conventional B) Refinancings C) Non-occupant Loans on Number Average Value Number Average Value Number Average Value
LOANS ORIGINATED 357 $182,433 162 $186,115 21 $173,218 APPLICATIONS APPROVED, NOT ACCEPTED 79 $202,253 37 $184,678 10 $190,955 APPLICATIONS DENIED 11 $175,152 7 $209,501 1 $133,000 APPLICATIONS WITHDRAWN 13 $217,498 6 $187,333 0 $0 FILES CLOSED FOR INCOMPLETENESS 3 $149,670 0 $0 0 $0
Aggregated Statistics For Year 2000(Based on 18 full tracts) A) Conventional B) Refinancings C) Non-occupant Loans on Number Average Value Number Average Value Number Average Value
LOANS ORIGINATED 347 $186,726 61 $193,393 23 $174,810 APPLICATIONS APPROVED, NOT ACCEPTED 50 $192,269 9 $170,000 2 $110,565 APPLICATIONS DENIED 14 $198,131 5 $192,776 2 $211,915 APPLICATIONS WITHDRAWN 10 $187,735 2 $185,000 0 $0 FILES CLOSED FOR INCOMPLETENESS 9 $205,222 0 $0 1 $83,000
Aggregated Statistics For Year 1999(Based on 18 full and 1 partial tracts) A) Conventional B) Refinancings C) Non-occupant Loans on Number Average Value Number Average Value Number Average Value
LOANS ORIGINATED 364 $175,171 111 $178,082 11 $145,780 APPLICATIONS APPROVED, NOT ACCEPTED 36 $195,085 21 $219,330 1 $240,500 APPLICATIONS DENIED 19 $146,889 3 $201,243 1 $270,000 APPLICATIONS WITHDRAWN 18 $159,192 6 $232,755 1 $100,000 FILES CLOSED FOR INCOMPLETENESS 8 $142,434 3 $151,980 0 $0
Fire-safe hotels and motels in Evanston, Illinois:
Holiday Inn Evanston, 1501 Sherman Ave, Evanston, Illinois 60201 Phone: (847) 491-6400, Fax: (847) 328-3090
Hilton Garden Inn Evanston, 1818 Maple Ave, Evanston, Illinois 60201 Phone: (847) 475-6400, Fax: (847) 475-6460
Hilton Orrington, 1710 Orrington Ave, Evanston, Illinois 60201 Phone: (847) 866-8700, Fax: (847) 866-8724
Hyatt House Chicago Evanston, 1515 Chicago Ave, Evanston, Illinois 60201 Phone: (866) 974-9288, Fax: (847) 869-7610
All 4 fire-safe hotels and motels in Evanston, Illinois
Most common first names in Evanston, IL among deceased individuals Name Count Lived (average)
John 595 76.8 years Mary 561 81.2 years William 509 77.0 years Helen 358 82.4 years James 355 72.3 years Robert 321 73.2 years George 317 78.5 years Ruth 312 83.1 years Margaret 298 81.6 years Charles 265 76.4 years
Most common last names in Evanston, IL among deceased individuals Last name Count Lived (average)
Johnson 257 79.2 years Smith 150 79.6 years Brown 148 78.8 years Anderson 124 78.9 years Williams 119 75.6 years Miller 112 80.0 years Jones 109 77.5 years Davis 93 74.9 years Nelson 74 78.9 years Peterson 66 79.6 years
Evanston compared to Illinois state average:
Median house value above state average. Unemployed percentage significantly below state average. Hispanic race population percentage below state average. Median age below state average. Number of college students above state average. Percentage of population with a bachelor's degree or higher significantly above state average.
#2 on the list of "Top 101 cities with largest percentage of males in occupations: education, training, and library occupations (population 50,000+)"
#7 on the list of "Top 101 cities with largest percentage of males in industries: educational services (population 50,000+)"
#7 on the list of "Top 101 cities with largest percentage of males in occupations: business and financial operations occupations (population 50,000+)"
#7 on the list of "Top 101 cities with the highest cost per building permit(population 50,000+)"
#8 on the list of "Top 101 cities with largest percentage of females in occupations: community and social service occupations (population 50,000+)"
#13 on the list of "Top 101 cities with the most people having Master's or Doctorate degrees (population 50,000+)"
#20 on the list of "Top 101 cities with largest percentage of females in industries: educational services (population 50,000+)"
#21 on the list of "Top 100 best educated cities (highest percentage of bachelor degree holding residents) (pop. 50,000+)"
#21 on the list of "Top 101 cities with the most people having Doctorate degrees (population 50,000+)"
#24 on the list of "Top 101 cities with largest percentage of females in occupations: education, training, and library occupations (population 50,000+)"
#29 on the list of "Top 101 cities with largest percentage of males in occupations: arts, design, entertainment, sports, and media occupations (population 50,000+)"
#33 on the list of "Top 101 cities with the highest percentage of workers working at home, population 50,000+"
#35 on the list of "Top 101 cities with the most people having professional degrees (population 50,000+)"
#36 on the list of "Top 101 cities with the largest city-data.com crime index decrease from 2002 to 2012 (population 50,000+)"
#37 on the list of "Top 101 cities with largest percentage of males in industries: professional, scientific, and technical services (population 50,000+)"
#37 on the list of "Top 101 cities with largest percentage of males in industries: management of companies and enterprises (population 50,000+)"
#40 on the list of "Top 101 cities with the lowest number of rapes per 100,000 residents (population 50,000+)"
#41 on the list of "Top 101 cities with the most local government spending on current operations of parking facilities per resident (population 10,000+)"
#42 on the list of "Top 101 cities with the most people taking subway or elevated to work (population 5,000+)"
#44 on the list of "Top 100 cities with oldest houses (pop. 50,000+)"
#1 on the list of "Top 101 counties with the most Black Protestant congregations"
#1 on the list of "Top 101 counties with the most Catholic congregations"
#1 on the list of "Top 101 counties with the highest surface withdrawal of fresh water for public supply"
#2 on the list of "Top 101 counties with the most Black Protestant adherents"
#2 on the list of "Top 101 counties with the most Orthodox congregations (pop. 50,000+)"
Top Patent Applicants
Christopher P. Nicholas (105)
Tobin J. Marks (63)
Geoffry A. Westphal (54)
Andrew J. Souers (45)
William A. Carroll (35)
John A. Nix (35)
Jens-Uwe Schluetter (34)
Xin Chen (32)
Alexander Hans Vija (29)
Northwestern University (22)
Total of 2738 patent applications in 2008-2024.


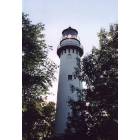


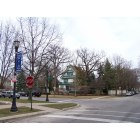
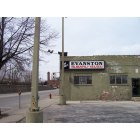
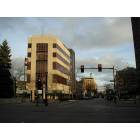
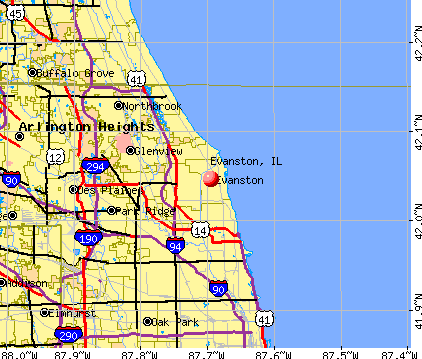


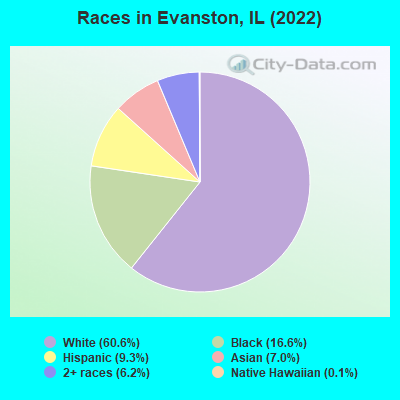
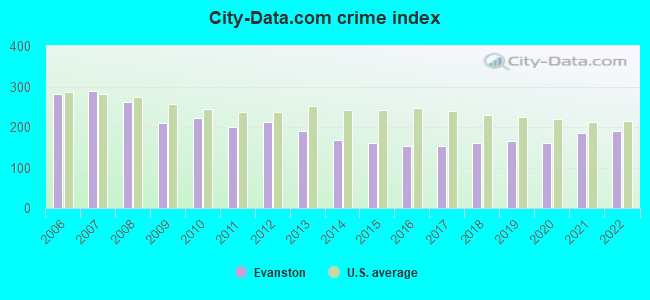
 Recent articles from our blog. Our writers, many of them Ph.D. graduates or candidates, create easy-to-read articles on a wide variety of topics.

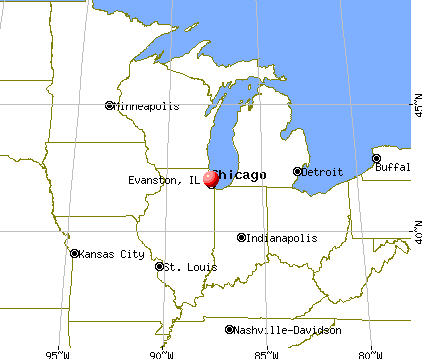
 (14.2 miles
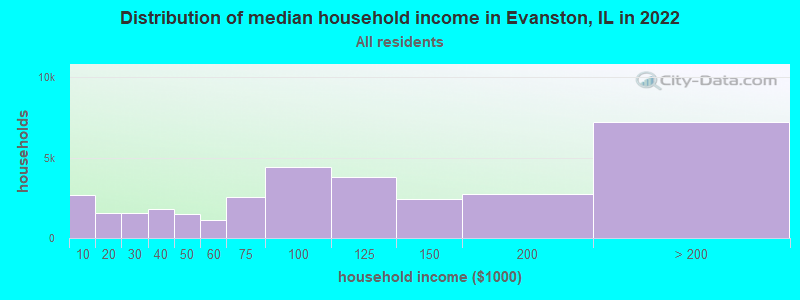
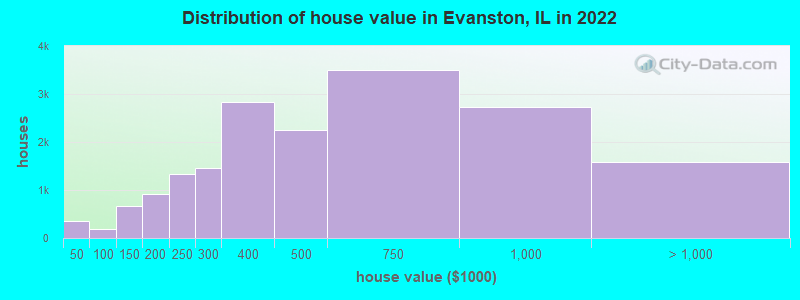
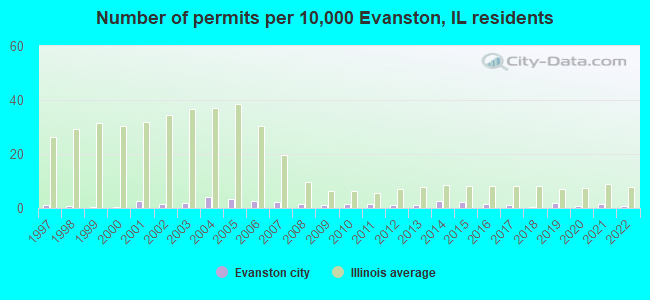
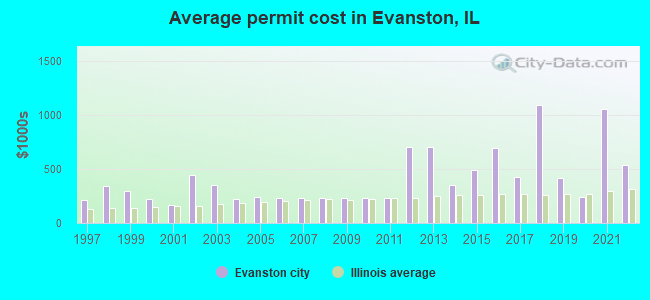
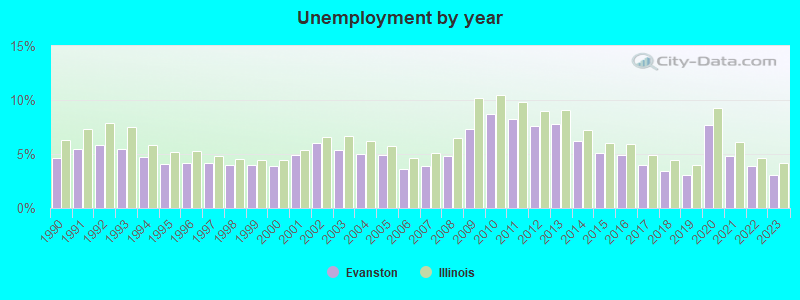
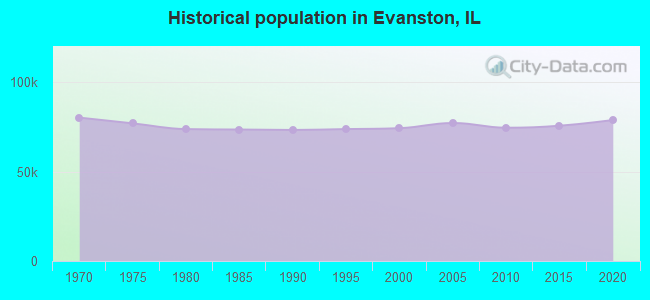
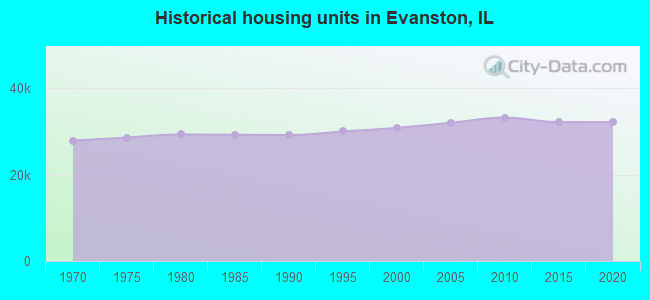
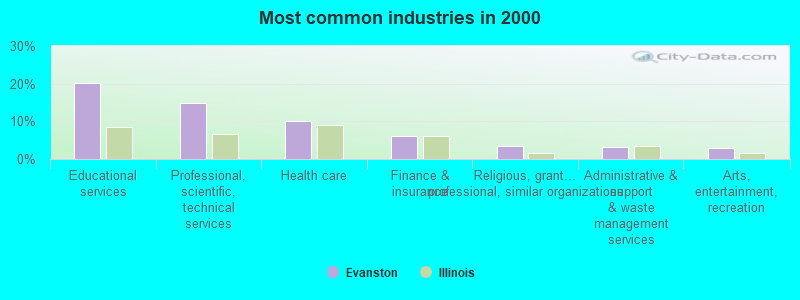
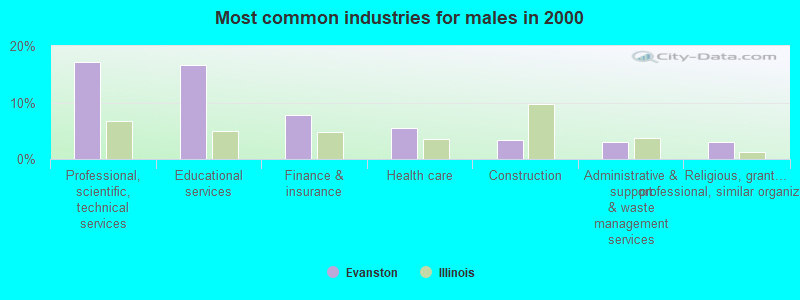
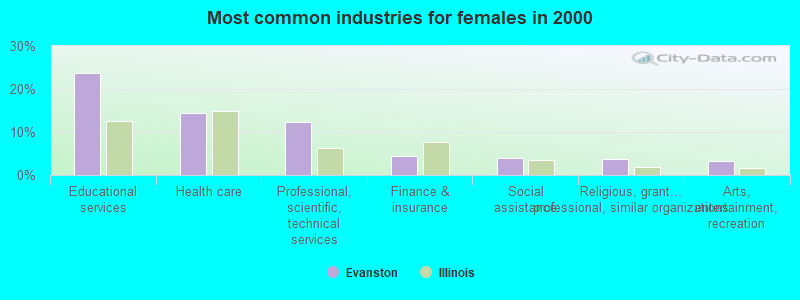
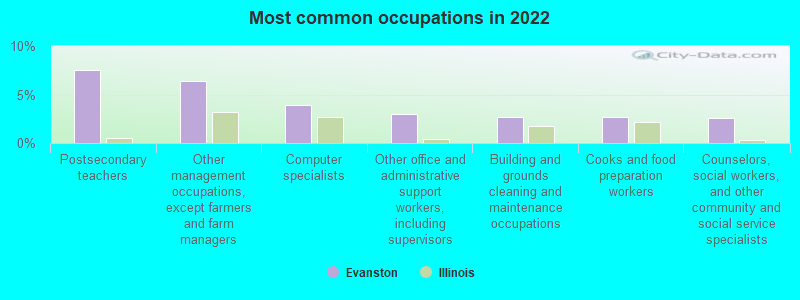
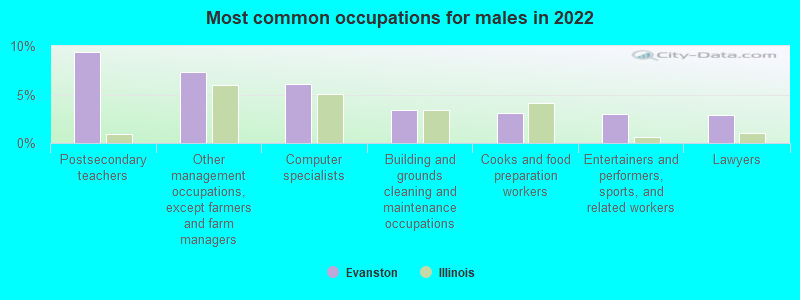
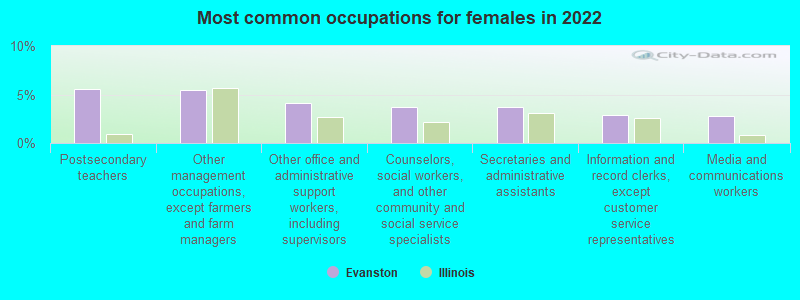
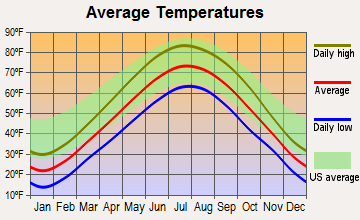
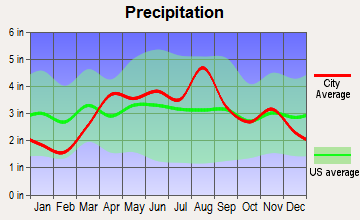
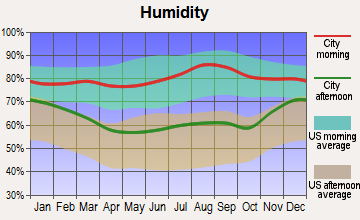
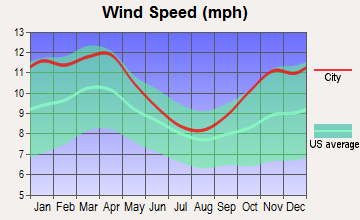
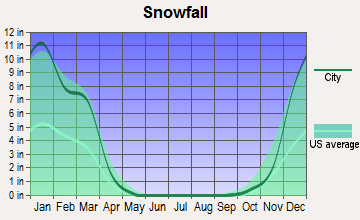
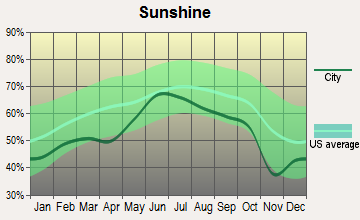
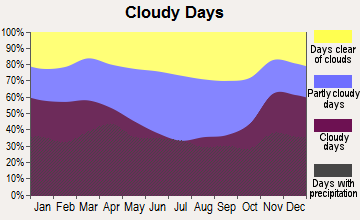
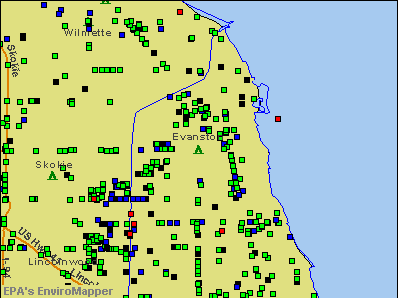

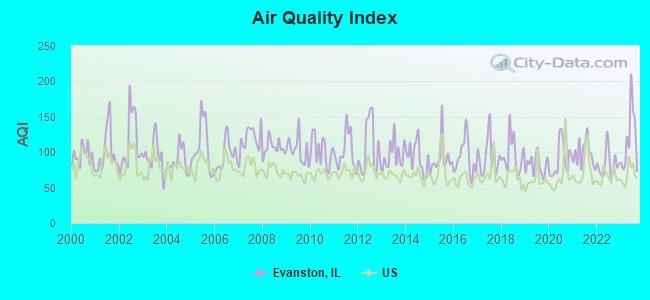
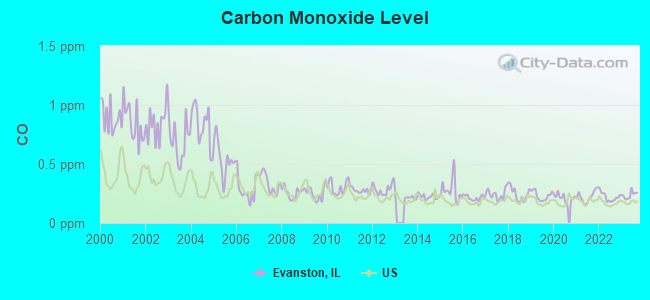
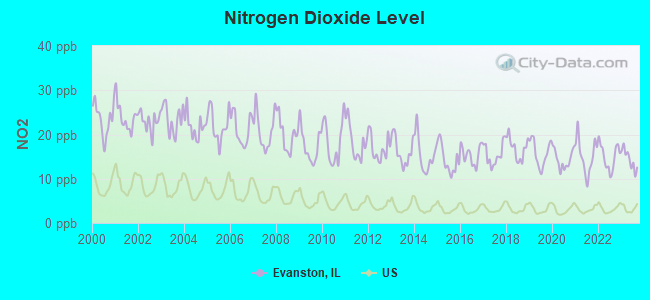
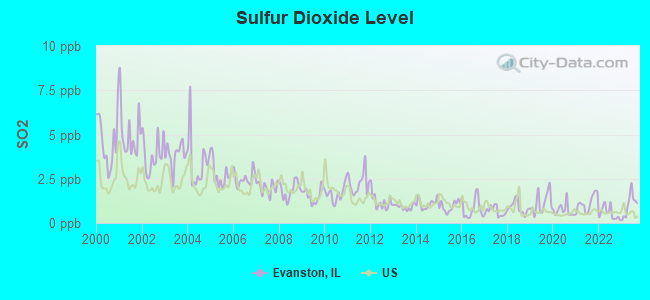
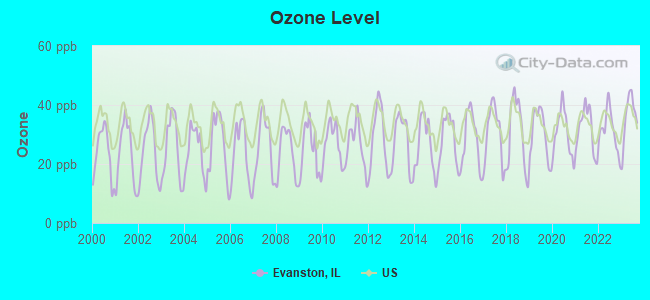
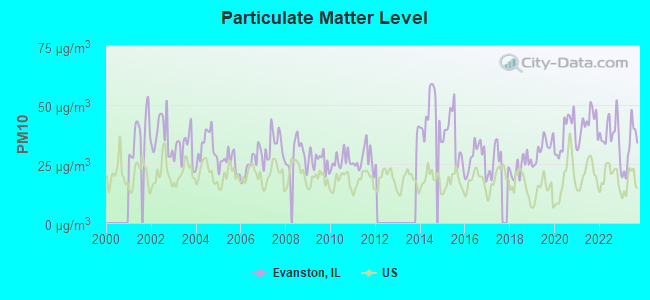
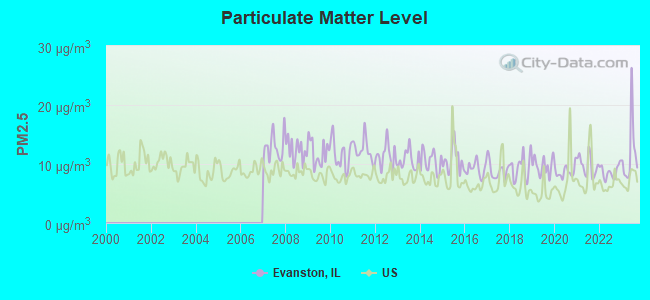
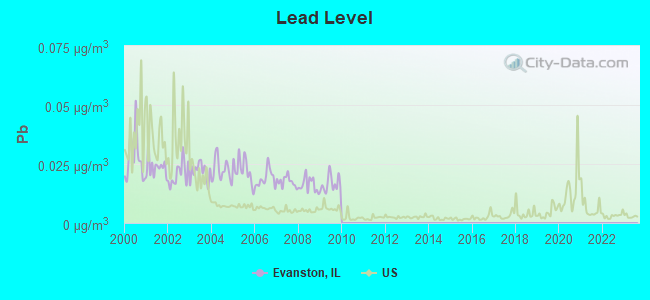

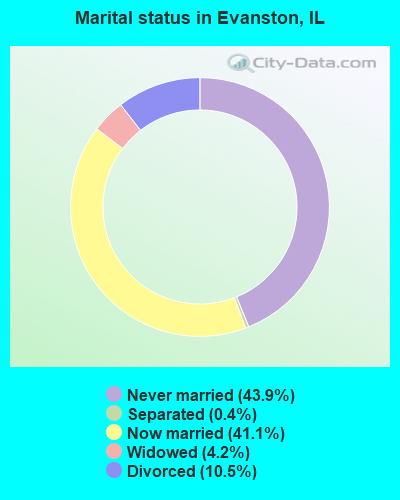
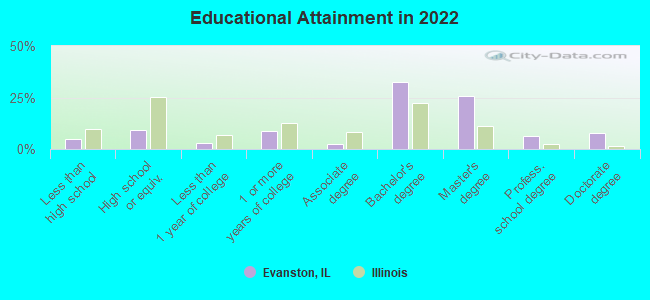
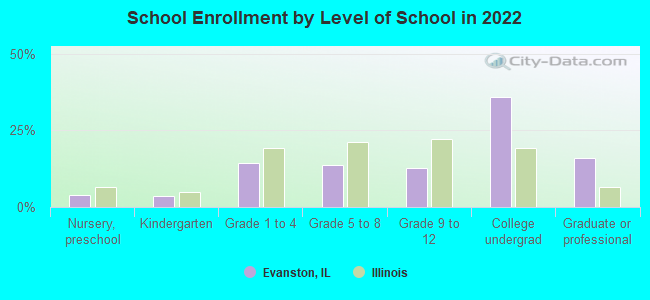
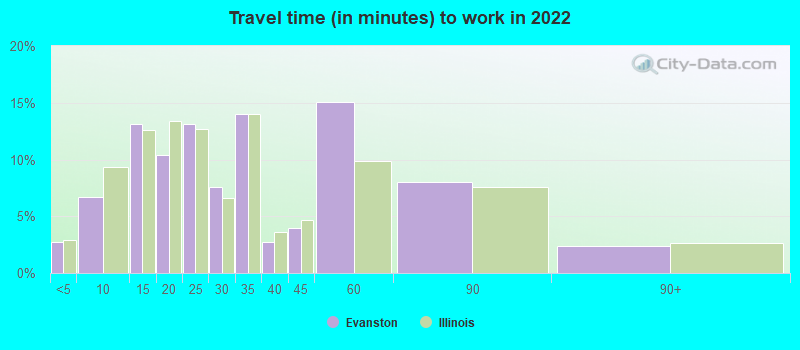
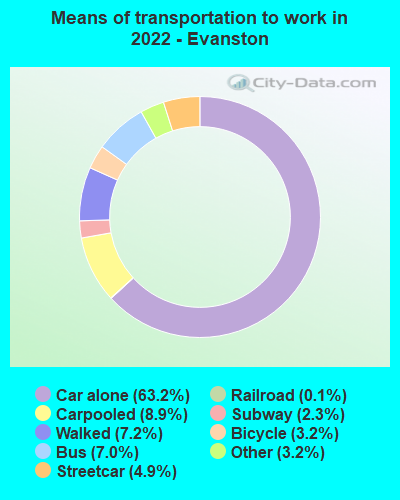


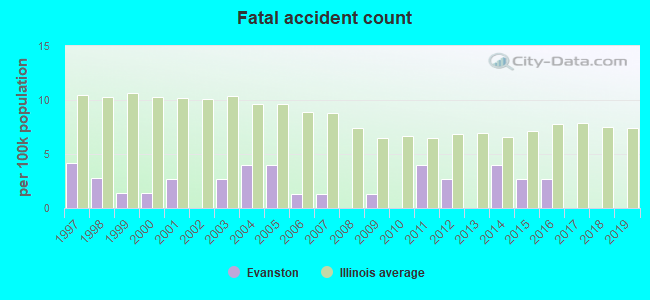
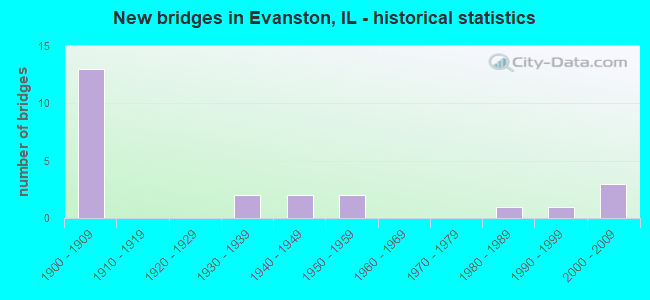
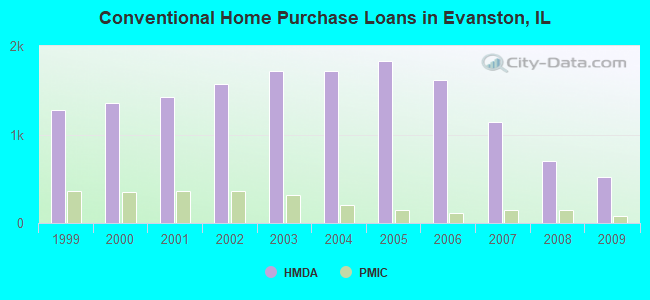
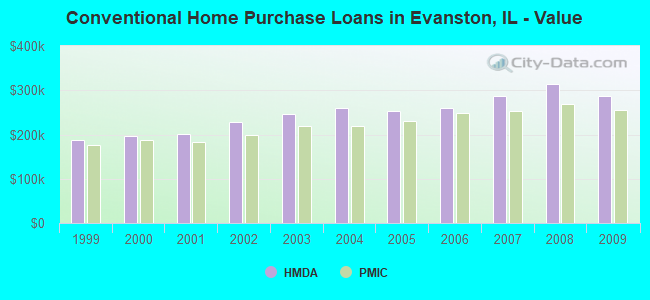
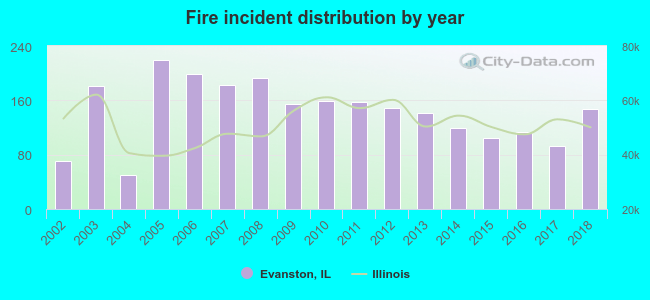 According to the data from the years 2002 - 2018 the average number of fires per year is 143. The highest number of reported fires - 220 took place in 2005, and the least - 50 in 2004. The data has a growing trend.
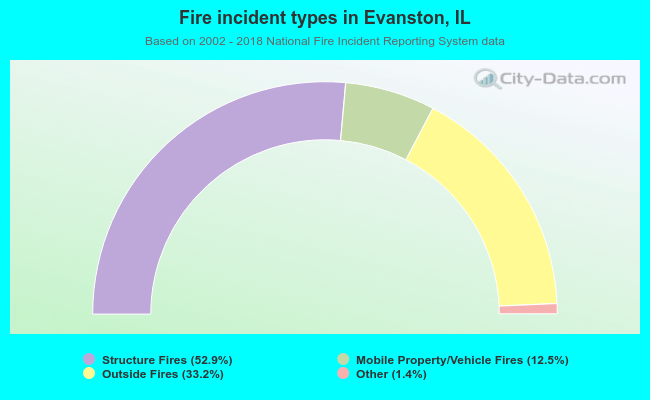 When looking into fire subcategories, the most incidents belonged to: Structure Fires (52.9%), and Outside Fires (33.2%).