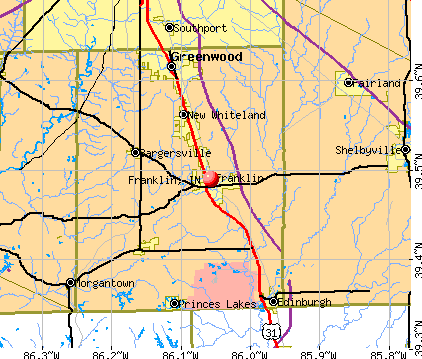
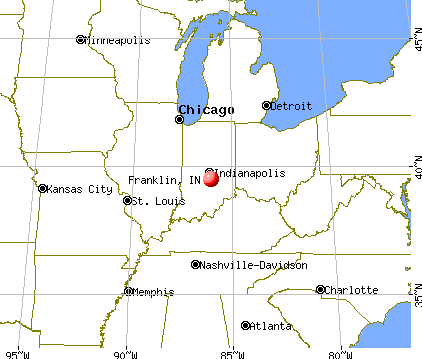
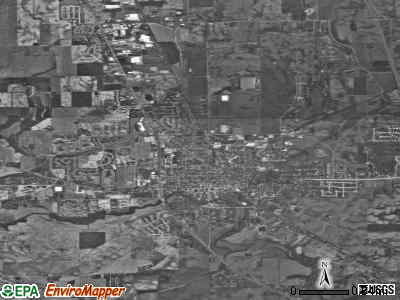
Franklin, Indiana

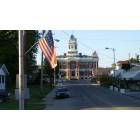
Franklin: franklin, johnson county courthouse
Franklin: Lookig north to the Court house from the Province Park area
- add
your
Submit your own pictures of this city and show them to the world
- OSM Map
- General Map
- Google Map
- MSN Map
Population change since 2000: +32.2%
| Males: 11,999 | |
| Females: 13,729 |
| Median resident age: | 34.6 years |
| Indiana median age: | 38.2 years |
Zip codes: 46131.
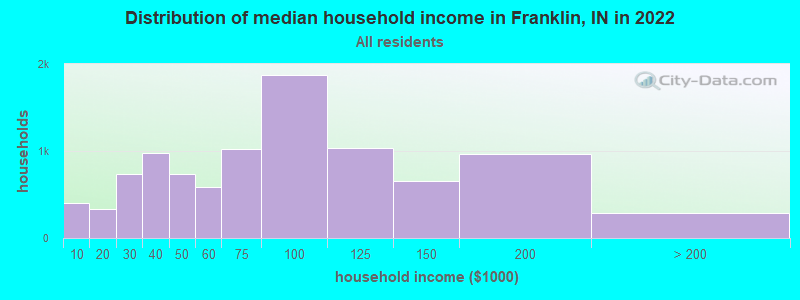
| Franklin: | $71,417 |
| IN: | $66,785 |
Estimated per capita income in 2022: $32,475 (it was $18,937 in 2000)
Franklin city income, earnings, and wages data
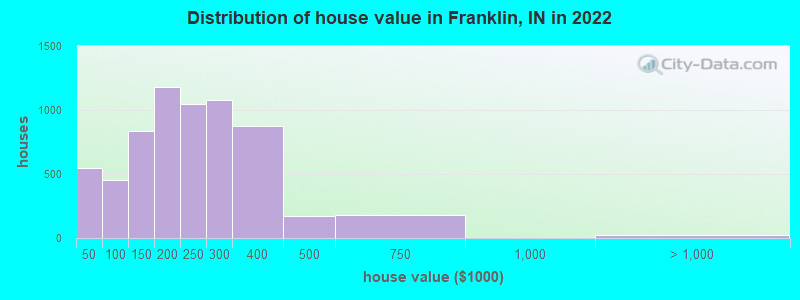
Estimated median house or condo value in 2022: $228,819 (it was $97,600 in 2000)
| Franklin: | $228,819 |
| IN: | $208,700 |
Mean prices in 2022: all housing units: $202,872; detached houses: $211,134; townhouses or other attached units: $205,142; in 2-unit structures: $166,742; in 5-or-more-unit structures: $182,504; mobile homes: $20,593
Median gross rent in 2022: $1,095.
(11.2% for White Non-Hispanic residents, 18.1% for Hispanic or Latino residents, 13.5% for other race residents, 25.1% for two or more races residents)
Detailed information about poverty and poor residents in Franklin, IN


Compare current foreclosures in Franklin, IN:
| Photo | Address | Area | Beds / Baths | Price | Details |
|---|---|---|---|---|---|

|
#1
Eastpointe Dr
Franklin, IN 46131
|
1,512 sq. feet
|
2 baths 3 beds |
show details | |

|
#2
Capricorn Dr
Franklin, IN 46131
|
2,651 sq. feet
|
3 baths 4 beds |
show details | |

|
#3
Hillside Dr
Franklin, IN 46131
|
1,708 sq. feet
|
2 baths 3 beds |
show details | |

|
#4
Pamela Dr
Franklin, IN 46131
|
2,522 sq. feet
|
2 baths 3 beds |
show details | |

|
#5
Younce St
Franklin, IN 46131
|
1,225 sq. feet
|
1 baths 3 beds |
show details | |

|
#6
Sycamore Ct
Franklin, IN 46131
|
1,152 sq. feet
|
2 baths 3 beds |
show details | |

|
#7
N Aberdeen Dr
Franklin, IN 46131
|
1,494 sq. feet
|
2 baths 3 beds |
show details | |

|
#8
Cedarmill Dr
Franklin, IN 46131
|
2,360 sq. feet
|
2 baths 4 beds |
show details | |

|
#9
Paul Hand Blvd
Franklin, IN 46131
|
1,242 sq. feet
|
2 baths 2 beds |
show details | |

|
#10
Eastpointe Dr
Franklin, IN 46131
|
1,450 sq. feet
|
2 baths 3 beds |
show details |
| Photo | Address | Area | Beds / Baths | Price | Details |
|---|---|---|---|---|---|

|
#11
Young St
Franklin, IN 46131
|
1,595 sq. feet
|
2 baths 1 beds |
show details | |

|
#12
Blackthorn Dr
Franklin, IN 46131
|
1,640 sq. feet
|
2 baths 3 beds |
show details | |

|
#13
Hamilton Ave
Franklin, IN 46131
|
896 sq. feet
|
1 baths 3 beds |
show details | |

|
#14
E Madison St
Franklin, IN 46131
|
4,856 sq. feet
|
4 baths 6 beds |
show details | |

|
#15
Spring Meadow Ct
Franklin, IN 46131
|
1,252 sq. feet
|
2 baths 3 beds |
show details | |

|
#16
Colonial Way
Franklin, IN 46131
|
1,225 sq. feet
|
2 baths 3 beds |
show details | |

|
#17
William Ave
Franklin, IN 46131
|
1,060 sq. feet
|
2 baths 4 beds |
show details | |

|
#18
Bridlewood Dr
Franklin, IN 46131
|
1,510 sq. feet
|
2 baths 4 beds |
show details | |

|
#19
Lincoln Ct
Franklin, IN 46131
|
1,323 sq. feet
|
1 baths 3 beds |
show details | |

|
#20
Sextant Dr
Franklin, IN 46131
|
1,432 sq. feet
|
2 baths 2 beds |
show details |
| Photo | Address | Area | Beds / Baths | Price | Details |
|---|---|---|---|---|---|

|
#21
Yandes St
Franklin, IN 46131
|
1,430 sq. feet
|
2 baths 2 beds |
show details | |

|
#22
Yandes St
Franklin, IN 46131
|
1,002 sq. feet
|
1 baths 3 beds |
show details | |

|
#23
Champ Ulysses St
Franklin, IN 46131
|
1,164 sq. feet
|
1 baths 3 beds |
show details | |

|
#24
Ridgewood Mdws
Franklin, IN 46131
|
2,131 sq. feet
|
2 baths 4 beds |
show details | |

|
#25
Pin Oak Ct
Franklin, IN 46131
|
1,400 sq. feet
|
2 baths 3 beds |
show details | |

|
#26
Canary Creek Dr
Franklin, IN 46131
|
1,413 sq. feet
|
2 baths 3 beds |
show details | |

|
#27
Churchill Rd
Franklin, IN 46131
|
999 sq. feet
|
1 baths 3 beds |
show details | |

|
#28
Crescent St
Franklin, IN 46131
|
1,225 sq. feet
|
1 baths 3 beds |
show details | |

|
#29
Fairoaks Dr
Franklin, IN 46131
|
1,620 sq. feet
|
2 baths 4 beds |
show details | |

|
#30
Harvest Ridge Cir
Franklin, IN 46131
|
1,920 sq. feet
|
2 baths 3 beds |
show details |
| Photo | Address | Area | Beds / Baths | Price | Details |
|---|---|---|---|---|---|

|
#31
E 200 N
Franklin, IN 46131
|
2,559 sq. feet
|
2 baths 4 beds |
show details | |

|
#32
Turning Leaf Dr
Franklin, IN 46131
|
2,785 sq. feet
|
2 baths 3 beds |
show details | |

|
#33
Niagara Ln
Franklin, IN 46131
|
2,354 sq. feet
|
2 baths - beds |
show details | |

|
#34
Stonehurst Dr
Franklin, IN 46131
|
1,992 sq. feet
|
2 baths - beds |
show details | |

|
#35
S Aberdeen Dr
Franklin, IN 46131
|
- sq. feet
|
- baths - beds |
show details | |

|
#36
Galaxy Dr
Franklin, IN 46131
|
- sq. feet
|
- baths - beds |
show details | |

|
#37
S Home Ave Apt A9
Franklin, IN 46131
|
- sq. feet
|
- baths - beds |
show details | |

|
#38
Franklin Place Ct
Franklin, IN 46131
|
- sq. feet
|
- baths - beds |
show details | |

|
#39
N Aberdeen Dr
Franklin, IN 46131
|
- sq. feet
|
- baths - beds |
show details | |

|
#40
S Aberdeen Dr
Franklin, IN 46131
|
- sq. feet
|
- baths - beds |
show details |
| Photo | Address | Area | Beds / Baths | Price | Details |
|---|---|---|---|---|---|

|
#41
Old Plank Rd # 44
Franklin, IN 46131
|
- sq. feet
|
- baths - beds |
show details | |

|
#42
Constellation Way
Franklin, IN 46131
|
- sq. feet
|
- baths - beds |
show details | |

|
#43
Gosling Ct
Franklin, IN 46131
|
- sq. feet
|
- baths - beds |
show details | |

|
#44
E Adams St
Franklin, IN 46131
|
- sq. feet
|
- baths - beds |
show details | |

|
#45
Bristol Dr
Franklin, IN 46131
|
- sq. feet
|
- baths - beds |
show details | |

|
#46
Bristol Dr
Franklin, IN 46131
|
- sq. feet
|
- baths - beds |
show details | |

|
#47
Sagittarius Ave
Franklin, IN 46131
|
- sq. feet
|
- baths - beds |
show details | |

|
#48
Brookshire Dr
Franklin, IN 46131
|
- sq. feet
|
- baths - beds |
show details | |

|
#49
Brookdale Ct
Franklin, IN 46131
|
- sq. feet
|
- baths - beds |
show details | |

|
Check over 1 million property listings on Foreclosure.com!
|
browse all offers | |||


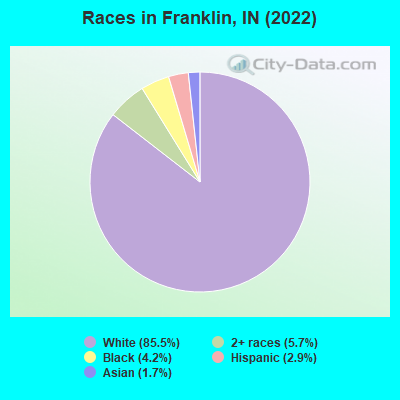
- 22,82485.5%White alone
- 1,5085.7%Two or more races
- 1,1294.2%Black alone
- 7712.9%Hispanic
- 4421.7%Asian alone
- 170.06%Other race alone
- 140.05%American Indian alone
Races in Franklin detailed stats: ancestries, foreign born residents, place of birth
According to our research of Indiana and other state lists, there were 4 registered sex offenders living in Franklin, Indiana as of April 27, 2024.
The ratio of all residents to sex offenders in Franklin is 6,045 to 1.
The ratio of registered sex offenders to all residents in this city is much lower than the state average.
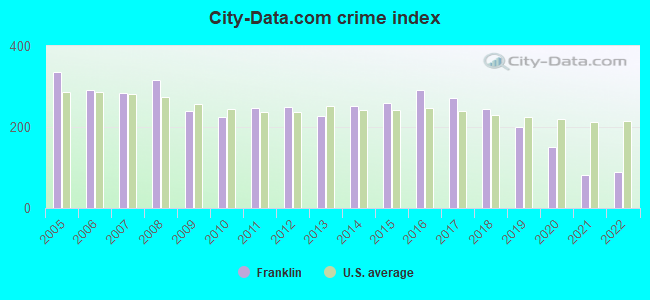
Type |
2009 |
2010 |
2011 |
2012 |
2013 |
2014 |
2015 |
2016 |
2017 |
2018 |
2019 |
2020 |
2021 |
2022 |
|---|---|---|---|---|---|---|---|---|---|---|---|---|---|---|
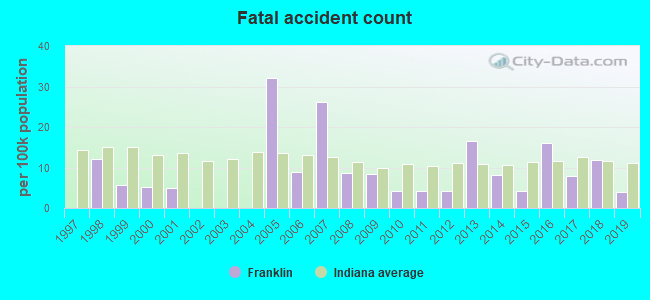
| Murders (per 100,000) | 0 (0.0) | 0 (0.0) | 0 (0.0) | 0 (0.0) | 0 (0.0) | 2 (8.2) | 0 (0.0) | 0 (0.0) | 0 (0.0) | 0 (0.0) | 0 (0.0) | 1 (3.9) | 0 (0.0) | 0 (0.0) |
| Rapes (per 100,000) | 7 (29.5) | 6 (25.3) | 5 (21.0) | 0 (0.0) | 2 (8.3) | 2 (8.2) | 3 (12.2) | 5 (20.2) | 8 (31.9) | 8 (31.6) | 13 (51.1) | 12 (46.5) | 6 (23.0) | 7 (27.2) |
| Robberies (per 100,000) | 8 (33.7) | 3 (12.7) | 12 (50.4) | 13 (53.9) | 8 (33.3) | 6 (24.7) | 6 (24.5) | 11 (44.4) | 7 (27.9) | 7 (27.7) | 5 (19.7) | 3 (11.6) | 3 (11.5) | 1 (3.9) |
| Assaults (per 100,000) | 65 (274.2) | 42 (177.1) | 42 (176.2) | 47 (194.9) | 59 (245.5) | 65 (267.4) | 80 (326.4) | 99 (399.6) | 112 (446.9) | 114 (450.8) | 76 (298.7) | 20 (77.4) | 10 (38.3) | 13 (50.6) |
| Burglaries (per 100,000) | 85 (358.6) | 96 (404.9) | 99 (415.4) | 126 (522.5) | 54 (224.7) | 83 (341.4) | 90 (367.2) | 87 (351.2) | 76 (303.3) | 51 (201.7) | 48 (188.7) | 40 (154.9) | 16 (61.3) | 13 (50.6) |
| Thefts (per 100,000) | 728 (3,071) | 799 (3,370) | 878 (3,684) | 920 (3,815) | 853 (3,549) | 857 (3,525) | 880 (3,590) | 947 (3,823) | 755 (3,013) | 637 (2,519) | 437 (1,718) | 395 (1,530) | 258 (988.8) | 280 (1,089) |
| Auto thefts (per 100,000) | 10 (42.2) | 8 (33.7) | 14 (58.7) | 16 (66.3) | 9 (37.4) | 12 (49.4) | 21 (85.7) | 15 (60.5) | 20 (79.8) | 20 (79.1) | 33 (129.7) | 44 (170.4) | 24 (92.0) | 30 (116.7) |
| Arson (per 100,000) | 1 (4.2) | 3 (12.7) | 0 (0.0) | 1 (4.1) | 1 (4.2) | 1 (4.1) | 3 (12.2) | 0 (0.0) | 0 (0.0) | 2 (7.9) | 0 (0.0) | 0 (0.0) | 2 (7.7) | 0 (0.0) |
| City-Data.com crime index | 239.9 | 225.3 | 248.3 | 249.6 | 226.4 | 252.8 | 258.6 | 291.7 | 271.4 | 245.0 | 198.8 | 149.5 | 80.7 | 89.5 |
The City-Data.com crime index weighs serious crimes and violent crimes more heavily. Higher means more crime, U.S. average is 246.1. It adjusts for the number of visitors and daily workers commuting into cities.
Crime rate in Franklin detailed stats: murders, rapes, robberies, assaults, burglaries, thefts, arson
Full-time law enforcement employees in 2021, including police officers: 60 (53 officers - 51 male; 2 female).
| Officers per 1,000 residents here: | 2.03 |
| Indiana average: | 2.16 |
 Recent articles from our blog. Our writers, many of them Ph.D. graduates or candidates, create easy-to-read articles on a wide variety of topics.

 | Tell me about Franklin/Greenwood Indiana (28 replies) |
| Is my impression of Indianapolis accurate? (167 replies) |
| Retire in Greenwood/Franklin, Columbus, Newburgh/Chandler, New Albany/Georgetown/Lanesville, Sellersburg, Madison, IN? (17 replies) |
| Looking to Move to Indianapolis area (33 replies) |
| Shelbyville, Rushville ? (3 replies) |
| Franklin, IN and vicinity? (2 replies) |
Latest news from Franklin, IN collected exclusively by city-data.com from local newspapers, TV, and radio stations
Ancestries: American (34.7%), German (14.6%), English (8.2%), Irish (7.2%), European (2.4%), Scottish (1.9%).
Current Local Time: EST time zone
Land area: 11.3 square miles.
Population density: 2,284 people per square mile (low).
738 residents are foreign born (1.2% Asia, 1.1% Europe).
| This city: | 2.8% |
| Indiana: | 5.6% |
Median real estate property taxes paid for housing units with mortgages in 2022: $1,616 (0.7%)
Median real estate property taxes paid for housing units with no mortgage in 2022: $2,005 (0.9%)
Nearest city with pop. 50,000+: Indianapolis, IN  (21.4 miles , pop. 781,870).
Nearest city with pop. 1,000,000+: Chicago, IL (183.5 miles , pop. 2,896,016).
Nearest cities:
), ), ), )Latitude: 39.49 N, Longitude: 86.06 W
Daytime population change due to commuting: -454 (-1.7%)
Workers who live and work in this city: 5,095 (38.9%)
Area code: 317
Franklin, Indiana accommodation & food services, waste management - Economy and Business Data
Single-family new house construction building permits:
- 2022: 101 buildings, average cost: $304,500
- 2021: 175 buildings, average cost: $253,500
- 2020: 159 buildings, average cost: $223,100
- 2019: 93 buildings, average cost: $206,000
- 2018: 174 buildings, average cost: $200,900
- 2017: 131 buildings, average cost: $188,400
- 2016: 63 buildings, average cost: $141,100
- 2015: 62 buildings, average cost: $146,400
- 2014: 75 buildings, average cost: $133,100
- 2013: 55 buildings, average cost: $150,800
- 2012: 36 buildings, average cost: $130,700
- 2011: 29 buildings, average cost: $128,600
- 2010: 33 buildings, average cost: $154,900
- 2009: 22 buildings, average cost: $121,600
- 2008: 67 buildings, average cost: $138,700
- 2007: 114 buildings, average cost: $133,200
- 2006: 155 buildings, average cost: $138,900
- 2005: 261 buildings, average cost: $126,400
- 2004: 307 buildings, average cost: $129,300
- 2003: 163 buildings, average cost: $126,800
- 2002: 232 buildings, average cost: $112,000
- 2001: 200 buildings, average cost: $115,800
- 2000: 292 buildings, average cost: $96,900
- 1999: 334 buildings, average cost: $98,000
- 1998: 297 buildings, average cost: $99,000
- 1997: 314 buildings, average cost: $94,800
| Here: | 2.2% |
| Indiana: | 2.8% |
Population change in the 1990s: +6,873 (+54.6%).
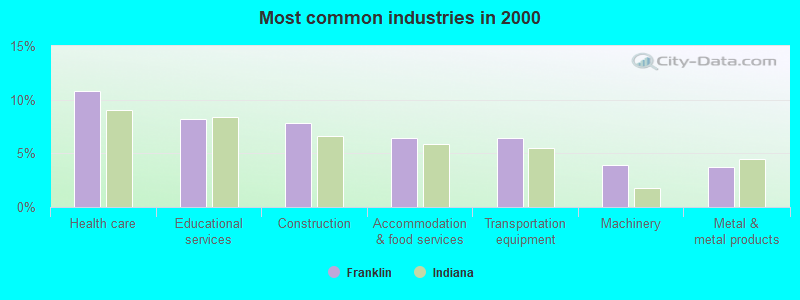
- Health care (10.8%)
- Educational services (8.2%)
- Construction (7.9%)
- Accommodation & food services (6.4%)
- Transportation equipment (6.4%)
- Machinery (3.9%)
- Metal & metal products (3.7%)
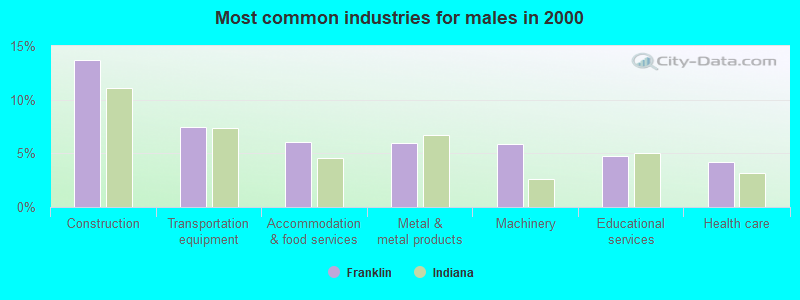
- Construction (13.7%)
- Transportation equipment (7.5%)
- Accommodation & food services (6.0%)
- Metal & metal products (5.9%)
- Machinery (5.9%)
- Educational services (4.7%)
- Health care (4.2%)
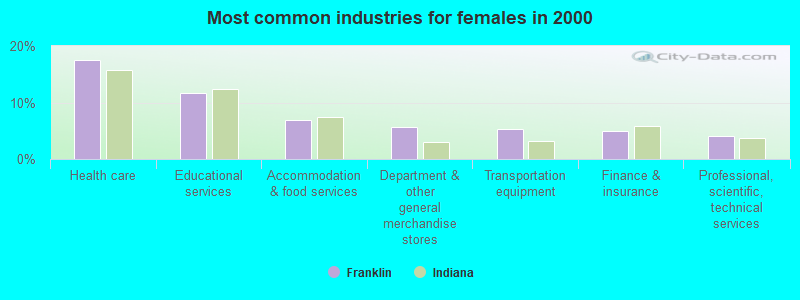
- Health care (17.6%)
- Educational services (11.7%)
- Accommodation & food services (6.9%)
- Department & other general merchandise stores (5.6%)
- Transportation equipment (5.3%)
- Finance & insurance (5.0%)
- Professional, scientific, technical services (4.0%)
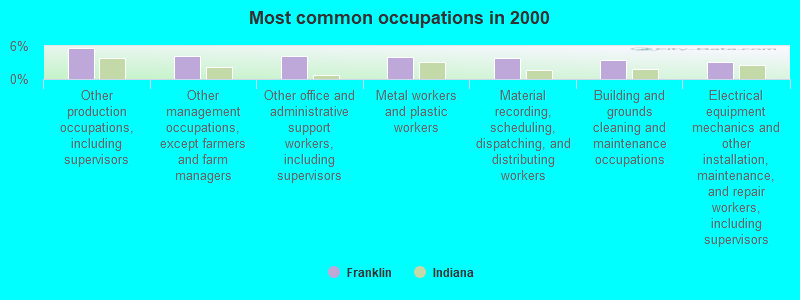
- Other production occupations, including supervisors (5.7%)
- Other management occupations, except farmers and farm managers (4.2%)
- Other office and administrative support workers, including supervisors (4.1%)
- Metal workers and plastic workers (4.1%)
- Material recording, scheduling, dispatching, and distributing workers (3.8%)
- Building and grounds cleaning and maintenance occupations (3.4%)
- Electrical equipment mechanics and other installation, maintenance, and repair workers, including supervisors (3.1%)
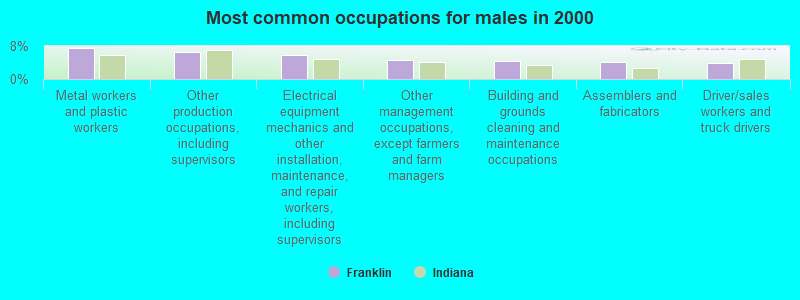
- Metal workers and plastic workers (7.5%)
- Other production occupations, including supervisors (6.4%)
- Electrical equipment mechanics and other installation, maintenance, and repair workers, including supervisors (5.9%)
- Other management occupations, except farmers and farm managers (4.6%)
- Building and grounds cleaning and maintenance occupations (4.3%)
- Assemblers and fabricators (4.0%)
- Driver/sales workers and truck drivers (4.0%)
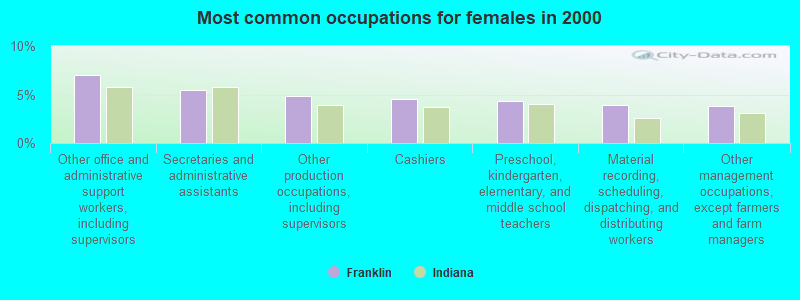
- Other office and administrative support workers, including supervisors (7.0%)
- Secretaries and administrative assistants (5.5%)
- Other production occupations, including supervisors (4.9%)
- Cashiers (4.5%)
- Preschool, kindergarten, elementary, and middle school teachers (4.3%)
- Material recording, scheduling, dispatching, and distributing workers (3.9%)
- Other management occupations, except farmers and farm managers (3.8%)
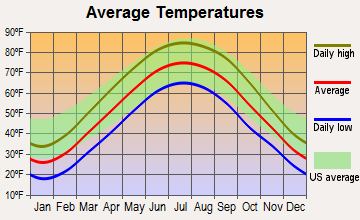
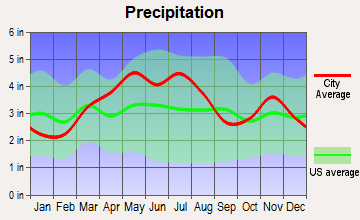
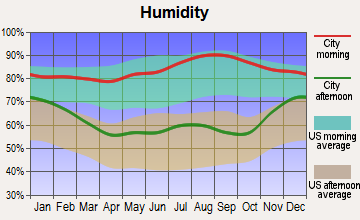
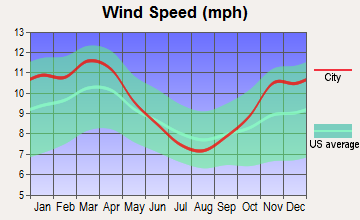
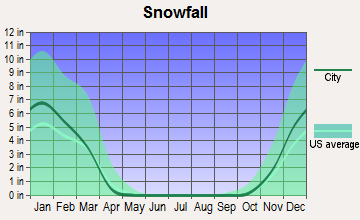
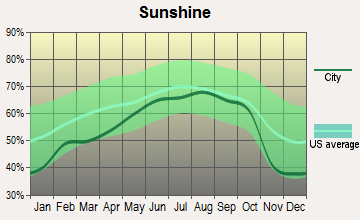
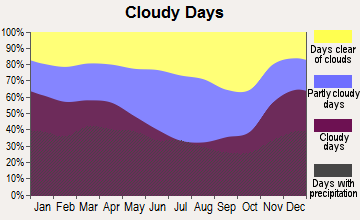
Average climate in Franklin, Indiana
Based on data reported by over 4,000 weather stations
|
|


(lower is better)
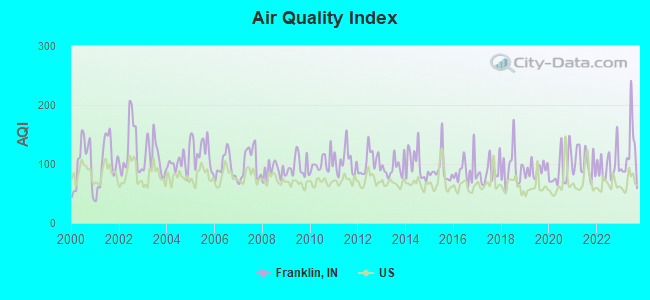
Air Quality Index (AQI) level in 2023 was 118. This is significantly worse than average.
| City: | 118 |
| U.S.: | 73 |
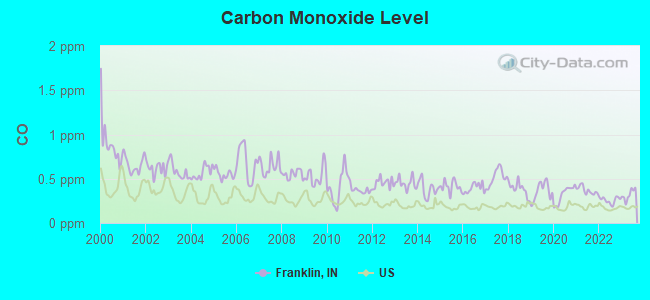
Carbon Monoxide (CO) [ppm] level in 2023 was 0.319. This is worse than average. Closest monitor was 19.2 miles away from the city center.
| City: | 0.319 |
| U.S.: | 0.251 |
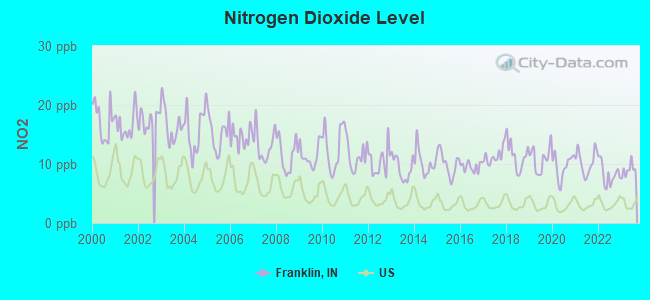
Nitrogen Dioxide (NO2) [ppb] level in 2023 was 8.99. This is significantly worse than average. Closest monitor was 15.3 miles away from the city center.
| City: | 8.99 |
| U.S.: | 5.11 |
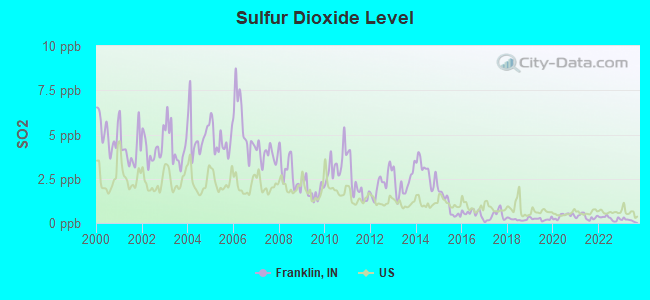
Sulfur Dioxide (SO2) [ppb] level in 2023 was 0.165. This is significantly better than average. Closest monitor was 14.9 miles away from the city center.
| City: | 0.165 |
| U.S.: | 1.515 |
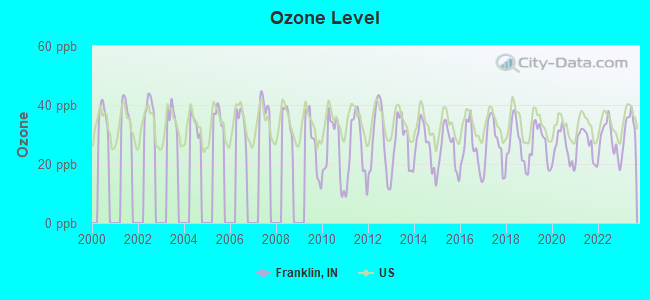
Ozone [ppb] level in 2023 was 32.2. This is about average. Closest monitor was 7.2 miles away from the city center.
| City: | 32.2 |
| U.S.: | 33.3 |
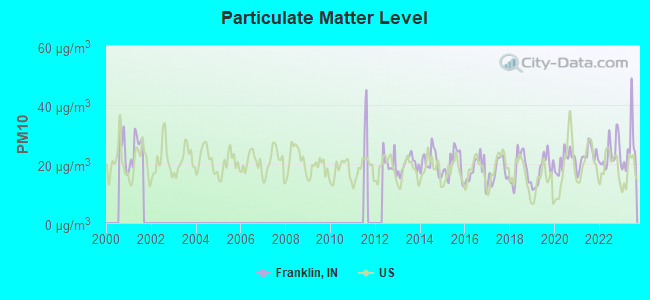
Particulate Matter (PM10) [µg/m3] level in 2023 was 25.4. This is worse than average. Closest monitor was 14.9 miles away from the city center.
| City: | 25.4 |
| U.S.: | 19.2 |
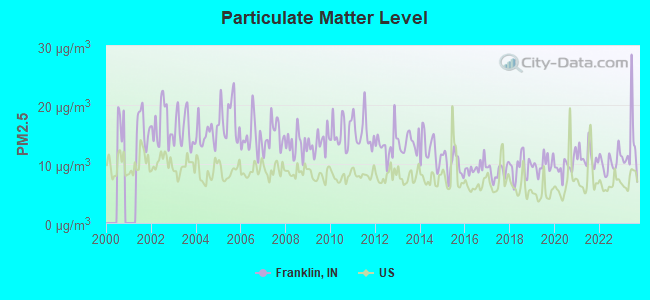
Particulate Matter (PM2.5) [µg/m3] level in 2023 was 12.8. This is significantly worse than average. Closest monitor was 14.9 miles away from the city center.
| City: | 12.8 |
| U.S.: | 8.1 |
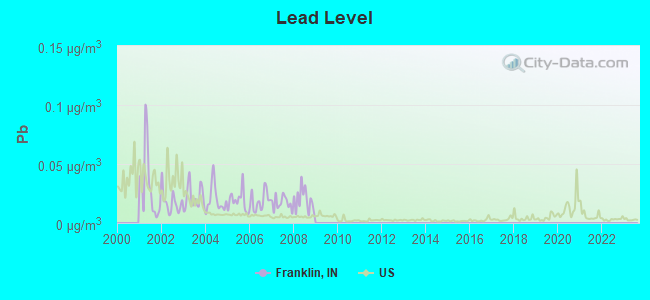
Lead (Pb) [µg/m3] level in 2008 was 0.0197. This is significantly worse than average. Closest monitor was 14.9 miles away from the city center.
| City: | 0.0197 |
| U.S.: | 0.0093 |
Tornado activity:
Franklin-area historical tornado activity is slightly above Indiana state average. It is 123% greater than the overall U.S. average.
On 4/25/1961, a category F4 (max. wind speeds 207-260 mph) tornado 15.1 miles away from the Franklin city center injured 7 people and caused between $500,000 and $5,000,000 in damages.
On 5/14/1972, a category F4 tornado 19.4 miles away from the city center injured 20 people and caused between $50,000 and $500,000 in damages.
Earthquake activity:
Franklin-area historical earthquake activity is significantly above Indiana state average. It is 87% greater than the overall U.S. average.On 4/18/2008 at 09:36:59, a magnitude 5.4 (5.1 MB, 4.8 MS, 5.4 MW, 5.2 MW, Class: Moderate, Intensity: VI - VII) earthquake occurred 121.8 miles away from the city center
On 4/18/2008 at 09:36:59, a magnitude 5.2 (5.2 MW, Depth: 8.9 mi) earthquake occurred 121.8 miles away from Franklin center
On 6/10/1987 at 23:48:54, a magnitude 5.1 (4.9 MB, 4.4 MS, 4.6 MS, 5.1 LG) earthquake occurred 108.4 miles away from Franklin center
On 7/27/1980 at 18:52:21, a magnitude 5.2 (5.1 MB, 4.7 MS, 5.0 UK, 5.2 UK) earthquake occurred 144.4 miles away from Franklin center
On 6/18/2002 at 17:37:15, a magnitude 5.0 (4.3 MB, 4.6 MW, 5.0 LG) earthquake occurred 139.4 miles away from the city center
On 4/18/2008 at 15:14:16, a magnitude 4.8 (4.5 MB, 4.8 MW, 4.6 MW, Class: Light, Intensity: IV - V) earthquake occurred 119.1 miles away from Franklin center
Magnitude types: regional Lg-wave magnitude (LG), body-wave magnitude (MB), surface-wave magnitude (MS), moment magnitude (MW)
Natural disasters:
The number of natural disasters in Johnson County (13) is near the US average (15).Major Disasters (Presidential) Declared: 9
Emergencies Declared: 3
Causes of natural disasters: Floods: 6, Storms: 6, Tornadoes: 4, Winter Storms: 3, Blizzard: 1, Hurricane: 1, Snow: 1, Snowstorm: 1, Other: 1 (Note: some incidents may be assigned to more than one category).

Hospitals in Franklin:
- AMERICARE HOSPICE (1150 N MAIN ST, SUITE A)
- CARDINAL SERVICE MGMT, INC (1650 E JEFFERSON ST)
- CARDINAL SERVICE MGMT, INC (699 GRAHAM ST)
- JOHNSON MEMORIAL HOSPITAL (Government - Local, provides emergency services, 1125 W JEFFERSON ST)
Nursing Homes in Franklin:
- FRANKLIN MEADOWS (1285 W JEFFERSON ST)
- FRANKLIN UNITED METHODIST COMMUNITY (1070 W JEFFERSON ST)
- HICKORY CREEK AT FRANKLIN (580 LEMLEY ST)
- HOMEVIEW CENTER OF FRANKLIN (651 S STATE ST)
- INDIANA MASONIC HOME INC (690 S STATE ST)
- RECORDS AUTUMN CARE RETIREMEN (1109 NORTH MAIN STREET, PO BOX 277)
- TODD-AIKENS HEALTH CENTER (1125 W JEFFERSON ST)
- WELCOME NURSING HOME (1109 NORTH MAIN STREET)
Dialysis Facilities in Franklin:
- DAVITA - DIALYSIS - FRANKLIN (1140 W JEFFERSON STREET, SUITE A)
- FMC - FRANKLIN (1159 WEST JEFFERSON ST., SUITE 201)
Home Health Centers in Franklin:
Airports and heliports located in Franklin:
- Canary's Airport (20IN) (Runways: 1)
- Franklin Flying Field Airport (3FK) (Runways: 1)
- Woods Field Airport (63II) (Runways: 1)
- Johnson Memorial Hospital Heliport (55II)
College/University in Franklin:
Colleges/universities with over 2000 students nearest to Franklin:
- University of Indianapolis (about 16 miles; Indianapolis, IN; Full-time enrollment: 4,625)
- Harrison College-Indianapolis (about 20 miles; Indianapolis, IN; FT enrollment: 4,244)
- American College of Education (about 21 miles; Indianapolis, IN; FT enrollment: 2,718)
- Indiana University-Purdue University-Indianapolis (about 21 miles; Indianapolis, IN; FT enrollment: 22,751)
- Ivy Tech Community College (about 23 miles; Indianapolis, IN; FT enrollment: 71,493)
- Marian University (about 24 miles; Indianapolis, IN; FT enrollment: 2,476)
- Butler University (about 26 miles; Indianapolis, IN; FT enrollment: 4,388)
Public high school in Franklin:
Public elementary/middle schools in Franklin:
- FRANKLIN COMMUNITY MIDDLE SCHOOL (Students: 1,409, Location: 625 GRIZZLY CUB DR, Grades: 7-8)
- CREEKSIDE ELEMENTARY SCH (Students: 653, Location: 700 E SR 44, Grades: KG-4)
- CLARK ELEMENTARY SCHOOL (Students: 613, Location: CR 700 N & 575 E, Grades: KG-4)
- NORTHWOOD ELEMENTARY SCHOOL (Students: 604, Location: 965 GRIZZLY CUB DR, Grades: PK-4)
- NEEDHAM ELEMENTARY SCHOOL (Students: 482, Location: 1399 UPPER SHELBYVILLE RD, Grades: KG-4)
- WEBB ELEMENTARY SCHOOL (Students: 405, Location: 1400 WEBB CT, Grades: KG-4)
- CUSTER BAKER INTERMEDIATE SCHOOL (Location: 101 W SR 44, Grades: 5-6)
Private elementary/middle school in Franklin:
- ST ROSE OF LIMA SCHOOL (Students: 183, Location: 114 LANCELOT DR, Grades: PK-8)
User-submitted facts and corrections:
- St. Rose of Lima School has grades Pre-K through 8 and has approx. 200 students enrolled.
Points of interest:
Notable locations in Franklin: Hillview Country Club (A), Stewart "Red" Faught Stadium (B), Johnson County Courthouse Square (C), Canary Creek Outdoor Cinema (D), Von Boll Welcome Center (E), Spurlock Center (F), Shirk Hall (G), Old Main (H), Napolitan Student Center (I), Napolitan Alumni House (J), Johnson-Dietz Hall (K), Johnson Center for The Arts (L), Hoover Hall (M), Hamilton Library (N), Elsey Hall (O), Dietz Center (P), Cline Hall (Q), Barnes Science Hall (R), Masonic Home (S), Franklin Fire Department Station 21 (T). Display/hide their locations on the map
Churches in Franklin include: Franklin Assembly Church (A), Franklin Church of the Nazarene (B), First Baptist Church (C), First Presbyterian Church (D), Tabernacle Christian Church (E), First Separate Baptist Church (F), Grace United Methodist Church (G), Temple Baptist Church (H), Saint Andrew's Anglican Catholic Church (I). Display/hide their locations on the map
Cemetery: Greenlawn Cemetery (1). Display/hide its location on the map
Creek: Hurricane Creek (A). Display/hide its location on the map
Parks in Franklin include: Province Park (1), Runkle Tennis Courts (2), Dame Mall (3). Display/hide their locations on the map
Tourist attraction: Johnson County Offices & Departments - Museum (135 North Main Street).
Hotels: Hilltop Motel (5351 South US Highway 31), Carlton Lodge (2122 Holiday Lane), Lake Motel & Campground (2099 South US Highway 31), Quality Inn Franklin (150 Lovers Lane), Howard Johnson (176 North Lovers Lane), Land-O-Nod Motel (1900 South US Highway 31), Sleep-N-Time Motel (2540 South US Highway 31), Days Inn (2180 East King Street), Super 8 Franklin (188 Lovers Lane).
Courts: Johnson County - Offices & Departments- Juvenile Court (1121 Hospital Road), Johnson County - Offices & Departments- Courts- Circuit Court (Courthouse), Franklin City - City Court (1 Caisson Drive).
Birthplace of: Jon Schaffer - Heavy metal guitarist, Andrew Duggan - Film actor, Max Terhune - Actor, Nick Hardwick - 2005 NFL player (San Diego Chargers, born: Sep 12, 1981), Homer Bone - Federal judge, Marcellus M. Crocker - Union Army general, Clinton L. Armstrong - Union Army Medal of Honor recipient, J.R. Angle - College basketball player (Iowa Hawkeyes), Marcus Peter Blakemore - Solider, Maude Turner Gordon - Actor.
Drinking water stations with addresses in Franklin and their reported violations in the past:
SHILOH COMMUNITY CHURCH (Population served: 35, Groundwater):Past health violations:
- MCL, Monthly (TCR) - In DEC-2011, Contaminant: Coliform. Follow-up actions: St Violation/Reminder Notice (DEC-30-2011), St Public Notif requested (DEC-30-2011), St Boil Water Order (DEC-30-2011), St Compliance achieved (FEB-24-2012)
- MCL, Monthly (TCR) - In MAY-2009, Contaminant: Coliform. Follow-up actions: St Public Notif requested (JUN-04-2009), St Violation/Reminder Notice (JUN-04-2009), St Boil Water Order (JUN-04-2009), St Compliance achieved (MAR-24-2010)
Drinking water stations with addresses in Franklin that have no violations reported:
- INDIANA MASONIC HOME (Population served: 450, Primary Water Source Type: Groundwater)
| This city: | 2.5 people |
| Indiana: | 2.5 people |
| This city: | 67.4% |
| Whole state: | 66.9% |
| This city: | 7.4% |
| Whole state: | 6.9% |
Likely homosexual households (counted as self-reported same-sex unmarried-partner households)
- Lesbian couples: 0.4% of all households
- Gay men: 0.3% of all households
People in group quarters in Franklin in 2010:
- 589 people in college/university student housing
- 480 people in nursing facilities/skilled-nursing facilities
- 98 people in correctional facilities intended for juveniles
People in group quarters in Franklin in 2000:
- 721 people in other noninstitutional group quarters
- 673 people in college dormitories (includes college quarters off campus)
- 462 people in nursing homes
- 13 people in homes for the mentally ill
- 12 people in homes for the mentally retarded
- 8 people in schools, hospitals, or wards for the intellectually disabled
Banks with most branches in Franklin (2011 data):
- Mutual Savings Bank: at 80 East Jefferson Street, Methodist Home Branch, Main Street Branch. Info updated 2008/09/02: Bank assets: $118.9 mil, Deposits: $89.0 mil, local headquarters, positive income, Commercial Lending Specialization, 6 total offices, Holding Company: Third Century Bancorp
- MainSource Bank: Banta Street Branch at 597 Banta Street, branch established on 1996/10/31. Info updated 2009/12/09: Bank assets: $2,729.1 mil, Deposits: $2,167.0 mil, headquarters in Greensburg, IN, positive income, 86 total offices, Holding Company: Mainsource Financial Group, Inc.
- Old National Bank: Franklin/Walmart Branch at 2125 N Morton St, branch established on 2004/11/12. Info updated 2011/08/01: Bank assets: $8,467.9 mil, Deposits: $6,653.1 mil, headquarters in Evansville, IN, positive income, 195 total offices, Holding Company: Old National Bancorp
- PNC Bank, National Association: Franklin at 1500 North Morton Street, branch established on 1988/03/23. Info updated 2012/03/20: Bank assets: $263,309.6 mil, Deposits: $197,343.0 mil, headquarters in Wilmington, DE, positive income, Commercial Lending Specialization, 3085 total offices, Holding Company: Pnc Financial Services Group, Inc., The
- The Huntington National Bank: Franklin Marsh Branch at 1126 North Main, branch established on 1992/03/01. Info updated 2012/04/02: Bank assets: $54,183.4 mil, Deposits: $44,300.3 mil, headquarters in Columbus, OH, positive income, Commercial Lending Specialization, 878 total offices, Holding Company: Huntington Bancshares Incorporated
- Heartland Community Bank: at 420 North Morton Street, branch established on 1997/12/17. Info updated 2006/11/03: Bank assets: $245.3 mil, Deposits: $218.7 mil, local headquarters, positive income, Commercial Lending Specialization, 6 total offices, Holding Company: Heartland Bancshares, Inc.
- First Financial Bank, National Association: Franklin Branch at 1073 West Jefferson Street, branch established on 1994/08/16. Info updated 2009/09/21: Bank assets: $6,663.4 mil, Deposits: $5,754.9 mil, headquarters in Hamilton, OH, positive income, Commercial Lending Specialization, 101 total offices, Holding Company: First Financial Bancorp
- JPMorgan Chase Bank, National Association: Franklin at 1600 N Morton St, branch established on 1972/01/13. Info updated 2011/11/10: Bank assets: $1,811,678.0 mil, Deposits: $1,190,738.0 mil, headquarters in Columbus, OH, positive income, International Specialization, 5577 total offices, Holding Company: Jpmorgan Chase & Co.
- BMO Harris Bank National Association: Franklin In Branch at 2389 North Morton Street, branch established on 2009/04/20. Info updated 2011/07/14: Bank assets: $97,264.0 mil, Deposits: $75,624.6 mil, headquarters in Chicago, IL, positive income, 717 total offices, Holding Company: Bank Of Montreal
- 4 other banks with 4 local branches
For population 15 years and over in Franklin:
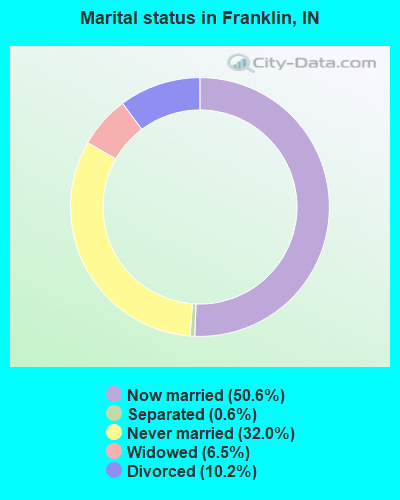
- Never married: 32.0%
- Now married: 50.6%
- Separated: 0.6%
- Widowed: 6.5%
- Divorced: 10.2%
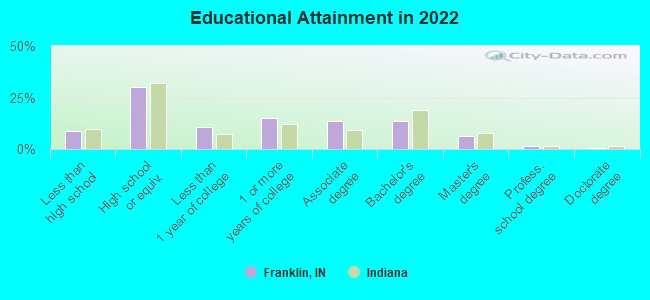
For population 25 years and over in Franklin:
- High school or higher: 92.9%
- Bachelor's degree or higher: 21.0%
- Graduate or professional degree: 7.2%
- Unemployed: 5.8%
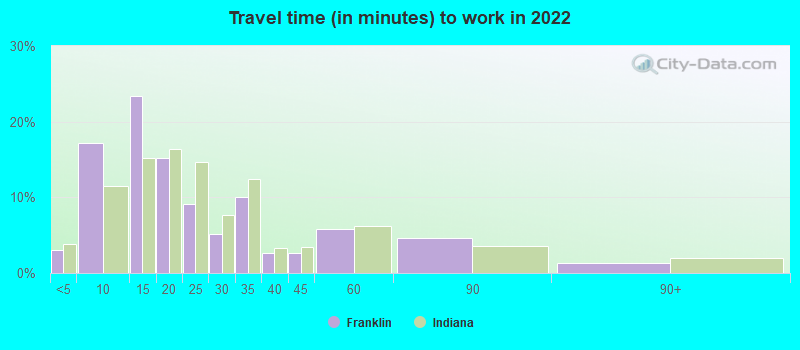
- Mean travel time to work (commute): 21.1 minutes
| Here: | 9.7 |
| Indiana average: | 11.3 |
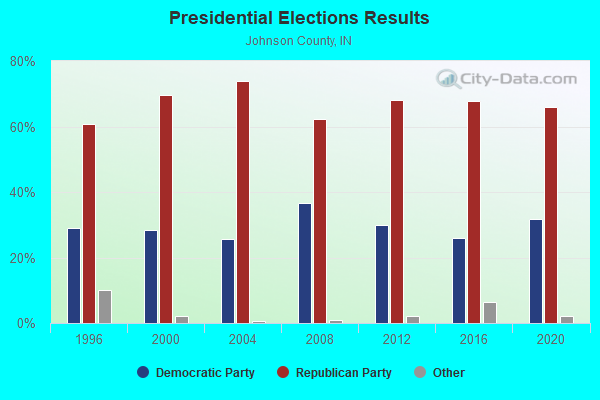
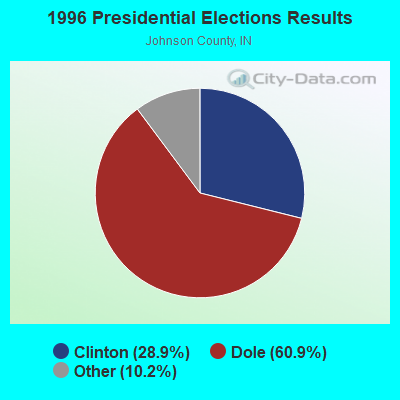


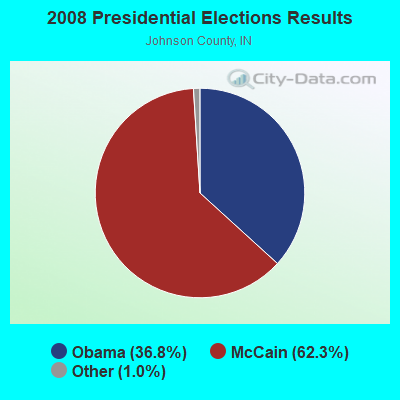
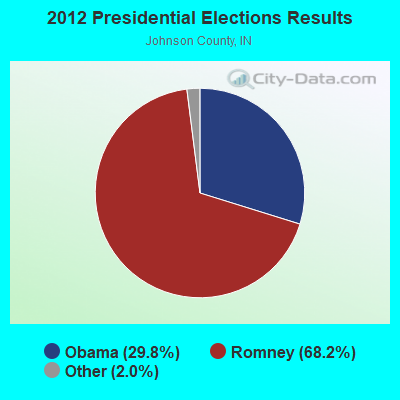
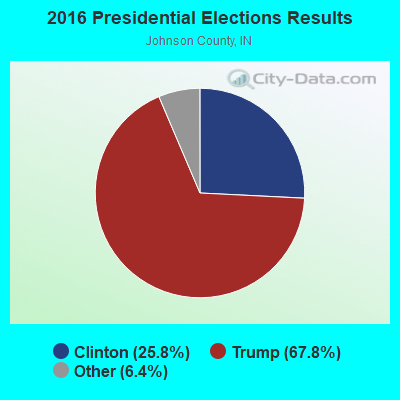
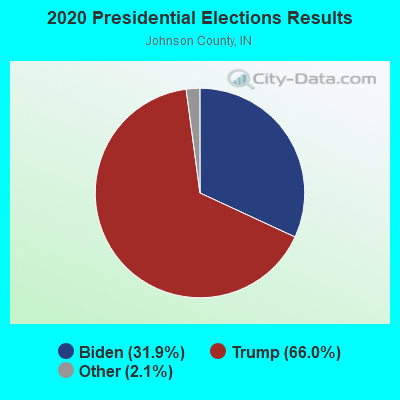
Graphs represent county-level data. Detailed 2008 Election Results
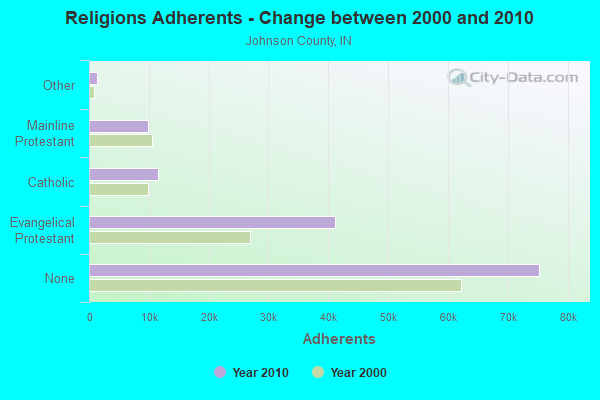
Religion statistics for Franklin, IN (based on Johnson County data)
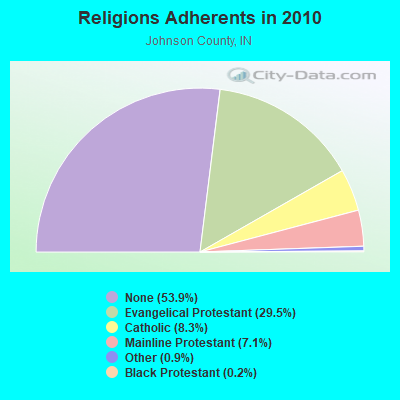
| Religion | Adherents | Congregations |
|---|---|---|
| Evangelical Protestant | 41,166 | 98 |
| Catholic | 11,589 | 4 |
| Mainline Protestant | 9,942 | 31 |
| Other | 1,325 | 3 |
| Black Protestant | 314 | 2 |
| Orthodox | 27 | 1 |
| None | 75,291 | - |
Food Environment Statistics:
| Johnson County: | 1.03 / 10,000 pop. |
| Indiana: | 1.73 / 10,000 pop. |
| Johnson County: | 0.29 / 10,000 pop. |
| Indiana: | 0.21 / 10,000 pop. |
| Johnson County: | 0.37 / 10,000 pop. |
| Indiana: | 0.50 / 10,000 pop. |
| Here: | 2.65 / 10,000 pop. |
| Indiana: | 3.57 / 10,000 pop. |
| Johnson County: | 6.54 / 10,000 pop. |
| State: | 6.78 / 10,000 pop. |
| This county: | 8.1% |
| Indiana: | 9.2% |
| This county: | 27.6% |
| Indiana: | 29.0% |
| Johnson County: | 12.6% |
| State: | 14.3% |
Health and Nutrition:
| Franklin: | 53.9% |
| State: | 49.3% |
| Franklin: | 54.2% |
| Indiana: | 46.2% |
| Franklin: | 27.9 |
| Indiana: | 28.7 |
| Franklin: | 20.3% |
| Indiana: | 21.3% |
| Here: | 8.6% |
| State: | 10.6% |
| Franklin: | 7.0 |
| Indiana: | 6.8 |
| Here: | 31.2% |
| State: | 33.9% |
| Franklin: | 61.5% |
| Indiana: | 56.1% |
| This city: | 80.8% |
| State: | 78.7% |
More about Health and Nutrition of Franklin, IN Residents
| Local government employment and payroll (March 2022) | |||||
| Function | Full-time employees | Monthly full-time payroll | Average yearly full-time wage | Part-time employees | Monthly part-time payroll |
|---|---|---|---|---|---|
| Police Protection - Officers | 53 | $280,634 | $63,540 | 0 | $0 |
| Firefighters | 48 | $252,716 | $63,179 | 0 | $0 |
| Streets and Highways | 18 | $71,743 | $47,829 | 0 | $0 |
| Parks and Recreation | 15 | $61,172 | $48,938 | 63 | $32,448 |
| Sewerage | 15 | $72,606 | $58,085 | 0 | $0 |
| Police - Other | 6 | $22,265 | $44,530 | 0 | $0 |
| Other Government Administration | 4 | $15,006 | $45,018 | 0 | $0 |
| Financial Administration | 4 | $23,952 | $71,856 | 0 | $0 |
| Other and Unallocable | 4 | $14,690 | $44,070 | 0 | $0 |
| Judicial and Legal | 3 | $12,037 | $48,148 | 0 | $0 |
| Fire - Other | 2 | $8,124 | $48,744 | 0 | $0 |
| Housing and Community Development (Local) | 2 | $11,813 | $70,878 | 0 | $0 |
| Totals for Government | 174 | $846,758 | $58,397 | 63 | $32,448 |
Franklin government finances - Expenditure in 2021 (per resident):
- Construction - Sewerage: $201,000 ($7.81)
Regular Highways: $10,000 ($0.39)
General - Other: $1,000 ($0.04)
- Current Operations - Regular Highways: $9,153,000 ($355.76)
Police Protection: $4,833,000 ($187.85)
General - Other: $4,675,000 ($181.71)
Local Fire Protection: $4,124,000 ($160.29)
Sewerage: $2,567,000 ($99.77)
Parks and Recreation: $2,345,000 ($91.15)
Central Staff Services: $692,000 ($26.90)
General Public Buildings: $492,000 ($19.12)
Judicial and Legal Services: $339,000 ($13.18)
Miscellaneous Commercial Activities - Other: $285,000 ($11.08)
Financial Administration: $243,000 ($9.44)
Health - Other: $93,000 ($3.61)
- General - Interest on Debt: $1,056,000 ($41.04)
- Other Capital Outlay - Regular Highways: $1,696,000 ($65.92)
Police Protection: $322,000 ($12.52)
General - Other: $213,000 ($8.28)
Local Fire Protection: $120,000 ($4.66)
Parks and Recreation: $18,000 ($0.70)
Franklin government finances - Revenue in 2021 (per resident):
- Charges - Sewerage: $12,542,000 ($487.48)
Parks and Recreation: $438,000 ($17.02)
Other: $242,000 ($9.41)
Miscellaneous Commercial Activities: $166,000 ($6.45)
Regular Highways: $12,000 ($0.47)
- Local Intergovernmental - Highways: $465,000 ($18.07)
Other: $60,000 ($2.33)
- Miscellaneous - General Revenue - Other: $476,000 ($18.50)
Interest Earnings: $365,000 ($14.19)
Donations From Private Sources: $363,000 ($14.11)
Fines and Forfeits: $57,000 ($2.22)
- State Intergovernmental - Other: $9,816,000 ($381.53)
Highways: $2,521,000 ($97.99)
General Local Government Support: $1,556,000 ($60.48)
- Tax - Property: $14,381,000 ($558.96)
Motor Vehicle License: $590,000 ($22.93)
Other License: $309,000 ($12.01)
Public Utilities Sales: $194,000 ($7.54)
Franklin government finances - Debt in 2021 (per resident):
- Long Term Debt - Beginning Outstanding - Unspecified Public Purpose: $26,407,000 ($1026.39)
Outstanding Unspecified Public Purpose: $26,407,000 ($1026.39)
Franklin government finances - Cash and Securities in 2021 (per resident):
- Bond Funds - Cash and Securities: $16,961,000 ($659.24)
- Other Funds - Cash and Securities: $31,561,000 ($1226.72)
- Sinking Funds - Cash and Securities: $1,750,000 ($68.02)
| Businesses in Franklin, IN | ||||
| Name | Count | Name | Count | |
|---|---|---|---|---|
| AT&T | 2 | Long John Silver's | 1 | |
| Advance Auto Parts | 1 | Lowe's | 1 | |
| Applebee's | 1 | MasterBrand Cabinets | 4 | |
| Arby's | 1 | McDonald's | 2 | |
| AutoZone | 1 | Nike | 2 | |
| Burger King | 2 | Papa John's Pizza | 1 | |
| CVS | 1 | Penske | 1 | |
| Chevrolet | 1 | Pizza Hut | 1 | |
| Circle K | 3 | Quality | 1 | |
| Comfort Inn | 1 | Quiznos | 1 | |
| Dairy Queen | 1 | RadioShack | 1 | |
| Decora Cabinetry | 2 | Sears | 1 | |
| Domino's Pizza | 1 | Starbucks | 1 | |
| Fashion Bug | 1 | Steak 'n Shake | 1 | |
| FedEx | 3 | Subway | 3 | |
| Ford | 1 | Super 8 | 1 | |
| GNC | 1 | T-Mobile | 2 | |
| GameStop | 1 | Taco Bell | 1 | |
| H&R Block | 1 | U-Haul | 2 | |
| Howard Johnson | 1 | UPS | 2 | |
| Jones New York | 1 | Waffle House | 1 | |
| KFC | 1 | Walgreens | 1 | |
| Kohl's | 1 | Walmart | 1 | |
| Kroger | 1 | Wendy's | 1 | |
| Little Caesars Pizza | 1 | White Castle | 1 | |
Strongest AM radio stations in Franklin:
- WIBC (1070 AM; 50 kW; INDIANAPOLIS, IN; Owner: EMMIS RADIO LICENSE CORPORATION)
- WTLC (1310 AM; 5 kW; INDIANAPOLIS, IN; Owner: RADIO ONE OF INDIANA, LLC)
- WNTS (1590 AM; 5 kW; BEECH GROVE, IN; Owner: S + M BROADCASTING CO., INC.)
- WLW (700 AM; 50 kW; CINCINNATI, OH; Owner: JACOR BROADCASTING CORPORATION)
- WXLW (950 AM; 5 kW; INDIANAPOLIS, IN)
- WHAS (840 AM; 50 kW; LOUISVILLE, KY; Owner: CLEAR CHANNEL BROADCASTING LICENSES, INC.)
- WNDE (1260 AM; 5 kW; INDIANAPOLIS, IN; Owner: CAPSTAR TX LIMITED PARTNERSHIP)
- WXNT (1430 AM; 5 kW; INDIANAPOLIS, IN; Owner: MYSTAR COMMUNICATIONS CORPORATION)
- WBRI (1500 AM; daytime; 5 kW; INDIANAPOLIS, IN)
- WSAI (1530 AM; 50 kW; CINCINNATI, OH; Owner: JACOR BROADCASTING CORPORATION)
- WOWO (1190 AM; 50 kW; FORT WAYNE, IN; Owner: PATHFINDER COMMUNICATIONS CORPORATION)
- WGCL (1370 AM; 5 kW; BLOOMINGTON, IN; Owner: SARKES TARZIAN, INC,)
- WTVN (610 AM; 50 kW; COLUMBUS, OH; Owner: CITICASTERS LICENSES, L.P.)
Strongest FM radio stations in Franklin:
- WIJY (95.9 FM; FRANKLIN, IN; Owner: PILGRIM COMMUNICATIONS, LLC)
- WTTS (92.3 FM; BLOOMINGTON, IN; Owner: SARKES TARZIAN, INC.)
- WENS (97.1 FM; SHELBYVILLE, IN; Owner: EMMIS RADIO LICENSE CORPORATION)
- WZPL (99.5 FM; GREENFIELD, IN; Owner: MYSTAR COMMUNICATIONS CORPORATION)
- WNOU (93.1 FM; INDIANAPOLIS, IN; Owner: EMMIS RADIO LICENSE CORPORATION)
- WFMS (95.5 FM; INDIANAPOLIS, IN; Owner: WFMS LICO, INC)
- WYXB (105.7 FM; INDIANAPOLIS, IN; Owner: EMMIS RADIO LICENSE CORPORATION)
- WFCI (89.5 FM; FRANKLIN, IN; Owner: FRANKLIN COLLEGE OF INDIANA)
- WHHH (96.3 FM; INDIANAPOLIS, IN; Owner: RADIO ONE OF INDIANA, LLC)
- WJLR (91.5 FM; SEYMOUR, IN; Owner: MIDWEST MINISTRIES, INC.)
- WFBQ (94.7 FM; INDIANAPOLIS, IN; Owner: CAPSTAR TX LIMITED PARTNERSHIP)
- WRZX (103.3 FM; INDIANAPOLIS, IN; Owner: CAPSTAR TX LIMITED PARTNERSHIP)
- WCBK-FM (102.3 FM; MARTINSVILLE, IN; Owner: MID-AMERICA RADIO GROUP, INC.)
- WGLD (104.5 FM; INDIANAPOLIS, IN; Owner: INDY LICO, INC)
- WTPI (107.9 FM; INDIANAPOLIS, IN; Owner: MYSTAR COMMUNICATIONS CORPORATION)
- WKKG (101.5 FM; COLUMBUS, IN; Owner: WHITE RIVER BROADCASTING CO. INC.)
- WYGB (102.9 FM; EDINBURGH, IN; Owner: EDINBURGH RADIO)
- WTLC-FM (106.7 FM; GREENWOOD, IN; Owner: RADIO ONE OF INDIANA, LLC)
- WVNI (95.1 FM; NASHVILLE, IN; Owner: BROWN COUNTY BROADCASTERS, INC.)
- WFYI-FM (90.1 FM; INDIANAPOLIS, IN; Owner: METROPOLITAN IN. PUBLIC B/CING, INC.)
TV broadcast stations around Franklin:
- WTTV (Channel 4; BLOOMINGTON, IN; Owner: TRIBUNE BROADCAST HOLDINGS, INC.)
- WIPX (Channel 63; BLOOMINGTON, IN; Owner: PAXSON INDIANAPOLIS LICENSE, INC.)
- WCLJ (Channel 42; BLOOMINGTON, IN; Owner: TRINITY BROADCASTING OF INDIANA, INC.)
- WKOG-LP (Channel 31; INDIANAPOLIS, IN; Owner: KINGDOM OF GOD MINISTRIES, INC.)
- WDNI-LP (Channel 65; INDIANAPOLIS, IN; Owner: RADIO ONE OF INDIANA, LLC)
- WIPX-LP (Channel 51; INDIANAPOLIS, IN; Owner: PAXSON COMMUNICATIONS LICENSE COMPANY, LLC)
- WTIU (Channel 30; BLOOMINGTON, IN; Owner: THE TRUSTEES OF INDIANA UNIVERSITY)
- WXIN (Channel 59; INDIANAPOLIS, IN; Owner: TRIBUNE TELEVISION COMPANY)
- WISH-TV (Channel 8; INDIANAPOLIS, IN; Owner: INDIANA BROADCASTING, LLC)
- WHMB-TV (Channel 40; INDIANAPOLIS, IN; Owner: LESEA BROADCASTING CORPORATION)
- WRTV (Channel 6; INDIANAPOLIS, IN; Owner: MCGRAW-HILL BROADCASTING COMPANY, INC.)
- WTHR (Channel 13; INDIANAPOLIS, IN; Owner: VIDEOINDIANA, INC.)
- WBXI-CA (Channel 47; INDIANAPOLIS, IN; Owner: THE BOX WORLDWIDE LLC)
- WFYI (Channel 20; INDIANAPOLIS, IN; Owner: METROPOLITAN INDIANAPOLIS PUBLIC BROADCASTING, INC.)
- WTBU-TV (Channel 69; INDIANAPOLIS, IN; Owner: BUTLER UNIVERSITY)
- WALV-CA (Channel 50; INDIANAPOLIS, IN; Owner: VIDEOHIO, INC..)
- WIIH-CA (Channel 11; INDIANAPOLIS, IN; Owner: INDIANA BROADCASTING, LLC)
Medal of Honor Recipients
Medal of Honor Recipient born in Franklin: Clinton L. Armstrong.
- National Bridge Inventory (NBI) Statistics
- 74Number of bridges
- 636ft / 194mTotal length
- $7,719,000Total costs
- 568,527Total average daily traffic
- 68,820Total average daily truck traffic

- New bridges - historical statistics
- 11910-1919
- 11930-1939
- 31940-1949
- 31950-1959
- 41960-1969
- 331970-1979
- 71980-1989
- 81990-1999
- 112000-2009
- 32010-2019
FCC Registered Antenna Towers: 163 (See the full list of FCC Registered Antenna Towers)
FCC Registered Commercial Land Mobile Towers: 2 (See the full list of FCC Registered Commercial Land Mobile Towers in Franklin, IN)
FCC Registered Private Land Mobile Towers: 3 (See the full list of FCC Registered Private Land Mobile Towers)
FCC Registered Broadcast Land Mobile Towers: 38 (See the full list of FCC Registered Broadcast Land Mobile Towers)
FCC Registered Microwave Towers: 75 (See the full list of FCC Registered Microwave Towers in this town)
FCC Registered Paging Towers: 6 (See the full list of FCC Registered Paging Towers)
FCC Registered Amateur Radio Licenses: 174 (See the full list of FCC Registered Amateur Radio Licenses in Franklin)
FAA Registered Aircraft Manufacturers and Dealers: 2 (See the full list of FAA Registered Manufacturers and Dealers in Franklin)
FAA Registered Aircraft: 31 (See the full list of FAA Registered Aircraft)
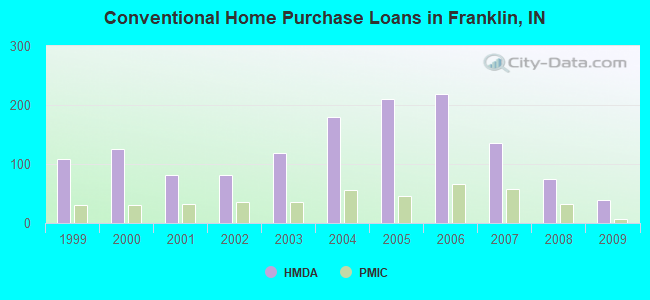
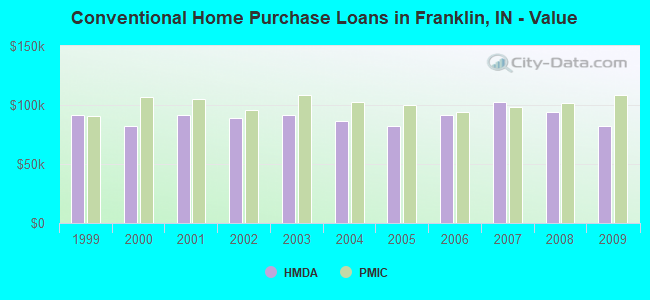
| Home Mortgage Disclosure Act Aggregated Statistics For Year 2009 (Based on 2 full and 1 partial tracts) | ||||||||||||||
| A) FHA, FSA/RHS & VA Home Purchase Loans | B) Conventional Home Purchase Loans | C) Refinancings | D) Home Improvement Loans | E) Loans on Dwellings For 5+ Families | F) Non-occupant Loans on < 5 Family Dwellings (A B C & D) | G) Loans On Manufactured Home Dwelling (A B C & D) | ||||||||
|---|---|---|---|---|---|---|---|---|---|---|---|---|---|---|
| Number | Average Value | Number | Average Value | Number | Average Value | Number | Average Value | Number | Average Value | Number | Average Value | Number | Average Value | |
| LOANS ORIGINATED | 56 | $102,502 | 39 | $82,489 | 141 | $106,958 | 8 | $38,264 | 1 | $165,000 | 23 | $67,052 | 0 | $0 |
| APPLICATIONS APPROVED, NOT ACCEPTED | 2 | $139,705 | 4 | $90,322 | 25 | $109,800 | 1 | $6,670 | 0 | $0 | 2 | $75,405 | 0 | $0 |
| APPLICATIONS DENIED | 9 | $108,054 | 11 | $80,468 | 66 | $99,224 | 11 | $17,041 | 0 | $0 | 7 | $68,643 | 2 | $72,000 |
| APPLICATIONS WITHDRAWN | 7 | $95,197 | 6 | $52,783 | 42 | $100,655 | 1 | $11,000 | 0 | $0 | 3 | $40,707 | 0 | $0 |
| FILES CLOSED FOR INCOMPLETENESS | 4 | $111,085 | 1 | $207,830 | 6 | $135,642 | 0 | $0 | 0 | $0 | 0 | $0 | 0 | $0 |
Detailed HMDA statistics for the following Tracts: 6109.00 , 6110.00, 6111.00
| Private Mortgage Insurance Companies Aggregated Statistics For Year 2009 (Based on 2 full and 1 partial tracts) | ||||
| A) Conventional Home Purchase Loans | B) Refinancings | |||
|---|---|---|---|---|
| Number | Average Value | Number | Average Value | |
| LOANS ORIGINATED | 7 | $108,801 | 6 | $116,308 |
| APPLICATIONS APPROVED, NOT ACCEPTED | 3 | $120,337 | 3 | $75,990 |
| APPLICATIONS DENIED | 1 | $160,470 | 1 | $99,000 |
| APPLICATIONS WITHDRAWN | 0 | $0 | 0 | $0 |
| FILES CLOSED FOR INCOMPLETENESS | 0 | $0 | 0 | $0 |
Detailed PMIC statistics for the following Tracts: 6109.00 , 6110.00, 6111.00
2003 - 2017 National Fire Incident Reporting System (NFIRS) incidents
- Fire incident types reported to NFIRS in Franklin, IN
- 51338.9%Outside Fires
- 35627.0%Structure Fires
- 22717.2%Other
- 22216.8%Mobile Property/Vehicle Fires
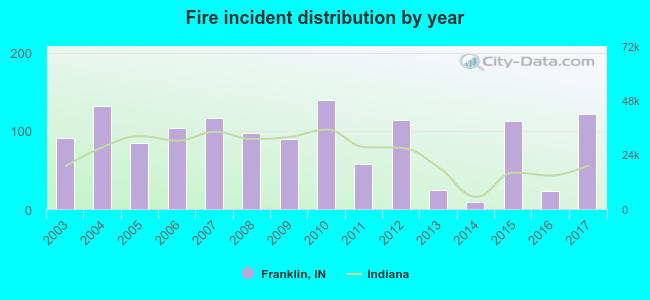 According to the data from the years 2003 - 2017 the average number of fires per year is 88. The highest number of fires - 139 took place in 2010, and the least - 9 in 2014. The data has an increasing trend.
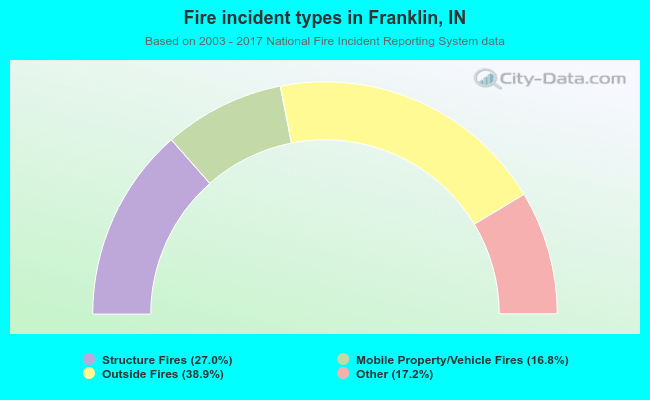 When looking into fire subcategories, the most incidents belonged to: Outside Fires (38.9%), and Structure Fires (27.0%).
Fire-safe hotels and motels in Franklin, Indiana:
- Hilltop Motel, RR #5, Franklin, Indiana 46131 , Phone: (812) 526-6555
- Econo Lodge, 2180 E King St, Franklin, Indiana 46131 , Phone: (317) 736-8000, Fax: (317) 736-9678
- Comfort Inn, 2122 Holiday Ln, Franklin, Indiana 46131 , Phone: (317) 736-0480, Fax: (317) 736-4580
- Quality Inn & Suites, 150 N Lovers Ln, Franklin, Indiana 46131 , Phone: (317) 346-6444, Fax: (317) 346-6445
- Howard Johnson Inn, 176 N Lovers Ln, Franklin, Indiana 46131 , Phone: (317) 738-4448, Fax: (317) 738-4448
- Super 8 Motel, 188 N Lovers Ln, Franklin, Indiana 46131 , Phone: (317) 738-0888, Fax: (317) 738-0888
| Most common first names in Franklin, IN among deceased individuals | ||
| Name | Count | Lived (average) |
|---|---|---|
| Mary | 315 | 82.8 years |
| William | 195 | 76.7 years |
| James | 191 | 75.1 years |
| John | 161 | 77.4 years |
| Robert | 159 | 73.2 years |
| Charles | 155 | 77.1 years |
| Ruth | 130 | 84.9 years |
| Dorothy | 104 | 83.1 years |
| Helen | 101 | 82.8 years |
| George | 90 | 79.6 years |
| Most common last names in Franklin, IN among deceased individuals | ||
| Last name | Count | Lived (average) |
|---|---|---|
| Smith | 148 | 79.9 years |
| Brown | 87 | 76.7 years |
| Jones | 58 | 80.7 years |
| Williams | 57 | 78.8 years |
| Johnson | 54 | 80.3 years |
| Wilson | 50 | 82.3 years |
| Miller | 50 | 81.8 years |
| Davis | 48 | 78.3 years |
| Clark | 46 | 79.2 years |
| Moore | 43 | 77.3 years |
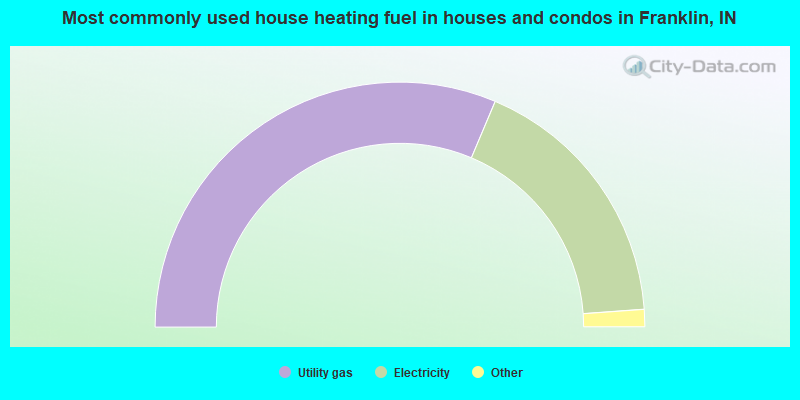
- 62.8%Utility gas
- 35.0%Electricity
- 1.5%Bottled, tank, or LP gas
- 0.4%Wood
- 0.2%Fuel oil, kerosene, etc.
- 0.2%Other fuel
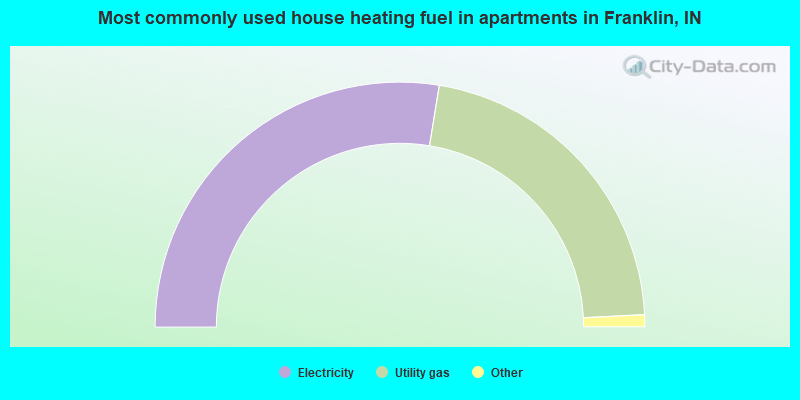
- 55.2%Electricity
- 43.3%Utility gas
- 1.3%No fuel used
- 0.3%Bottled, tank, or LP gas
Franklin compared to Indiana state average:
- Unemployed percentage below state average.
- Hispanic race population percentage below state average.
- Median age below state average.
- House age below state average.
Franklin on our top lists:
- #49 on the list of "Top 101 cities with the largest percentage of people in other noninstitutional group quarters (population 1,000+)"
- #4 on the list of "Top 101 counties with the lowest percentage of residents relocating from foreign countries between 2010 and 2011"
- #64 on the list of "Top 101 counties with the highest Ozone (1-hour) air pollution readings in 2012 (ppm)"

|
|
Total of 188 patent applications in 2008-2024.