Glenview, Illinois Submit your own pictures of this village and show them to the world
OSM Map
General Map
Google Map
MSN Map
OSM Map
General Map
Google Map
MSN Map
OSM Map
General Map
Google Map
MSN Map
OSM Map
General Map
Google Map
MSN Map
Please wait while loading the map...
Population in 2022: 47,258 (100% urban, 0% rural). Population change since 2000: +12.9%Males: 22,321 Females: 24,937
March 2022 cost of living index in Glenview: 104.8 (near average, U.S. average is 100) Percentage of residents living in poverty in 2022: 5.0%for White Non-Hispanic residents , 30.5% for Black residents , 10.1% for Hispanic or Latino residents , 5.0% for American Indian residents , 6.6% for other race residents , 1.3% for two or more races residents )
Profiles of local businesses
Business Search - 14 Million verified businesses
Data:
Median household income ($)
Median household income (% change since 2000)
Household income diversity
Ratio of average income to average house value (%)
Ratio of average income to average rent
Median household income ($) - White
Median household income ($) - Black or African American
Median household income ($) - Asian
Median household income ($) - Hispanic or Latino
Median household income ($) - American Indian and Alaska Native
Median household income ($) - Multirace
Median household income ($) - Other Race
Median household income for houses/condos with a mortgage ($)
Median household income for apartments without a mortgage ($)
Races - White alone (%)
Races - White alone (% change since 2000)
Races - Black alone (%)
Races - Black alone (% change since 2000)
Races - American Indian alone (%)
Races - American Indian alone (% change since 2000)
Races - Asian alone (%)
Races - Asian alone (% change since 2000)
Races - Hispanic (%)
Races - Hispanic (% change since 2000)
Races - Native Hawaiian and Other Pacific Islander alone (%)
Races - Native Hawaiian and Other Pacific Islander alone (% change since 2000)
Races - Two or more races (%)
Races - Two or more races (% change since 2000)
Races - Other race alone (%)
Races - Other race alone (% change since 2000)
Racial diversity
Unemployment (%)
Unemployment (% change since 2000)
Unemployment (%) - White
Unemployment (%) - Black or African American
Unemployment (%) - Asian
Unemployment (%) - Hispanic or Latino
Unemployment (%) - American Indian and Alaska Native
Unemployment (%) - Multirace
Unemployment (%) - Other Race
Population density (people per square mile)
Population - Males (%)
Population - Females (%)
Population - Males (%) - White
Population - Males (%) - Black or African American
Population - Males (%) - Asian
Population - Males (%) - Hispanic or Latino
Population - Males (%) - American Indian and Alaska Native
Population - Males (%) - Multirace
Population - Males (%) - Other Race
Population - Females (%) - White
Population - Females (%) - Black or African American
Population - Females (%) - Asian
Population - Females (%) - Hispanic or Latino
Population - Females (%) - American Indian and Alaska Native
Population - Females (%) - Multirace
Population - Females (%) - Other Race
Coronavirus confirmed cases (Apr 27, 2024)
Deaths caused by coronavirus (Apr 27, 2024)
Coronavirus confirmed cases (per 100k population) (Apr 27, 2024)
Deaths caused by coronavirus (per 100k population) (Apr 27, 2024)
Daily increase in number of cases (Apr 27, 2024)
Weekly increase in number of cases (Apr 27, 2024)
Cases doubled (in days) (Apr 27, 2024)
Hospitalized patients (Apr 18, 2022)
Negative test results (Apr 18, 2022)
Total test results (Apr 18, 2022)
COVID Vaccine doses distributed (per 100k population) (Sep 19, 2023)
COVID Vaccine doses administered (per 100k population) (Sep 19, 2023)
COVID Vaccine doses distributed (Sep 19, 2023)
COVID Vaccine doses administered (Sep 19, 2023)
Likely homosexual households (%)
Likely homosexual households (% change since 2000)
Likely homosexual households - Lesbian couples (%)
Likely homosexual households - Lesbian couples (% change since 2000)
Likely homosexual households - Gay men (%)
Likely homosexual households - Gay men (% change since 2000)
Cost of living index
Median gross rent ($)
Median contract rent ($)
Median monthly housing costs ($)
Median house or condo value ($)
Median house or condo value ($ change since 2000)
Mean house or condo value by units in structure - 1, detached ($)
Mean house or condo value by units in structure - 1, attached ($)
Mean house or condo value by units in structure - 2 ($)
Mean house or condo value by units in structure by units in structure - 3 or 4 ($)
Mean house or condo value by units in structure - 5 or more ($)
Mean house or condo value by units in structure - Boat, RV, van, etc. ($)
Mean house or condo value by units in structure - Mobile home ($)
Median house or condo value ($) - White
Median house or condo value ($) - Black or African American
Median house or condo value ($) - Asian
Median house or condo value ($) - Hispanic or Latino
Median house or condo value ($) - American Indian and Alaska Native
Median house or condo value ($) - Multirace
Median house or condo value ($) - Other Race
Median resident age
Resident age diversity
Median resident age - Males
Median resident age - Females
Median resident age - White
Median resident age - Black or African American
Median resident age - Asian
Median resident age - Hispanic or Latino
Median resident age - American Indian and Alaska Native
Median resident age - Multirace
Median resident age - Other Race
Median resident age - Males - White
Median resident age - Males - Black or African American
Median resident age - Males - Asian
Median resident age - Males - Hispanic or Latino
Median resident age - Males - American Indian and Alaska Native
Median resident age - Males - Multirace
Median resident age - Males - Other Race
Median resident age - Females - White
Median resident age - Females - Black or African American
Median resident age - Females - Asian
Median resident age - Females - Hispanic or Latino
Median resident age - Females - American Indian and Alaska Native
Median resident age - Females - Multirace
Median resident age - Females - Other Race
Commute - mean travel time to work (minutes)
Travel time to work - Less than 5 minutes (%)
Travel time to work - Less than 5 minutes (% change since 2000)
Travel time to work - 5 to 9 minutes (%)
Travel time to work - 5 to 9 minutes (% change since 2000)
Travel time to work - 10 to 19 minutes (%)
Travel time to work - 10 to 19 minutes (% change since 2000)
Travel time to work - 20 to 29 minutes (%)
Travel time to work - 20 to 29 minutes (% change since 2000)
Travel time to work - 30 to 39 minutes (%)
Travel time to work - 30 to 39 minutes (% change since 2000)
Travel time to work - 40 to 59 minutes (%)
Travel time to work - 40 to 59 minutes (% change since 2000)
Travel time to work - 60 to 89 minutes (%)
Travel time to work - 60 to 89 minutes (% change since 2000)
Travel time to work - 90 or more minutes (%)
Travel time to work - 90 or more minutes (% change since 2000)
Marital status - Never married (%)
Marital status - Now married (%)
Marital status - Separated (%)
Marital status - Widowed (%)
Marital status - Divorced (%)
Median family income ($)
Median family income (% change since 2000)
Median non-family income ($)
Median non-family income (% change since 2000)
Median per capita income ($)
Median per capita income (% change since 2000)
Median family income ($) - White
Median family income ($) - Black or African American
Median family income ($) - Asian
Median family income ($) - Hispanic or Latino
Median family income ($) - American Indian and Alaska Native
Median family income ($) - Multirace
Median family income ($) - Other Race
Median year house/condo built
Median year apartment built
Year house built - Built 2005 or later (%)
Year house built - Built 2000 to 2004 (%)
Year house built - Built 1990 to 1999 (%)
Year house built - Built 1980 to 1989 (%)
Year house built - Built 1970 to 1979 (%)
Year house built - Built 1960 to 1969 (%)
Year house built - Built 1950 to 1959 (%)
Year house built - Built 1940 to 1949 (%)
Year house built - Built 1939 or earlier (%)
Average household size
Household density (households per square mile)
Average household size - White
Average household size - Black or African American
Average household size - Asian
Average household size - Hispanic or Latino
Average household size - American Indian and Alaska Native
Average household size - Multirace
Average household size - Other Race
Occupied housing units (%)
Vacant housing units (%)
Owner occupied housing units (%)
Renter occupied housing units (%)
Vacancy status - For rent (%)
Vacancy status - For sale only (%)
Vacancy status - Rented or sold, not occupied (%)
Vacancy status - For seasonal, recreational, or occasional use (%)
Vacancy status - For migrant workers (%)
Vacancy status - Other vacant (%)
Residents with income below the poverty level (%)
Residents with income below 50% of the poverty level (%)
Children below poverty level (%)
Poor families by family type - Married-couple family (%)
Poor families by family type - Male, no wife present (%)
Poor families by family type - Female, no husband present (%)
Poverty status for native-born residents (%)
Poverty status for foreign-born residents (%)
Poverty among high school graduates not in families (%)
Poverty among people who did not graduate high school not in families (%)
Residents with income below the poverty level (%) - White
Residents with income below the poverty level (%) - Black or African American
Residents with income below the poverty level (%) - Asian
Residents with income below the poverty level (%) - Hispanic or Latino
Residents with income below the poverty level (%) - American Indian and Alaska Native
Residents with income below the poverty level (%) - Multirace
Residents with income below the poverty level (%) - Other Race
Air pollution - Air Quality Index (AQI)
Air pollution - CO
Air pollution - NO2
Air pollution - SO2
Air pollution - Ozone
Air pollution - PM10
Air pollution - PM25
Air pollution - Pb
Crime - Murders per 100,000 population
Crime - Rapes per 100,000 population
Crime - Robberies per 100,000 population
Crime - Assaults per 100,000 population
Crime - Burglaries per 100,000 population
Crime - Thefts per 100,000 population
Crime - Auto thefts per 100,000 population
Crime - Arson per 100,000 population
Crime - City-data.com crime index
Crime - Violent crime index
Crime - Property crime index
Crime - Murders per 100,000 population (5 year average)
Crime - Rapes per 100,000 population (5 year average)
Crime - Robberies per 100,000 population (5 year average)
Crime - Assaults per 100,000 population (5 year average)
Crime - Burglaries per 100,000 population (5 year average)
Crime - Thefts per 100,000 population (5 year average)
Crime - Auto thefts per 100,000 population (5 year average)
Crime - Arson per 100,000 population (5 year average)
Crime - City-data.com crime index (5 year average)
Crime - Violent crime index (5 year average)
Crime - Property crime index (5 year average)
1996 Presidential Elections Results (%) - Democratic Party (Clinton)
1996 Presidential Elections Results (%) - Republican Party (Dole)
1996 Presidential Elections Results (%) - Other
2000 Presidential Elections Results (%) - Democratic Party (Gore)
2000 Presidential Elections Results (%) - Republican Party (Bush)
2000 Presidential Elections Results (%) - Other
2004 Presidential Elections Results (%) - Democratic Party (Kerry)
2004 Presidential Elections Results (%) - Republican Party (Bush)
2004 Presidential Elections Results (%) - Other
2008 Presidential Elections Results (%) - Democratic Party (Obama)
2008 Presidential Elections Results (%) - Republican Party (McCain)
2008 Presidential Elections Results (%) - Other
2012 Presidential Elections Results (%) - Democratic Party (Obama)
2012 Presidential Elections Results (%) - Republican Party (Romney)
2012 Presidential Elections Results (%) - Other
2016 Presidential Elections Results (%) - Democratic Party (Clinton)
2016 Presidential Elections Results (%) - Republican Party (Trump)
2016 Presidential Elections Results (%) - Other
2020 Presidential Elections Results (%) - Democratic Party (Biden)
2020 Presidential Elections Results (%) - Republican Party (Trump)
2020 Presidential Elections Results (%) - Other
Ancestries Reported - Arab (%)
Ancestries Reported - Czech (%)
Ancestries Reported - Danish (%)
Ancestries Reported - Dutch (%)
Ancestries Reported - English (%)
Ancestries Reported - French (%)
Ancestries Reported - French Canadian (%)
Ancestries Reported - German (%)
Ancestries Reported - Greek (%)
Ancestries Reported - Hungarian (%)
Ancestries Reported - Irish (%)
Ancestries Reported - Italian (%)
Ancestries Reported - Lithuanian (%)
Ancestries Reported - Norwegian (%)
Ancestries Reported - Polish (%)
Ancestries Reported - Portuguese (%)
Ancestries Reported - Russian (%)
Ancestries Reported - Scotch-Irish (%)
Ancestries Reported - Scottish (%)
Ancestries Reported - Slovak (%)
Ancestries Reported - Subsaharan African (%)
Ancestries Reported - Swedish (%)
Ancestries Reported - Swiss (%)
Ancestries Reported - Ukrainian (%)
Ancestries Reported - United States (%)
Ancestries Reported - Welsh (%)
Ancestries Reported - West Indian (%)
Ancestries Reported - Other (%)
Educational Attainment - No schooling completed (%)
Educational Attainment - Less than high school (%)
Educational Attainment - High school or equivalent (%)
Educational Attainment - Less than 1 year of college (%)
Educational Attainment - 1 or more years of college (%)
Educational Attainment - Associate degree (%)
Educational Attainment - Bachelor's degree (%)
Educational Attainment - Master's degree (%)
Educational Attainment - Professional school degree (%)
Educational Attainment - Doctorate degree (%)
School Enrollment - Nursery, preschool (%)
School Enrollment - Kindergarten (%)
School Enrollment - Grade 1 to 4 (%)
School Enrollment - Grade 5 to 8 (%)
School Enrollment - Grade 9 to 12 (%)
School Enrollment - College undergrad (%)
School Enrollment - Graduate or professional (%)
School Enrollment - Not enrolled in school (%)
School enrollment - Public schools (%)
School enrollment - Private schools (%)
School enrollment - Not enrolled (%)
Median number of rooms in houses and condos
Median number of rooms in apartments
Housing units lacking complete plumbing facilities (%)
Housing units lacking complete kitchen facilities (%)
Density of houses
Urban houses (%)
Rural houses (%)
Households with people 60 years and over (%)
Households with people 65 years and over (%)
Households with people 75 years and over (%)
Households with one or more nonrelatives (%)
Households with no nonrelatives (%)
Population in households (%)
Family households (%)
Nonfamily households (%)
Population in families (%)
Family households with own children (%)
Median number of bedrooms in owner occupied houses
Mean number of bedrooms in owner occupied houses
Median number of bedrooms in renter occupied houses
Mean number of bedrooms in renter occupied houses
Median number of vehichles in owner occupied houses
Mean number of vehichles in owner occupied houses
Median number of vehichles in renter occupied houses
Mean number of vehichles in renter occupied houses
Mortgage status - with mortgage (%)
Mortgage status - with second mortgage (%)
Mortgage status - with home equity loan (%)
Mortgage status - with both second mortgage and home equity loan (%)
Mortgage status - without a mortgage (%)
Average family size
Average family size - White
Average family size - Black or African American
Average family size - Asian
Average family size - Hispanic or Latino
Average family size - American Indian and Alaska Native
Average family size - Multirace
Average family size - Other Race
Geographical mobility - Same house 1 year ago (%)
Geographical mobility - Moved within same county (%)
Geographical mobility - Moved from different county within same state (%)
Geographical mobility - Moved from different state (%)
Geographical mobility - Moved from abroad (%)
Place of birth - Born in state of residence (%)
Place of birth - Born in other state (%)
Place of birth - Native, outside of US (%)
Place of birth - Foreign born (%)
Housing units in structures - 1, detached (%)
Housing units in structures - 1, attached (%)
Housing units in structures - 2 (%)
Housing units in structures - 3 or 4 (%)
Housing units in structures - 5 to 9 (%)
Housing units in structures - 10 to 19 (%)
Housing units in structures - 20 to 49 (%)
Housing units in structures - 50 or more (%)
Housing units in structures - Mobile home (%)
Housing units in structures - Boat, RV, van, etc. (%)
House/condo owner moved in on average (years ago)
Renter moved in on average (years ago)
Year householder moved into unit - Moved in 1999 to March 2000 (%)
Year householder moved into unit - Moved in 1995 to 1998 (%)
Year householder moved into unit - Moved in 1990 to 1994 (%)
Year householder moved into unit - Moved in 1980 to 1989 (%)
Year householder moved into unit - Moved in 1970 to 1979 (%)
Year householder moved into unit - Moved in 1969 or earlier (%)
Means of transportation to work - Drove car alone (%)
Means of transportation to work - Carpooled (%)
Means of transportation to work - Public transportation (%)
Means of transportation to work - Bus or trolley bus (%)
Means of transportation to work - Streetcar or trolley car (%)
Means of transportation to work - Subway or elevated (%)
Means of transportation to work - Railroad (%)
Means of transportation to work - Ferryboat (%)
Means of transportation to work - Taxicab (%)
Means of transportation to work - Motorcycle (%)
Means of transportation to work - Bicycle (%)
Means of transportation to work - Walked (%)
Means of transportation to work - Other means (%)
Working at home (%)
Industry diversity
Most Common Industries - Agriculture, forestry, fishing and hunting, and mining (%)
Most Common Industries - Agriculture, forestry, fishing and hunting (%)
Most Common Industries - Mining, quarrying, and oil and gas extraction (%)
Most Common Industries - Construction (%)
Most Common Industries - Manufacturing (%)
Most Common Industries - Wholesale trade (%)
Most Common Industries - Retail trade (%)
Most Common Industries - Transportation and warehousing, and utilities (%)
Most Common Industries - Transportation and warehousing (%)
Most Common Industries - Utilities (%)
Most Common Industries - Information (%)
Most Common Industries - Finance and insurance, and real estate and rental and leasing (%)
Most Common Industries - Finance and insurance (%)
Most Common Industries - Real estate and rental and leasing (%)
Most Common Industries - Professional, scientific, and management, and administrative and waste management services (%)
Most Common Industries - Professional, scientific, and technical services (%)
Most Common Industries - Management of companies and enterprises (%)
Most Common Industries - Administrative and support and waste management services (%)
Most Common Industries - Educational services, and health care and social assistance (%)
Most Common Industries - Educational services (%)
Most Common Industries - Health care and social assistance (%)
Most Common Industries - Arts, entertainment, and recreation, and accommodation and food services (%)
Most Common Industries - Arts, entertainment, and recreation (%)
Most Common Industries - Accommodation and food services (%)
Most Common Industries - Other services, except public administration (%)
Most Common Industries - Public administration (%)
Occupation diversity
Most Common Occupations - Management, business, science, and arts occupations (%)
Most Common Occupations - Management, business, and financial occupations (%)
Most Common Occupations - Management occupations (%)
Most Common Occupations - Business and financial operations occupations (%)
Most Common Occupations - Computer, engineering, and science occupations (%)
Most Common Occupations - Computer and mathematical occupations (%)
Most Common Occupations - Architecture and engineering occupations (%)
Most Common Occupations - Life, physical, and social science occupations (%)
Most Common Occupations - Education, legal, community service, arts, and media occupations (%)
Most Common Occupations - Community and social service occupations (%)
Most Common Occupations - Legal occupations (%)
Most Common Occupations - Education, training, and library occupations (%)
Most Common Occupations - Arts, design, entertainment, sports, and media occupations (%)
Most Common Occupations - Healthcare practitioners and technical occupations (%)
Most Common Occupations - Health diagnosing and treating practitioners and other technical occupations (%)
Most Common Occupations - Health technologists and technicians (%)
Most Common Occupations - Service occupations (%)
Most Common Occupations - Healthcare support occupations (%)
Most Common Occupations - Protective service occupations (%)
Most Common Occupations - Fire fighting and prevention, and other protective service workers including supervisors (%)
Most Common Occupations - Law enforcement workers including supervisors (%)
Most Common Occupations - Food preparation and serving related occupations (%)
Most Common Occupations - Building and grounds cleaning and maintenance occupations (%)
Most Common Occupations - Personal care and service occupations (%)
Most Common Occupations - Sales and office occupations (%)
Most Common Occupations - Sales and related occupations (%)
Most Common Occupations - Office and administrative support occupations (%)
Most Common Occupations - Natural resources, construction, and maintenance occupations (%)
Most Common Occupations - Farming, fishing, and forestry occupations (%)
Most Common Occupations - Construction and extraction occupations (%)
Most Common Occupations - Installation, maintenance, and repair occupations (%)
Most Common Occupations - Production, transportation, and material moving occupations (%)
Most Common Occupations - Production occupations (%)
Most Common Occupations - Transportation occupations (%)
Most Common Occupations - Material moving occupations (%)
People in Group quarters - Institutionalized population (%)
People in Group quarters - Correctional institutions (%)
People in Group quarters - Federal prisons and detention centers (%)
People in Group quarters - Halfway houses (%)
People in Group quarters - Local jails and other confinement facilities (including police lockups) (%)
People in Group quarters - Military disciplinary barracks (%)
People in Group quarters - State prisons (%)
People in Group quarters - Other types of correctional institutions (%)
People in Group quarters - Nursing homes (%)
People in Group quarters - Hospitals/wards, hospices, and schools for the handicapped (%)
People in Group quarters - Hospitals/wards and hospices for chronically ill (%)
People in Group quarters - Hospices or homes for chronically ill (%)
People in Group quarters - Military hospitals or wards for chronically ill (%)
People in Group quarters - Other hospitals or wards for chronically ill (%)
People in Group quarters - Hospitals or wards for drug/alcohol abuse (%)
People in Group quarters - Mental (Psychiatric) hospitals or wards (%)
People in Group quarters - Schools, hospitals, or wards for the mentally retarded (%)
People in Group quarters - Schools, hospitals, or wards for the physically handicapped (%)
People in Group quarters - Institutions for the deaf (%)
People in Group quarters - Institutions for the blind (%)
People in Group quarters - Orthopedic wards and institutions for the physically handicapped (%)
People in Group quarters - Wards in general hospitals for patients who have no usual home elsewhere (%)
People in Group quarters - Wards in military hospitals for patients who have no usual home elsewhere (%)
People in Group quarters - Juvenile institutions (%)
People in Group quarters - Long-term care (%)
People in Group quarters - Homes for abused, dependent, and neglected children (%)
People in Group quarters - Residential treatment centers for emotionally disturbed children (%)
People in Group quarters - Training schools for juvenile delinquents (%)
People in Group quarters - Short-term care, detention or diagnostic centers for delinquent children (%)
People in Group quarters - Type of juvenile institution unknown (%)
People in Group quarters - Noninstitutionalized population (%)
People in Group quarters - College dormitories (includes college quarters off campus) (%)
People in Group quarters - Military quarters (%)
People in Group quarters - On base (%)
People in Group quarters - Barracks, unaccompanied personnel housing (UPH), (Enlisted/Officer), ;and similar group living quarters for military personnel (%)
People in Group quarters - Transient quarters for temporary residents (%)
People in Group quarters - Military ships (%)
People in Group quarters - Group homes (%)
People in Group quarters - Homes or halfway houses for drug/alcohol abuse (%)
People in Group quarters - Homes for the mentally ill (%)
People in Group quarters - Homes for the mentally retarded (%)
People in Group quarters - Homes for the physically handicapped (%)
People in Group quarters - Other group homes (%)
People in Group quarters - Religious group quarters (%)
People in Group quarters - Dormitories (%)
People in Group quarters - Agriculture workers' dormitories on farms (%)
People in Group quarters - Job Corps and vocational training facilities (%)
People in Group quarters - Other workers' dormitories (%)
People in Group quarters - Crews of maritime vessels (%)
People in Group quarters - Other nonhousehold living situations (%)
People in Group quarters - Other noninstitutional group quarters (%)
Residents speaking English at home (%)
Residents speaking English at home - Born in the United States (%)
Residents speaking English at home - Native, born elsewhere (%)
Residents speaking English at home - Foreign born (%)
Residents speaking Spanish at home (%)
Residents speaking Spanish at home - Born in the United States (%)
Residents speaking Spanish at home - Native, born elsewhere (%)
Residents speaking Spanish at home - Foreign born (%)
Residents speaking other language at home (%)
Residents speaking other language at home - Born in the United States (%)
Residents speaking other language at home - Native, born elsewhere (%)
Residents speaking other language at home - Foreign born (%)
Class of Workers - Employee of private company (%)
Class of Workers - Self-employed in own incorporated business (%)
Class of Workers - Private not-for-profit wage and salary workers (%)
Class of Workers - Local government workers (%)
Class of Workers - State government workers (%)
Class of Workers - Federal government workers (%)
Class of Workers - Self-employed workers in own not incorporated business and Unpaid family workers (%)
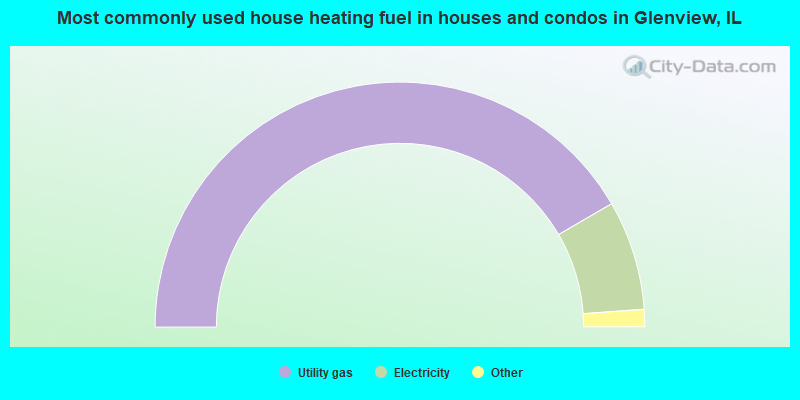
House heating fuel used in houses and condos - Utility gas (%)
House heating fuel used in houses and condos - Bottled, tank, or LP gas (%)
House heating fuel used in houses and condos - Electricity (%)
House heating fuel used in houses and condos - Fuel oil, kerosene, etc. (%)
House heating fuel used in houses and condos - Coal or coke (%)
House heating fuel used in houses and condos - Wood (%)
House heating fuel used in houses and condos - Solar energy (%)
House heating fuel used in houses and condos - Other fuel (%)
House heating fuel used in houses and condos - No fuel used (%)
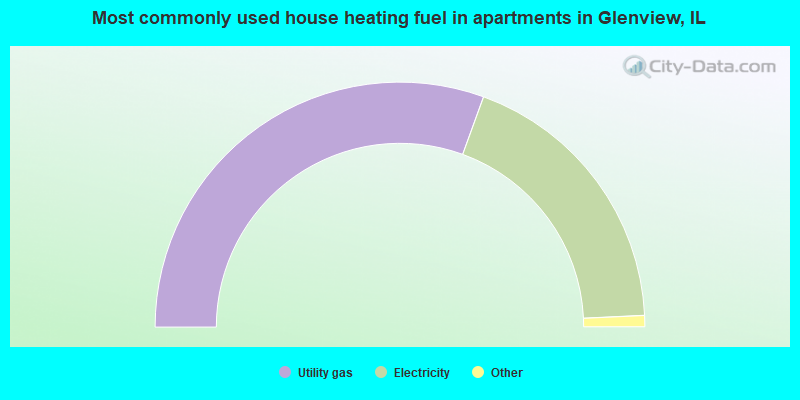
House heating fuel used in apartments - Utility gas (%)
House heating fuel used in apartments - Bottled, tank, or LP gas (%)
House heating fuel used in apartments - Electricity (%)
House heating fuel used in apartments - Fuel oil, kerosene, etc. (%)
House heating fuel used in apartments - Coal or coke (%)
House heating fuel used in apartments - Wood (%)
House heating fuel used in apartments - Solar energy (%)
House heating fuel used in apartments - Other fuel (%)
House heating fuel used in apartments - No fuel used (%)
Armed forces status - In Armed Forces (%)
Armed forces status - Civilian (%)
Armed forces status - Civilian - Veteran (%)
Armed forces status - Civilian - Nonveteran (%)
Fatal accidents locations in years 2005-2021
Fatal accidents locations in 2005
Fatal accidents locations in 2006
Fatal accidents locations in 2007
Fatal accidents locations in 2008
Fatal accidents locations in 2009
Fatal accidents locations in 2010
Fatal accidents locations in 2011
Fatal accidents locations in 2012
Fatal accidents locations in 2013
Fatal accidents locations in 2014
Fatal accidents locations in 2015
Fatal accidents locations in 2016
Fatal accidents locations in 2017
Fatal accidents locations in 2018
Fatal accidents locations in 2019
Fatal accidents locations in 2020
Fatal accidents locations in 2021
Alcohol use - People drinking some alcohol every month (%)
Alcohol use - People not drinking at all (%)
Alcohol use - Average days/month drinking alcohol
Alcohol use - Average drinks/week
Alcohol use - Average days/year people drink much
Audiometry - Average condition of hearing (%)
Audiometry - People that can hear a whisper from across a quiet room (%)
Audiometry - People that can hear normal voice from across a quiet room (%)
Audiometry - Ears ringing, roaring, buzzing (%)
Audiometry - Had a job exposure to loud noise (%)
Audiometry - Had off-work exposure to loud noise (%)
Blood Pressure & Cholesterol - Has high blood pressure (%)
Blood Pressure & Cholesterol - Checking blood pressure at home (%)
Blood Pressure & Cholesterol - Frequently checking blood cholesterol (%)
Blood Pressure & Cholesterol - Has high cholesterol level (%)
Consumer Behavior - Money monthly spent on food at supermarket/grocery store
Consumer Behavior - Money monthly spent on food at other stores
Consumer Behavior - Money monthly spent on eating out
Consumer Behavior - Money monthly spent on carryout/delivered foods
Consumer Behavior - Income spent on food at supermarket/grocery store (%)
Consumer Behavior - Income spent on food at other stores (%)
Consumer Behavior - Income spent on eating out (%)
Consumer Behavior - Income spent on carryout/delivered foods (%)
Current Health Status - General health condition (%)
Current Health Status - Blood donors (%)
Current Health Status - Has blood ever tested for HIV virus (%)
Current Health Status - Left-handed people (%)
Dermatology - People using sunscreen (%)
Diabetes - Diabetics (%)
Diabetes - Had a blood test for high blood sugar (%)
Diabetes - People taking insulin (%)
Diet Behavior & Nutrition - Diet health (%)
Diet Behavior & Nutrition - Milk product consumption (# of products/month)
Diet Behavior & Nutrition - Meals not home prepared (#/week)
Diet Behavior & Nutrition - Meals from fast food or pizza place (#/week)
Diet Behavior & Nutrition - Ready-to-eat foods (#/month)
Diet Behavior & Nutrition - Frozen meals/pizza (#/month)
Drug Use - People that ever used marijuana or hashish (%)
Drug Use - Ever used hard drugs (%)
Drug Use - Ever used any form of cocaine (%)
Drug Use - Ever used heroin (%)
Drug Use - Ever used methamphetamine (%)
Health Insurance - People covered by health insurance (%)
Kidney Conditions-Urology - Avg. # of times urinating at night
Medical Conditions - People with asthma (%)
Medical Conditions - People with anemia (%)
Medical Conditions - People with psoriasis (%)
Medical Conditions - People with overweight (%)
Medical Conditions - Elderly people having difficulties in thinking or remembering (%)
Medical Conditions - People who ever received blood transfusion (%)
Medical Conditions - People having trouble seeing even with glass/contacts (%)
Medical Conditions - People with arthritis (%)
Medical Conditions - People with gout (%)
Medical Conditions - People with congestive heart failure (%)
Medical Conditions - People with coronary heart disease (%)
Medical Conditions - People with angina pectoris (%)
Medical Conditions - People who ever had heart attack (%)
Medical Conditions - People who ever had stroke (%)
Medical Conditions - People with emphysema (%)
Medical Conditions - People with thyroid problem (%)
Medical Conditions - People with chronic bronchitis (%)
Medical Conditions - People with any liver condition (%)
Medical Conditions - People who ever had cancer or malignancy (%)
Mental Health - People who have little interest in doing things (%)
Mental Health - People feeling down, depressed, or hopeless (%)
Mental Health - People who have trouble sleeping or sleeping too much (%)
Mental Health - People feeling tired or having little energy (%)
Mental Health - People with poor appetite or overeating (%)
Mental Health - People feeling bad about themself (%)
Mental Health - People who have trouble concentrating on things (%)
Mental Health - People moving or speaking slowly or too fast (%)
Mental Health - People having thoughts they would be better off dead (%)
Oral Health - Average years since last visit a dentist
Oral Health - People embarrassed because of mouth (%)
Oral Health - People with gum disease (%)
Oral Health - General health of teeth and gums (%)
Oral Health - Average days a week using dental floss/device
Oral Health - Average days a week using mouthwash for dental problem
Oral Health - Average number of teeth
Pesticide Use - Households using pesticides to control insects (%)
Pesticide Use - Households using pesticides to kill weeds (%)
Physical Activity - People doing vigorous-intensity work activities (%)
Physical Activity - People doing moderate-intensity work activities (%)
Physical Activity - People walking or bicycling (%)
Physical Activity - People doing vigorous-intensity recreational activities (%)
Physical Activity - People doing moderate-intensity recreational activities (%)
Physical Activity - Average hours a day doing sedentary activities
Physical Activity - Average hours a day watching TV or videos
Physical Activity - Average hours a day using computer
Physical Functioning - People having limitations keeping them from working (%)
Physical Functioning - People limited in amount of work they can do (%)
Physical Functioning - People that need special equipment to walk (%)
Physical Functioning - People experiencing confusion/memory problems (%)
Physical Functioning - People requiring special healthcare equipment (%)
Prescription Medications - Average number of prescription medicines taking
Preventive Aspirin Use - Adults 40+ taking low-dose aspirin (%)
Reproductive Health - Vaginal deliveries (%)
Reproductive Health - Cesarean deliveries (%)
Reproductive Health - Deliveries resulted in a live birth (%)
Reproductive Health - Pregnancies resulted in a delivery (%)
Reproductive Health - Women breastfeeding newborns (%)
Reproductive Health - Women that had a hysterectomy (%)
Reproductive Health - Women that had both ovaries removed (%)
Reproductive Health - Women that have ever taken birth control pills (%)
Reproductive Health - Women taking birth control pills (%)
Reproductive Health - Women that have ever used Depo-Provera or injectables (%)
Reproductive Health - Women that have ever used female hormones (%)
Sexual Behavior - People 18+ that ever had sex (vaginal, anal, or oral) (%)
Sexual Behavior - Males 18+ that ever had vaginal sex with a woman (%)
Sexual Behavior - Males 18+ that ever performed oral sex on a woman (%)
Sexual Behavior - Males 18+ that ever had anal sex with a woman (%)
Sexual Behavior - Males 18+ that ever had any sex with a man (%)
Sexual Behavior - Females 18+ that ever had vaginal sex with a man (%)
Sexual Behavior - Females 18+ that ever performed oral sex on a man (%)
Sexual Behavior - Females 18+ that ever had anal sex with a man (%)
Sexual Behavior - Females 18+ that ever had any kind of sex with a woman (%)
Sexual Behavior - Average age people first had sex
Sexual Behavior - Average number of female sex partners in lifetime (males 18+)
Sexual Behavior - Average number of female vaginal sex partners in lifetime (males 18+)
Sexual Behavior - Average age people first performed oral sex on a woman (18+)
Sexual Behavior - Average number of woman performed oral sex on in lifetime (18+)
Sexual Behavior - Average number of male sex partners in lifetime (males 18+)
Sexual Behavior - Average number of male anal sex partners in lifetime (males 18+)
Sexual Behavior - Average age people first performed oral sex on a man (18+)
Sexual Behavior - Average number of male oral sex partners in lifetime (18+)
Sexual Behavior - People using protection when performing oral sex (%)
Sexual Behavior - Average number of times people have vaginal or anal sex a year
Sexual Behavior - People having sex without condom (%)
Sexual Behavior - Average number of male sex partners in lifetime (females 18+)
Sexual Behavior - Average number of male vaginal sex partners in lifetime (females 18+)
Sexual Behavior - Average number of female sex partners in lifetime (females 18+)
Sexual Behavior - Circumcised males 18+ (%)
Sleep Disorders - Average hours sleeping at night
Sleep Disorders - People that has trouble sleeping (%)
Smoking-Cigarette Use - People smoking cigarettes (%)
Taste & Smell - People 40+ having problems with smell (%)
Taste & Smell - People 40+ having problems with taste (%)
Taste & Smell - People 40+ that ever had wisdom teeth removed (%)
Taste & Smell - People 40+ that ever had tonsils teeth removed (%)
Taste & Smell - People 40+ that ever had a loss of consciousness because of a head injury (%)
Taste & Smell - People 40+ that ever had a broken nose or other serious injury to face or skull (%)
Taste & Smell - People 40+ that ever had two or more sinus infections (%)
Weight - Average height (inches)
Weight - Average weight (pounds)
Weight - Average BMI
Weight - People that are obese (%)
Weight - People that ever were obese (%)
Weight - People trying to lose weight (%)
According to our research of Illinois and other state lists, there were 9 registered sex offenders living in Glenview, Illinois as of April 27, 2024 . The ratio of all residents to sex offenders in Glenview is 5,149 to 1.The ratio of registered sex offenders to all residents in this city is much lower than the state average.
Officers per 1,000 residents here:
1.41Illinois average:
3.06
Latest news from Glenview, IL collected exclusively by city-data.com from local newspapers, TV, and radio stations
Ancestries: Polish (9.5%), Irish (7.5%), German (7.3%), Greek (4.7%), Russian (4.5%), European (4.2%).
Current Local Time:
Incorporated on 11/02/1901
Land area: 13.5 square miles.
Population density: 3,514 people per square mile (average).
10,245 residents are foreign born (10.7% Asia , 7.4% Europe , 2.7% Latin America ).
This village:
21.9%Illinois:
14.1%
Median real estate property taxes paid for housing units with mortgages in 2022: $9,512 (1.6%)Median real estate property taxes paid for housing units with no mortgage in 2022: $9,819 (1.6%)
Nearest city with pop. 50,000+: Skokie, IL
Nearest city with pop. 200,000+: Chicago, IL
Nearest cities:
Latitude: 42.08 N, Longitude: 87.82 W
Daytime population change due to commuting: +10,824 (+23.1%)Workers who live and work in this village: 7,427 (32.7%)
Glenview tourist attractions:
Single-family new house construction building permits:
2022: 38 buildings , average cost: $619,8002021: 62 buildings , average cost: $584,7002020: 46 buildings , average cost: $566,7002019: 21 buildings , average cost: $485,1002018: 41 buildings , average cost: $391,4002017: 35 buildings , average cost: $475,4002016: 116 buildings , average cost: $419,3002015: 157 buildings , average cost: $330,2002014: 85 buildings , average cost: $427,1002013: 124 buildings , average cost: $240,6002012: 138 buildings , average cost: $125,5002011: 21 buildings , average cost: $576,9002010: 14 buildings , average cost: $629,6002009: 19 buildings , average cost: $278,7002008: 108 buildings , average cost: $380,9002007: 82 buildings , average cost: $497,6002006: 178 buildings , average cost: $385,7002005: 198 buildings , average cost: $371,8002004: 264 buildings , average cost: $337,1002003: 218 buildings , average cost: $330,1002002: 287 buildings , average cost: $254,7002001: 360 buildings , average cost: $211,7002000: 190 buildings , average cost: $202,3001999: 151 buildings , average cost: $186,8001998: 259 buildings , average cost: $200,3001997: 194 buildings , average cost: $148,900Unemployment in December 2023:
Population change in the 1990s: +2,605 (+6.6%).
Most common occupations in Glenview, IL (%)
Both Males Females
Other management occupations, except farmers and farm managers (6.0%)
Sales representatives, services, wholesale and manufacturing (6.0%)
Other sales and related occupations, including supervisors (5.0%)
Top executives (4.5%)
Accountants and auditors (3.8%)
Retail sales workers, except cashiers (3.5%)
Other office and administrative support workers, including supervisors (3.4%)
Sales representatives, services, wholesale and manufacturing (8.5%)
Other management occupations, except farmers and farm managers (7.5%)
Top executives (7.2%)
Other sales and related occupations, including supervisors (5.4%)
Lawyers (4.7%)
Accountants and auditors (4.0%)
Retail sales workers, except cashiers (3.5%)
Secretaries and administrative assistants (5.9%)
Preschool, kindergarten, elementary, and middle school teachers (5.6%)
Other office and administrative support workers, including supervisors (5.3%)
Registered nurses (5.0%)
Other sales and related occupations, including supervisors (4.7%)
Other management occupations, except farmers and farm managers (4.3%)
Accountants and auditors (3.6%)
Tornado activity:
Glenview-area historical tornado activity is slightly below Illinois state average. It is 36% greater than the overall U.S. average.
On 9/28/1972, a category F4 (max. wind speeds 207-260 mph) tornado 14.2 miles away from the Glenview village center injured 20 people and caused between $500,000 and $5,000,000 in damages.
On 4/21/1967, a category F4 tornado 17.5 miles away from the village center killed one person and injured 100 people and caused between $500,000 and $5,000,000 in damages.
Earthquake activity:
Glenview-area historical earthquake activity is significantly above Illinois state average. It is 33% greater than the overall U.S. average. On 4/18/2008 at 09:36:59, a magnitude 5.4 (5.1 MB, 4.8 MS, 5.4 MW, 5.2 MW, Class: Moderate, Intensity: VI - VII) earthquake occurred 250.9 miles away from Glenview center On 6/10/1987 at 23:48:54, a magnitude 5.1 (4.9 MB, 4.4 MS, 4.6 MS, 5.1 LG) earthquake occurred 225.4 miles away from Glenview center On 4/18/2008 at 09:36:59, a magnitude 5.2 (5.2 MW, Depth: 8.9 mi) earthquake occurred 251.0 miles away from Glenview center On 6/28/2004 at 06:10:52, a magnitude 4.2 (4.2 MW, Depth: 6.2 mi, Class: Light, Intensity: IV - V) earthquake occurred 70.5 miles away from the city center On 2/10/2010 at 09:59:35, a magnitude 3.8 (3.8 MW, Depth: 6.2 mi, Class: Light, Intensity: II - III) earthquake occurred 35.9 miles away from Glenview center On 5/2/2015 at 16:23:07, a magnitude 4.2 (4.2 MW, Depth: 2.8 mi) earthquake occurred 122.9 miles away from Glenview center Magnitude types: regional Lg-wave magnitude (LG), body-wave magnitude (MB), surface-wave magnitude (MS), moment magnitude (MW) Natural disasters: The number of natural disasters in Cook County (20) is greater than the US average (15).Major Disasters (Presidential) Declared: 15Emergencies Declared: 4Floods: 13, Storms: 12, Tornadoes: 3, Snowstorms: 2, Winter Storms: 2, Blizzard: 1, Hurricane: 1, Snow: 1, Wind: 1, Other: 1 (Note: some incidents may be assigned to more than one category). Main business address for: ILLINOIS TOOL WORKS INC GENERAL INDUSTRIAL MACHINERY & EQUIPMENT ), ANIXTER INTERNATIONAL INC WHOLESALE-ELECTRICAL APPARATUS & EQUIPMENT, WIRING SUPPLIES ).
Hospitals in Glenview: MIDWEST PALLIATIVE AND HOSPICE CARECENTER (2050 CLAIRE COURT) Nursing Homes in Glenview: ABINGTON OF GLENVIEW (3901 GLENVIEW ROAD) GLENVIEW TERRACE NURSING CTR (1511 GREENWOOD ROAD) MARYHAVEN INC (1700 E LAKE AVE) MARYHAVEN NSG AND REHABILITATION (1700 EAST LAKE AVENUE) VI AT THE GLEN (2401 INDIGO LANE) Dialysis Facilities in Glenview: FMC - GLENVIEW DIALYSIS CENTER (4248 COMMERCIAL WAY) Home Health Centers in Glenview: METROPOLITAN HOME HEALTH CARE, INC (662 WAUKEGAN ROAD) PATHWAYS HOME HEALTH SERVICE, LLC (3633 W LAKE AVE, STE LL3) PATIENT PLUS HOMEHEALTH CARE, INC (950 MILWAUKEE AVENUE, STE 330) PRESTIGE PLUS HOME CARE, INC (950 N MILWAUKEE AVENUE, STE 236) TLC HEALTHCARE SERVICES OF IL, INC (950 MILWAUKEE AVENUE, SUITE 215) Heliports located in Glenview: Amtrak station: GLENVIEW (1116 DEPOT ST.)
.
Services: ticket office, fully wheelchair accessible, enclosed waiting area, public restrooms, public payphones, free short-term parking, free long-term parking, call for car rental service, taxi stand, public transit connection.
Colleges/universities with over 2000 students nearest to Glenview:
Oakton Community College (about 4 miles; Des Plaines, IL ; Full-time enrollment: 7,271)
Computer Systems Institute (about 5 miles; Skokie, IL ; FT enrollment: 2,311)
Northwestern University (about 8 miles; Evanston, IL ; FT enrollment: 17,473)
BIR Training Center (about 8 miles; Chicago, IL ; FT enrollment: 2,036)
Northeastern Illinois University (about 9 miles; Chicago, IL ; FT enrollment: 8,004)
City Colleges of Chicago-Wilbur Wright College (about 9 miles; Chicago, IL ; FT enrollment: 8,683)
North Park University (about 10 miles; Chicago, IL ; FT enrollment: 2,622)
Public high schools in Glenview:
Biggest public elementary/middle schools in Glenview: ATTEA MIDDLE SCHOOL Students: 717, Location: 2500 CHESTNUT AVE, Grades: 6-8)SPRINGMAN MIDDLE SCHOOL Students: 687, Location: 2701 CENTRAL RD, Grades: 6-8)HENRY WINKELMAN ELEM SCHOOL Students: 581, Location: 1919 LANDWEHR RD, Grades: KG-5)WESTBROOK ELEMENTARY SCHOOL Students: 567, Location: 1333 GREENWOOD RD, Grades: PK-2)HENKING ELEM SCHOOL Students: 538, Location: 2941 LINNEMAN ST, Grades: PK-2)HOFFMAN ELEM SCHOOL Students: 480, Location: 2000 HARRISON ST, Grades: 3-5)LYON ELEM SCHOOL Students: 454, Location: 1335 WAUKEGAN RD, Grades: PK-2)GLEN GROVE ELEM SCHOOL Students: 448, Location: 3900 GLENVIEW RD, Grades: 3-5)PLEASANT RIDGE ELEM SCHOOL Students: 437, Location: 1730 SUNSET RIDGE RD, Grades: PK-5)AVOCA WEST ELEM SCHOOL Students: 420, Location: 235 BEECH DR, Grades: KG-5)Private elementary/middle schools in Glenview: OUR LADY OF PERPETUAL HELP Students: 930, Location: 1123 CHURCH ST, Grades: PK-8)
MIDWESTERN ACADEMY-NEW CHURCH Students: 38, Location: 74 PARK DR, Grades: PK-8)
See full list of schools located in Glenview Library in Glenview: GLENVIEW PUBLIC LIBRARY Operating income: $6,259,063; Location: 1930 GLENVIEW ROAD; 273,851 books ; 3,138 e-books ; 21,274 audio materials ; 15,481 video materials ; 47 local licensed databases ; 16 state licensed databases ; 2 other licensed databases ; 774 print serial subscriptions ; 9 electronic serial subscriptions )
User-submitted facts and corrections:
we have this place called the glen where the old navy base is
Hospitals/medical centers near Glenview: GLENBROOK HOSPITAL (In Glenview)
The Church of Jesus Christ of Latter-Day-Saints Chicago Illinois Temple is located in Glenview, Illinois
Notable locations in Glenview: (A) , North Shore Country Club (B) , Station Golf Links of Glenview (C) , Glenview Public Library (D) , Superior Air - Ground Ambulance Service (E) , Glenview Fire Department Station 7 (F) , Glenview Fire Department Station 13 (G) , Glenview Fire Department Headquarters (H) , Glenview Fire Department Station 14 (I) , Glenview Fire Department Station 8 (J) . Display/hide their locations on the map
Shopping Centers: (1) , Plaza Del Prado Shopping Center (2) . Display/hide their locations on the map
Main business address in Glenview include: (A) , ANIXTER INTERNATIONAL INC (B) . Display/hide their locations on the map
Churches in Glenview include: (A) , Convent of the Holy Spirit (B) , Villa Redeemer Monastery (C) , Our Lady of Perpetual Help Church (D) , Church of the Redeemer (E) , Glenview Community Church (F) , Glenview United Methodist Church (G) , Saints Peter And Paul Greek Church (H) , Saint David's Episcopal Church (I) . Display/hide their locations on the map
Cemeteries: (1) , Sunset Memorial Lawns (2) . Display/hide their locations on the map
Parks in Glenview include: (1) , Roosevelt Park (2) , Johns Park (3) , Jennings Park (4) , Jackman Park (5) , Willow Park (6) , Hawthorne Glen Park (7) , Kennicott's Grove Nature Preserve (8) , Sleepy Hollow Park (9) . Display/hide their locations on the map
Tourist attractions: (1) , Evergreen Martial Arts (Amusement & Theme Parks; 1938 Waukegan Road) (2) , Apollo Travel Inc (Tours & Charters; 1701 East Lake Avenue Suite 260) (3) . Display/hide their approximate locations on the map
Hotels: (1) , Fairfield Inn by Marriott (4514 West Lake Avenue) (2) , Glen Club (2901 West Lake Avenue) (3) , Baymont Inn & Suites - Glenview/Chicago (1625 Milwaukee Ave) (4) , Doubletree Guest Suites Chicago North-Gl (1400 Milwaukee Avenue) (5) , DOUBLETREE SUITES GLENVIEW (1400 Milwaukee Avenue) (6) . Display/hide their approximate locations on the map
Birthplace of: Joe Kennedy - College basketball player (Northwestern Wildcats).
Cook County has a predicted average indoor radon screening level between 2 and 4 pCi/L (pico curies per liter) - Moderate Potential Drinking water stations with addresses in Glenview and their reported violations in the past:
REGIS LANDING CONDOMINIUMS (Serves WI, Population served: 41, Groundwater):
Past health violations:
MCL, Monthly (TCR) - In JUL-2008, Contaminant: Coliform. Follow-up actions: St Public Notif requested (JUL-15-2008), St Violation/Reminder Notice (JUL-15-2008), St Boil Water Order (JUL-15-2008), St Compliance achieved (JUL-24-2008), St Public Notif issued (JUL-31-2008), St Public Notif received (AUG-06-2008)
MCL, Monthly (TCR) - In MAY-2008, Contaminant: Coliform. Follow-up actions: St Public Notif requested (MAY-29-2008), St Violation/Reminder Notice (MAY-29-2008), St Boil Water Order (MAY-29-2008), St Public Notif received (MAY-30-2008), St Public Notif issued (MAY-30-2008), St Compliance achieved (JUN-05-2008)
Average household size: This village:
2.6 peopleIllinois:
2.6 people
Percentage of family households: This village:
73.3%Whole state:
65.8%
Percentage of households with unmarried partners: This village:
2.3%Whole state:
6.3%
Likely homosexual households (counted as self-reported same-sex unmarried-partner households)
Lesbian couples: 0.2% of all households Gay men: 0.2% of all households
People in group quarters in Glenview in 2010:
606 people in nursing facilities/skilled-nursing facilities
16 people in group homes intended for adults
14 people in other noninstitutional facilities
6 people in residential treatment centers for adults
People in group quarters in Glenview in 2000:
310 people in nursing homes
88 people in religious group quarters
61 people in other nonhousehold living situations
56 people in other noninstitutional group quarters
11 people in homes for the mentally retarded
6 people in schools, hospitals, or wards for the intellectually disabled
Banks with most branches in Glenview (2011 data):
Glenview State Bank: 2222 Chestnut Avenue Branch, Golf Road Facility, Greenwood Facility, at 800 Waukegan Road. Info updated 2006/11/03: Bank assets: $1,170.7 mil, Deposits: $1,008.1 mil, local headquarters , positive income , 8 total offices , Holding Company: Cummins-American Corp.
JPMorgan Chase Bank, National Association: Pfingsten Branch, Glenview Dominicks, Glenview/River Drive Branch. Info updated 2011/11/10: Bank assets: $1,811,678.0 mil, Deposits: $1,190,738.0 mil, headquarters in Columbus, OH, positive income , International Specialization, 5577 total offices , Holding Company: Jpmorgan Chase & Co.
Bank of America, National Association: Glenview Branch at 2821 Pfingsten Road, branch established on 1995/08/15; Glenview-Lake And Waukegan at 1400 Waukegan Road, branch established on 2008/02/19. Info updated 2009/11/18: Bank assets: $1,451,969.3 mil, Deposits: $1,077,176.8 mil, headquarters in Charlotte, NC, positive income , 5782 total offices , Holding Company: Bank Of America Corporation
TCF National Bank: Glenview Jewel Branch #2279 at 2502 Waukegan Road, branch established on 1998/01/22; Pfingsten Road Jewel Branch #2313 at 2775 Pfingsten Road, branch established on 2000/02/17. Info updated 2009/11/23: Bank assets: $19,007.0 mil, Deposits: $12,377.0 mil, headquarters in Sioux Falls, SD, positive income , Commercial Lending Specialization, 441 total offices , Holding Company: Tcf Financial Corporation
MB Financial Bank, National Association: Glenview South Branch at 2200 N. Waukegan Road, branch established on 1953/02/09; Glenview North Branch at 2823 B Pfingsten Road, branch established on 2006/10/18. Info updated 2010/04/27: Bank assets: $9,792.4 mil, Deposits: $7,757.4 mil, headquarters in Chicago, IL, positive income , Commercial Lending Specialization, 93 total offices , Holding Company: Mb Financial, Inc
RBS Citizens, National Association: Glenview at 936 Harlem Avenue, branch established on 1987/06/30. Info updated 2007/09/19: Bank assets: $106,940.6 mil, Deposits: $75,690.2 mil, headquarters in Providence, RI, positive income , 1135 total offices , Holding Company: Uk Financial Investments Limited
Wells Fargo Bank, National Association: Glenview Branch at 1380 Patriot Boulevard, branch established on 2002/06/10. Info updated 2011/04/05: Bank assets: $1,161,490.0 mil, Deposits: $905,653.0 mil, headquarters in Sioux Falls, SD, positive income , 6395 total offices , Holding Company: Wells Fargo & Company
Fifth Third Bank: Glenview Banking Center Branch at 1529 N. Waukegan, branch established on 2005/05/23. Info updated 2009/10/05: Bank assets: $114,540.4 mil, Deposits: $89,689.1 mil, headquarters in Cincinnati, OH, positive income , Commercial Lending Specialization, 1378 total offices , Holding Company: Fifth Third Bancorp
Firstmerit Bank, National Association: Glenview Branch at 1441 Waukegan Road, branch established on 2004/07/14. Info updated 2010/05/17: Bank assets: $14,420.6 mil, Deposits: $11,497.6 mil, headquarters in Akron, OH, positive income , Commercial Lending Specialization, 213 total offices , Holding Company: Firstmerit Corporation
6 other banks with 6 local branches
For population 15 years and over in Glenview:
Never married: 22.9%Now married: 61.1%Separated: 0.9%Widowed: 7.6%Divorced: 7.4% For population 25 years and over in Glenview:
High school or higher: 96.4%Bachelor's degree or higher: 69.6%Graduate or professional degree: 34.5%Unemployed: 2.5%Mean travel time to work (commute): 22.3 minutes
Education Gini index (Inequality in education) Here:
9.7Illinois average:
12.5
Religion statistics for Glenview, IL (based on Cook County data)
Religion Adherents Congregations Catholic 1,947,223 376 Evangelical Protestant 432,975 1,484 Other 312,636 403 Mainline Protestant 202,114 630 Black Protestant 148,895 395 Orthodox 53,276 66 None 2,097,556 -
Source: Clifford Grammich, Kirk Hadaway, Richard Houseal, Dale E.Jones, Alexei Krindatch, Richie Stanley and Richard H.Taylor. 2012. 2010 U.S.Religion Census: Religious Congregations & Membership Study. Association of Statisticians of American Religious Bodies. Jones, Dale E., et al. 2002. Congregations and Membership in the United States 2000. Nashville, TN: Glenmary Research Center. Graphs represent county-level data
Food Environment Statistics: Number of grocery stores : 1,460Here :
2.77 / 10,000 pop.Illinois :
2.24 / 10,000 pop.
Number of supercenters and club stores : 23Cook County :
0.04 / 10,000 pop.Illinois :
0.08 / 10,000 pop.
Number of convenience stores (no gas) : 490This county :
0.93 / 10,000 pop.Illinois :
0.75 / 10,000 pop.
Number of convenience stores (with gas) : 806This county :
1.53 / 10,000 pop.State :
2.61 / 10,000 pop.
Number of full-service restaurants : 3,516Cook County :
6.67 / 10,000 pop.Illinois :
6.86 / 10,000 pop.
Adult diabetes rate : This county :
8.4%Illinois :
8.3%
Adult obesity rate : Cook County :
23.5%State :
25.2%
Low-income preschool obesity rate : Cook County :
16.3%Illinois :
14.5%
Health and Nutrition:
Average overall health of teeth and gums : Glenview:
52.1%Illinois:
47.2%
Average BMI : This city:
28.1Illinois:
28.6
People feeling badly about themselves : People not drinking alcohol at all : Glenview:
10.6%Illinois:
10.8%
Average hours sleeping at night : Overweight people : Glenview:
34.2%Illinois:
33.4%
General health condition : This city:
59.1%Illinois:
56.4%
Average condition of hearing : Glenview:
78.8%Illinois:
79.9%
More about Health and Nutrition of Glenview, IL Residents
Local government employment and payroll (March 2022)
Function
Full-time employees
Monthly full-time payroll
Average yearly full-time wage
Part-time employees
Monthly part-time payroll
Firefighters
74 $795,591 $129,015 0 $0 Police Protection - Officers
64 $651,649 $122,184 0 $0 Other and Unallocable
58 $474,918 $98,259 21 $48,524 Local Libraries
50 $275,865 $66,208 70 $96,282 Streets and Highways
15 $133,922 $107,138 0 $0 Sewerage
12 $109,716 $109,716 0 $0 Other Government Administration
8 $98,706 $148,059 7 $806 Water Supply
7 $64,524 $110,613 0 $0 Housing and Community Development (Local)
6 $27,990 $55,980 0 $0 Fire - Other
6 $78,448 $156,896 0 $0 Police - Other
5 $45,408 $108,979 0 $0 Financial Administration
3 $38,278 $153,112 0 $0 Health
2 $18,436 $110,616 0 $0 Natural Resources
1 $7,735 $92,820 0 $0 Welfare
1 $8,237 $98,844 0 $0
Totals for Government
312 $2,829,422 $108,824 98 $145,611
Glenview government finances - Expenditure in 2021 (per resident):
Current Operations - General - Other: $22,693,000 ($480.19)
Central Staff Services: $19,945,000 ($422.04)Local Fire Protection: $19,822,000 ($419.44)Police Protection: $14,680,000 ($310.64)Water Utilities: $13,791,000 ($291.82)Libraries: $7,734,000 ($163.65)Regular Highways: $7,553,000 ($159.82)Financial Administration: $1,494,000 ($31.61)Sewerage: $1,474,000 ($31.19)General - Interest on Debt: $1,820,000 ($38.51)
Other Capital Outlay - Solid Waste Management: $4,551,000 ($96.30)
Regular Highways: $2,333,000 ($49.37)Libraries: $2,010,000 ($42.53)Water Utilities: $1,819,000 ($38.49)Central Staff Services: $722,000 ($15.28)Sewerage: $442,000 ($9.35)Police Protection: $307,000 ($6.50)Parking Facilities: $185,000 ($3.91)Local Fire Protection: $167,000 ($3.53)Total Salaries and Wages: $41,662,000 ($881.59)
Glenview government finances - Revenue in 2021 (per resident):
Charges - Other: $16,948,000 ($358.63)
Sewerage: $2,477,000 ($52.41)Parking Facilities: $150,000 ($3.17)Parks and Recreation: $16,000 ($0.34)Solid Waste Management: $2,000 ($0.04)Miscellaneous - Interest Earnings: $1,177,000 ($24.91)
General Revenue - Other: $626,000 ($13.25)Fines and Forfeits: $141,000 ($2.98)Revenue - Water Utilities: $20,050,000 ($424.27)
State Intergovernmental - General Local Government Support: $23,635,000 ($500.13)
Other: $4,476,000 ($94.71)Highways: $3,483,000 ($73.70)Tax - Property: $61,044,000 ($1291.72)
Other Selective Sales: $9,189,000 ($194.44)Public Utilities Sales: $4,677,000 ($98.97)Other License: $2,115,000 ($44.75)
Glenview government finances - Debt in 2021 (per resident):
Long Term Debt - Beginning Outstanding - Unspecified Public Purpose: $33,183,000 ($702.17)
Outstanding Unspecified Public Purpose: $23,925,000 ($506.26)Retired Unspecified Public Purpose: $9,258,000 ($195.90)
Glenview government finances - Cash and Securities in 2021 (per resident):
Other Funds - Cash and Securities: $134,038,000 ($2836.30)
3.53% of this county's 2021 resident taxpayers lived in other counties in 2020 ($82,405 average adjusted gross income )
Here:
3.53%Illinois average:
5.09%
0.01% of residents moved from foreign countries ($114 average AGI )Cook County:
0.01%Illinois average:
0.01%
Top counties from which taxpayers relocated into this county between 2020 and 2021:
5.44% of this county's 2020 resident taxpayers moved to other counties in 2021 ($120,340 average adjusted gross income )
Here:
5.44%Illinois average:
6.10%
0.01% of residents moved to foreign countries ($140 average AGI )Cook County:
0.01%Illinois average:
0.01%
Top counties to which taxpayers relocated from this county between 2020 and 2021:
Businesses in Glenview, IL
Name Count Name Count
7-Eleven 2 Little Caesars Pizza 1 AT&T 1 Marriott 2 Ace Hardware 1 MasterBrand Cabinets 4 Audi 1 McDonald's 3 Baskin-Robbins 1 Motel 6 1 Ben & Jerry's 1 New Balance 1 Burger King 1 Nike 3 Burlington Coat Factory 1 OfficeMax 1 Caribou Coffee 1 Panda Express 1 Chipotle 1 Panera Bread 1 Costco 1 Payless 1 Curves 1 Pier 1 Imports 1 DHL 1 Quiznos 1 Decora Cabinetry 2 RadioShack 1 Dunkin Donuts 3 SAS Shoes 1 FedEx 8 Safeway 1 GNC 1 Sprint Nextel 1 GameStop 1 Staples 1 H&R Block 1 Starbucks 4 Holiday Inn 1 Steak 'n Shake 1 Home Depot 1 T-Mobile 2 Hyundai 1 T.G.I. Driday's 1 IHOP 1 Taco Bell 1 Jewel-Osco 2 Target 1 Jimmy John's 2 Trader Joe's 1 JoS. A. Bank 1 UPS 5 Jones New York 1 Volkswagen 1 Justice 1 Vons 1 Kohl's 1 Walgreens 2 La-Z-Boy 1 Wendy's 1
Strongest AM radio stations in Glenview:
WGN (720 AM; 50 kW; CHICAGO, IL; Owner: WGN CONTINENTAL BROADCASTING CO.)
WBBM (780 AM; 50 kW; CHICAGO, IL; Owner: INFINITY BROADCASTING OPERATIONS, INC.)
WSCR (670 AM; 50 kW; CHICAGO, IL; Owner: INFINITY BROADCASTING OPERATIONS, INC.)
WKTA (1330 AM; 5 kW; EVANSTON, IL; Owner: POLNET COMMUNICATIONS, LTD.)
WMVP (1000 AM; 50 kW; CHICAGO, IL; Owner: ABC, INC.)
WCSN (820 AM; 5 kW; CHICAGO, IL; Owner: WYPA, INC.)
WONX (1590 AM; 4 kW; EVANSTON, IL; Owner: KOVAS COMMUNICATIONS, INC.)
WLS (890 AM; 50 kW; CHICAGO, IL; Owner: WLS, INC.)
WTMJ (620 AM; 50 kW; MILWAUKEE, WI; Owner: JOURNAL BROADCAST CORPORATION)
WYLL (1160 AM; 50 kW; CHICAGO, IL; Owner: SCA LICENSE CORPORATION)
WMBI (1110 AM; daytime; 5 kW; CHICAGO, IL; Owner: THE MOODY BIBLE INSTITUTE OF CHICAGO)
WISN (1130 AM; 50 kW; MILWAUKEE, WI; Owner: CAPSTAR TX LIMITED PARTNERSHIP)
WVIV (1200 AM; 20 kW; CHICAGO, IL; Owner: WLXX-AM LICENSE CORP.)
Strongest FM radio stations in Glenview:
WGBK (88.5 FM; GLENVIEW, IL; Owner: GLENBROOK HIGH SCHOOL DISTRICT)
WCKG (105.9 FM; ELMWOOD PARK, IL; Owner: INFINITY HOLDINGS CORPORATION OF ORLANDO)
WLIT-FM (93.9 FM; CHICAGO, IL; Owner: AMFM RADIO LICENSES, L.L.C.)
WGCI-FM (107.5 FM; CHICAGO, IL; Owner: AMFM RADIO LICENSES, L.L.C.)
WJMK (104.3 FM; CHICAGO, IL; Owner: INFINITY BROADCASTING CORP. OF ILLINOIS)
WNUA (95.5 FM; CHICAGO, IL; Owner: AMFM RADIO LICENSES, L.L.C.)
WTMX (101.9 FM; SKOKIE, IL; Owner: BONNEVILLE HOLDING COMPANY)
WBBM-FM (96.3 FM; CHICAGO, IL; Owner: INFINITY BROADCASTING OPERATIONS, INC.)
WKSC-FM (103.5 FM; CHICAGO, IL; Owner: AMFM RADIO LICENSES, L.L.C.)
WFMT (98.7 FM; CHICAGO, IL; Owner: WINDOW TO THE WORLD COMMUNICATIONS)
WZZN (94.7 FM; CHICAGO, IL; Owner: ABC CHICAGO FM RADIO,INC.)
WBEZ (91.5 FM; CHICAGO, IL; Owner: THE WBEZ ALLIANCE, INC.)
WKQX (101.1 FM; CHICAGO, IL; Owner: EMMIS RADIO LICENSE CORPORATION)
WLUP-FM (97.9 FM; CHICAGO, IL; Owner: BONNEVILLE HOLDING COMPANY)
WNND (100.3 FM; CHICAGO, IL; Owner: BONNEVILLE HOLDING COMPANY)
WOJO (105.1 FM; EVANSTON, IL; Owner: TICHENOR LICENSE CORPORATION ("TLC"))
WUSN (99.5 FM; CHICAGO, IL; Owner: INFINITY BROADCASTING CORPORATION OF CHICAGO)
WVAZ (102.7 FM; OAK PARK, IL; Owner: AMFM RADIO LICENSES, L.L.C.)
WXRT-FM (93.1 FM; CHICAGO, IL; Owner: INFINITY BROADCASTING OPERATIONS, INC.)
WDRV (97.1 FM; CHICAGO, IL; Owner: BONNEVILLE HOLDING COMPANY)
TV broadcast stations around Glenview:
W34CK (Channel 34; ARLINGTON HEIGHTS, IL; Owner: FIRST UNITED, INC.)
WLS-TV (Channel 7; CHICAGO, IL; Owner: WLS TELEVISION, INC.)
WMAQ-TV (Channel 5; CHICAGO, IL; Owner: NBC SUBSIDIARY (WMAQ-TV), INC.)
WGBO-TV (Channel 66; JOLIET, IL; Owner: WGBO LICENSE PARTNERSHIP, G.P.)
WTTW (Channel 11; CHICAGO, IL; Owner: WINDOW TO THE WORLD COMMUNICATIONS, INC.)
WBBM-TV (Channel 2; CHICAGO, IL; Owner: CBS BROADCASTING INC.)
WGN-TV (Channel 9; CHICAGO, IL; Owner: WGN CONTINENTAL BROADCASTING COMPANY)
WPWR-TV (Channel 50; GARY, IN; Owner: FOX TELEVISION STATIONS, INC.)
WXFT (Channel 60; AURORA, IL; Owner: TELEFUTURA CHICAGO LLC)
WCIU-TV (Channel 26; CHICAGO, IL; Owner: WCIU-TV LIMITED PARTNERSHIP)
WCPX (Channel 38; CHICAGO, IL; Owner: PAXSON CHICAGO LICENSE, INC.)
WSNS-TV (Channel 44; CHICAGO, IL; Owner: TELEMUNDO OF CHICAGO, INC.)
WFLD (Channel 32; CHICAGO, IL; Owner: FOX TELEVISION STATIONS, INC.)
W68DO (Channel 68; PALATINE, IL; Owner: TRINITY BROADCASTING NETWORK)
WFBT-CA (Channel 23; CHICAGO, IL; Owner: CHANNEL 23 LIMITED PARTNERSHIP)
WJYS (Channel 62; HAMMOND, IN; Owner: JOVON BROADCASTING CORPORATION)
WOCH-LP (Channel 28; CHICAGO, IL; Owner: KM LPTV OF CHICAGO-28, L.L.C.)
WYCC (Channel 20; CHICAGO, IL; Owner: COLLEGE DIST. #508, COUNTY OF COOK)
WOCK-CA (Channel 13; CHICAGO, IL; Owner: KM LPTV OF CHICAGO-13, L.L.C.)
W64CQ (Channel 64; ARLINGTON HEIGHTS, IL; Owner: TRINITY BROADCASTING NETWORK)
WYIN (Channel 56; GARY, IN; Owner: NORTHWEST INDIANA PUBLIC BROADCASTING, INC.)
W57DN (Channel 57; ELGIN, IL; Owner: TRINITY BROADCASTING NETWORK)
National Bridge Inventory (NBI) Statistics 38 Number of bridges367ft / 112m Total length $6,093,000 Total costs1,176,600 Total average daily traffic122,953 Total average daily truck traffic
New bridges - historical statistics
1 1900-1909 2 1920-1929 3 1930-1939 2 1940-1949 14 1950-1959 4 1960-1969 2 1970-1979 2 1980-1989 1 1990-1999 5 2000-2009 2 2010-2019
See full National Bridge Inventory statistics for Glenview, IL
Home Mortgage Disclosure Act Aggregated Statistics For Year 2009(Based on 3 full and 14 partial tracts) A) FHA, FSA/RHS & VA B) Conventional C) Refinancings D) Home Improvement Loans E) Loans on Dwellings For 5+ Families F) Non-occupant Loans on G) Loans On Manufactured Number Average Value Number Average Value Number Average Value Number Average Value Number Average Value Number Average Value Number Average Value
LOANS ORIGINATED 37 $300,235 282 $368,370 1,770 $328,524 28 $223,418 1 $832,620 38 $280,806 6 $262,598 APPLICATIONS APPROVED, NOT ACCEPTED 1 $424,410 40 $405,349 143 $359,277 3 $376,740 0 $0 5 $283,812 3 $183,333 APPLICATIONS DENIED 12 $219,607 46 $403,825 390 $419,992 22 $127,402 2 $345,555 11 $248,880 4 $38,420 APPLICATIONS WITHDRAWN 6 $370,150 28 $340,292 195 $333,504 5 $210,038 0 $0 5 $265,416 2 $44,500 FILES CLOSED FOR INCOMPLETENESS 2 $227,670 9 $568,247 78 $378,637 3 $168,993 0 $0 2 $152,895 0 $0
Aggregated Statistics For Year 2008(Based on 3 full and 14 partial tracts) A) FHA, FSA/RHS & VA B) Conventional C) Refinancings D) Home Improvement Loans E) Loans on Dwellings For 5+ Families F) Non-occupant Loans on G) Loans On Manufactured Number Average Value Number Average Value Number Average Value Number Average Value Number Average Value Number Average Value Number Average Value
LOANS ORIGINATED 6 $360,428 337 $427,421 1,067 $362,104 31 $177,075 1 $593,490 60 $344,892 1 $40,000 APPLICATIONS APPROVED, NOT ACCEPTED 0 $0 50 $436,254 137 $343,642 6 $364,002 0 $0 8 $357,734 0 $0 APPLICATIONS DENIED 5 $271,498 78 $463,660 313 $416,942 24 $212,262 0 $0 20 $384,034 6 $79,883 APPLICATIONS WITHDRAWN 3 $308,387 35 $423,393 118 $343,522 3 $116,943 0 $0 8 $201,618 0 $0 FILES CLOSED FOR INCOMPLETENESS 0 $0 14 $563,281 54 $373,686 1 $315,080 0 $0 0 $0 0 $0
Aggregated Statistics For Year 2007(Based on 3 full and 14 partial tracts) B) Conventional C) Refinancings D) Home Improvement Loans E) Loans on Dwellings For 5+ Families F) Non-occupant Loans on G) Loans On Manufactured Number Average Value Number Average Value Number Average Value Number Average Value Number Average Value Number Average Value
LOANS ORIGINATED 546 $409,708 1,190 $410,942 78 $248,136 6 $7,347,850 80 $369,702 4 $40,750 APPLICATIONS APPROVED, NOT ACCEPTED 82 $421,192 176 $391,935 15 $292,919 0 $0 8 $514,891 2 $62,000 APPLICATIONS DENIED 126 $448,675 396 $456,042 50 $206,270 1 $409,740 41 $497,726 20 $267,420 APPLICATIONS WITHDRAWN 57 $421,127 149 $421,340 14 $391,438 0 $0 17 $418,395 0 $0 FILES CLOSED FOR INCOMPLETENESS 14 $410,149 72 $427,216 5 $177,476 0 $0 4 $468,818 0 $0
Aggregated Statistics For Year 2006(Based on 3 full and 14 partial tracts) A) FHA, FSA/RHS & VA B) Conventional C) Refinancings D) Home Improvement Loans E) Loans on Dwellings For 5+ Families F) Non-occupant Loans on G) Loans On Manufactured Number Average Value Number Average Value Number Average Value Number Average Value Number Average Value Number Average Value Number Average Value
LOANS ORIGINATED 0 $0 818 $384,457 1,228 $394,228 85 $244,124 7 $1,384,027 85 $340,291 9 $42,556 APPLICATIONS APPROVED, NOT ACCEPTED 1 $395,020 101 $384,887 139 $362,791 12 $167,128 0 $0 19 $301,865 6 $64,850 APPLICATIONS DENIED 0 $0 181 $377,833 331 $397,545 35 $178,428 0 $0 26 $372,683 22 $48,609 APPLICATIONS WITHDRAWN 0 $0 88 $398,463 176 $417,297 9 $330,467 1 $1,500,000 11 $352,105 1 $45,000 FILES CLOSED FOR INCOMPLETENESS 0 $0 26 $405,240 75 $384,622 4 $111,040 0 $0 3 $476,477 0 $0
Aggregated Statistics For Year 2005(Based on 3 full and 14 partial tracts) A) FHA, FSA/RHS & VA B) Conventional C) Refinancings D) Home Improvement Loans E) Loans on Dwellings For 5+ Families F) Non-occupant Loans on G) Loans On Manufactured Number Average Value Number Average Value Number Average Value Number Average Value Number Average Value Number Average Value Number Average Value
LOANS ORIGINATED 1 $124,510 1,141 $361,146 1,305 $362,518 100 $283,294 13 $2,278,806 117 $308,460 5 $52,592 APPLICATIONS APPROVED, NOT ACCEPTED 0 $0 108 $407,688 143 $321,032 14 $124,999 0 $0 6 $245,557 3 $72,190 APPLICATIONS DENIED 0 $0 183 $316,168 310 $354,813 26 $118,860 1 $327,370 16 $357,792 37 $55,486 APPLICATIONS WITHDRAWN 0 $0 155 $351,346 249 $325,595 24 $278,647 0 $0 31 $261,882 3 $119,420 FILES CLOSED FOR INCOMPLETENESS 0 $0 35 $310,369 76 $398,835 5 $123,198 0 $0 6 $266,772 0 $0
Aggregated Statistics For Year 2004(Based on 3 full and 14 partial tracts) A) FHA, FSA/RHS & VA B) Conventional C) Refinancings D) Home Improvement Loans E) Loans on Dwellings For 5+ Families F) Non-occupant Loans on G) Loans On Manufactured Number Average Value Number Average Value Number Average Value Number Average Value Number Average Value Number Average Value Number Average Value
LOANS ORIGINATED 0 $0 949 $336,535 1,704 $317,671 76 $163,521 7 $917,913 113 $223,663 21 $34,530 APPLICATIONS APPROVED, NOT ACCEPTED 0 $0 111 $373,337 194 $278,599 10 $153,300 1 $81,140 15 $226,699 4 $51,250 APPLICATIONS DENIED 1 $183,370 101 $289,149 326 $344,080 31 $77,068 1 $335,760 12 $270,206 17 $48,809 APPLICATIONS WITHDRAWN 3 $162,547 87 $377,761 220 $330,481 8 $109,716 1 $550,010 16 $322,781 0 $0 FILES CLOSED FOR INCOMPLETENESS 0 $0 23 $385,798 109 $308,443 7 $61,363 0 $0 7 $196,274 0 $0
Aggregated Statistics For Year 2003(Based on 3 full and 14 partial tracts) A) FHA, FSA/RHS & VA B) Conventional C) Refinancings D) Home Improvement Loans E) Loans on Dwellings For 5+ Families F) Non-occupant Loans on Number Average Value Number Average Value Number Average Value Number Average Value Number Average Value Number Average Value
LOANS ORIGINATED 3 $153,160 930 $334,732 4,270 $268,452 59 $367,813 8 $409,211 111 $360,172 APPLICATIONS APPROVED, NOT ACCEPTED 0 $0 108 $351,835 359 $275,660 14 $63,221 0 $0 8 $256,925 APPLICATIONS DENIED 1 $77,700 105 $276,913 477 $279,305 31 $56,281 1 $405,710 19 $188,946 APPLICATIONS WITHDRAWN 4 $197,665 91 $374,453 353 $268,534 8 $115,239 1 $576,090 12 $215,154 FILES CLOSED FOR INCOMPLETENESS 2 $158,505 38 $388,275 131 $272,590 3 $41,483 0 $0 5 $183,774
Aggregated Statistics For Year 2002(Based on 3 full and 14 partial tracts) A) FHA, FSA/RHS & VA B) Conventional C) Refinancings D) Home Improvement Loans E) Loans on Dwellings For 5+ Families F) Non-occupant Loans on Number Average Value Number Average Value Number Average Value Number Average Value Number Average Value Number Average Value
LOANS ORIGINATED 1 $198,180 1,047 $314,261 3,153 $261,266 67 $68,773 9 $425,892 86 $205,561 APPLICATIONS APPROVED, NOT ACCEPTED 1 $177,150 103 $350,301 283 $257,297 17 $46,608 1 $236,430 8 $171,562 APPLICATIONS DENIED 1 $98,590 85 $267,613 227 $259,242 20 $64,130 1 $154,000 6 $248,810 APPLICATIONS WITHDRAWN 0 $0 69 $282,351 208 $267,707 5 $123,052 0 $0 6 $238,132 FILES CLOSED FOR INCOMPLETENESS 0 $0 33 $304,309 178 $271,596 4 $94,085 0 $0 7 $173,374
Aggregated Statistics For Year 2001(Based on 3 full and 14 partial tracts) A) FHA, FSA/RHS & VA B) Conventional C) Refinancings D) Home Improvement Loans E) Loans on Dwellings For 5+ Families F) Non-occupant Loans on Number Average Value Number Average Value Number Average Value Number Average Value Number Average Value Number Average Value
LOANS ORIGINATED 7 $158,793 897 $276,243 2,093 $238,599 72 $94,056 10 $550,468 54 $204,356 APPLICATIONS APPROVED, NOT ACCEPTED 0 $0 82 $300,239 151 $204,555 25 $57,470 1 $299,390 8 $220,215 APPLICATIONS DENIED 1 $148,520 76 $230,401 242 $236,201 22 $57,387 2 $322,660 16 $195,031 APPLICATIONS WITHDRAWN 3 $106,267 58 $306,053 176 $227,894 21 $69,191 1 $883,200 4 $234,545 FILES CLOSED FOR INCOMPLETENESS 0 $0 14 $288,429 61 $275,153 6 $63,828 1 $244,130 0 $0
Aggregated Statistics For Year 2000(Based on 3 full and 14 partial tracts) A) FHA, FSA/RHS & VA B) Conventional C) Refinancings D) Home Improvement Loans E) Loans on Dwellings For 5+ Families F) Non-occupant Loans on Number Average Value Number Average Value Number Average Value Number Average Value Number Average Value Number Average Value
LOANS ORIGINATED 6 $182,457 813 $230,473 447 $218,171 77 $73,494 7 $261,640 38 $163,507 APPLICATIONS APPROVED, NOT ACCEPTED 2 $159,095 59 $234,755 68 $173,491 20 $70,286 0 $0 4 $139,155 APPLICATIONS DENIED 3 $132,620 74 $179,579 119 $197,887 37 $68,619 0 $0 9 $191,316 APPLICATIONS WITHDRAWN 0 $0 51 $222,937 89 $165,743 17 $63,378 1 $223,840 5 $134,598 FILES CLOSED FOR INCOMPLETENESS 0 $0 10 $224,253 25 $241,353 4 $95,988 0 $0 1 $195,000
Aggregated Statistics For Year 1999(Based on 4 full and 13 partial tracts) A) FHA, FSA/RHS & VA B) Conventional C) Refinancings D) Home Improvement Loans E) Loans on Dwellings For 5+ Families F) Non-occupant Loans on Number Average Value Number Average Value Number Average Value Number Average Value Number Average Value Number Average Value
LOANS ORIGINATED 6 $182,352 789 $213,842 944 $199,910 99 $57,336 15 $255,674 44 $164,551 APPLICATIONS APPROVED, NOT ACCEPTED 0 $0 65 $169,800 107 $192,406 6 $36,762 0 $0 2 $221,970 APPLICATIONS DENIED 3 $142,957 75 $171,128 164 $177,054 21 $38,255 0 $0 5 $73,908 APPLICATIONS WITHDRAWN 1 $178,440 67 $207,749 122 $163,321 13 $45,391 0 $0 2 $71,655 FILES CLOSED FOR INCOMPLETENESS 0 $0 16 $189,509 48 $198,894 1 $52,980 0 $0 0 $0
Detailed mortgage data for all 16 tracts in Glenview, IL
Private Mortgage Insurance Companies Aggregated Statistics For Year 2009(Based on 3 full and 14 partial tracts) A) Conventional B) Refinancings Number Average Value Number Average Value
LOANS ORIGINATED 32 $279,399 12 $336,488 APPLICATIONS APPROVED, NOT ACCEPTED 12 $284,008 9 $288,054 APPLICATIONS DENIED 5 $278,594 11 $318,312 APPLICATIONS WITHDRAWN 3 $238,360 1 $327,430 FILES CLOSED FOR INCOMPLETENESS 0 $0 0 $0
Aggregated Statistics For Year 2008(Based on 3 full and 14 partial tracts) A) Conventional B) Refinancings C) Non-occupant Loans on Number Average Value Number Average Value Number Average Value
LOANS ORIGINATED 44 $273,595 32 $293,592 1 $451,800 APPLICATIONS APPROVED, NOT ACCEPTED 17 $285,248 22 $262,103 3 $212,520 APPLICATIONS DENIED 6 $369,773 4 $266,538 1 $208,000 APPLICATIONS WITHDRAWN 1 $304,230 4 $321,690 0 $0 FILES CLOSED FOR INCOMPLETENESS 2 $445,365 1 $286,940 1 $407,460
Aggregated Statistics For Year 2007(Based on 3 full and 14 partial tracts) A) Conventional B) Refinancings C) Non-occupant Loans on Number Average Value Number Average Value Number Average Value
LOANS ORIGINATED 49 $286,421 42 $281,434 1 $444,340 APPLICATIONS APPROVED, NOT ACCEPTED 6 $417,260 12 $322,179 2 $384,870 APPLICATIONS DENIED 1 $388,350 1 $120,310 0 $0 APPLICATIONS WITHDRAWN 4 $305,850 6 $259,737 0 $0 FILES CLOSED FOR INCOMPLETENESS 0 $0 0 $0 0 $0
Aggregated Statistics For Year 2006(Based on 3 full and 13 partial tracts) A) Conventional B) Refinancings C) Non-occupant Loans on Number Average Value Number Average Value Number Average Value
LOANS ORIGINATED 35 $260,370 20 $284,284 2 $239,085 APPLICATIONS APPROVED, NOT ACCEPTED 5 $370,716 4 $281,408 1 $159,070 APPLICATIONS DENIED 0 $0 2 $211,500 2 $202,505 APPLICATIONS WITHDRAWN 2 $200,815 0 $0 1 $233,690 FILES CLOSED FOR INCOMPLETENESS 1 $134,300 0 $0 0 $0
Aggregated Statistics For Year 2005(Based on 3 full and 14 partial tracts) A) Conventional B) Refinancings C) Non-occupant Loans on Number Average Value Number Average Value Number Average Value
LOANS ORIGINATED 51 $282,784 25 $269,684 4 $404,095 APPLICATIONS APPROVED, NOT ACCEPTED 10 $274,532 14 $300,351 0 $0 APPLICATIONS DENIED 1 $832,480 0 $0 0 $0 APPLICATIONS WITHDRAWN 3 $217,840 1 $538,840 0 $0 FILES CLOSED FOR INCOMPLETENESS 0 $0 0 $0 0 $0
Aggregated Statistics For Year 2004(Based on 3 full and 14 partial tracts) A) Conventional B) Refinancings C) Non-occupant Loans on Number Average Value Number Average Value Number Average Value
LOANS ORIGINATED 87 $229,832 27 $260,964 7 $220,261 APPLICATIONS APPROVED, NOT ACCEPTED 21 $221,296 13 $245,139 2 $248,345 APPLICATIONS DENIED 0 $0 1 $900,000 0 $0 APPLICATIONS WITHDRAWN 5 $221,966 4 $242,880 0 $0 FILES CLOSED FOR INCOMPLETENESS 0 $0 0 $0 0 $0
Aggregated Statistics For Year 2003(Based on 3 full and 14 partial tracts) A) Conventional B) Refinancings C) Non-occupant Loans on Number Average Value Number Average Value Number Average Value
LOANS ORIGINATED 123 $242,142 44 $225,540 5 $187,742 APPLICATIONS APPROVED, NOT ACCEPTED 22 $258,766 20 $235,538 1 $154,860 APPLICATIONS DENIED 4 $271,118 2 $245,700 0 $0 APPLICATIONS WITHDRAWN 3 $247,723 2 $413,470 0 $0 FILES CLOSED FOR INCOMPLETENESS 0 $0 0 $0 0 $0
Aggregated Statistics For Year 2002(Based on 3 full and 14 partial tracts) A) Conventional B) Refinancings C) Non-occupant Loans on Number Average Value Number Average Value Number Average Value
LOANS ORIGINATED 129 $239,327 55 $240,342 3 $203,140 APPLICATIONS APPROVED, NOT ACCEPTED 20 $272,933 21 $246,393 1 $134,060 APPLICATIONS DENIED 3 $311,367 3 $353,477 1 $147,360 APPLICATIONS WITHDRAWN 6 $328,280 3 $274,763 0 $0 FILES CLOSED FOR INCOMPLETENESS 1 $426,690 0 $0 0 $0
Aggregated Statistics For Year 2001(Based on 3 full and 14 partial tracts) A) Conventional B) Refinancings C) Non-occupant Loans on Number Average Value Number Average Value Number Average Value
LOANS ORIGINATED 136 $228,910 46 $193,723 3 $208,033 APPLICATIONS APPROVED, NOT ACCEPTED 26 $248,479 13 $208,635 2 $165,520 APPLICATIONS DENIED 3 $317,030 6 $277,363 1 $122,410 APPLICATIONS WITHDRAWN 7 $277,154 3 $301,587 0 $0 FILES CLOSED FOR INCOMPLETENESS 2 $192,610 0 $0 0 $0
Aggregated Statistics For Year 2000(Based on 3 full and 14 partial tracts) A) Conventional B) Refinancings C) Non-occupant Loans on Number Average Value Number Average Value Number Average Value
LOANS ORIGINATED 108 $203,754 23 $197,362 7 $182,944 APPLICATIONS APPROVED, NOT ACCEPTED 23 $215,730 6 $209,915 1 $153,090 APPLICATIONS DENIED 3 $193,563 3 $342,613 1 $198,970 APPLICATIONS WITHDRAWN 3 $104,313 1 $272,640 1 $89,540 FILES CLOSED FOR INCOMPLETENESS 1 $70,650 0 $0 0 $0
Aggregated Statistics For Year 1999(Based on 4 full and 13 partial tracts) A) Conventional B) Refinancings Number Average Value Number Average Value
LOANS ORIGINATED 137 $196,672 50 $186,785 APPLICATIONS APPROVED, NOT ACCEPTED 14 $202,800 13 $164,550 APPLICATIONS DENIED 8 $231,148 2 $299,515 APPLICATIONS WITHDRAWN 5 $102,658 2 $235,300 FILES CLOSED FOR INCOMPLETENESS 1 $241,470 1 $174,000
Fire-safe hotels and motels in Glenview, Illinois:
Wyndham Glenview Suites, 1400 Milwaukee Ave, Glenview, Illinois 60025 Phone: (847) 803-9800, Fax: (847) 803-0380
Baymont Inn & Suites - Glenview, 1625 Milwaukee Ave, Glenview, Illinois 60025 Phone: (224) 217-5230
Motel 6 Of Glenview, 1535 N Milwaukee Ave, Glenview, Illinois 60025 Phone: (847) 390-7200, Fax: (847) 390-0845
Best Western Plus Glenview Chicagoland Inn & Suite, 4514 W Lake Ave, Glenview, Illinois 60026 Phone: (847) 635-5220, Fax: (847) 635-5219
Staybridge Suites, 2600 Lehigh Ave, Glenview, Illinois 60026 Phone: (847) 657-0002, Fax: (847) 657-0003
Baymont Inn & Suites, 1625 Milwaukee Ave, Glenview, Illinois 60025 Phone: (224) 217-5230, Fax: (224) 217-5238
Delta Hotels by Marriott Chicago North Shore, 1400 Milwaukee Ave, Glenview, Illinois 60025 Phone: (847) 803-9800
All 7 fire-safe hotels and motels in Glenview, Illinois
Most common first names in Glenview, IL among deceased individuals Name Count Lived (average)
John 332 76.3 years Mary 270 81.6 years William 256 75.9 years Robert 198 72.1 years Helen 175 82.9 years Margaret 168 81.8 years Joseph 149 78.4 years George 148 75.5 years Anna 141 84.7 years James 138 72.2 years
Most common last names in Glenview, IL among deceased individuals Last name Count Lived (average)
Johnson 76 79.3 years Anderson 55 78.8 years Smith 53 76.2 years Miller 44 73.7 years Nelson 43 80.0 years Brown 35 76.7 years Peterson 27 73.8 years Carlson 26 80.5 years Murphy 24 74.2 years Lee 24 75.2 years
Glenview compared to Illinois state average:
Median household income above state average. Median house value significantly above state average. Unemployed percentage significantly below state average. Black race population percentage significantly below state average. Hispanic race population percentage below state average. Median age above state average. Foreign-born population percentage above state average. Renting percentage below state average. Length of stay since moving in significantly above state average. Percentage of population with a bachelor's degree or higher significantly above state average.
#20 on the list of "Top 101 cities with the most local government spending on current operations of libraries per resident (population 10,000+)"
#73 on the list of "Top 101 cities with the most residents born in Belarus (population 500+)"
#85 on the list of "Top 101 cities with the most residents born in Greece (population 500+)"
#101 on the list of "Top 101 cities with the most residents born in Eastern Europe (population 500+)"
#1 on the list of "Top 101 counties with the most Black Protestant congregations"
#1 on the list of "Top 101 counties with the most Catholic congregations"
#1 on the list of "Top 101 counties with the highest surface withdrawal of fresh water for public supply"
#2 on the list of "Top 101 counties with the most Black Protestant adherents"
#2 on the list of "Top 101 counties with the most Orthodox congregations (pop. 50,000+)"
Top Patent Applicants
Joel R. Jaffe (145)
Peter R. Anderson (86)
Richard B. Robbins (48)
Manuela Serban (45)
John Q. Chen (44)
Joseph A. Kocal (43)
John M. Harris (41)
James Zhengshe Liu (30)
Joseph Patrick Burke (24)
Andrew Frolov (23)
Total of 1884 patent applications in 2008-2024.


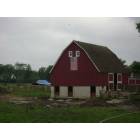
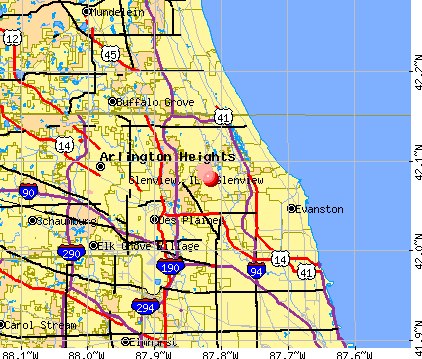


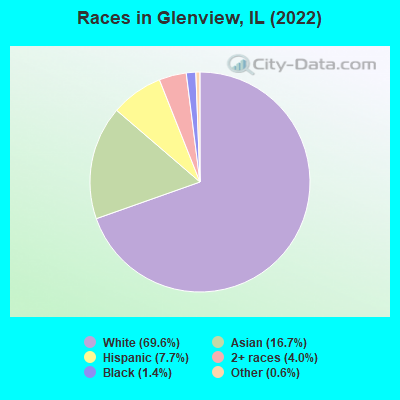
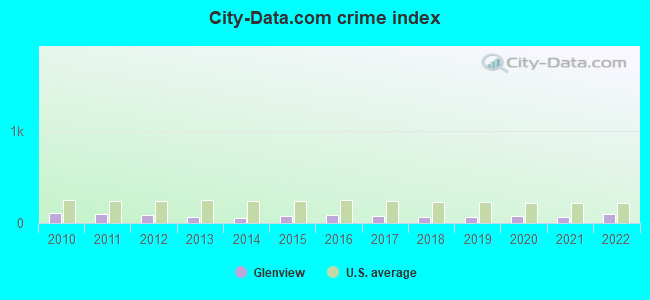
 Recent articles from our blog. Our writers, many of them Ph.D. graduates or candidates, create easy-to-read articles on a wide variety of topics.

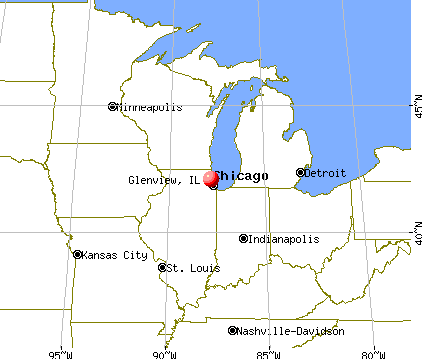
 (4.9 miles
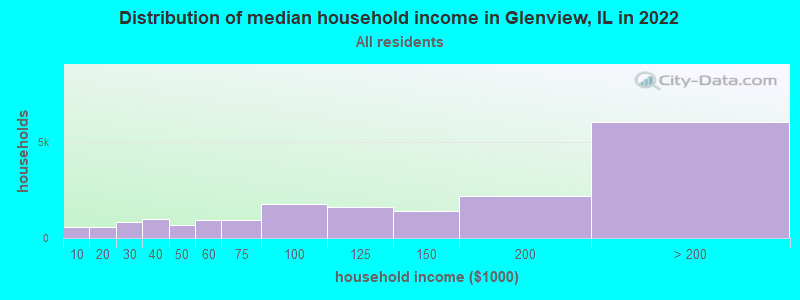
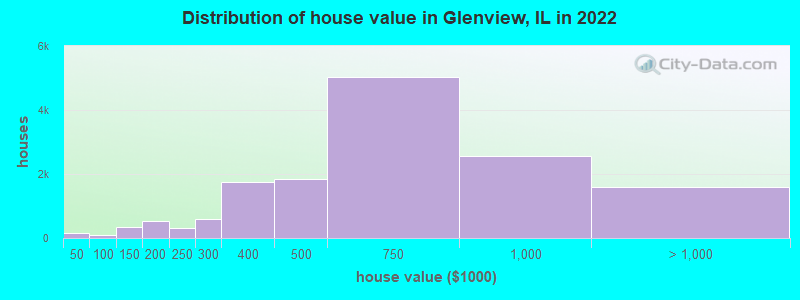

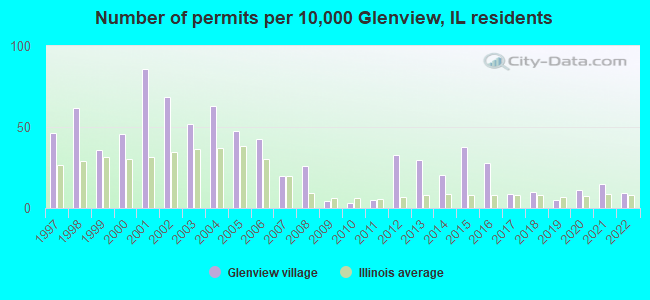
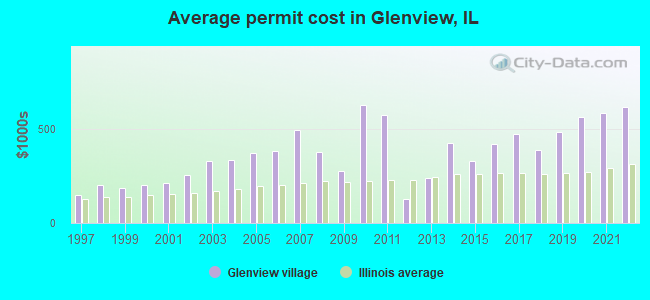
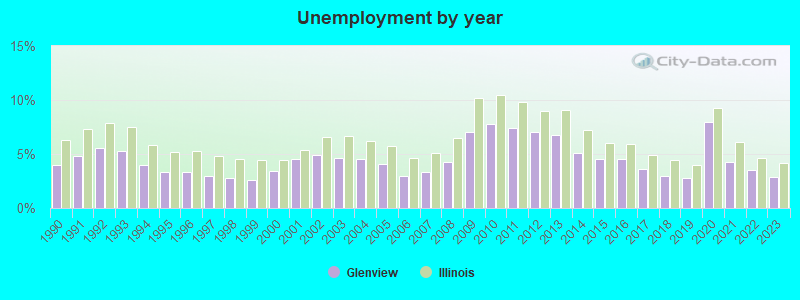
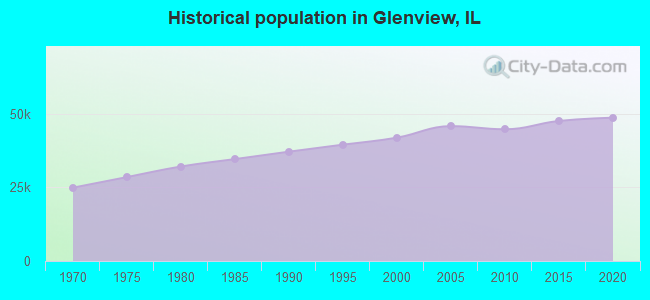
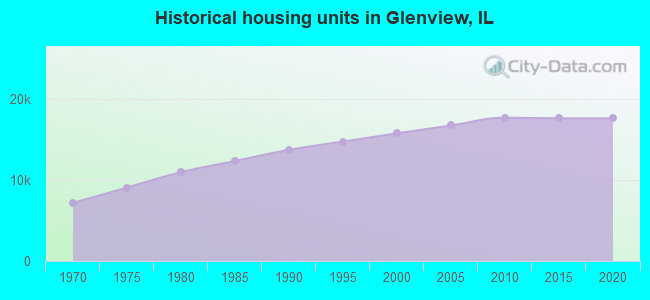
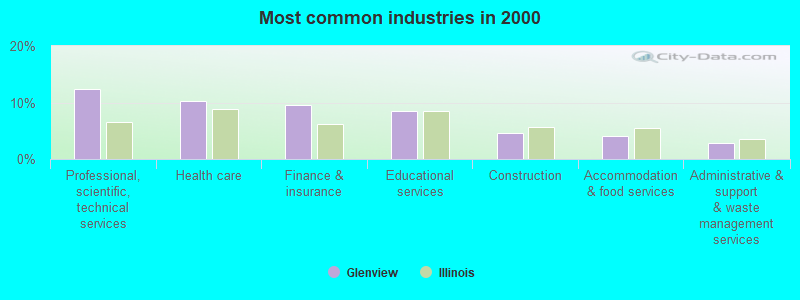
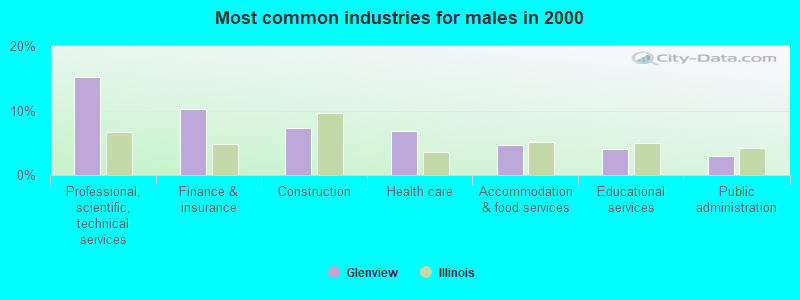
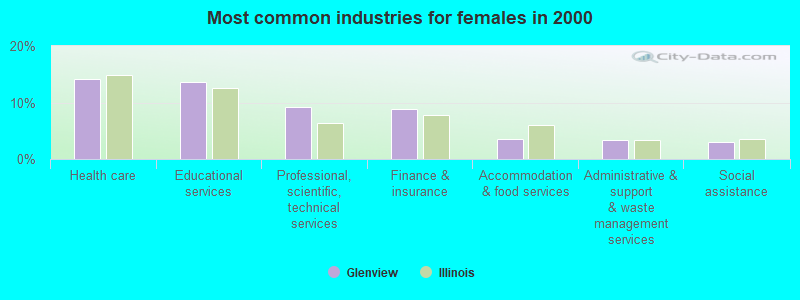
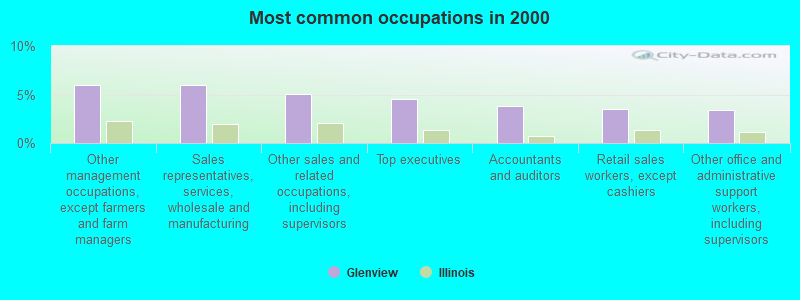
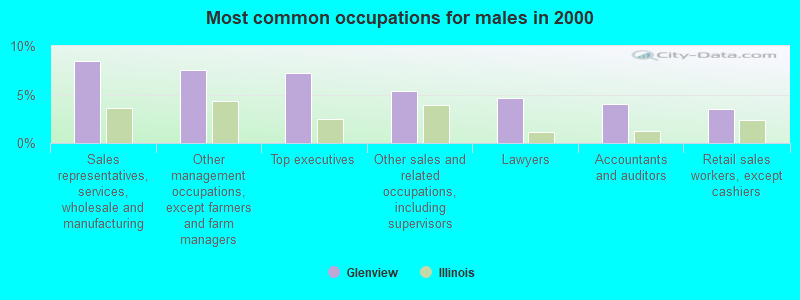
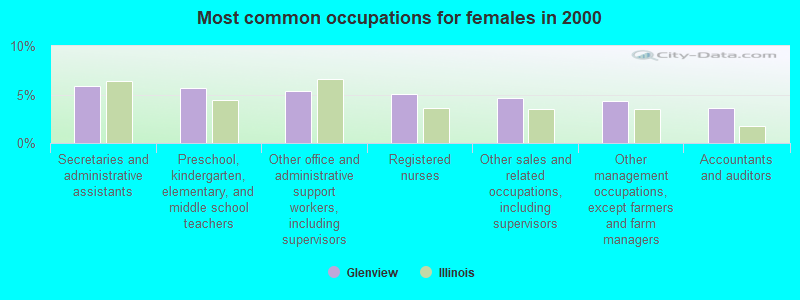
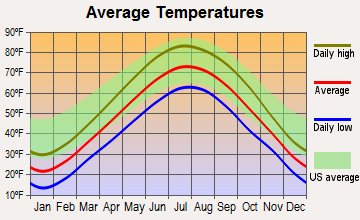
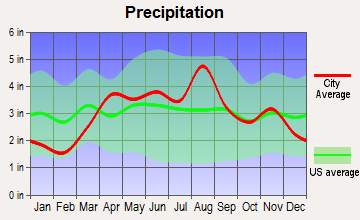
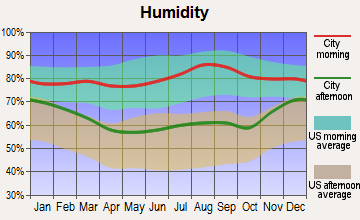
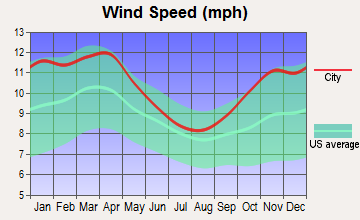
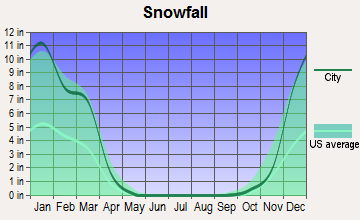
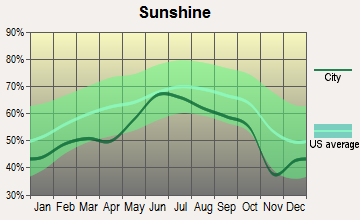
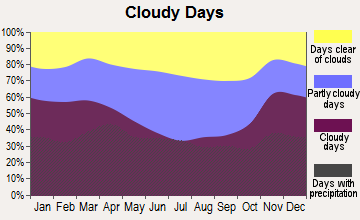


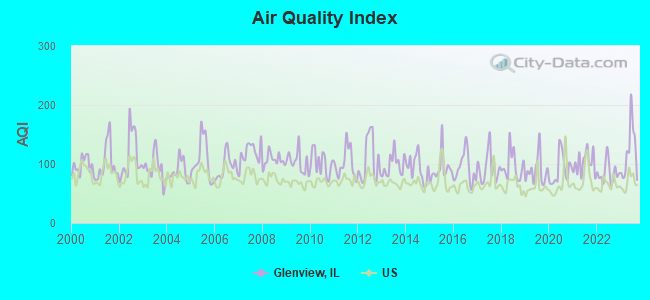
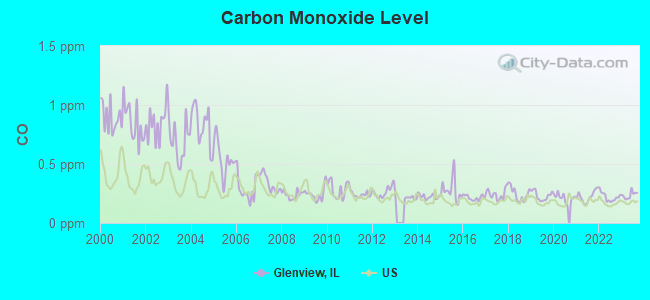
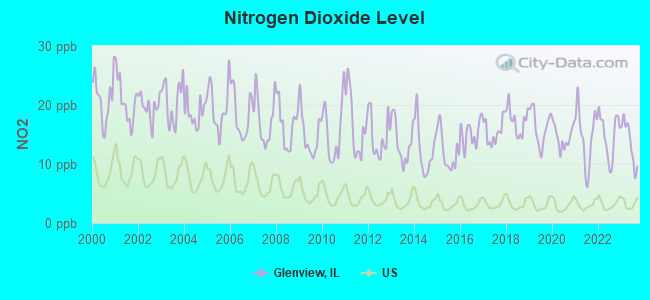
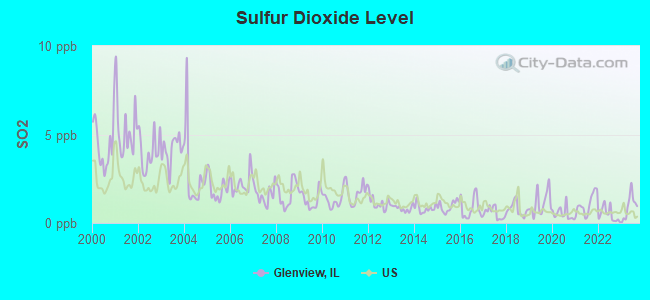
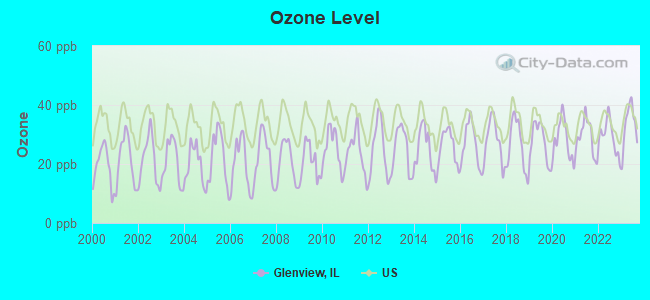
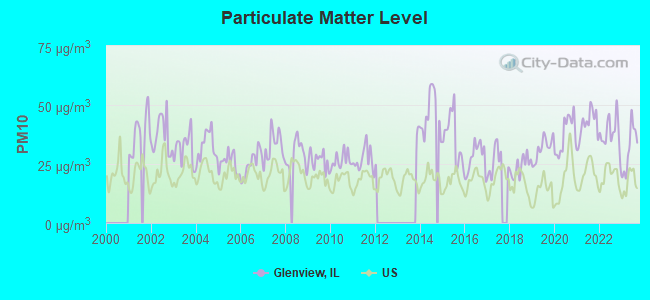
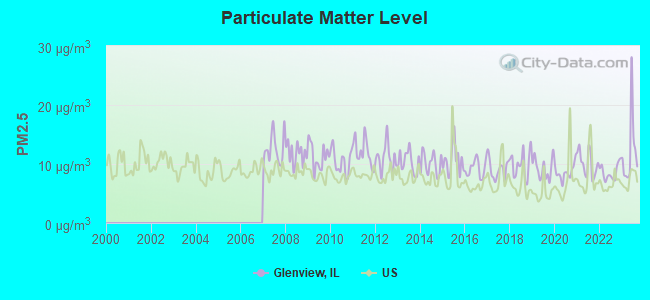
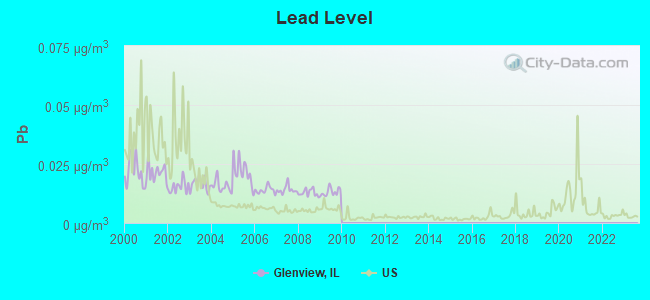
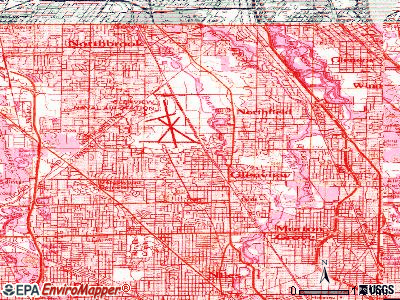
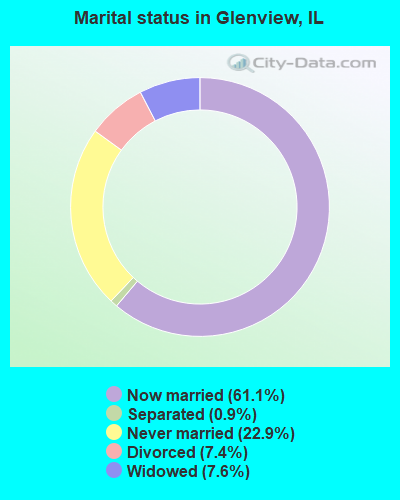
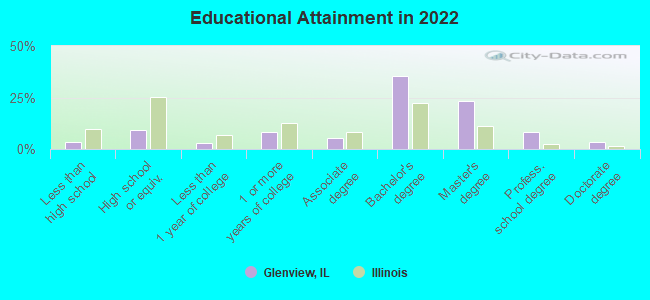
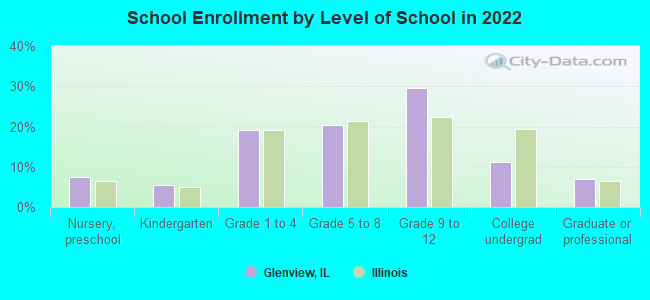
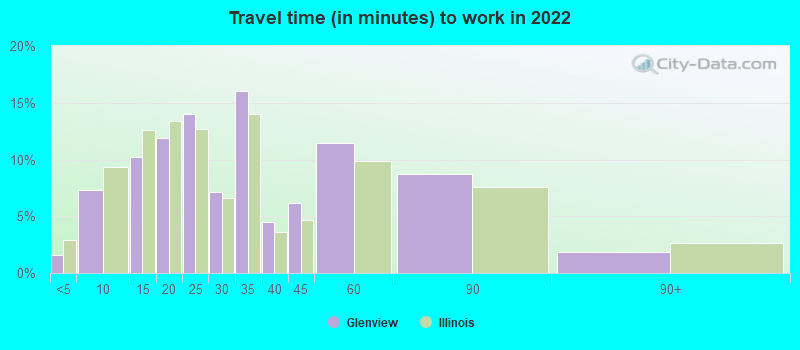
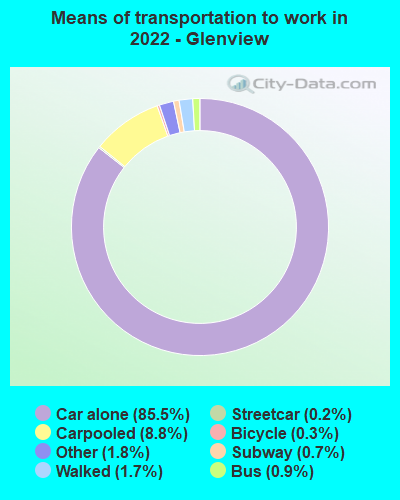


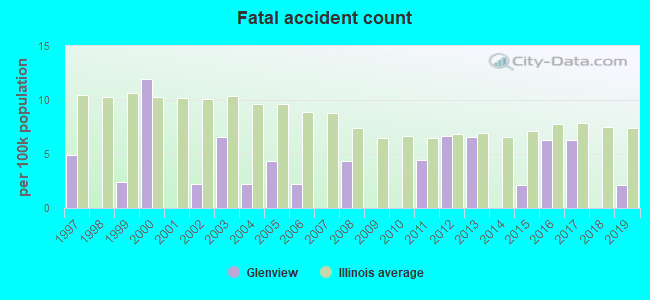
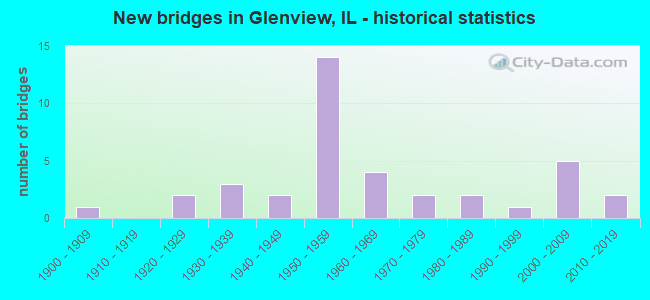
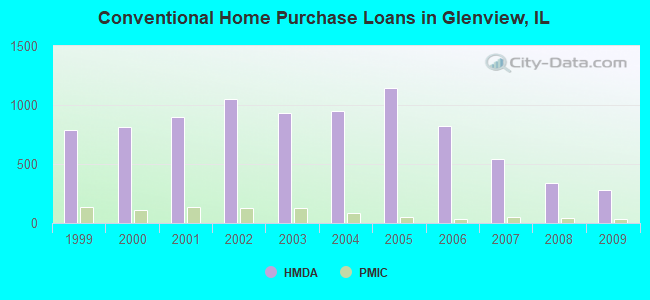
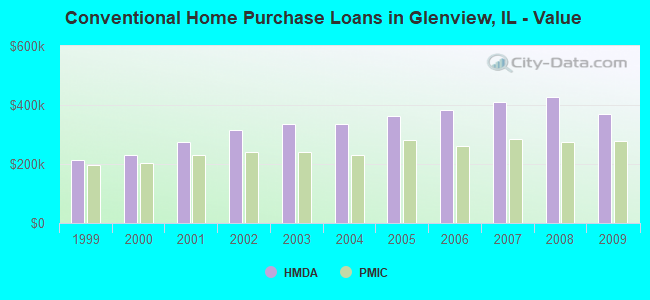
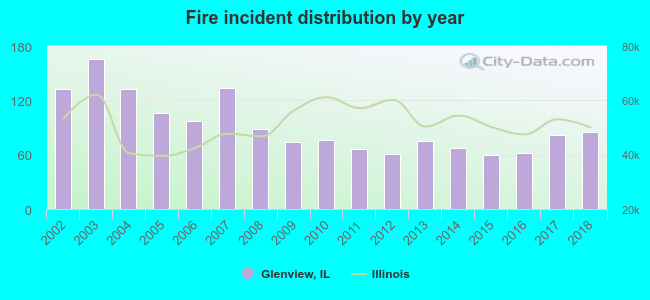 According to the data from the years 2002 - 2018 the average number of fires per year is 92. The highest number of reported fire incidents - 166 took place in 2003, and the least - 60 in 2015. The data has a decreasing trend.
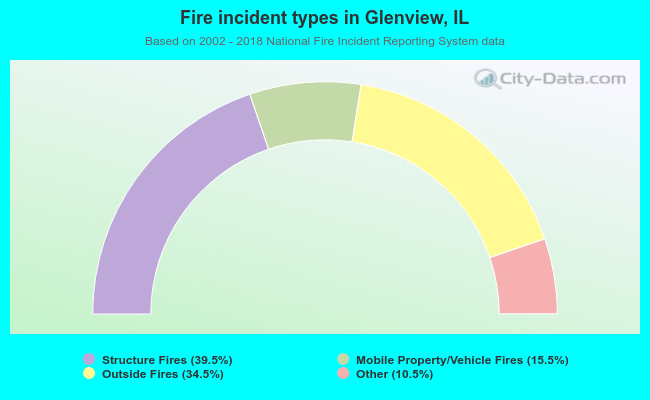 When looking into fire subcategories, the most incidents belonged to: Structure Fires (39.5%), and Outside Fires (34.5%).