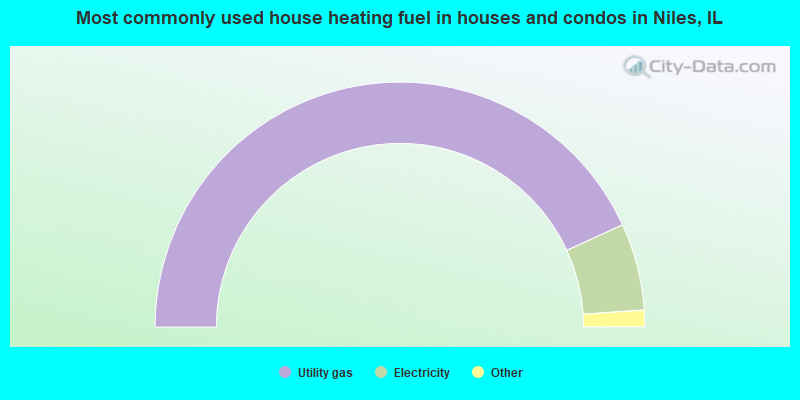
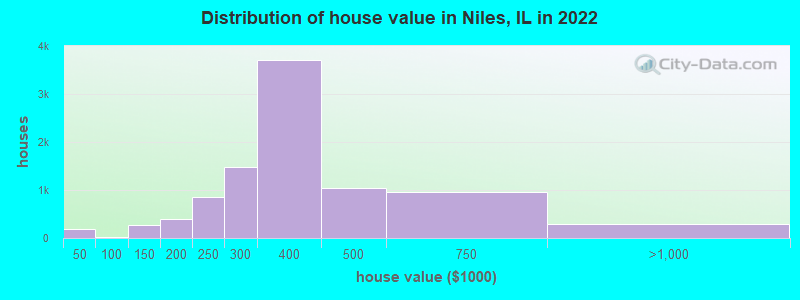
Estimated median house or condo value in 2022: $345,014 (it was $198,000 in 2000)
Niles:
$345,014
IL:
$251,600
Mean prices in 2022:all housing units: $357,116; detached houses: $418,750; townhouses or other attached units: $276,960; in 2-unit structures: $338,969; in 3-to-4-unit structures: $393,598; in 5-or-more-unit structures: $228,994
Median gross rent in 2022: $1,211.
March 2022 cost of living index in Niles: 102.9 (near average, U.S. average is 100)
Percentage of residents living in poverty in 2022: 7.7%
(9.4% for White Non-Hispanic residents, 3.3% for Black residents, 1.1% for Hispanic or Latino residents, 3.4% for other race residents, 1.7% for two or more races residents)
According to our research of Illinois and other state lists, there were 11 registered sex offenders living in Niles, Illinois as of April 27, 2024. The ratio of all residents to sex offenders in Niles is 2,681 to 1. The ratio of registered sex offenders to all residents in this city is much lower than the state average.
Crime rates in Niles by year
Type
2010
2011
2012
2013
2014
2015
2016
2017
2018
2019
2020
2021
2022
Murders (per 100,000)
0 (0.0)
0 (0.0)
0 (0.0)
0 (0.0)
0 (0.0)
0 (0.0)
0 (0.0)
0 (0.0)
1 (3.4)
0 (0.0)
0 (0.0)
0 (0.0)
0 (0.0)
Rapes (per 100,000)
3 (10.1)
0 (0.0)
3 (10.0)
1 (3.3)
0 (0.0)
2 (6.7)
2 (6.7)
1 (3.4)
5 (17.0)
5 (17.2)
0 (0.0)
2 (7.0)
6 (20.1)
Robberies (per 100,000)
11 (36.9)
9 (30.1)
13 (43.4)
8 (26.7)
14 (46.6)
7 (23.3)
8 (26.8)
6 (20.3)
11 (37.4)
15 (51.5)
4 (13.9)
4 (14.0)
7 (23.5)
Assaults (per 100,000)
12 (40.3)
13 (43.5)
8 (26.7)
26 (86.6)
13 (43.2)
17 (56.6)
19 (63.6)
17 (57.5)
17 (57.8)
16 (55.0)
11 (38.1)
6 (21.1)
18 (60.4)
Burglaries (per 100,000)
82 (275.1)
78 (260.9)
66 (220.4)
63 (209.9)
86 (286.0)
73 (243.0)
49 (164.0)
73 (246.8)
63 (214.0)
70 (240.5)
46 (159.5)
21 (73.7)
78 (261.9)
Thefts (per 100,000)
643 (2,158)
597 (1,997)
645 (2,154)
637 (2,123)
590 (1,962)
448 (1,491)
639 (2,138)
489 (1,653)
514 (1,746)
542 (1,862)
475 (1,647)
277 (972.2)
605 (2,031)
Auto thefts (per 100,000)
37 (124.1)
30 (100.4)
39 (130.2)
20 (66.6)
24 (79.8)
13 (43.3)
14 (46.8)
16 (54.1)
28 (95.1)
12 (41.2)
22 (76.3)
16 (56.2)
35 (117.5)
Arson (per 100,000)
0 (0.0)
1 (3.3)
0 (0.0)
0 (0.0)
1 (3.3)
2 (6.7)
1 (3.3)
6 (20.3)
2 (6.8)
0 (0.0)
2 (6.9)
0 (0.0)
0 (0.0)
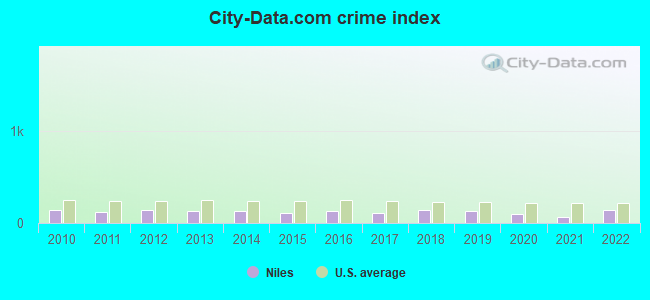
City-Data.com crime index
142.7
123.9
138.4
132.9
127.5
103.7
126.8
108.0
135.6
134.8
94.9
62.6
144.2
The City-Data.com crime index weighs serious crimes and violent crimes more heavily. Higher means more crime, U.S. average is 246.1. It adjusts for the number of visitors and daily workers commuting into cities.
Latest news from Niles, IL collected exclusively by city-data.com from local newspapers, TV, and radio stations
Ancestries: Polish (16.3%), Irish (4.0%), Greek (4.0%), German (3.9%), American (3.7%), Assyrian (3.6%).
Current Local Time: CST time zone
Incorporated on 09/26/1901
Elevation: 625 feet
Land area: 5.88 square miles.
Population density: 5,073 people per square mile (average).
12,958 residents are foreign born (20.3% Asia, 16.2% Europe, 4.9% Latin America).
This village:
43.3%
Illinois:
14.1%
Median real estate property taxes paid for housing units with mortgages in 2022: $6,112 (1.7%) Median real estate property taxes paid for housing units with no mortgage in 2022: $5,116 (1.6%)
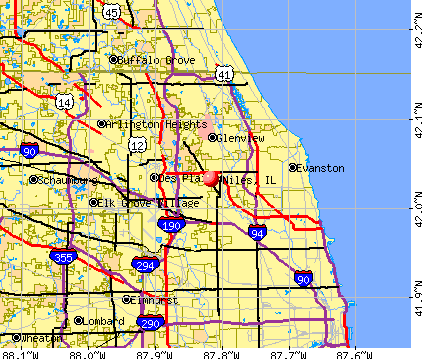
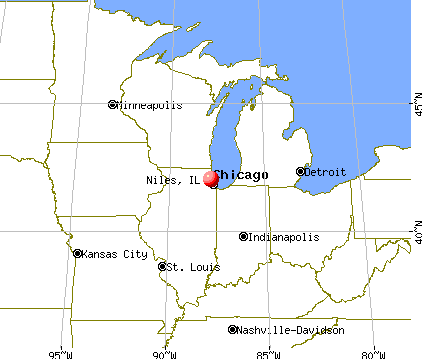
Nearest city with pop. 50,000+: Skokie, IL (4.0 miles , pop. 63,348).
Nearest city with pop. 200,000+: Chicago, IL (15.0 miles , pop. 2,896,016).
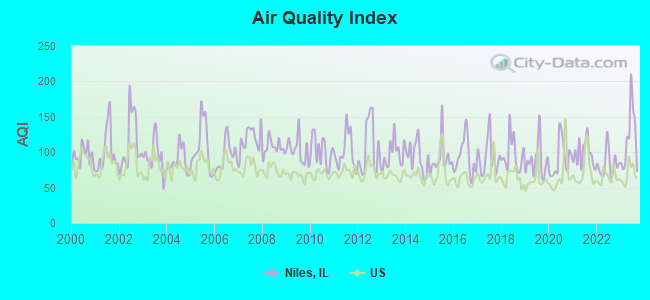
Air Quality Index (AQI) level in 2023 was 119. This is significantly worse than average.
City:
119
U.S.:
73
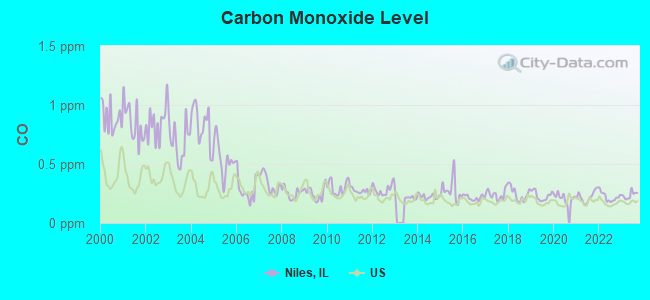
Carbon Monoxide (CO) [ppm] level in 2023 was 0.237. This is about average.Closest monitor was 1.5 miles away from the city center.
City:
0.237
U.S.:
0.251
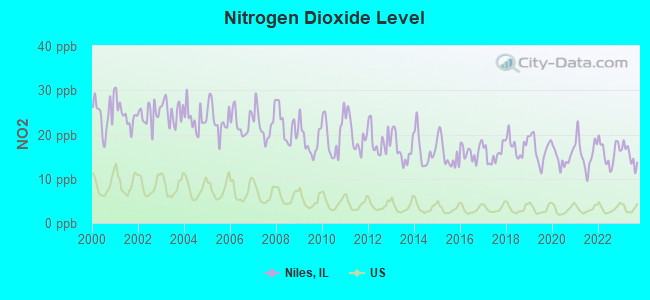
Nitrogen Dioxide (NO2) [ppb] level in 2023 was 15.3. This is significantly worse than average.Closest monitor was 1.4 miles away from the city center.
City:
15.3
U.S.:
5.1
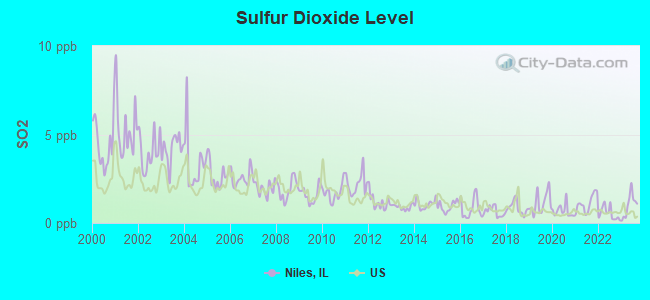
Sulfur Dioxide (SO2) [ppb] level in 2023 was 1.01. This is significantly better than average.Closest monitor was 1.4 miles away from the city center.
City:
1.01
U.S.:
1.51
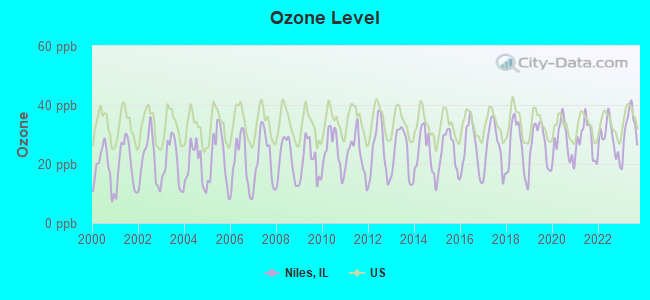
Ozone [ppb] level in 2023 was 32.2. This is about average.Closest monitor was 3.1 miles away from the city center.
City:
32.2
U.S.:
33.3
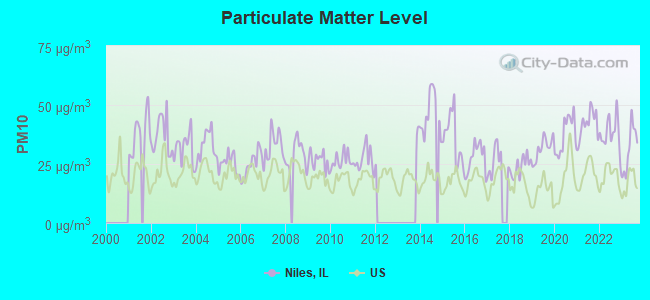
Particulate Matter (PM10) [µg/m3] level in 2023 was 31.4. This is significantly worse than average.Closest monitor was 4.2 miles away from the city center.
City:
31.4
U.S.:
19.2
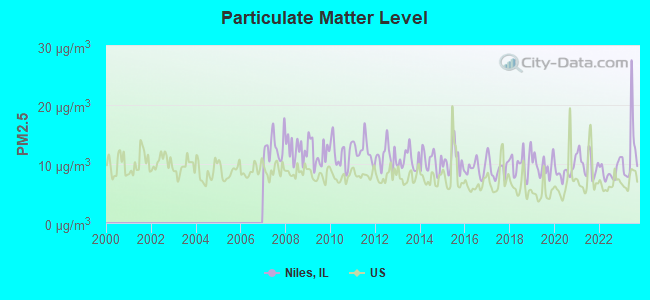
Particulate Matter (PM2.5) [µg/m3] level in 2023 was 12.0. This is significantly worse than average.Closest monitor was 3.1 miles away from the city center.
City:
12.0
U.S.:
8.1
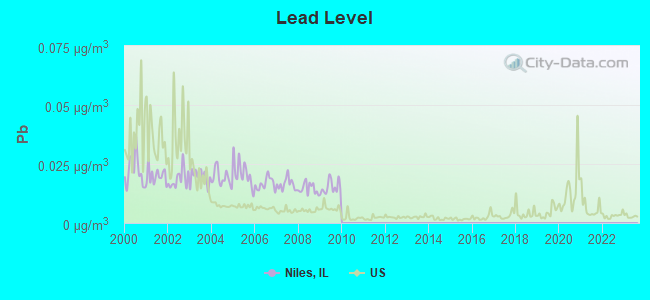
Lead (Pb) [µg/m3] level in 2009 was 0.0152. This is significantly worse than average.Closest monitor was 1.3 miles away from the city center.
City:
0.0152
U.S.:
0.0093
Tornado activity:
Niles-area historical tornado activity is slightly below Illinois state average. It is 38% greater than the overall U.S. average.
On 9/28/1972, a category F4 (max. wind speeds 207-260 mph) tornado 17.3 miles away from the Niles village center injured 20 peopleand causedbetween $500,000 and $5,000,000 in damages.
On 8/28/1990, a category F5 (max. wind speeds 261-318 mph) tornado 36.7 miles away from the village center killed 29 peopleand injured 350 peopleand causedbetween $50,000 and $500,000 in damages.
Earthquake activity:
Niles-area historical earthquake activity is significantly above Illinois state average. It is 34% greater than the overall U.S. average.
On 4/18/2008 at 09:36:59, a magnitude 5.4 (5.1 MB, 4.8 MS, 5.4 MW, 5.2 MW, Class: Moderate, Intensity: VI - VII) earthquake occurred 247.7 miles away from the city center On 6/10/1987 at 23:48:54, a magnitude 5.1 (4.9 MB, 4.4 MS, 4.6 MS, 5.1 LG) earthquake occurred 222.1 miles away from Niles center On 4/18/2008 at 09:36:59, a magnitude 5.2 (5.2 MW, Depth: 8.9 mi) earthquake occurred 247.7 miles away from the city center On 6/28/2004 at 06:10:52, a magnitude 4.2 (4.2 MW, Depth: 6.2 mi, Class: Light, Intensity: IV - V) earthquake occurred 68.5 miles away from the city center On 2/10/2010 at 09:59:35, a magnitude 3.8 (3.8 MW, Depth: 6.2 mi, Class: Light, Intensity: II - III) earthquake occurred 35.3 miles away from Niles center On 5/2/2015 at 16:23:07, a magnitude 4.2 (4.2 MW, Depth: 2.8 mi) earthquake occurred 123.3 miles away from the city center Magnitude types: regional Lg-wave magnitude (LG), body-wave magnitude (MB), surface-wave magnitude (MS), moment magnitude (MW)
Natural disasters:
The number of natural disasters in Cook County (20) is greater than the US average (15). Major Disasters (Presidential) Declared: 15 Emergencies Declared: 4
Causes of natural disasters: Floods: 13, Storms: 12, Tornadoes: 3, Snowstorms: 2, Winter Storms: 2, Blizzard: 1, Hurricane: 1, Snow: 1, Wind: 1, Other: 1 (Note: some incidents may be assigned to more than one category).
Main business address for: MFRI INC (INDUSTRIAL & COMMERCIAL FANS & BLOWERS & AIR PURIFYING EQUIP).
Nursing Homes in Niles:
FOREST VILLA LTD (6840 TOUHY AVE)
FOREST VILLA NSG AND REHAB, LLC (6840 WEST TOUHY AVENUE)
GLEN BRIDGE N AND REHAB CENTRE (8333 WEST GOLF ROAD)
GLENBRIDGE NURSING AND REHAB CTR (8333 W GOLF RD)
GROSSE POINTE MANOR (6601 WEST TOUHY AVENUE)
NILES NSG AND REHAB CTR (9777 GREENWOOD)
REGENCY REHABILITATION CENTER (6631 MILWAUKEE AVENUE)
ST ANDREW LIFE CENTER (7000 NORTH NEWARK)
ST BENEDICT HOME FOR THE AGED (6930 W TOUHY AVENUE)
ST BENEDICT NURSING AND REHAB (6930 WEST TOUHY AVENUE)
STERLING MANOR (8555 MAYNARD)
Dialysis Facilities in Niles:
DAVITA - BIG OAKS DIALYSIS (5623 W. TOUHY AVENUE)
FMC - NILES (9371 MILWAUKEE AVE.)
Home Health Centers in Niles:
ALERT HOME HEALTH CARE, INC (8118 N MILWAUKEE AVENUE, STE 109)
HOMELAND HOME HEALTH PROVIDER, INC (7503 N MILWAUKEE AVE)
JAYRON HOME CARE, INC (5940 W TOUHY AVE, STE 310)
LIFE OPTIONS HEALTH SERVICES (5940 WEST TOUHY AVENUE, STE 210)
NURSE EXPERTS LLC (7605 N MILWAUKEE AVENUE)
SENIORS CHOICE HEALTHCARE, INC (7501 N MILWAUKEE RD, STE 104)
Amtrak stations near Niles:
3 miles: GLENVIEW (1116 DEPOT ST.) . Services: ticket office, fully wheelchair accessible, enclosed waiting area, public restrooms, public payphones, free short-term parking, free long-term parking, call for car rental service, taxi stand, public transit connection.
15 miles: CHICAGO (225 S. CANAL ST.) . Services: ticket office, partially wheelchair accessible, enclosed waiting area, public restrooms, public payphones, snack bar, paid short-term parking, paid long-term parking, call for car rental service, taxi stand, public transit connection.
16 miles: LA GRANGE ROAD (LA GRANGE, 25 W. BURLINGTON AVE.) . Services: enclosed waiting area, public payphones, taxi stand, public transit connection.
NILES PUBLIC LIBRARY DISTRICT (Operating income: $7,302,047; Location: 6960 OAKTON STREET; 216,435 books; 15,585 audio materials; 17,355 video materials; 30 local licensed databases; 17 state licensed databases; 1 other licensed databases; 414 print serial subscriptions; 4 electronic serial subscriptions)
User-submitted facts and corrections:
Belden Regular Baptist Church IN NILES IL no longer exists by this name and is now a satellite congregation of a larger Church.
CHURCHES IN NILES :FIRST BAPTIST CHURCH OF NILES 7339 WAUKEGAN ROAD NILES IL 60714
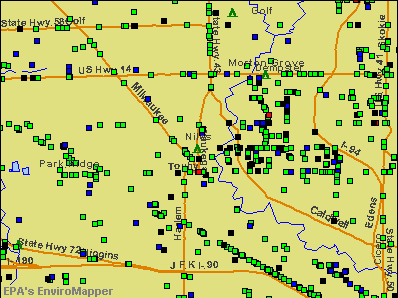
Notable locations in Niles: Niles Village Hall (A), Niles Public Library (B), Niles Fire Department Station 3 (C), Niles Fire Department Station 2 (D). Display/hide their locations on the map
Shopping Centers: Civic Center Plaza Shopping Center (1), Dempster Plaza Shopping Center (2), Four Flags Shopping Center (3), Golf Glen Shopping Center (4), Golf - Milwaukee Plaza Shopping Center (5), Millbrook Shopping Center (6), Super City Shopping Center (7), Golf Mill Shopping Center (8). Display/hide their locations on the map
Churches in Niles include: Belden Regular Baptist Church (A), Saint Michaels Orthodox Carpatho Russian Church (B), Niles Community Church (C), Our Lady of Ransom Church (D), Saint Isaac Joques Church (E), Saint John Brebeuf Church (F), Saint Matthew Lutheran Church (G). Display/hide their locations on the map
Cemeteries: Beth Jacob Cemetery (1), Maryhill Cemetery (2), Saint Adelbert Cemetery (3), Saint Matthews Cemetery (4). Display/hide their locations on the map
Parks in Niles include: Oak Park (1), Rugen Park (2), Jozwiak Park (3), Notre Dame Park (4), Jonquil Terrace Park (5), Kathy - Western Park (6), Nelson School Park (7), Oakton Manor Park (8), Recreational Center Park (9). Display/hide their locations on the map
Hotels: Days Inn-Niles-Skokie (6450 West Touhy Avenue), Eccono Motel (7139 North Milwaukee Avenue).
Birthplace of: Agnes Zawadzki - Figure skater, Jim Les - Basketball player-coach, Sead Odzic - College basketball player (USC Trojans), Will Schober - College basketball player (Army Black Knights).
Cook County has a predicted average indoor radon screening level between 2 and 4 pCi/L (pico curies per liter) - Moderate Potential
Drinking water stations with addresses in Niles and their reported violations in the past:
MIDWAY DRIVE INN (Population served: 25, Groundwater):
Past monitoring violations:
One routine major monitoring violation
Average household size:
This village:
2.4 people
Illinois:
2.6 people
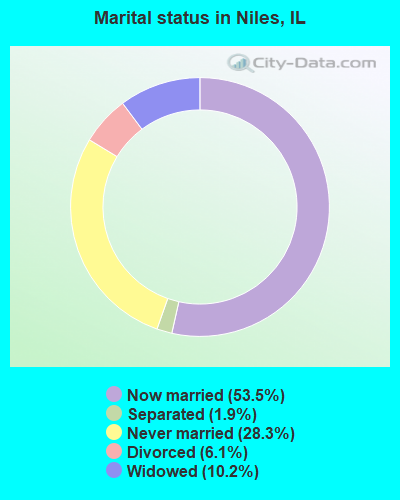
Percentage of family households:
This village:
64.3%
Whole state:
65.8%
Percentage of households with unmarried partners:
This village:
2.7%
Whole state:
6.3%
Likely homosexual households (counted as self-reported same-sex unmarried-partner households)
Lesbian couples: 0.2% of all households
Gay men: 0.1% of all households
People in group quarters in Niles in 2010:
1,100 people in nursing facilities/skilled-nursing facilities
11 people in group homes intended for adults
7 people in other noninstitutional facilities
People in group quarters in Niles in 2000:
1,163 people in nursing homes
145 people in other nonhousehold living situations
30 people in homes for the mentally retarded
12 people in religious group quarters
Banks with most branches in Niles (2011 data):
JPMorgan Chase Bank, National Association: Niles - Four Flaggs Center Branch, Niles Dempster Banking Center Branch, Niles Branch. Info updated 2011/11/10: Bank assets: $1,811,678.0 mil, Deposits: $1,190,738.0 mil, headquarters in Columbus, OH, positive income, International Specialization, 5577 total offices, Holding Company: Jpmorgan Chase & Co.
PNC Bank, National Association: Golf Mill Branch at 9101 North Greenwood Avenue, branch established on 1961/07/01; Niles Branch at 8990 N Milwaukee, branch established on 2003/07/24. Info updated 2012/03/20: Bank assets: $263,309.6 mil, Deposits: $197,343.0 mil, headquarters in Wilmington, DE, positive income, Commercial Lending Specialization, 3085 total offices, Holding Company: Pnc Financial Services Group, Inc., The
The Foster Bank: H Mart Branch at 801 Civic Center Drive, Ste. 155, branch established on 2006/08/25; Golf Mill Branch at 8504a W. Golf Road, branch established on 1996/05/28. Info updated 2010/11/16: Bank assets: $468.2 mil, Deposits: $368.2 mil, headquarters in Chicago, IL, negative income in the last year, Commercial Lending Specialization, 10 total offices, Holding Company: Foster Bankshares, Inc.
TCF National Bank: Niles Branch #2072 at 7759 North Milwaukee Avenue, branch established on 1928/01/01; West Touhy Jewel Branch #2245 at 5667 West Touhy Avenue, branch established on 1997/03/06. Info updated 2009/11/23: Bank assets: $19,007.0 mil, Deposits: $12,377.0 mil, headquarters in Sioux Falls, SD, positive income, Commercial Lending Specialization, 441 total offices, Holding Company: Tcf Financial Corporation
Fifth Third Bank: Niles - Oakton Branch at 7100 Oakton Street, branch established on 1960/11/04; Niles Branch at 5950 West Touhy Avenue, branch established on 1994/11/10. Info updated 2009/10/05: Bank assets: $114,540.4 mil, Deposits: $89,689.1 mil, headquarters in Cincinnati, OH, positive income, Commercial Lending Specialization, 1378 total offices, Holding Company: Fifth Third Bancorp
Citibank, National Association: Niles Branch at 8400 West Dempster Street, branch established on 1933/01/01. Info updated 2012/01/10: Bank assets: $1,288,658.0 mil, Deposits: $882,541.0 mil, headquarters in Sioux Falls, SD, positive income, International Specialization, 1048 total offices, Holding Company: Citigroup Inc.
U.S. Bank National Association: Niles Branch at 8500 West Dempster Street, branch established on 1973/09/04. Info updated 2012/01/30: Bank assets: $330,470.8 mil, Deposits: $236,091.5 mil, headquarters in Cincinnati, OH, positive income, 3121 total offices, Holding Company: U.S. Bancorp
BMO Harris Bank National Association: West Dempster Branch at 7077 West Dempster, branch established on 1945/01/01. Info updated 2011/07/14: Bank assets: $97,264.0 mil, Deposits: $75,624.6 mil, headquarters in Chicago, IL, positive income, 717 total offices, Holding Company: Bank Of Montreal
Bank of America, National Association: Niles/Greenwood Branch at 8950 Greenwood Avenue, branch established on 1994/02/10. Info updated 2009/11/18: Bank assets: $1,451,969.3 mil, Deposits: $1,077,176.8 mil, headquarters in Charlotte, NC, positive income, 5782 total offices, Holding Company: Bank Of America Corporation
Religion statistics for Niles, IL (based on Cook County data)
Religion
Adherents
Congregations
Catholic
1,947,223
376
Evangelical Protestant
432,975
1,484
Other
312,636
403
Mainline Protestant
202,114
630
Black Protestant
148,895
395
Orthodox
53,276
66
None
2,097,556
-
Source: Clifford Grammich, Kirk Hadaway, Richard Houseal, Dale E.Jones, Alexei Krindatch, Richie Stanley and Richard H.Taylor. 2012. 2010 U.S.Religion Census: Religious Congregations & Membership Study. Association of Statisticians of American Religious Bodies. Jones, Dale E., et al. 2002. Congregations and Membership in the United States 2000. Nashville, TN: Glenmary Research Center. Graphs represent county-level data
FAA Registered Aircraft Manufacturers and Dealers:
1
RTL ENTERPRISES INC, 5675 W Howard St, Niles, IL 60714 Certificate: D001755 (Corporation), Certificate Issue Date: 11/02/2006, Expiration Date: 11/01/2007
FAA Registered Aircraft:
2
Aircraft: BALLOON WORKS FIREFLY 7-15 (Category: Land, Weight: Up to 12,499 Pounds), Engine: None N-Number: 830AL, N830AL, N-830AL, Serial Number: F71028, Year manufactured: 1997, Airworthiness Date: 09/30/1997, Certificate Issue Date: 04/09/1998 Registrant (Individual): Alan Wayne Zielinski, 7640 N Milwaukee Ave, Niles, IL 60714 Deregistered:Cancel Date: 04/07/1998
Aircraft: BIURO PROJEKTOWE B BOGUMIL BER SZD-56-2 DIANA-2 (Category: Land, Weight: Up to 12,499 Pounds), Engine: None N-Number: 556DS, N556DS, N-556DS, Serial Number: 562105001, Year manufactured: 2005, Airworthiness Date: 04/05/2006, Certificate Issue Date: 03/13/2006 Registrant (Individual): Jerry Zieba, 8051 N Wisner St, Niles, IL 60714 Deregistered:Cancel Date: 06/18/2018, Exported to: Poland
Home Mortgage Disclosure Act Aggregated Statistics For Year 2009 (Based on 3 full and 6 partial tracts)
A) FHA, FSA/RHS & VA Home Purchase Loans
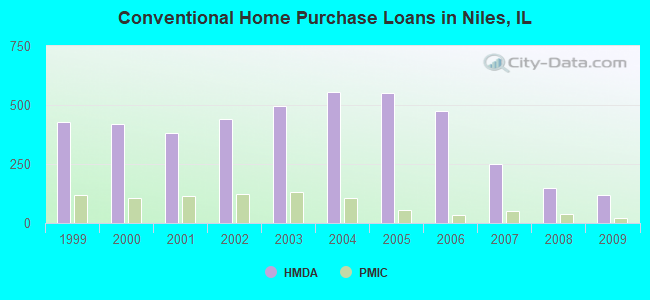
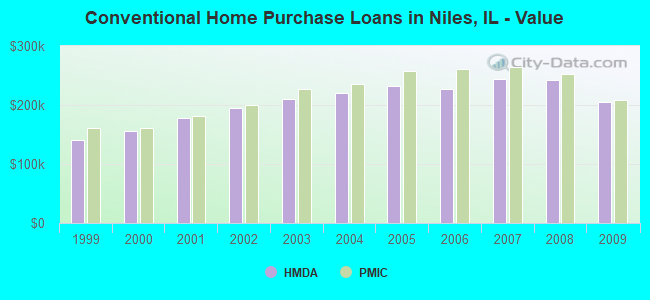
B) Conventional Home Purchase Loans
C) Refinancings
D) Home Improvement Loans
E) Loans on Dwellings For 5+ Families
F) Non-occupant Loans on < 5 Family Dwellings (A B C & D)
Number
Average Value
Number
Average Value
Number
Average Value
Number
Average Value
Number
Average Value
Number
Average Value
LOANS ORIGINATED
36
$224,956
119
$204,735
596
$233,670
7
$91,514
1
$540,310
19
$187,624
APPLICATIONS APPROVED, NOT ACCEPTED
2
$209,500
9
$233,854
66
$250,366
4
$80,992
0
$0
1
$297,340
APPLICATIONS DENIED
15
$243,448
26
$258,453
212
$270,916
8
$66,801
1
$1,928,910
5
$172,792
APPLICATIONS WITHDRAWN
2
$139,765
11
$233,557
93
$240,585
1
$219,740
0
$0
6
$207,193
FILES CLOSED FOR INCOMPLETENESS
6
$212,270
6
$268,617
37
$255,582
1
$203,790
0
$0
3
$131,083
Aggregated Statistics For Year 2008 (Based on 3 full and 6 partial tracts)
A) FHA, FSA/RHS & VA Home Purchase Loans
B) Conventional Home Purchase Loans
C) Refinancings
D) Home Improvement Loans
E) Loans on Dwellings For 5+ Families
F) Non-occupant Loans on < 5 Family Dwellings (A B C & D)
G) Loans On Manufactured Home Dwelling (A B C & D)
Number
Average Value
Number
Average Value
Number
Average Value
Number
Average Value
Number
Average Value
Number
Average Value
Number
Average Value
LOANS ORIGINATED
23
$245,382
148
$241,896
448
$250,548
25
$117,431
3
$762,437
23
$194,155
0
$0
APPLICATIONS APPROVED, NOT ACCEPTED
2
$297,635
16
$221,709
88
$262,055
5
$184,548
0
$0
4
$194,322
0
$0
APPLICATIONS DENIED
5
$250,994
34
$284,011
209
$295,666
22
$207,480
1
$838,960
16
$304,606
1
$42,600
APPLICATIONS WITHDRAWN
1
$283,820
19
$254,101
82
$264,937
8
$83,185
0
$0
1
$370,260
0
$0
FILES CLOSED FOR INCOMPLETENESS
1
$157,750
7
$294,017
33
$237,713
5
$39,408
0
$0
0
$0
0
$0
Aggregated Statistics For Year 2007 (Based on 3 full and 6 partial tracts)
A) FHA, FSA/RHS & VA Home Purchase Loans
B) Conventional Home Purchase Loans
C) Refinancings
D) Home Improvement Loans
E) Loans on Dwellings For 5+ Families
F) Non-occupant Loans on < 5 Family Dwellings (A B C & D)
G) Loans On Manufactured Home Dwelling (A B C & D)
Number
Average Value
Number
Average Value
Number
Average Value
Number
Average Value
Number
Average Value
Number
Average Value
Number
Average Value
LOANS ORIGINATED
1
$253,470
252
$244,411
601
$263,893
56
$160,427
4
$405,682
42
$207,319
0
$0
APPLICATIONS APPROVED, NOT ACCEPTED
0
$0
35
$236,411
110
$258,268
9
$95,321
1
$397,440
4
$232,750
0
$0
APPLICATIONS DENIED
0
$0
56
$312,624
264
$288,681
50
$165,282
1
$723,970
15
$245,824
1
$23,820
APPLICATIONS WITHDRAWN
0
$0
27
$277,123
95
$300,192
8
$209,979
1
$479,330
4
$313,175
0
$0
FILES CLOSED FOR INCOMPLETENESS
0
$0
23
$243,834
51
$303,533
1
$295,000
0
$0
3
$187,963
0
$0
Aggregated Statistics For Year 2006 (Based on 3 full and 6 partial tracts)
A) FHA, FSA/RHS & VA Home Purchase Loans
B) Conventional Home Purchase Loans
C) Refinancings
D) Home Improvement Loans
E) Loans on Dwellings For 5+ Families
F) Non-occupant Loans on < 5 Family Dwellings (A B C & D)
G) Loans On Manufactured Home Dwelling (A B C & D)
Number
Average Value
Number
Average Value
Number
Average Value
Number
Average Value
Number
Average Value
Number
Average Value
Number
Average Value
LOANS ORIGINATED
1
$146,020
473
$227,946
636
$254,250
58
$141,602
9
$554,961
57
$216,222
2
$61,080
APPLICATIONS APPROVED, NOT ACCEPTED
0
$0
78
$265,623
103
$240,760
10
$146,885
0
$0
9
$301,349
0
$0
APPLICATIONS DENIED
0
$0
132
$213,980
236
$271,037
40
$99,471
0
$0
12
$206,234
2
$28,940
APPLICATIONS WITHDRAWN
0
$0
50
$230,225
129
$266,753
6
$206,913
0
$0
7
$254,664
0
$0
FILES CLOSED FOR INCOMPLETENESS
0
$0
10
$241,880
58
$257,958
4
$118,580
0
$0
3
$299,130
0
$0
Aggregated Statistics For Year 2005 (Based on 3 full and 6 partial tracts)
A) FHA, FSA/RHS & VA Home Purchase Loans
B) Conventional Home Purchase Loans
C) Refinancings
D) Home Improvement Loans
E) Loans on Dwellings For 5+ Families
F) Non-occupant Loans on < 5 Family Dwellings (A B C & D)
G) Loans On Manufactured Home Dwelling (A B C & D)
Number
Average Value
Number
Average Value
Number
Average Value
Number
Average Value
Number
Average Value
Number
Average Value
Number
Average Value
LOANS ORIGINATED
0
$0
552
$231,603
727
$229,405
73
$145,754
4
$381,905
76
$221,300
1
$53,700
APPLICATIONS APPROVED, NOT ACCEPTED
1
$331,540
68
$211,438
98
$231,316
10
$147,097
0
$0
8
$194,965
0
$0
APPLICATIONS DENIED
0
$0
117
$226,648
269
$243,634
39
$113,198
0
$0
16
$196,666
0
$0
APPLICATIONS WITHDRAWN
0
$0
54
$207,906
182
$246,052
14
$197,814
7
$442,759
15
$209,873
0
$0
FILES CLOSED FOR INCOMPLETENESS
0
$0
17
$276,338
29
$224,865
2
$85,700
0
$0
1
$383,030
0
$0
Aggregated Statistics For Year 2004 (Based on 3 full and 6 partial tracts)
A) FHA, FSA/RHS & VA Home Purchase Loans
B) Conventional Home Purchase Loans
C) Refinancings
D) Home Improvement Loans
E) Loans on Dwellings For 5+ Families
F) Non-occupant Loans on < 5 Family Dwellings (A B C & D)
G) Loans On Manufactured Home Dwelling (A B C & D)
Number
Average Value
Number
Average Value
Number
Average Value
Number
Average Value
Number
Average Value
Number
Average Value
Number
Average Value
LOANS ORIGINATED
0
$0
557
$219,693
787
$208,240
57
$120,701
10
$8,455,028
47
$187,684
3
$43,747
APPLICATIONS APPROVED, NOT ACCEPTED
1
$106,700
65
$198,507
98
$213,571
13
$80,085
0
$0
5
$155,908
0
$0
APPLICATIONS DENIED
2
$142,995
83
$207,328
211
$230,518
33
$87,119
0
$0
12
$222,618
0
$0
APPLICATIONS WITHDRAWN
1
$170,780
55
$221,972
182
$240,111
14
$125,154
1
$491,040
9
$209,842
0
$0
FILES CLOSED FOR INCOMPLETENESS
0
$0
20
$213,740
71
$238,895
3
$68,697
0
$0
6
$213,625
0
$0
Aggregated Statistics For Year 2003 (Based on 3 full and 6 partial tracts)
A) FHA, FSA/RHS & VA Home Purchase Loans
B) Conventional Home Purchase Loans
C) Refinancings
D) Home Improvement Loans
E) Loans on Dwellings For 5+ Families
F) Non-occupant Loans on < 5 Family Dwellings (A B C & D)
Number
Average Value
Number
Average Value
Number
Average Value
Number
Average Value
Number
Average Value
Number
Average Value
LOANS ORIGINATED
10
$202,071
494
$211,001
1,759
$173,167
48
$73,750
11
$491,217
59
$155,635
APPLICATIONS APPROVED, NOT ACCEPTED
1
$159,610
51
$210,586
182
$171,024
9
$38,137
0
$0
11
$190,363
APPLICATIONS DENIED
0
$0
46
$244,871
268
$188,681
28
$43,521
0
$0
13
$231,781
APPLICATIONS WITHDRAWN
0
$0
38
$223,841
189
$191,546
8
$61,049
1
$1,797,840
8
$172,765
FILES CLOSED FOR INCOMPLETENESS
0
$0
12
$255,996
46
$251,659
1
$70,930
0
$0
4
$136,108
Aggregated Statistics For Year 2002 (Based on 3 full and 6 partial tracts)
A) FHA, FSA/RHS & VA Home Purchase Loans
B) Conventional Home Purchase Loans
C) Refinancings
D) Home Improvement Loans
E) Loans on Dwellings For 5+ Families
F) Non-occupant Loans on < 5 Family Dwellings (A B C & D)
Number
Average Value
Number
Average Value
Number
Average Value
Number
Average Value
Number
Average Value
Number
Average Value
LOANS ORIGINATED
7
$193,324
441
$194,803
1,302
$164,205
33
$64,595
11
$637,897
47
$169,164
APPLICATIONS APPROVED, NOT ACCEPTED
1
$252,510
42
$211,012
173
$175,450
16
$37,566
0
$0
4
$200,872
APPLICATIONS DENIED
2
$200,230
49
$198,061
154
$172,345
29
$41,487
2
$334,580
8
$232,759
APPLICATIONS WITHDRAWN
1
$178,990
26
$220,603
116
$161,968
7
$50,306
2
$371,055
1
$226,790
FILES CLOSED FOR INCOMPLETENESS
0
$0
9
$232,809
74
$172,996
2
$27,420
0
$0
1
$169,820
Aggregated Statistics For Year 2001 (Based on 3 full and 6 partial tracts)
A) FHA, FSA/RHS & VA Home Purchase Loans
B) Conventional Home Purchase Loans
C) Refinancings
D) Home Improvement Loans
E) Loans on Dwellings For 5+ Families
F) Non-occupant Loans on < 5 Family Dwellings (A B C & D)
Number
Average Value
Number
Average Value
Number
Average Value
Number
Average Value
Number
Average Value
Number
Average Value
LOANS ORIGINATED
10
$166,206
380
$177,908
962
$155,352
57
$41,388
25
$505,884
24
$159,134
APPLICATIONS APPROVED, NOT ACCEPTED
1
$104,280
30
$200,268
101
$139,567
20
$51,335
2
$630,720
5
$121,466
APPLICATIONS DENIED
1
$82,800
26
$237,728
163
$152,697
36
$47,793
0
$0
5
$132,300
APPLICATIONS WITHDRAWN
2
$235,810
15
$200,835
113
$147,980
15
$35,989
1
$356,510
4
$149,878
FILES CLOSED FOR INCOMPLETENESS
0
$0
6
$155,278
51
$139,517
4
$42,038
0
$0
2
$100,590
Aggregated Statistics For Year 2000 (Based on 3 full and 6 partial tracts)
A) FHA, FSA/RHS & VA Home Purchase Loans
B) Conventional Home Purchase Loans
C) Refinancings
D) Home Improvement Loans
E) Loans on Dwellings For 5+ Families
F) Non-occupant Loans on < 5 Family Dwellings (A B C & D)
Number
Average Value
Number
Average Value
Number
Average Value
Number
Average Value
Number
Average Value
Number
Average Value
LOANS ORIGINATED
18
$150,417
419
$155,534
228
$129,206
52
$54,634
11
$576,203
24
$127,480
APPLICATIONS APPROVED, NOT ACCEPTED
2
$153,350
31
$169,908
40
$111,054
21
$45,401
0
$0
1
$239,840
APPLICATIONS DENIED
4
$140,835
40
$152,794
102
$117,809
32
$47,401
1
$754,520
1
$71,510
APPLICATIONS WITHDRAWN
1
$74,900
27
$158,928
62
$91,869
12
$34,432
1
$7,484,960
2
$103,015
FILES CLOSED FOR INCOMPLETENESS
0
$0
5
$166,632
32
$171,110
4
$38,652
0
$0
0
$0
Aggregated Statistics For Year 1999 (Based on 4 full and 4 partial tracts)
A) FHA, FSA/RHS & VA Home Purchase Loans
B) Conventional Home Purchase Loans
C) Refinancings
D) Home Improvement Loans
E) Loans on Dwellings For 5+ Families
F) Non-occupant Loans on < 5 Family Dwellings (A B C & D)
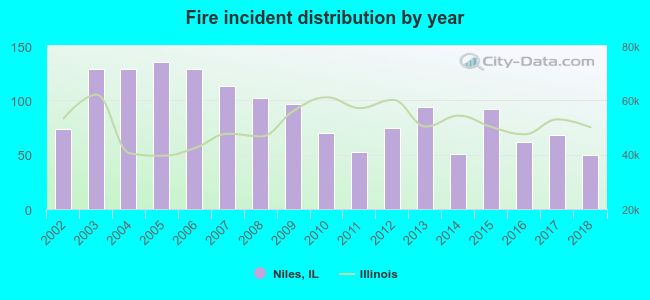
2002 - 2018 National Fire Incident Reporting System (NFIRS) incidents
According to the data from the years 2002 - 2018 the average number of fire incidents per year is 90. The highest number of reported fires - 135 took place in 2005, and the least - 50 in 2018. The data has a declining trend.
When looking into fire subcategories, the most incidents belonged to: Structure Fires (54.5%), and Outside Fires (28.4%).
Fire incident types reported to NFIRS in Niles, IL


 Recent articles from our blog. Our writers, many of them Ph.D. graduates or candidates, create easy-to-read articles on a wide variety of topics.

 (4.0 miles


 According to the data from the years 2002 - 2018 the average number of fire incidents per year is 90. The highest number of reported fires - 135 took place in 2005, and the least - 50 in 2018. The data has a declining trend.
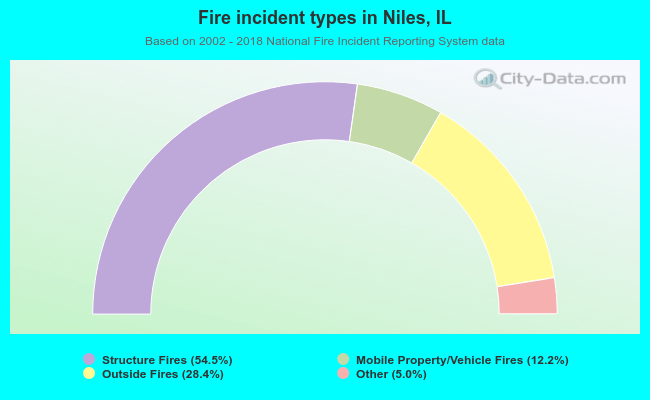 When looking into fire subcategories, the most incidents belonged to: Structure Fires (54.5%), and Outside Fires (28.4%).