Park Ridge, Illinois Submit your own pictures of this city and show them to the world
OSM Map
General Map
Google Map
MSN Map
OSM Map
General Map
Google Map
MSN Map
OSM Map
General Map
Google Map
MSN Map
OSM Map
General Map
Google Map
MSN Map
Please wait while loading the map...
Population in 2022: 38,278 (100% urban, 0% rural). Population change since 2000: +1.3%Males: 19,064 Females: 19,214
March 2022 cost of living index in Park Ridge: 102.8 (near average, U.S. average is 100) Percentage of residents living in poverty in 2022: 4.3%for White Non-Hispanic residents , 8.1% for Black residents , 6.2% for Hispanic or Latino residents , 3.6% for other race residents , 4.8% for two or more races residents )
Profiles of local businesses
Business Search - 14 Million verified businesses
Data:
Median household income ($)
Median household income (% change since 2000)
Household income diversity
Ratio of average income to average house value (%)
Ratio of average income to average rent
Median household income ($) - White
Median household income ($) - Black or African American
Median household income ($) - Asian
Median household income ($) - Hispanic or Latino
Median household income ($) - American Indian and Alaska Native
Median household income ($) - Multirace
Median household income ($) - Other Race
Median household income for houses/condos with a mortgage ($)
Median household income for apartments without a mortgage ($)
Races - White alone (%)
Races - White alone (% change since 2000)
Races - Black alone (%)
Races - Black alone (% change since 2000)
Races - American Indian alone (%)
Races - American Indian alone (% change since 2000)
Races - Asian alone (%)
Races - Asian alone (% change since 2000)
Races - Hispanic (%)
Races - Hispanic (% change since 2000)
Races - Native Hawaiian and Other Pacific Islander alone (%)
Races - Native Hawaiian and Other Pacific Islander alone (% change since 2000)
Races - Two or more races (%)
Races - Two or more races (% change since 2000)
Races - Other race alone (%)
Races - Other race alone (% change since 2000)
Racial diversity
Unemployment (%)
Unemployment (% change since 2000)
Unemployment (%) - White
Unemployment (%) - Black or African American
Unemployment (%) - Asian
Unemployment (%) - Hispanic or Latino
Unemployment (%) - American Indian and Alaska Native
Unemployment (%) - Multirace
Unemployment (%) - Other Race
Population density (people per square mile)
Population - Males (%)
Population - Females (%)
Population - Males (%) - White
Population - Males (%) - Black or African American
Population - Males (%) - Asian
Population - Males (%) - Hispanic or Latino
Population - Males (%) - American Indian and Alaska Native
Population - Males (%) - Multirace
Population - Males (%) - Other Race
Population - Females (%) - White
Population - Females (%) - Black or African American
Population - Females (%) - Asian
Population - Females (%) - Hispanic or Latino
Population - Females (%) - American Indian and Alaska Native
Population - Females (%) - Multirace
Population - Females (%) - Other Race
Coronavirus confirmed cases (Apr 26, 2024)
Deaths caused by coronavirus (Apr 26, 2024)
Coronavirus confirmed cases (per 100k population) (Apr 26, 2024)
Deaths caused by coronavirus (per 100k population) (Apr 26, 2024)
Daily increase in number of cases (Apr 26, 2024)
Weekly increase in number of cases (Apr 26, 2024)
Cases doubled (in days) (Apr 26, 2024)
Hospitalized patients (Apr 18, 2022)
Negative test results (Apr 18, 2022)
Total test results (Apr 18, 2022)
COVID Vaccine doses distributed (per 100k population) (Sep 19, 2023)
COVID Vaccine doses administered (per 100k population) (Sep 19, 2023)
COVID Vaccine doses distributed (Sep 19, 2023)
COVID Vaccine doses administered (Sep 19, 2023)
Likely homosexual households (%)
Likely homosexual households (% change since 2000)
Likely homosexual households - Lesbian couples (%)
Likely homosexual households - Lesbian couples (% change since 2000)
Likely homosexual households - Gay men (%)
Likely homosexual households - Gay men (% change since 2000)
Cost of living index
Median gross rent ($)
Median contract rent ($)
Median monthly housing costs ($)
Median house or condo value ($)
Median house or condo value ($ change since 2000)
Mean house or condo value by units in structure - 1, detached ($)
Mean house or condo value by units in structure - 1, attached ($)
Mean house or condo value by units in structure - 2 ($)
Mean house or condo value by units in structure by units in structure - 3 or 4 ($)
Mean house or condo value by units in structure - 5 or more ($)
Mean house or condo value by units in structure - Boat, RV, van, etc. ($)
Mean house or condo value by units in structure - Mobile home ($)
Median house or condo value ($) - White
Median house or condo value ($) - Black or African American
Median house or condo value ($) - Asian
Median house or condo value ($) - Hispanic or Latino
Median house or condo value ($) - American Indian and Alaska Native
Median house or condo value ($) - Multirace
Median house or condo value ($) - Other Race
Median resident age
Resident age diversity
Median resident age - Males
Median resident age - Females
Median resident age - White
Median resident age - Black or African American
Median resident age - Asian
Median resident age - Hispanic or Latino
Median resident age - American Indian and Alaska Native
Median resident age - Multirace
Median resident age - Other Race
Median resident age - Males - White
Median resident age - Males - Black or African American
Median resident age - Males - Asian
Median resident age - Males - Hispanic or Latino
Median resident age - Males - American Indian and Alaska Native
Median resident age - Males - Multirace
Median resident age - Males - Other Race
Median resident age - Females - White
Median resident age - Females - Black or African American
Median resident age - Females - Asian
Median resident age - Females - Hispanic or Latino
Median resident age - Females - American Indian and Alaska Native
Median resident age - Females - Multirace
Median resident age - Females - Other Race
Commute - mean travel time to work (minutes)
Travel time to work - Less than 5 minutes (%)
Travel time to work - Less than 5 minutes (% change since 2000)
Travel time to work - 5 to 9 minutes (%)
Travel time to work - 5 to 9 minutes (% change since 2000)
Travel time to work - 10 to 19 minutes (%)
Travel time to work - 10 to 19 minutes (% change since 2000)
Travel time to work - 20 to 29 minutes (%)
Travel time to work - 20 to 29 minutes (% change since 2000)
Travel time to work - 30 to 39 minutes (%)
Travel time to work - 30 to 39 minutes (% change since 2000)
Travel time to work - 40 to 59 minutes (%)
Travel time to work - 40 to 59 minutes (% change since 2000)
Travel time to work - 60 to 89 minutes (%)
Travel time to work - 60 to 89 minutes (% change since 2000)
Travel time to work - 90 or more minutes (%)
Travel time to work - 90 or more minutes (% change since 2000)
Marital status - Never married (%)
Marital status - Now married (%)
Marital status - Separated (%)
Marital status - Widowed (%)
Marital status - Divorced (%)
Median family income ($)
Median family income (% change since 2000)
Median non-family income ($)
Median non-family income (% change since 2000)
Median per capita income ($)
Median per capita income (% change since 2000)
Median family income ($) - White
Median family income ($) - Black or African American
Median family income ($) - Asian
Median family income ($) - Hispanic or Latino
Median family income ($) - American Indian and Alaska Native
Median family income ($) - Multirace
Median family income ($) - Other Race
Median year house/condo built
Median year apartment built
Year house built - Built 2005 or later (%)
Year house built - Built 2000 to 2004 (%)
Year house built - Built 1990 to 1999 (%)
Year house built - Built 1980 to 1989 (%)
Year house built - Built 1970 to 1979 (%)
Year house built - Built 1960 to 1969 (%)
Year house built - Built 1950 to 1959 (%)
Year house built - Built 1940 to 1949 (%)
Year house built - Built 1939 or earlier (%)
Average household size
Household density (households per square mile)
Average household size - White
Average household size - Black or African American
Average household size - Asian
Average household size - Hispanic or Latino
Average household size - American Indian and Alaska Native
Average household size - Multirace
Average household size - Other Race
Occupied housing units (%)
Vacant housing units (%)
Owner occupied housing units (%)
Renter occupied housing units (%)
Vacancy status - For rent (%)
Vacancy status - For sale only (%)
Vacancy status - Rented or sold, not occupied (%)
Vacancy status - For seasonal, recreational, or occasional use (%)
Vacancy status - For migrant workers (%)
Vacancy status - Other vacant (%)
Residents with income below the poverty level (%)
Residents with income below 50% of the poverty level (%)
Children below poverty level (%)
Poor families by family type - Married-couple family (%)
Poor families by family type - Male, no wife present (%)
Poor families by family type - Female, no husband present (%)
Poverty status for native-born residents (%)
Poverty status for foreign-born residents (%)
Poverty among high school graduates not in families (%)
Poverty among people who did not graduate high school not in families (%)
Residents with income below the poverty level (%) - White
Residents with income below the poverty level (%) - Black or African American
Residents with income below the poverty level (%) - Asian
Residents with income below the poverty level (%) - Hispanic or Latino
Residents with income below the poverty level (%) - American Indian and Alaska Native
Residents with income below the poverty level (%) - Multirace
Residents with income below the poverty level (%) - Other Race
Air pollution - Air Quality Index (AQI)
Air pollution - CO
Air pollution - NO2
Air pollution - SO2
Air pollution - Ozone
Air pollution - PM10
Air pollution - PM25
Air pollution - Pb
Crime - Murders per 100,000 population
Crime - Rapes per 100,000 population
Crime - Robberies per 100,000 population
Crime - Assaults per 100,000 population
Crime - Burglaries per 100,000 population
Crime - Thefts per 100,000 population
Crime - Auto thefts per 100,000 population
Crime - Arson per 100,000 population
Crime - City-data.com crime index
Crime - Violent crime index
Crime - Property crime index
Crime - Murders per 100,000 population (5 year average)
Crime - Rapes per 100,000 population (5 year average)
Crime - Robberies per 100,000 population (5 year average)
Crime - Assaults per 100,000 population (5 year average)
Crime - Burglaries per 100,000 population (5 year average)
Crime - Thefts per 100,000 population (5 year average)
Crime - Auto thefts per 100,000 population (5 year average)
Crime - Arson per 100,000 population (5 year average)
Crime - City-data.com crime index (5 year average)
Crime - Violent crime index (5 year average)
Crime - Property crime index (5 year average)
1996 Presidential Elections Results (%) - Democratic Party (Clinton)
1996 Presidential Elections Results (%) - Republican Party (Dole)
1996 Presidential Elections Results (%) - Other
2000 Presidential Elections Results (%) - Democratic Party (Gore)
2000 Presidential Elections Results (%) - Republican Party (Bush)
2000 Presidential Elections Results (%) - Other
2004 Presidential Elections Results (%) - Democratic Party (Kerry)
2004 Presidential Elections Results (%) - Republican Party (Bush)
2004 Presidential Elections Results (%) - Other
2008 Presidential Elections Results (%) - Democratic Party (Obama)
2008 Presidential Elections Results (%) - Republican Party (McCain)
2008 Presidential Elections Results (%) - Other
2012 Presidential Elections Results (%) - Democratic Party (Obama)
2012 Presidential Elections Results (%) - Republican Party (Romney)
2012 Presidential Elections Results (%) - Other
2016 Presidential Elections Results (%) - Democratic Party (Clinton)
2016 Presidential Elections Results (%) - Republican Party (Trump)
2016 Presidential Elections Results (%) - Other
2020 Presidential Elections Results (%) - Democratic Party (Biden)
2020 Presidential Elections Results (%) - Republican Party (Trump)
2020 Presidential Elections Results (%) - Other
Ancestries Reported - Arab (%)
Ancestries Reported - Czech (%)
Ancestries Reported - Danish (%)
Ancestries Reported - Dutch (%)
Ancestries Reported - English (%)
Ancestries Reported - French (%)
Ancestries Reported - French Canadian (%)
Ancestries Reported - German (%)
Ancestries Reported - Greek (%)
Ancestries Reported - Hungarian (%)
Ancestries Reported - Irish (%)
Ancestries Reported - Italian (%)
Ancestries Reported - Lithuanian (%)
Ancestries Reported - Norwegian (%)
Ancestries Reported - Polish (%)
Ancestries Reported - Portuguese (%)
Ancestries Reported - Russian (%)
Ancestries Reported - Scotch-Irish (%)
Ancestries Reported - Scottish (%)
Ancestries Reported - Slovak (%)
Ancestries Reported - Subsaharan African (%)
Ancestries Reported - Swedish (%)
Ancestries Reported - Swiss (%)
Ancestries Reported - Ukrainian (%)
Ancestries Reported - United States (%)
Ancestries Reported - Welsh (%)
Ancestries Reported - West Indian (%)
Ancestries Reported - Other (%)
Educational Attainment - No schooling completed (%)
Educational Attainment - Less than high school (%)
Educational Attainment - High school or equivalent (%)
Educational Attainment - Less than 1 year of college (%)
Educational Attainment - 1 or more years of college (%)
Educational Attainment - Associate degree (%)
Educational Attainment - Bachelor's degree (%)
Educational Attainment - Master's degree (%)
Educational Attainment - Professional school degree (%)
Educational Attainment - Doctorate degree (%)
School Enrollment - Nursery, preschool (%)
School Enrollment - Kindergarten (%)
School Enrollment - Grade 1 to 4 (%)
School Enrollment - Grade 5 to 8 (%)
School Enrollment - Grade 9 to 12 (%)
School Enrollment - College undergrad (%)
School Enrollment - Graduate or professional (%)
School Enrollment - Not enrolled in school (%)
School enrollment - Public schools (%)
School enrollment - Private schools (%)
School enrollment - Not enrolled (%)
Median number of rooms in houses and condos
Median number of rooms in apartments
Housing units lacking complete plumbing facilities (%)
Housing units lacking complete kitchen facilities (%)
Density of houses
Urban houses (%)
Rural houses (%)
Households with people 60 years and over (%)
Households with people 65 years and over (%)
Households with people 75 years and over (%)
Households with one or more nonrelatives (%)
Households with no nonrelatives (%)
Population in households (%)
Family households (%)
Nonfamily households (%)
Population in families (%)
Family households with own children (%)
Median number of bedrooms in owner occupied houses
Mean number of bedrooms in owner occupied houses
Median number of bedrooms in renter occupied houses
Mean number of bedrooms in renter occupied houses
Median number of vehichles in owner occupied houses
Mean number of vehichles in owner occupied houses
Median number of vehichles in renter occupied houses
Mean number of vehichles in renter occupied houses
Mortgage status - with mortgage (%)
Mortgage status - with second mortgage (%)
Mortgage status - with home equity loan (%)
Mortgage status - with both second mortgage and home equity loan (%)
Mortgage status - without a mortgage (%)
Average family size
Average family size - White
Average family size - Black or African American
Average family size - Asian
Average family size - Hispanic or Latino
Average family size - American Indian and Alaska Native
Average family size - Multirace
Average family size - Other Race
Geographical mobility - Same house 1 year ago (%)
Geographical mobility - Moved within same county (%)
Geographical mobility - Moved from different county within same state (%)
Geographical mobility - Moved from different state (%)
Geographical mobility - Moved from abroad (%)
Place of birth - Born in state of residence (%)
Place of birth - Born in other state (%)
Place of birth - Native, outside of US (%)
Place of birth - Foreign born (%)
Housing units in structures - 1, detached (%)
Housing units in structures - 1, attached (%)
Housing units in structures - 2 (%)
Housing units in structures - 3 or 4 (%)
Housing units in structures - 5 to 9 (%)
Housing units in structures - 10 to 19 (%)
Housing units in structures - 20 to 49 (%)
Housing units in structures - 50 or more (%)
Housing units in structures - Mobile home (%)
Housing units in structures - Boat, RV, van, etc. (%)
House/condo owner moved in on average (years ago)
Renter moved in on average (years ago)
Year householder moved into unit - Moved in 1999 to March 2000 (%)
Year householder moved into unit - Moved in 1995 to 1998 (%)
Year householder moved into unit - Moved in 1990 to 1994 (%)
Year householder moved into unit - Moved in 1980 to 1989 (%)
Year householder moved into unit - Moved in 1970 to 1979 (%)
Year householder moved into unit - Moved in 1969 or earlier (%)
Means of transportation to work - Drove car alone (%)
Means of transportation to work - Carpooled (%)
Means of transportation to work - Public transportation (%)
Means of transportation to work - Bus or trolley bus (%)
Means of transportation to work - Streetcar or trolley car (%)
Means of transportation to work - Subway or elevated (%)
Means of transportation to work - Railroad (%)
Means of transportation to work - Ferryboat (%)
Means of transportation to work - Taxicab (%)
Means of transportation to work - Motorcycle (%)
Means of transportation to work - Bicycle (%)
Means of transportation to work - Walked (%)
Means of transportation to work - Other means (%)
Working at home (%)
Industry diversity
Most Common Industries - Agriculture, forestry, fishing and hunting, and mining (%)
Most Common Industries - Agriculture, forestry, fishing and hunting (%)
Most Common Industries - Mining, quarrying, and oil and gas extraction (%)
Most Common Industries - Construction (%)
Most Common Industries - Manufacturing (%)
Most Common Industries - Wholesale trade (%)
Most Common Industries - Retail trade (%)
Most Common Industries - Transportation and warehousing, and utilities (%)
Most Common Industries - Transportation and warehousing (%)
Most Common Industries - Utilities (%)
Most Common Industries - Information (%)
Most Common Industries - Finance and insurance, and real estate and rental and leasing (%)
Most Common Industries - Finance and insurance (%)
Most Common Industries - Real estate and rental and leasing (%)
Most Common Industries - Professional, scientific, and management, and administrative and waste management services (%)
Most Common Industries - Professional, scientific, and technical services (%)
Most Common Industries - Management of companies and enterprises (%)
Most Common Industries - Administrative and support and waste management services (%)
Most Common Industries - Educational services, and health care and social assistance (%)
Most Common Industries - Educational services (%)
Most Common Industries - Health care and social assistance (%)
Most Common Industries - Arts, entertainment, and recreation, and accommodation and food services (%)
Most Common Industries - Arts, entertainment, and recreation (%)
Most Common Industries - Accommodation and food services (%)
Most Common Industries - Other services, except public administration (%)
Most Common Industries - Public administration (%)
Occupation diversity
Most Common Occupations - Management, business, science, and arts occupations (%)
Most Common Occupations - Management, business, and financial occupations (%)
Most Common Occupations - Management occupations (%)
Most Common Occupations - Business and financial operations occupations (%)
Most Common Occupations - Computer, engineering, and science occupations (%)
Most Common Occupations - Computer and mathematical occupations (%)
Most Common Occupations - Architecture and engineering occupations (%)
Most Common Occupations - Life, physical, and social science occupations (%)
Most Common Occupations - Education, legal, community service, arts, and media occupations (%)
Most Common Occupations - Community and social service occupations (%)
Most Common Occupations - Legal occupations (%)
Most Common Occupations - Education, training, and library occupations (%)
Most Common Occupations - Arts, design, entertainment, sports, and media occupations (%)
Most Common Occupations - Healthcare practitioners and technical occupations (%)
Most Common Occupations - Health diagnosing and treating practitioners and other technical occupations (%)
Most Common Occupations - Health technologists and technicians (%)
Most Common Occupations - Service occupations (%)
Most Common Occupations - Healthcare support occupations (%)
Most Common Occupations - Protective service occupations (%)
Most Common Occupations - Fire fighting and prevention, and other protective service workers including supervisors (%)
Most Common Occupations - Law enforcement workers including supervisors (%)
Most Common Occupations - Food preparation and serving related occupations (%)
Most Common Occupations - Building and grounds cleaning and maintenance occupations (%)
Most Common Occupations - Personal care and service occupations (%)
Most Common Occupations - Sales and office occupations (%)
Most Common Occupations - Sales and related occupations (%)
Most Common Occupations - Office and administrative support occupations (%)
Most Common Occupations - Natural resources, construction, and maintenance occupations (%)
Most Common Occupations - Farming, fishing, and forestry occupations (%)
Most Common Occupations - Construction and extraction occupations (%)
Most Common Occupations - Installation, maintenance, and repair occupations (%)
Most Common Occupations - Production, transportation, and material moving occupations (%)
Most Common Occupations - Production occupations (%)
Most Common Occupations - Transportation occupations (%)
Most Common Occupations - Material moving occupations (%)
People in Group quarters - Institutionalized population (%)
People in Group quarters - Correctional institutions (%)
People in Group quarters - Federal prisons and detention centers (%)
People in Group quarters - Halfway houses (%)
People in Group quarters - Local jails and other confinement facilities (including police lockups) (%)
People in Group quarters - Military disciplinary barracks (%)
People in Group quarters - State prisons (%)
People in Group quarters - Other types of correctional institutions (%)
People in Group quarters - Nursing homes (%)
People in Group quarters - Hospitals/wards, hospices, and schools for the handicapped (%)
People in Group quarters - Hospitals/wards and hospices for chronically ill (%)
People in Group quarters - Hospices or homes for chronically ill (%)
People in Group quarters - Military hospitals or wards for chronically ill (%)
People in Group quarters - Other hospitals or wards for chronically ill (%)
People in Group quarters - Hospitals or wards for drug/alcohol abuse (%)
People in Group quarters - Mental (Psychiatric) hospitals or wards (%)
People in Group quarters - Schools, hospitals, or wards for the mentally retarded (%)
People in Group quarters - Schools, hospitals, or wards for the physically handicapped (%)
People in Group quarters - Institutions for the deaf (%)
People in Group quarters - Institutions for the blind (%)
People in Group quarters - Orthopedic wards and institutions for the physically handicapped (%)
People in Group quarters - Wards in general hospitals for patients who have no usual home elsewhere (%)
People in Group quarters - Wards in military hospitals for patients who have no usual home elsewhere (%)
People in Group quarters - Juvenile institutions (%)
People in Group quarters - Long-term care (%)
People in Group quarters - Homes for abused, dependent, and neglected children (%)
People in Group quarters - Residential treatment centers for emotionally disturbed children (%)
People in Group quarters - Training schools for juvenile delinquents (%)
People in Group quarters - Short-term care, detention or diagnostic centers for delinquent children (%)
People in Group quarters - Type of juvenile institution unknown (%)
People in Group quarters - Noninstitutionalized population (%)
People in Group quarters - College dormitories (includes college quarters off campus) (%)
People in Group quarters - Military quarters (%)
People in Group quarters - On base (%)
People in Group quarters - Barracks, unaccompanied personnel housing (UPH), (Enlisted/Officer), ;and similar group living quarters for military personnel (%)
People in Group quarters - Transient quarters for temporary residents (%)
People in Group quarters - Military ships (%)
People in Group quarters - Group homes (%)
People in Group quarters - Homes or halfway houses for drug/alcohol abuse (%)
People in Group quarters - Homes for the mentally ill (%)
People in Group quarters - Homes for the mentally retarded (%)
People in Group quarters - Homes for the physically handicapped (%)
People in Group quarters - Other group homes (%)
People in Group quarters - Religious group quarters (%)
People in Group quarters - Dormitories (%)
People in Group quarters - Agriculture workers' dormitories on farms (%)
People in Group quarters - Job Corps and vocational training facilities (%)
People in Group quarters - Other workers' dormitories (%)
People in Group quarters - Crews of maritime vessels (%)
People in Group quarters - Other nonhousehold living situations (%)
People in Group quarters - Other noninstitutional group quarters (%)
Residents speaking English at home (%)
Residents speaking English at home - Born in the United States (%)
Residents speaking English at home - Native, born elsewhere (%)
Residents speaking English at home - Foreign born (%)
Residents speaking Spanish at home (%)
Residents speaking Spanish at home - Born in the United States (%)
Residents speaking Spanish at home - Native, born elsewhere (%)
Residents speaking Spanish at home - Foreign born (%)
Residents speaking other language at home (%)
Residents speaking other language at home - Born in the United States (%)
Residents speaking other language at home - Native, born elsewhere (%)
Residents speaking other language at home - Foreign born (%)
Class of Workers - Employee of private company (%)
Class of Workers - Self-employed in own incorporated business (%)
Class of Workers - Private not-for-profit wage and salary workers (%)
Class of Workers - Local government workers (%)
Class of Workers - State government workers (%)
Class of Workers - Federal government workers (%)
Class of Workers - Self-employed workers in own not incorporated business and Unpaid family workers (%)
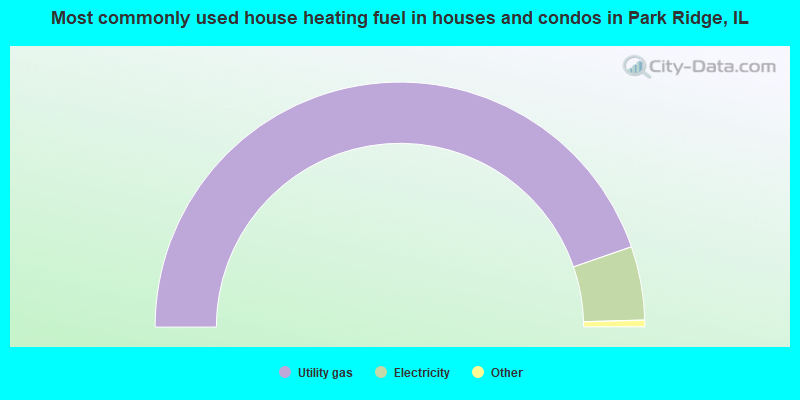
House heating fuel used in houses and condos - Utility gas (%)
House heating fuel used in houses and condos - Bottled, tank, or LP gas (%)
House heating fuel used in houses and condos - Electricity (%)
House heating fuel used in houses and condos - Fuel oil, kerosene, etc. (%)
House heating fuel used in houses and condos - Coal or coke (%)
House heating fuel used in houses and condos - Wood (%)
House heating fuel used in houses and condos - Solar energy (%)
House heating fuel used in houses and condos - Other fuel (%)
House heating fuel used in houses and condos - No fuel used (%)
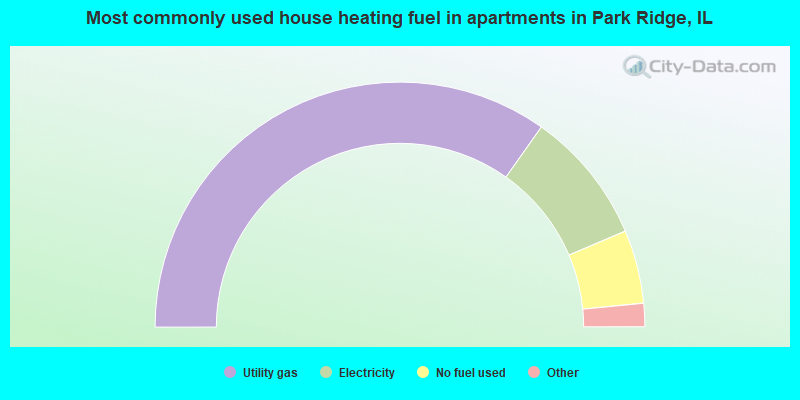
House heating fuel used in apartments - Utility gas (%)
House heating fuel used in apartments - Bottled, tank, or LP gas (%)
House heating fuel used in apartments - Electricity (%)
House heating fuel used in apartments - Fuel oil, kerosene, etc. (%)
House heating fuel used in apartments - Coal or coke (%)
House heating fuel used in apartments - Wood (%)
House heating fuel used in apartments - Solar energy (%)
House heating fuel used in apartments - Other fuel (%)
House heating fuel used in apartments - No fuel used (%)
Armed forces status - In Armed Forces (%)
Armed forces status - Civilian (%)
Armed forces status - Civilian - Veteran (%)
Armed forces status - Civilian - Nonveteran (%)
Fatal accidents locations in years 2005-2021
Fatal accidents locations in 2005
Fatal accidents locations in 2006
Fatal accidents locations in 2007
Fatal accidents locations in 2008
Fatal accidents locations in 2009
Fatal accidents locations in 2010
Fatal accidents locations in 2011
Fatal accidents locations in 2012
Fatal accidents locations in 2013
Fatal accidents locations in 2014
Fatal accidents locations in 2015
Fatal accidents locations in 2016
Fatal accidents locations in 2017
Fatal accidents locations in 2018
Fatal accidents locations in 2019
Fatal accidents locations in 2020
Fatal accidents locations in 2021
Alcohol use - People drinking some alcohol every month (%)
Alcohol use - People not drinking at all (%)
Alcohol use - Average days/month drinking alcohol
Alcohol use - Average drinks/week
Alcohol use - Average days/year people drink much
Audiometry - Average condition of hearing (%)
Audiometry - People that can hear a whisper from across a quiet room (%)
Audiometry - People that can hear normal voice from across a quiet room (%)
Audiometry - Ears ringing, roaring, buzzing (%)
Audiometry - Had a job exposure to loud noise (%)
Audiometry - Had off-work exposure to loud noise (%)
Blood Pressure & Cholesterol - Has high blood pressure (%)
Blood Pressure & Cholesterol - Checking blood pressure at home (%)
Blood Pressure & Cholesterol - Frequently checking blood cholesterol (%)
Blood Pressure & Cholesterol - Has high cholesterol level (%)
Consumer Behavior - Money monthly spent on food at supermarket/grocery store
Consumer Behavior - Money monthly spent on food at other stores
Consumer Behavior - Money monthly spent on eating out
Consumer Behavior - Money monthly spent on carryout/delivered foods
Consumer Behavior - Income spent on food at supermarket/grocery store (%)
Consumer Behavior - Income spent on food at other stores (%)
Consumer Behavior - Income spent on eating out (%)
Consumer Behavior - Income spent on carryout/delivered foods (%)
Current Health Status - General health condition (%)
Current Health Status - Blood donors (%)
Current Health Status - Has blood ever tested for HIV virus (%)
Current Health Status - Left-handed people (%)
Dermatology - People using sunscreen (%)
Diabetes - Diabetics (%)
Diabetes - Had a blood test for high blood sugar (%)
Diabetes - People taking insulin (%)
Diet Behavior & Nutrition - Diet health (%)
Diet Behavior & Nutrition - Milk product consumption (# of products/month)
Diet Behavior & Nutrition - Meals not home prepared (#/week)
Diet Behavior & Nutrition - Meals from fast food or pizza place (#/week)
Diet Behavior & Nutrition - Ready-to-eat foods (#/month)
Diet Behavior & Nutrition - Frozen meals/pizza (#/month)
Drug Use - People that ever used marijuana or hashish (%)
Drug Use - Ever used hard drugs (%)
Drug Use - Ever used any form of cocaine (%)
Drug Use - Ever used heroin (%)
Drug Use - Ever used methamphetamine (%)
Health Insurance - People covered by health insurance (%)
Kidney Conditions-Urology - Avg. # of times urinating at night
Medical Conditions - People with asthma (%)
Medical Conditions - People with anemia (%)
Medical Conditions - People with psoriasis (%)
Medical Conditions - People with overweight (%)
Medical Conditions - Elderly people having difficulties in thinking or remembering (%)
Medical Conditions - People who ever received blood transfusion (%)
Medical Conditions - People having trouble seeing even with glass/contacts (%)
Medical Conditions - People with arthritis (%)
Medical Conditions - People with gout (%)
Medical Conditions - People with congestive heart failure (%)
Medical Conditions - People with coronary heart disease (%)
Medical Conditions - People with angina pectoris (%)
Medical Conditions - People who ever had heart attack (%)
Medical Conditions - People who ever had stroke (%)
Medical Conditions - People with emphysema (%)
Medical Conditions - People with thyroid problem (%)
Medical Conditions - People with chronic bronchitis (%)
Medical Conditions - People with any liver condition (%)
Medical Conditions - People who ever had cancer or malignancy (%)
Mental Health - People who have little interest in doing things (%)
Mental Health - People feeling down, depressed, or hopeless (%)
Mental Health - People who have trouble sleeping or sleeping too much (%)
Mental Health - People feeling tired or having little energy (%)
Mental Health - People with poor appetite or overeating (%)
Mental Health - People feeling bad about themself (%)
Mental Health - People who have trouble concentrating on things (%)
Mental Health - People moving or speaking slowly or too fast (%)
Mental Health - People having thoughts they would be better off dead (%)
Oral Health - Average years since last visit a dentist
Oral Health - People embarrassed because of mouth (%)
Oral Health - People with gum disease (%)
Oral Health - General health of teeth and gums (%)
Oral Health - Average days a week using dental floss/device
Oral Health - Average days a week using mouthwash for dental problem
Oral Health - Average number of teeth
Pesticide Use - Households using pesticides to control insects (%)
Pesticide Use - Households using pesticides to kill weeds (%)
Physical Activity - People doing vigorous-intensity work activities (%)
Physical Activity - People doing moderate-intensity work activities (%)
Physical Activity - People walking or bicycling (%)
Physical Activity - People doing vigorous-intensity recreational activities (%)
Physical Activity - People doing moderate-intensity recreational activities (%)
Physical Activity - Average hours a day doing sedentary activities
Physical Activity - Average hours a day watching TV or videos
Physical Activity - Average hours a day using computer
Physical Functioning - People having limitations keeping them from working (%)
Physical Functioning - People limited in amount of work they can do (%)
Physical Functioning - People that need special equipment to walk (%)
Physical Functioning - People experiencing confusion/memory problems (%)
Physical Functioning - People requiring special healthcare equipment (%)
Prescription Medications - Average number of prescription medicines taking
Preventive Aspirin Use - Adults 40+ taking low-dose aspirin (%)
Reproductive Health - Vaginal deliveries (%)
Reproductive Health - Cesarean deliveries (%)
Reproductive Health - Deliveries resulted in a live birth (%)
Reproductive Health - Pregnancies resulted in a delivery (%)
Reproductive Health - Women breastfeeding newborns (%)
Reproductive Health - Women that had a hysterectomy (%)
Reproductive Health - Women that had both ovaries removed (%)
Reproductive Health - Women that have ever taken birth control pills (%)
Reproductive Health - Women taking birth control pills (%)
Reproductive Health - Women that have ever used Depo-Provera or injectables (%)
Reproductive Health - Women that have ever used female hormones (%)
Sexual Behavior - People 18+ that ever had sex (vaginal, anal, or oral) (%)
Sexual Behavior - Males 18+ that ever had vaginal sex with a woman (%)
Sexual Behavior - Males 18+ that ever performed oral sex on a woman (%)
Sexual Behavior - Males 18+ that ever had anal sex with a woman (%)
Sexual Behavior - Males 18+ that ever had any sex with a man (%)
Sexual Behavior - Females 18+ that ever had vaginal sex with a man (%)
Sexual Behavior - Females 18+ that ever performed oral sex on a man (%)
Sexual Behavior - Females 18+ that ever had anal sex with a man (%)
Sexual Behavior - Females 18+ that ever had any kind of sex with a woman (%)
Sexual Behavior - Average age people first had sex
Sexual Behavior - Average number of female sex partners in lifetime (males 18+)
Sexual Behavior - Average number of female vaginal sex partners in lifetime (males 18+)
Sexual Behavior - Average age people first performed oral sex on a woman (18+)
Sexual Behavior - Average number of woman performed oral sex on in lifetime (18+)
Sexual Behavior - Average number of male sex partners in lifetime (males 18+)
Sexual Behavior - Average number of male anal sex partners in lifetime (males 18+)
Sexual Behavior - Average age people first performed oral sex on a man (18+)
Sexual Behavior - Average number of male oral sex partners in lifetime (18+)
Sexual Behavior - People using protection when performing oral sex (%)
Sexual Behavior - Average number of times people have vaginal or anal sex a year
Sexual Behavior - People having sex without condom (%)
Sexual Behavior - Average number of male sex partners in lifetime (females 18+)
Sexual Behavior - Average number of male vaginal sex partners in lifetime (females 18+)
Sexual Behavior - Average number of female sex partners in lifetime (females 18+)
Sexual Behavior - Circumcised males 18+ (%)
Sleep Disorders - Average hours sleeping at night
Sleep Disorders - People that has trouble sleeping (%)
Smoking-Cigarette Use - People smoking cigarettes (%)
Taste & Smell - People 40+ having problems with smell (%)
Taste & Smell - People 40+ having problems with taste (%)
Taste & Smell - People 40+ that ever had wisdom teeth removed (%)
Taste & Smell - People 40+ that ever had tonsils teeth removed (%)
Taste & Smell - People 40+ that ever had a loss of consciousness because of a head injury (%)
Taste & Smell - People 40+ that ever had a broken nose or other serious injury to face or skull (%)
Taste & Smell - People 40+ that ever had two or more sinus infections (%)
Weight - Average height (inches)
Weight - Average weight (pounds)
Weight - Average BMI
Weight - People that are obese (%)
Weight - People that ever were obese (%)
Weight - People trying to lose weight (%)
According to our research of Illinois and other state lists, there were 9 registered sex offenders living in Park Ridge, Illinois as of April 26, 2024 . The ratio of all residents to sex offenders in Park Ridge is 4,155 to 1.The ratio of registered sex offenders to all residents in this city is much lower than the state average.
Officers per 1,000 residents here:
1.46Illinois average:
3.04
Latest news from Park Ridge, IL collected exclusively by city-data.com from local newspapers, TV, and radio stations
Ancestries: Polish (20.4%), Irish (11.3%), German (10.3%), Italian (7.9%), American (5.6%), Greek (2.9%).
Current Local Time:
Incorporated on 07/05/1873
Land area: 7.03 square miles.
Population density: 5,446 people per square mile (average).
5,560 residents are foreign born (8.5% Europe , 4.2% Asia ).
This city:
14.4%Illinois:
14.1%
Median real estate property taxes paid for housing units with mortgages in 2022: $9,512 (1.6%)Median real estate property taxes paid for housing units with no mortgage in 2022: $9,278 (1.9%)
Nearest city with pop. 50,000+: Des Plaines, IL
Nearest city with pop. 200,000+: Chicago, IL
Nearest cities:
Latitude: 42.01 N, Longitude: 87.84 W
Daytime population change due to commuting: +1,316 (+3.4%)Workers who live and work in this city: 6,639 (33.9%)
Single-family new house construction building permits:
2022: 8 buildings , average cost: $999,0002021: 24 buildings , average cost: $683,8002020: 20 buildings , average cost: $655,3002019: 18 buildings , average cost: $559,0002018: 27 buildings , average cost: $559,8002017: 38 buildings , average cost: $413,9002016: 50 buildings , average cost: $490,6002015: 49 buildings , average cost: $378,6002014: 35 buildings , average cost: $463,6002013: 24 buildings , average cost: $464,7002012: 34 buildings , average cost: $425,1002011: 23 buildings , average cost: $297,0002010: 8 buildings , average cost: $431,8002009: 27 buildings , average cost: $425,1002008: 44 buildings , average cost: $505,9002007: 48 buildings , average cost: $507,4002006: 100 buildings , average cost: $482,3002005: 140 buildings , average cost: $435,9002004: 97 buildings , average cost: $417,6002003: 87 buildings , average cost: $383,8002002: 63 buildings , average cost: $336,6002001: 82 buildings , average cost: $321,8002000: 68 buildings , average cost: $318,7001999: 87 buildings , average cost: $248,5001998: 86 buildings , average cost: $222,9001997: 109 buildings , average cost: $194,200Unemployment in December 2023:
Population change in the 1990s: +458 (+1.2%).
Most common occupations in Park Ridge, IL (%)
Both Males Females
Other management occupations, except farmers and farm managers (6.6%)
Other sales and related occupations, including supervisors (5.5%)
Sales representatives, services, wholesale and manufacturing (5.0%)
Other office and administrative support workers, including supervisors (4.7%)
Secretaries and administrative assistants (3.9%)
Accountants and auditors (3.7%)
Preschool, kindergarten, elementary, and middle school teachers (3.6%)
Other management occupations, except farmers and farm managers (8.3%)
Sales representatives, services, wholesale and manufacturing (6.5%)
Other sales and related occupations, including supervisors (5.5%)
Top executives (4.8%)
Computer specialists (4.5%)
Lawyers (4.1%)
Accountants and auditors (4.0%)
Secretaries and administrative assistants (7.7%)
Preschool, kindergarten, elementary, and middle school teachers (7.0%)
Other office and administrative support workers, including supervisors (6.9%)
Other sales and related occupations, including supervisors (5.4%)
Registered nurses (4.8%)
Other management occupations, except farmers and farm managers (4.7%)
Information and record clerks, except customer service representatives (4.1%)
Tornado activity:
Park Ridge-area historical tornado activity is slightly below Illinois state average. It is 39% greater than the overall U.S. average.
On 8/28/1990, a category F5 (max. wind speeds 261-318 mph) tornado 34.8 miles away from the Park Ridge city center killed 29 people and injured 350 people and caused between $50,000 and $500,000 in damages.
On 9/28/1972, a category F4 (max. wind speeds 207-260 mph) tornado 18.6 miles away from the city center injured 20 people and caused between $500,000 and $5,000,000 in damages.
Earthquake activity:
Park Ridge-area historical earthquake activity is significantly above Illinois state average. It is 36% greater than the overall U.S. average. On 4/18/2008 at 09:36:59, a magnitude 5.4 (5.1 MB, 4.8 MS, 5.4 MW, 5.2 MW, Class: Moderate, Intensity: VI - VII) earthquake occurred 246.2 miles away from the city center On 6/10/1987 at 23:48:54, a magnitude 5.1 (4.9 MB, 4.4 MS, 4.6 MS, 5.1 LG) earthquake occurred 220.7 miles away from the city center On 4/18/2008 at 09:36:59, a magnitude 5.2 (5.2 MW, Depth: 8.9 mi) earthquake occurred 246.3 miles away from Park Ridge center On 6/28/2004 at 06:10:52, a magnitude 4.2 (4.2 MW, Depth: 6.2 mi, Class: Light, Intensity: IV - V) earthquake occurred 66.6 miles away from the city center On 2/10/2010 at 09:59:35, a magnitude 3.8 (3.8 MW, Depth: 6.2 mi, Class: Light, Intensity: II - III) earthquake occurred 33.9 miles away from the city center On 5/2/2015 at 16:23:07, a magnitude 4.2 (4.2 MW, Depth: 2.8 mi) earthquake occurred 124.8 miles away from the city center Magnitude types: regional Lg-wave magnitude (LG), body-wave magnitude (MB), surface-wave magnitude (MS), moment magnitude (MW) Natural disasters: The number of natural disasters in Cook County (20) is greater than the US average (15).Major Disasters (Presidential) Declared: 15Emergencies Declared: 4Floods: 13, Storms: 12, Tornadoes: 3, Snowstorms: 2, Winter Storms: 2, Blizzard: 1, Hurricane: 1, Snow: 1, Wind: 1, Other: 1 (Note: some incidents may be assigned to more than one category). Hospitals in Park Ridge: ADVOCATE LUTHERAN GENERAL HOSPITAL (Voluntary non-profit - Church, provides emergency services, 1775 DEMPSTER ST) GOOD HEART HOSPICE, INC (1550 NORTH NORTHWEST HIGHWAY) PARKSIDE LUTHERAN HOSPITAL (1700 LUTHER LANE) RAINBOW HOSPICE, INC (444 N NORTHWEST HIGHWAY SUITE 145) Home Health Centers in Park Ridge: AGAPE HOME HEALTH CARE, INC (444 NORTH NORTHWEST HIGHWAY, SUITE 320) BODIMETRIC HEALTH SERVICES INC (205 W TOUHY SUITE 209) CHICAGOLAND HOME HEALTH PROVIDER, INC (1600 DEMPSTER ST, STE 102) GOOD HEART HOME HEALTH CARE, INC (1550 NORTH NORTHWEST HIGHWAY, STE 204B) HEALTH FIRST HOME HEALTH INC (2644 DEMPSTER ST, STE 100) OMEGA HOME HEALTHCARE, LLC (400 WEST HIGGINS ROAD) PLATINUM HEALTHCARE SERVICES, LLC (2604 N DEMPSTER AVE, STE 508) PRIME CARE RESOURCE, INC (1420 RENAISSANCE DRIVE SUITE 410) PRIME HOME HEALTH SERVICES, INC (2604 DEMPSTER AVENUE, STE 407) PROHEALTH HOMECARE, LLC (2604 DEMPSTER, STE 205) WOUND AND REHAB HOME HEALTH CARE, INC (700 BUSSE HIGHWAY) Nursing Homes in Park Ridge: PARK RIDGE CARE CENTER (665 BUSSE HIGHWAY) RESURRECTION NSG AND REHAB CTR (1001 NORTH GREENWOOD AVENUE) ST MATTHEW CENTER FOR HEALTH (1601 NORTH WESTERN AVENUE) ST MATTHEW LUTHERAN HOME (1601 N WESTERN AVE) Heliports located in Park Ridge: Amtrak stations near Park Ridge: 5 miles: GLENVIEW (1116 DEPOT ST.) Services: ticket office, fully wheelchair accessible, enclosed waiting area, public restrooms, public payphones, free short-term parking, free long-term parking, call for car rental service, taxi stand, public transit connection.
14 miles: LA GRANGE ROAD (LA GRANGE, 25 W. BURLINGTON AVE.) Services: enclosed waiting area, public payphones, taxi stand, public transit connection.
14 miles: CHICAGO (225 S. CANAL ST.) Services: ticket office, partially wheelchair accessible, enclosed waiting area, public restrooms, public payphones, snack bar, paid short-term parking, paid long-term parking, call for car rental service, taxi stand, public transit connection.
Colleges/universities with over 2000 students nearest to Park Ridge:
Oakton Community College (about 5 miles; Des Plaines, IL ; Full-time enrollment: 7,271)
City Colleges of Chicago-Wilbur Wright College (about 5 miles; Chicago, IL ; FT enrollment: 8,683)
Computer Systems Institute (about 5 miles; Skokie, IL ; FT enrollment: 2,311)
BIR Training Center (about 7 miles; Chicago, IL ; FT enrollment: 2,036)
Northeastern Illinois University (about 7 miles; Chicago, IL ; FT enrollment: 8,004)
Triton College (about 7 miles; River Grove, IL ; FT enrollment: 8,817)
North Park University (about 8 miles; Chicago, IL ; FT enrollment: 2,622)
Public high schools in Park Ridge:
Public elementary/middle schools in Park Ridge: LINCOLN MIDDLE SCHOOL Students: 766, Location: 200 S LINCOLN AVE, Grades: 6-8)THEODORE ROOSEVELT ELEM SCHOOL Students: 700, Location: 1001 S FAIRVIEW AVE, Grades: KG-5)EUGENE FIELD ELEM SCHOOL Students: 621, Location: 707 WISNER ST, Grades: KG-5)GEORGE WASHINGTON ELEM SCHOOL Students: 607, Location: 1500 STEWART AVE, Grades: KG-5)FRANKLIN ELEMENTARY SCHOOL Students: 463, Location: 2401 MANOR LN, Grades: KG-5)GEORGE B CARPENTER ELEM SCHOOL Students: 371, Location: 300 N HAMLIN AVE, Grades: KG-5)Private elementary/middle schools in Park Ridge: ST PAUL OF THE CROSS SCHOOL Students: 660, Location: 140 S NORTHWEST HWY, Grades: PK-8)
MARY SEAT OF WISDOM SCHOOL Students: 464, Location: 1352 S CUMBERLAND AVE, Grades: PK-8)
ST ANDREWS LUTHERAN SCHOOL Students: 198, Location: 260 N NORTHWEST HWY, Grades: PK-8)
EMBERS ELEMENTARY SCHOOL Students: 134, Location: 2000 W SIBLEY ST, Grades: PK-5)
See full list of schools located in Park Ridge Library in Park Ridge: PARK RIDGE PUBLIC LIBRARY Operating income: $4,476,258; Location: 20 SOUTH PROSPECT AVENUE; 220,267 books ; 2,589 e-books ; 13,377 audio materials ; 13,114 video materials ; 56 local licensed databases ; 18 state licensed databases ; 2 other licensed databases ; 440 print serial subscriptions )
User-submitted facts and corrections:
Birthplace of Gary Cole (Actor, 20 September 1956) added by m0nkey
Park Ridge School: Messiah Lutheran Child Care Center and Kindergarten 1605 Vernon Avenue
Notable locations in Park Ridge: (A) , Camp Fort Dearborn (B) , Park Ridge Public Library (C) , Park Ridge City Hall (D) , Maine Township Town Hall (E) , Edison Park Home (F) , Park Ridge Fire Department Station 36 (G) , Park Ridge Fire Department Station 35 (H) . Display/hide their locations on the map
Churches in Park Ridge include: (A) , First Church of Christ Scientist (B) , First United Methodist Church of Park Ridge (C) , Good Shepherd United Methodist Church (D) , Mary Seat of Wisdom Church (E) , Messiah Lutheran Church (F) , Midway Presbyterian Church (G) , Park Ridge Community Church (H) , Park Ridge Presbyterian Church (I) . Display/hide their locations on the map
Cemetery: (1) . Display/hide its location on the map
Lakes and reservoirs: (A) , Forest Lake (B) , Park Lake (C) , Murphy Lake (D) . Display/hide their locations on the map
Parks in Park Ridge include: (1) , Ni-Ridge Park (2) , Centennial Park (3) , Morgan Park (4) , Woodland Park (5) , Brickton Park (6) , Hinkley Park (7) , Hodges Park (8) , Jaycee Park (9) . Display/hide their locations on the map
Tourist attractions:
Birthplace of: Adam Jones (musician) - Musician, Craig Anderson (ice hockey) - Ice hockey goaltender, Dave Mallow - Video game actor, Gary Cole - Film actor, Karen Black - (born 1942), actress, Al Levine - 2005 Major League Baseball player (San Francisco Giants, born : May 22, 1968), Blake Sloan - NHL player (Dallas Stars, born : Jul 27, 1975), Carrie Snodgress - Actress, Craig Anderson - NHL player (Chicago Blackhawks, born : May 21, 1981), Luke Gregerson - Baseball player.
Cook County has a predicted average indoor radon screening level between 2 and 4 pCi/L (pico curies per liter) - Moderate Potential Average household size: This city:
2.6 peopleIllinois:
2.6 people
Percentage of family households: This city:
72.7%Whole state:
65.8%
Percentage of households with unmarried partners: This city:
2.5%Whole state:
6.3%
Likely homosexual households (counted as self-reported same-sex unmarried-partner households)
Lesbian couples: 0.2% of all households Gay men: 0.2% of all households
People in group quarters in Park Ridge in 2010:
399 people in nursing facilities/skilled-nursing facilities
45 people in group homes intended for adults
35 people in residential treatment centers for juveniles (non-correctional)
11 people in other noninstitutional facilities
2 people in emergency and transitional shelters (with sleeping facilities) for people experiencing homelessness
People in group quarters in Park Ridge in 2000:
493 people in nursing homes
65 people in homes for the mentally retarded
59 people in other noninstitutional group quarters
37 people in other group homes
4 people in religious group quarters
3 people in college dormitories (includes college quarters off campus)
3 people in homes for the physically handicapped
2 people in other nonhousehold living situations
Banks with most branches in Park Ridge (2011 data):
JPMorgan Chase Bank, National Association: Park Ridge Facility, Busse Highway And Greenwood Branch, Park Ridge Dominicks. Info updated 2011/11/10: Bank assets: $1,811,678.0 mil, Deposits: $1,190,738.0 mil, headquarters in Columbus, OH, positive income , International Specialization, 5577 total offices , Holding Company: Jpmorgan Chase & Co.
Bank of America, National Association: 425 Devon Avenue Branch at 425 Devon Avenue, branch established on 1909/01/01; Park Ridge/Greenwood at 501 North Greenwood Avenue, branch established on 1987/06/30. Info updated 2009/11/18: Bank assets: $1,451,969.3 mil, Deposits: $1,077,176.8 mil, headquarters in Charlotte, NC, positive income , 5782 total offices , Holding Company: Bank Of America Corporation
Parkway Bank and Trust Company: Park Ridge South Branch at 608 Higgins, branch established on 1981/01/05; Park Ridge North Branch at 1001 Northwest Highway, branch established on 2003/01/02. Info updated 2011/06/03: Bank assets: $2,237.7 mil, Deposits: $1,906.2 mil, headquarters in Harwood Heights, IL, positive income , Commercial Lending Specialization, 33 total offices , Holding Company: Parkway Bancorp, Inc.
TCF National Bank: Park Ridge Branch #2075 at 1 West Devon Avenue, branch established on 1928/01/01; Park Ridge Jewel Branch at 481 Busse Highway, branch established on 2001/11/08. Info updated 2009/11/23: Bank assets: $19,007.0 mil, Deposits: $12,377.0 mil, headquarters in Sioux Falls, SD, positive income , Commercial Lending Specialization, 441 total offices , Holding Company: Tcf Financial Corporation
RBS Citizens, National Association: Park Ridge Branch at 118 Euclid Ave, branch established on 1998/10/05. Info updated 2007/09/19: Bank assets: $106,940.6 mil, Deposits: $75,690.2 mil, headquarters in Providence, RI, positive income , 1135 total offices , Holding Company: Uk Financial Investments Limited
Northbrook Bank and Trust Company: Park Ridge Branch - Touhy Ave. at 950 W. Touhy Ave., branch established on 1998/08/24. Info updated 2011/07/11: Bank assets: $1,886.7 mil, Deposits: $1,548.8 mil, headquarters in Northbrook, IL, positive income , Commercial Lending Specialization, 20 total offices , Holding Company: Wintrust Financial Corporation
Liberty Bank for Savings: Park Ridge Office at 1018 West Touhy Avenue, branch established on 2005/07/09. Info updated 2006/11/03: Bank assets: $882.3 mil, Deposits: $663.4 mil, headquarters in Chicago, IL, positive income , Mortgage Lending Specialization, 5 total offices
BMO Harris Bank National Association: North Northwest Highway Branch at 615 Busse Highway, branch established on 1940/12/31. Info updated 2011/07/14: Bank assets: $97,264.0 mil, Deposits: $75,624.6 mil, headquarters in Chicago, IL, positive income , 717 total offices , Holding Company: Bank Of Montreal
Park Ridge Community Bank: at 626 Talcott Road, branch established on 1995/07/03. Info updated 2006/11/03: Bank assets: $266.5 mil, Deposits: $230.7 mil, local headquarters , positive income , Commercial Lending Specialization, 1 total offices , Holding Company: Community Bank Corp.
3 other banks with 3 local branches
For population 15 years and over in Park Ridge:
Never married: 24.8%Now married: 60.4%Separated: 1.3%Widowed: 5.6%Divorced: 7.9% For population 25 years and over in Park Ridge:
High school or higher: 96.2%Bachelor's degree or higher: 63.9%Graduate or professional degree: 26.6%Unemployed: 1.9%Mean travel time to work (commute): 21.2 minutes
Education Gini index (Inequality in education) Here:
10.1Illinois average:
12.5
Religion statistics for Park Ridge, IL (based on Cook County data)
Religion Adherents Congregations Catholic 1,947,223 376 Evangelical Protestant 432,975 1,484 Other 312,636 403 Mainline Protestant 202,114 630 Black Protestant 148,895 395 Orthodox 53,276 66 None 2,097,556 -
Source: Clifford Grammich, Kirk Hadaway, Richard Houseal, Dale E.Jones, Alexei Krindatch, Richie Stanley and Richard H.Taylor. 2012. 2010 U.S.Religion Census: Religious Congregations & Membership Study. Association of Statisticians of American Religious Bodies. Jones, Dale E., et al. 2002. Congregations and Membership in the United States 2000. Nashville, TN: Glenmary Research Center. Graphs represent county-level data
Food Environment Statistics: Number of grocery stores : 1,460Here :
2.77 / 10,000 pop.State :
2.24 / 10,000 pop.
Number of supercenters and club stores : 23This county :
0.04 / 10,000 pop.Illinois :
0.08 / 10,000 pop.
Number of convenience stores (no gas) : 490Here :
0.93 / 10,000 pop.Illinois :
0.75 / 10,000 pop.
Number of convenience stores (with gas) : 806Cook County :
1.53 / 10,000 pop.Illinois :
2.61 / 10,000 pop.
Number of full-service restaurants : 3,516Here :
6.67 / 10,000 pop.State :
6.86 / 10,000 pop.
Adult diabetes rate : This county :
8.4%Illinois :
8.3%
Adult obesity rate : Cook County :
23.5%Illinois :
25.2%
Low-income preschool obesity rate : Cook County :
16.3%Illinois :
14.5%
Health and Nutrition: Healthy diet rate : Park Ridge:
54.6%Illinois:
49.5%
Average overall health of teeth and gums : This city:
52.8%State:
47.2%
People feeling badly about themselves : People not drinking alcohol at all : Park Ridge:
9.1%Illinois:
10.8%
Average hours sleeping at night : Park Ridge:
7.0Illinois:
6.8
Overweight people : This city:
35.1%Illinois:
33.4%
General health condition : Average condition of hearing : This city:
78.1%Illinois:
79.9%
More about Health and Nutrition of Park Ridge, IL Residents
Local government employment and payroll (March 2022)
Function
Full-time employees
Monthly full-time payroll
Average yearly full-time wage
Part-time employees
Monthly part-time payroll
Police Protection - Officers
54 $471,434 $104,763 0 $0 Firefighters
49 $437,227 $107,076 1 $652 Other and Unallocable
31 $213,396 $82,605 3 $6,582 Local Libraries
28 $137,431 $58,899 40 $54,582 Police - Other
14 $83,889 $71,905 25 $15,087 Streets and Highways
13 $97,608 $90,100 0 $0 Water Supply
10 $63,912 $76,694 0 $0 Financial Administration
8 $49,477 $74,216 0 $0 Sewerage
7 $22,694 $38,904 0 $0 Other Government Administration
5 $46,764 $112,234 9 $2,450 Natural Resources
2 $16,793 $100,758 0 $0
Totals for Government
221 $1,640,624 $89,084 78 $79,353
Park Ridge government finances - Expenditure in 2018 (per resident):
Construction - Sewerage: $534,000 ($13.95)
Regular Highways: $408,000 ($10.66)Libraries: $300,000 ($7.84)Water Utilities: $248,000 ($6.48)Current Operations - Police Protection: $8,865,000 ($231.60)
Local Fire Protection: $7,526,000 ($196.61)Water Utilities: $7,313,000 ($191.05)Regular Highways: $6,342,000 ($165.68)Central Staff Services: $5,877,000 ($153.53)General - Other: $4,476,000 ($116.93)Libraries: $3,788,000 ($98.96)Solid Waste Management: $2,855,000 ($74.59)Financial Administration: $1,918,000 ($50.11)Sewerage: $759,000 ($19.83)General Public Buildings: $572,000 ($14.94)Parking Facilities: $270,000 ($7.05)Parks and Recreation: $231,000 ($6.03)General - Interest on Debt: $786,000 ($20.53)
Intergovernmental to Local - Other - General - Other: $5,342,000 ($139.56)
Other Capital Outlay - Local Fire Protection: $629,000 ($16.43)
Regular Highways: $417,000 ($10.89)Police Protection: $151,000 ($3.94)Central Staff Services: $24,000 ($0.63)Housing and Community Development: $19,000 ($0.50)Total Salaries and Wages: $19,625,000 ($512.70)
Park Ridge government finances - Revenue in 2018 (per resident):
Charges - Sewerage: $1,840,000 ($48.07)
Other: $1,679,000 ($43.86)Parking Facilities: $374,000 ($9.77)Federal Intergovernmental - Other: $623,000 ($16.28)
Miscellaneous - General Revenue - Other: $561,000 ($14.66)
Fines and Forfeits: $551,000 ($14.39)Interest Earnings: $204,000 ($5.33)Revenue - Water Utilities: $10,587,000 ($276.58)
State Intergovernmental - General Local Government Support: $10,056,000 ($262.71)
Highways: $1,463,000 ($38.22)Other: $58,000 ($1.52)Tax - Property: $22,989,000 ($600.58)
Other License: $3,890,000 ($101.62)Other Selective Sales: $3,825,000 ($99.93)Public Utilities Sales: $3,474,000 ($90.76)
Park Ridge government finances - Debt in 2018 (per resident):
Long Term Debt - Beginning Outstanding - Unspecified Public Purpose: $35,752,000 ($934.01)
Outstanding Unspecified Public Purpose: $33,656,000 ($879.25)Retired Unspecified Public Purpose: $6,553,000 ($171.19)Issue, Unspecified Public Purpose: $4,457,000 ($116.44)
Park Ridge government finances - Cash and Securities in 2018 (per resident):
Other Funds - Cash and Securities: $50,375,000 ($1316.03)
3.53% of this county's 2021 resident taxpayers lived in other counties in 2020 ($82,405 average adjusted gross income )
Here:
3.53%Illinois average:
5.09%
0.01% of residents moved from foreign countries ($114 average AGI )Cook County:
0.01%Illinois average:
0.01%
Top counties from which taxpayers relocated into this county between 2020 and 2021:
5.44% of this county's 2020 resident taxpayers moved to other counties in 2021 ($120,340 average adjusted gross income )
Here:
5.44%Illinois average:
6.10%
0.01% of residents moved to foreign countries ($140 average AGI )Cook County:
0.01%Illinois average:
0.01%
Top counties to which taxpayers relocated from this county between 2020 and 2021:
Businesses in Park Ridge, IL
Name Count Name Count
7-Eleven 3 Jewel-Osco 1 Ace Hardware 1 JoS. A. Bank 1 Blockbuster 1 LensCrafters 1 Burger King 1 MasterBrand Cabinets 2 CVS 1 McDonald's 1 Chico's 1 Panera Bread 1 Cricket Wireless 1 Safeway 1 Dairy Queen 1 Starbucks 3 Domino's Pizza 1 Talbots 1 Dunkin Donuts 1 Toyota 1 Famous Footwear 1 Trader Joe's 1 FedEx 5 UPS 7 H&R Block 1 Vons 1 Houlihan's 1 Walgreens 1
Strongest AM radio stations in Park Ridge:
WGN (720 AM; 50 kW; CHICAGO, IL; Owner: WGN CONTINENTAL BROADCASTING CO.)
WBBM (780 AM; 50 kW; CHICAGO, IL; Owner: INFINITY BROADCASTING OPERATIONS, INC.)
WSCR (670 AM; 50 kW; CHICAGO, IL; Owner: INFINITY BROADCASTING OPERATIONS, INC.)
WMVP (1000 AM; 50 kW; CHICAGO, IL; Owner: ABC, INC.)
WCSN (820 AM; 5 kW; CHICAGO, IL; Owner: WYPA, INC.)
WLS (890 AM; 50 kW; CHICAGO, IL; Owner: WLS, INC.)
WONX (1590 AM; 4 kW; EVANSTON, IL; Owner: KOVAS COMMUNICATIONS, INC.)
WCRW (1240 AM; 1 kW; CHICAGO, IL; Owner: WSBC BROADCASTING, L.L.C.)
WEDC (1240 AM; 1 kW; CHICAGO, IL; Owner: FOREIGN LANGUAGE BROADCASTS, INC.)
WKTA (1330 AM; 5 kW; EVANSTON, IL; Owner: POLNET COMMUNICATIONS, LTD.)
WYLL (1160 AM; 50 kW; CHICAGO, IL; Owner: SCA LICENSE CORPORATION)
WMBI (1110 AM; daytime; 5 kW; CHICAGO, IL; Owner: THE MOODY BIBLE INSTITUTE OF CHICAGO)
WTMJ (620 AM; 50 kW; MILWAUKEE, WI; Owner: JOURNAL BROADCAST CORPORATION)
Strongest FM radio stations in Park Ridge:
WCKG (105.9 FM; ELMWOOD PARK, IL; Owner: INFINITY HOLDINGS CORPORATION OF ORLANDO)
WLIT-FM (93.9 FM; CHICAGO, IL; Owner: AMFM RADIO LICENSES, L.L.C.)
WGCI-FM (107.5 FM; CHICAGO, IL; Owner: AMFM RADIO LICENSES, L.L.C.)
WJMK (104.3 FM; CHICAGO, IL; Owner: INFINITY BROADCASTING CORP. OF ILLINOIS)
WNUA (95.5 FM; CHICAGO, IL; Owner: AMFM RADIO LICENSES, L.L.C.)
WTMX (101.9 FM; SKOKIE, IL; Owner: BONNEVILLE HOLDING COMPANY)
WBBM-FM (96.3 FM; CHICAGO, IL; Owner: INFINITY BROADCASTING OPERATIONS, INC.)
WKSC-FM (103.5 FM; CHICAGO, IL; Owner: AMFM RADIO LICENSES, L.L.C.)
WFMT (98.7 FM; CHICAGO, IL; Owner: WINDOW TO THE WORLD COMMUNICATIONS)
WZZN (94.7 FM; CHICAGO, IL; Owner: ABC CHICAGO FM RADIO,INC.)
WBEZ (91.5 FM; CHICAGO, IL; Owner: THE WBEZ ALLIANCE, INC.)
WKQX (101.1 FM; CHICAGO, IL; Owner: EMMIS RADIO LICENSE CORPORATION)
WLUP-FM (97.9 FM; CHICAGO, IL; Owner: BONNEVILLE HOLDING COMPANY)
WNND (100.3 FM; CHICAGO, IL; Owner: BONNEVILLE HOLDING COMPANY)
WOJO (105.1 FM; EVANSTON, IL; Owner: TICHENOR LICENSE CORPORATION ("TLC"))
WUSN (99.5 FM; CHICAGO, IL; Owner: INFINITY BROADCASTING CORPORATION OF CHICAGO)
WVAZ (102.7 FM; OAK PARK, IL; Owner: AMFM RADIO LICENSES, L.L.C.)
WMTH (90.5 FM; PARK RIDGE, IL; Owner: BOARD OF EDUCATION, MAINE TWP. #207)
WXRT-FM (93.1 FM; CHICAGO, IL; Owner: INFINITY BROADCASTING OPERATIONS, INC.)
WDRV (97.1 FM; CHICAGO, IL; Owner: BONNEVILLE HOLDING COMPANY)
TV broadcast stations around Park Ridge:
W34CK (Channel 34; ARLINGTON HEIGHTS, IL; Owner: FIRST UNITED, INC.)
WLS-TV (Channel 7; CHICAGO, IL; Owner: WLS TELEVISION, INC.)
WMAQ-TV (Channel 5; CHICAGO, IL; Owner: NBC SUBSIDIARY (WMAQ-TV), INC.)
WTTW (Channel 11; CHICAGO, IL; Owner: WINDOW TO THE WORLD COMMUNICATIONS, INC.)
WGBO-TV (Channel 66; JOLIET, IL; Owner: WGBO LICENSE PARTNERSHIP, G.P.)
WGN-TV (Channel 9; CHICAGO, IL; Owner: WGN CONTINENTAL BROADCASTING COMPANY)
WBBM-TV (Channel 2; CHICAGO, IL; Owner: CBS BROADCASTING INC.)
WPWR-TV (Channel 50; GARY, IN; Owner: FOX TELEVISION STATIONS, INC.)
WXFT (Channel 60; AURORA, IL; Owner: TELEFUTURA CHICAGO LLC)
WCIU-TV (Channel 26; CHICAGO, IL; Owner: WCIU-TV LIMITED PARTNERSHIP)
WCPX (Channel 38; CHICAGO, IL; Owner: PAXSON CHICAGO LICENSE, INC.)
WSNS-TV (Channel 44; CHICAGO, IL; Owner: TELEMUNDO OF CHICAGO, INC.)
WFLD (Channel 32; CHICAGO, IL; Owner: FOX TELEVISION STATIONS, INC.)
W68DO (Channel 68; PALATINE, IL; Owner: TRINITY BROADCASTING NETWORK)
WFBT-CA (Channel 23; CHICAGO, IL; Owner: CHANNEL 23 LIMITED PARTNERSHIP)
WJYS (Channel 62; HAMMOND, IN; Owner: JOVON BROADCASTING CORPORATION)
WOCH-LP (Channel 28; CHICAGO, IL; Owner: KM LPTV OF CHICAGO-28, L.L.C.)
WYCC (Channel 20; CHICAGO, IL; Owner: COLLEGE DIST. #508, COUNTY OF COOK)
WOCK-CA (Channel 13; CHICAGO, IL; Owner: KM LPTV OF CHICAGO-13, L.L.C.)
W64CQ (Channel 64; ARLINGTON HEIGHTS, IL; Owner: TRINITY BROADCASTING NETWORK)
WYIN (Channel 56; GARY, IN; Owner: NORTHWEST INDIANA PUBLIC BROADCASTING, INC.)
W57DN (Channel 57; ELGIN, IL; Owner: TRINITY BROADCASTING NETWORK)
W24AJ (Channel 24; AURORA, IL; Owner: NELSON TV, INC.)
Home Mortgage Disclosure Act Aggregated Statistics For Year 2009(Based on 6 full and 5 partial tracts) A) FHA, FSA/RHS & VA B) Conventional C) Refinancings D) Home Improvement Loans E) Loans on Dwellings For 5+ Families F) Non-occupant Loans on G) Loans On Manufactured Number Average Value Number Average Value Number Average Value Number Average Value Number Average Value Number Average Value Number Average Value
LOANS ORIGINATED 42 $287,785 203 $300,050 1,320 $299,962 26 $197,436 2 $425,000 40 $259,777 1 $96,790 APPLICATIONS APPROVED, NOT ACCEPTED 4 $285,140 16 $388,316 129 $317,907 2 $15,990 0 $0 7 $435,087 0 $0 APPLICATIONS DENIED 15 $288,669 43 $314,665 268 $336,659 10 $208,733 1 $2,931,270 12 $220,237 0 $0 APPLICATIONS WITHDRAWN 8 $274,441 13 $284,388 144 $306,721 1 $168,410 1 $165,370 5 $328,056 0 $0 FILES CLOSED FOR INCOMPLETENESS 3 $273,510 2 $83,795 46 $325,719 2 $280,000 0 $0 0 $0 0 $0
Aggregated Statistics For Year 2008(Based on 6 full and 5 partial tracts) A) FHA, FSA/RHS & VA B) Conventional C) Refinancings D) Home Improvement Loans E) Loans on Dwellings For 5+ Families F) Non-occupant Loans on Number Average Value Number Average Value Number Average Value Number Average Value Number Average Value Number Average Value
LOANS ORIGINATED 16 $322,004 341 $329,745 687 $331,689 40 $197,593 2 $856,990 69 $308,982 APPLICATIONS APPROVED, NOT ACCEPTED 1 $151,400 35 $380,704 96 $375,619 9 $58,854 0 $0 12 $298,293 APPLICATIONS DENIED 4 $305,000 72 $407,734 240 $399,670 26 $178,567 1 $1,200,590 15 $351,835 APPLICATIONS WITHDRAWN 4 $249,215 44 $379,134 91 $347,142 6 $231,147 0 $0 6 $471,440 FILES CLOSED FOR INCOMPLETENESS 1 $135,000 18 $347,622 46 $403,619 4 $158,765 0 $0 2 $273,950
Aggregated Statistics For Year 2007(Based on 6 full and 5 partial tracts) A) FHA, FSA/RHS & VA B) Conventional C) Refinancings D) Home Improvement Loans E) Loans on Dwellings For 5+ Families F) Non-occupant Loans on Number Average Value Number Average Value Number Average Value Number Average Value Number Average Value Number Average Value
LOANS ORIGINATED 1 $178,140 433 $349,280 787 $348,866 72 $195,788 3 $2,985,667 86 $278,494 APPLICATIONS APPROVED, NOT ACCEPTED 0 $0 71 $411,467 108 $351,951 18 $126,956 0 $0 15 $188,477 APPLICATIONS DENIED 0 $0 113 $452,598 265 $390,185 37 $130,605 0 $0 19 $399,620 APPLICATIONS WITHDRAWN 0 $0 34 $420,789 104 $373,396 13 $314,038 0 $0 4 $543,858 FILES CLOSED FOR INCOMPLETENESS 0 $0 16 $380,209 40 $380,104 0 $0 0 $0 3 $313,510
Aggregated Statistics For Year 2006(Based on 6 full and 5 partial tracts) A) FHA, FSA/RHS & VA B) Conventional C) Refinancings D) Home Improvement Loans E) Loans on Dwellings For 5+ Families F) Non-occupant Loans on Number Average Value Number Average Value Number Average Value Number Average Value Number Average Value Number Average Value
LOANS ORIGINATED 0 $0 628 $323,850 873 $345,446 81 $200,243 3 $1,157,787 101 $288,643 APPLICATIONS APPROVED, NOT ACCEPTED 0 $0 69 $312,227 109 $306,748 20 $121,967 1 $1,298,890 13 $329,449 APPLICATIONS DENIED 0 $0 126 $316,590 267 $371,182 42 $224,848 1 $1,404,200 18 $360,098 APPLICATIONS WITHDRAWN 2 $152,045 47 $351,574 142 $353,386 17 $183,528 0 $0 14 $395,247 FILES CLOSED FOR INCOMPLETENESS 0 $0 32 $334,356 47 $310,930 1 $142,690 0 $0 5 $440,794
Aggregated Statistics For Year 2005(Based on 6 full and 5 partial tracts) A) FHA, FSA/RHS & VA B) Conventional C) Refinancings D) Home Improvement Loans E) Loans on Dwellings For 5+ Families F) Non-occupant Loans on Number Average Value Number Average Value Number Average Value Number Average Value Number Average Value Number Average Value
LOANS ORIGINATED 1 $102,440 680 $330,392 944 $312,399 64 $220,811 7 $485,720 101 $303,308 APPLICATIONS APPROVED, NOT ACCEPTED 0 $0 110 $316,483 130 $290,954 13 $87,552 1 $7,540 12 $318,581 APPLICATIONS DENIED 0 $0 116 $312,252 238 $332,655 41 $116,276 2 $892,500 24 $257,333 APPLICATIONS WITHDRAWN 0 $0 68 $332,256 208 $296,809 15 $169,890 1 $782,940 12 $323,191 FILES CLOSED FOR INCOMPLETENESS 0 $0 15 $426,582 42 $385,236 6 $160,283 0 $0 2 $200,020
Aggregated Statistics For Year 2004(Based on 6 full and 5 partial tracts) A) FHA, FSA/RHS & VA B) Conventional C) Refinancings D) Home Improvement Loans E) Loans on Dwellings For 5+ Families F) Non-occupant Loans on G) Loans On Manufactured Number Average Value Number Average Value Number Average Value Number Average Value Number Average Value Number Average Value Number Average Value
LOANS ORIGINATED 2 $165,720 698 $295,116 1,115 $277,571 65 $149,747 1 $418,620 83 $245,505 1 $90,000 APPLICATIONS APPROVED, NOT ACCEPTED 1 $152,130 88 $314,780 123 $289,772 9 $51,454 0 $0 6 $223,405 0 $0 APPLICATIONS DENIED 1 $87,020 80 $331,752 246 $280,769 38 $94,072 0 $0 18 $327,093 0 $0 APPLICATIONS WITHDRAWN 0 $0 41 $336,354 188 $277,652 8 $89,599 0 $0 6 $315,245 0 $0 FILES CLOSED FOR INCOMPLETENESS 0 $0 19 $325,825 74 $307,593 4 $305,500 0 $0 5 $299,100 0 $0
Aggregated Statistics For Year 2003(Based on 6 full and 5 partial tracts) A) FHA, FSA/RHS & VA B) Conventional C) Refinancings D) Home Improvement Loans E) Loans on Dwellings For 5+ Families F) Non-occupant Loans on Number Average Value Number Average Value Number Average Value Number Average Value Number Average Value Number Average Value
LOANS ORIGINATED 4 $176,255 633 $283,345 3,298 $232,751 47 $109,816 12 $1,002,387 112 $207,709 APPLICATIONS APPROVED, NOT ACCEPTED 0 $0 61 $300,949 273 $228,895 10 $121,898 1 $370,330 6 $286,207 APPLICATIONS DENIED 0 $0 67 $321,128 370 $249,159 22 $47,693 0 $0 16 $290,642 APPLICATIONS WITHDRAWN 0 $0 44 $280,106 284 $232,211 3 $170,853 0 $0 13 $200,135 FILES CLOSED FOR INCOMPLETENESS 0 $0 9 $340,413 74 $310,485 3 $64,913 0 $0 4 $252,382
Aggregated Statistics For Year 2002(Based on 6 full and 5 partial tracts) A) FHA, FSA/RHS & VA B) Conventional C) Refinancings D) Home Improvement Loans E) Loans on Dwellings For 5+ Families F) Non-occupant Loans on Number Average Value Number Average Value Number Average Value Number Average Value Number Average Value Number Average Value
LOANS ORIGINATED 6 $184,590 597 $252,839 2,351 $234,962 60 $80,452 10 $1,601,062 68 $203,997 APPLICATIONS APPROVED, NOT ACCEPTED 1 $160,380 62 $255,587 207 $210,617 16 $63,868 0 $0 4 $169,620 APPLICATIONS DENIED 2 $146,595 38 $246,949 203 $237,311 24 $51,935 0 $0 10 $229,034 APPLICATIONS WITHDRAWN 0 $0 27 $255,156 205 $249,663 4 $83,255 0 $0 4 $179,440 FILES CLOSED FOR INCOMPLETENESS 0 $0 10 $332,713 84 $244,308 2 $65,120 0 $0 4 $158,305
Aggregated Statistics For Year 2001(Based on 6 full and 5 partial tracts) A) FHA, FSA/RHS & VA B) Conventional C) Refinancings D) Home Improvement Loans E) Loans on Dwellings For 5+ Families F) Non-occupant Loans on Number Average Value Number Average Value Number Average Value Number Average Value Number Average Value Number Average Value
LOANS ORIGINATED 7 $207,607 634 $245,160 1,772 $223,667 83 $69,425 4 $960,085 49 $188,967 APPLICATIONS APPROVED, NOT ACCEPTED 1 $256,450 32 $246,943 175 $195,304 26 $47,508 1 $1,313,000 6 $233,540 APPLICATIONS DENIED 1 $161,290 39 $205,797 183 $217,992 29 $68,442 1 $261,790 12 $205,858 APPLICATIONS WITHDRAWN 2 $159,000 30 $248,747 117 $211,292 21 $50,144 0 $0 8 $181,816 FILES CLOSED FOR INCOMPLETENESS 0 $0 10 $268,408 63 $187,141 1 $260,000 0 $0 1 $182,710
Aggregated Statistics For Year 2000(Based on 6 full and 5 partial tracts) A) FHA, FSA/RHS & VA B) Conventional C) Refinancings D) Home Improvement Loans E) Loans on Dwellings For 5+ Families F) Non-occupant Loans on Number Average Value Number Average Value Number Average Value Number Average Value Number Average Value Number Average Value
LOANS ORIGINATED 12 $179,702 680 $223,292 391 $191,737 108 $58,057 5 $804,330 42 $172,866 APPLICATIONS APPROVED, NOT ACCEPTED 2 $101,410 40 $202,386 64 $168,748 23 $47,992 0 $0 5 $194,302 APPLICATIONS DENIED 2 $131,475 46 $214,405 119 $175,447 26 $100,667 6 $637,897 6 $115,280 APPLICATIONS WITHDRAWN 0 $0 39 $244,165 85 $157,247 20 $62,297 0 $0 3 $116,477 FILES CLOSED FOR INCOMPLETENESS 0 $0 15 $277,768 35 $235,363 3 $48,503 0 $0 1 $88,310
Aggregated Statistics For Year 1999(Based on 6 full and 5 partial tracts) A) FHA, FSA/RHS & VA B) Conventional C) Refinancings D) Home Improvement Loans E) Loans on Dwellings For 5+ Families F) Non-occupant Loans on Number Average Value Number Average Value Number Average Value Number Average Value Number Average Value Number Average Value
LOANS ORIGINATED 18 $160,338 661 $196,980 768 $180,886 109 $49,997 4 $368,492 45 $144,549 APPLICATIONS APPROVED, NOT ACCEPTED 0 $0 53 $226,908 101 $142,001 17 $39,324 0 $0 5 $151,954 APPLICATIONS DENIED 1 $60,880 69 $196,233 121 $170,305 26 $35,562 0 $0 7 $127,986 APPLICATIONS WITHDRAWN 0 $0 46 $214,543 112 $173,107 22 $69,281 1 $216,270 6 $166,413 FILES CLOSED FOR INCOMPLETENESS 0 $0 15 $206,125 45 $202,276 5 $81,404 0 $0 1 $181,800
Detailed mortgage data for all 11 tracts in Park Ridge, IL
Private Mortgage Insurance Companies Aggregated Statistics For Year 2009(Based on 6 full and 5 partial tracts) A) Conventional B) Refinancings C) Non-occupant Loans on Number Average Value Number Average Value Number Average Value
LOANS ORIGINATED 26 $295,837 13 $322,335 1 $196,000 APPLICATIONS APPROVED, NOT ACCEPTED 11 $291,715 4 $302,342 0 $0 APPLICATIONS DENIED 3 $264,097 1 $380,870 0 $0 APPLICATIONS WITHDRAWN 2 $213,375 2 $335,575 0 $0 FILES CLOSED FOR INCOMPLETENESS 1 $80,280 0 $0 0 $0
Aggregated Statistics For Year 2008(Based on 6 full and 5 partial tracts) A) Conventional B) Refinancings C) Non-occupant Loans on Number Average Value Number Average Value Number Average Value
LOANS ORIGINATED 60 $313,654 16 $314,250 2 $284,480 APPLICATIONS APPROVED, NOT ACCEPTED 11 $270,105 16 $366,599 0 $0 APPLICATIONS DENIED 4 $282,345 2 $399,225 2 $430,355 APPLICATIONS WITHDRAWN 10 $399,797 1 $265,010 0 $0 FILES CLOSED FOR INCOMPLETENESS 0 $0 2 $211,710 0 $0
Aggregated Statistics For Year 2007(Based on 6 full and 5 partial tracts) A) Conventional B) Refinancings C) Non-occupant Loans on Number Average Value Number Average Value Number Average Value
LOANS ORIGINATED 38 $299,726 20 $314,074 5 $335,736 APPLICATIONS APPROVED, NOT ACCEPTED 5 $263,158 7 $311,176 0 $0 APPLICATIONS DENIED 1 $395,000 0 $0 0 $0 APPLICATIONS WITHDRAWN 1 $465,110 3 $289,217 0 $0 FILES CLOSED FOR INCOMPLETENESS 0 $0 0 $0 0 $0
Aggregated Statistics For Year 2006(Based on 5 full and 5 partial tracts) A) Conventional B) Refinancings C) Non-occupant Loans on Number Average Value Number Average Value Number Average Value
LOANS ORIGINATED 29 $268,996 9 $331,396 3 $350,003 APPLICATIONS APPROVED, NOT ACCEPTED 4 $328,275 3 $223,853 0 $0 APPLICATIONS DENIED 1 $405,000 0 $0 1 $405,000 APPLICATIONS WITHDRAWN 0 $0 1 $296,910 0 $0 FILES CLOSED FOR INCOMPLETENESS 0 $0 0 $0 0 $0
Aggregated Statistics For Year 2005(Based on 6 full and 5 partial tracts) A) Conventional B) Refinancings C) Non-occupant Loans on Number Average Value Number Average Value Number Average Value
LOANS ORIGINATED 39 $302,827 18 $290,882 2 $356,760 APPLICATIONS APPROVED, NOT ACCEPTED 5 $252,984 6 $293,962 1 $296,990 APPLICATIONS DENIED 1 $411,000 0 $0 0 $0 APPLICATIONS WITHDRAWN 3 $253,820 2 $243,660 0 $0 FILES CLOSED FOR INCOMPLETENESS 2 $257,350 1 $325,910 0 $0
Aggregated Statistics For Year 2004(Based on 6 full and 5 partial tracts) A) Conventional B) Refinancings C) Non-occupant Loans on Number Average Value Number Average Value Number Average Value
LOANS ORIGINATED 70 $246,857 13 $271,975 7 $290,270 APPLICATIONS APPROVED, NOT ACCEPTED 13 $280,808 6 $230,017 2 $264,610 APPLICATIONS DENIED 1 $491,470 2 $309,660 1 $378,000 APPLICATIONS WITHDRAWN 1 $339,680 2 $131,500 1 $100,000 FILES CLOSED FOR INCOMPLETENESS 1 $224,750 1 $164,090 0 $0
Aggregated Statistics For Year 2003(Based on 6 full and 5 partial tracts) A) Conventional B) Refinancings C) Non-occupant Loans on Number Average Value Number Average Value Number Average Value
LOANS ORIGINATED 75 $264,582 45 $248,999 4 $195,790 APPLICATIONS APPROVED, NOT ACCEPTED 13 $342,326 10 $252,001 1 $157,970 APPLICATIONS DENIED 3 $318,673 0 $0 0 $0 APPLICATIONS WITHDRAWN 3 $189,487 5 $196,980 2 $158,000 FILES CLOSED FOR INCOMPLETENESS 1 $720,000 1 $84,000 0 $0
Aggregated Statistics For Year 2002(Based on 6 full and 5 partial tracts) A) Conventional B) Refinancings C) Non-occupant Loans on Number Average Value Number Average Value Number Average Value
LOANS ORIGINATED 84 $232,552 52 $225,325 3 $262,467 APPLICATIONS APPROVED, NOT ACCEPTED 11 $240,742 7 $195,996 1 $59,810 APPLICATIONS DENIED 4 $243,565 1 $391,780 0 $0 APPLICATIONS WITHDRAWN 5 $213,392 2 $302,785 1 $98,000 FILES CLOSED FOR INCOMPLETENESS 1 $188,750 0 $0 0 $0
Aggregated Statistics For Year 2001(Based on 6 full and 5 partial tracts) A) Conventional B) Refinancings C) Non-occupant Loans on Number Average Value Number Average Value Number Average Value
LOANS ORIGINATED 102 $216,179 44 $218,320 4 $172,162 APPLICATIONS APPROVED, NOT ACCEPTED 15 $240,443 9 $241,301 0 $0 APPLICATIONS DENIED 3 $202,703 1 $111,800 0 $0 APPLICATIONS WITHDRAWN 6 $187,512 1 $296,580 0 $0 FILES CLOSED FOR INCOMPLETENESS 1 $191,550 1 $206,870 0 $0
Aggregated Statistics For Year 2000(Based on 6 full and 5 partial tracts) A) Conventional B) Refinancings C) Non-occupant Loans on Number Average Value Number Average Value Number Average Value
LOANS ORIGINATED 100 $198,948 12 $233,772 3 $134,337 APPLICATIONS APPROVED, NOT ACCEPTED 12 $189,177 2 $152,085 0 $0 APPLICATIONS DENIED 5 $252,952 2 $244,265 0 $0 APPLICATIONS WITHDRAWN 6 $232,395 2 $245,775 0 $0 FILES CLOSED FOR INCOMPLETENESS 1 $236,460 0 $0 0 $0
Aggregated Statistics For Year 1999(Based on 6 full and 5 partial tracts) A) Conventional B) Refinancings C) Non-occupant Loans on Number Average Value Number Average Value Number Average Value
LOANS ORIGINATED 112 $197,666 25 $190,914 1 $112,500 APPLICATIONS APPROVED, NOT ACCEPTED 12 $200,101 8 $210,864 1 $183,000 APPLICATIONS DENIED 8 $194,964 3 $299,503 1 $102,140 APPLICATIONS WITHDRAWN 4 $252,815 4 $171,875 1 $304,620 FILES CLOSED FOR INCOMPLETENESS 2 $186,045 0 $0 0 $0
Most common first names in Park Ridge, IL among deceased individuals Name Count Lived (average)
John 423 76.9 years Mary 290 81.9 years William 271 75.4 years Helen 229 83.3 years Robert 217 71.9 years George 199 77.8 years Joseph 195 77.3 years Margaret 182 81.2 years Anna 180 86.0 years Frank 180 78.3 years
Most common last names in Park Ridge, IL among deceased individuals Last name Count Lived (average)
Johnson 122 79.6 years Nelson 86 80.8 years Anderson 81 82.3 years Smith 59 81.0 years Miller 59 79.2 years Peterson 38 79.6 years Olson 36 82.0 years Murphy 32 77.2 years Hansen 31 80.5 years Brown 31 82.5 years
Park Ridge compared to Illinois state average:
Median household income above state average. Median house value above state average. Unemployed percentage significantly below state average. Black race population percentage significantly below state average. Hispanic race population percentage below state average. Median age above state average. Renting percentage below state average. Length of stay since moving in significantly above state average. Percentage of population with a bachelor's degree or higher significantly above state average. Park Ridge on our top lists :
#32 on the list of "Top 101 cities with the most local government spending on current operations of libraries per resident (population 10,000+)"
#38 on the list of "Top 101 cities with the most full-time local library workers per 1000 residents (population 5,000+)"
#38 on the list of "Top 101 cities where residents moved in more then 10 years ago (10,000+ households)"
#52 on the list of "Top 101 cities with the most residents born in Poland (population 500+)"
#1 on the list of "Top 101 counties with the most Black Protestant congregations"
#1 on the list of "Top 101 counties with the most Catholic congregations"
#1 on the list of "Top 101 counties with the highest surface withdrawal of fresh water for public supply"
#2 on the list of "Top 101 counties with the most Black Protestant adherents"
#2 on the list of "Top 101 counties with the most Orthodox congregations (pop. 50,000+)"
Top Patent Applicants
Colin D. Frank (32)
Tyrone D. Bekiares (22)
Randall G. Forrest (18)
Ethan S. Wozniak (14)
Joseph Plewa (13)
Robert R. Keller, Jr. (12)
Colin Frank (11)
Patrick D. Walker (11)
Geoffry A. Westphal (10)
Renee Luka (9)
Total of 502 patent applications in 2008-2024.
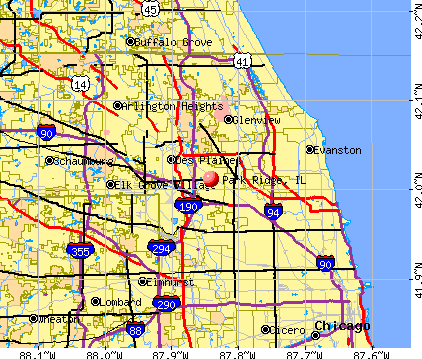


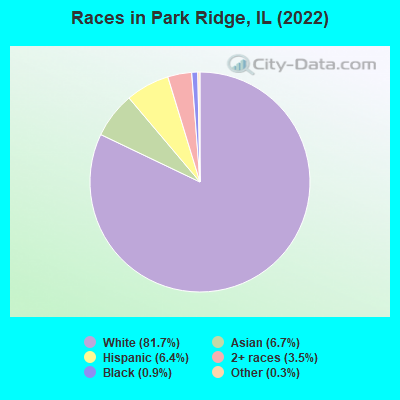
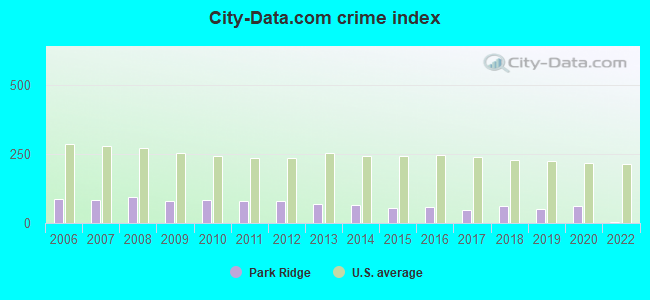
 Recent articles from our blog. Our writers, many of them Ph.D. graduates or candidates, create easy-to-read articles on a wide variety of topics.

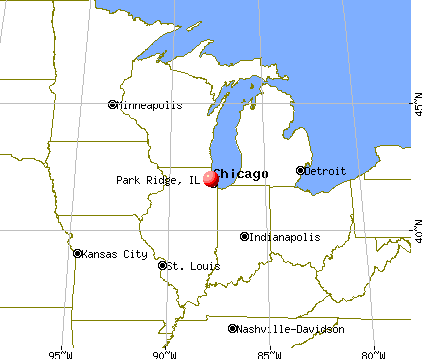
 (3.4 miles
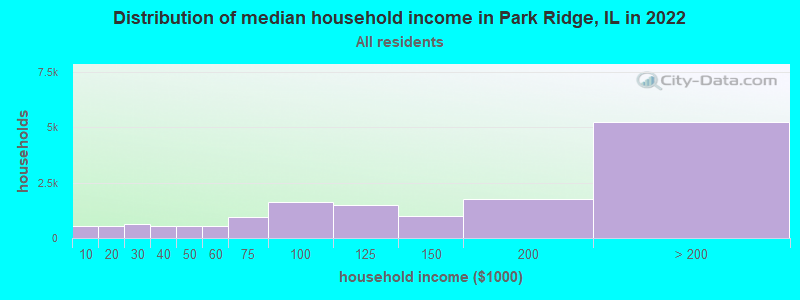
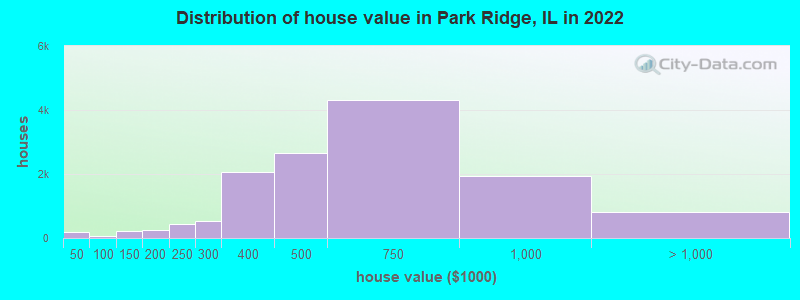
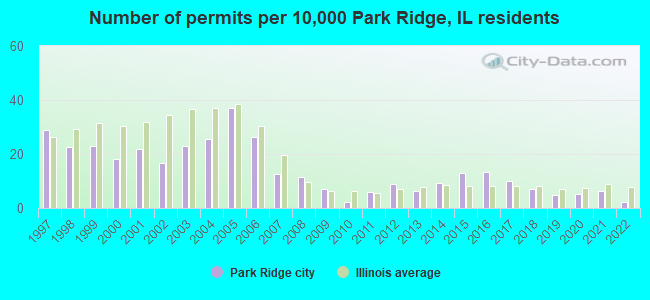
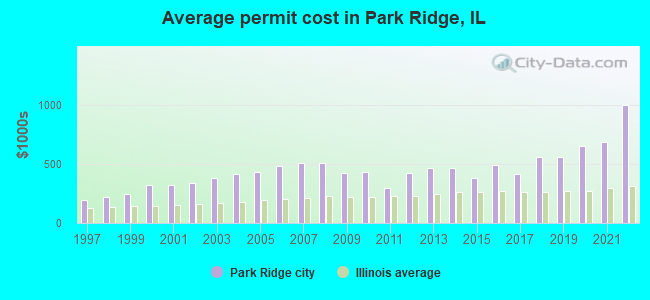
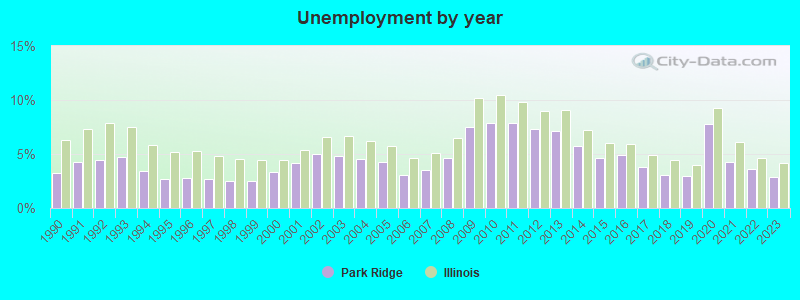
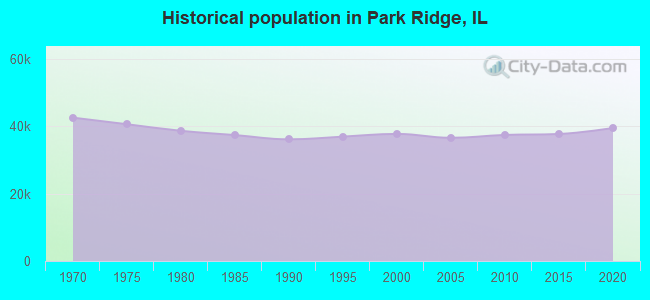
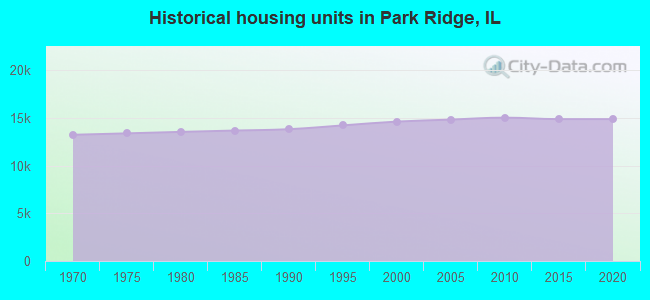
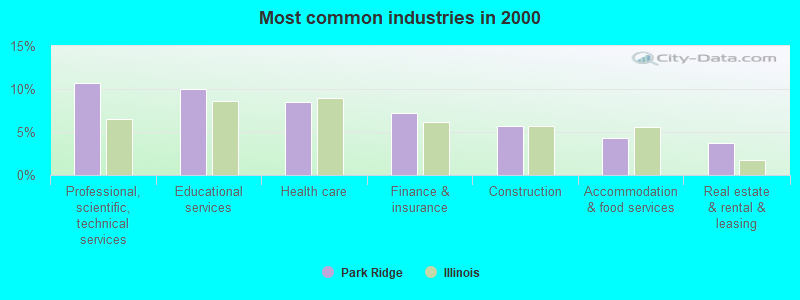
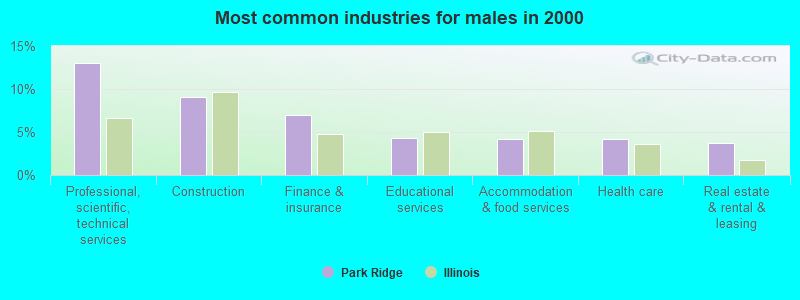
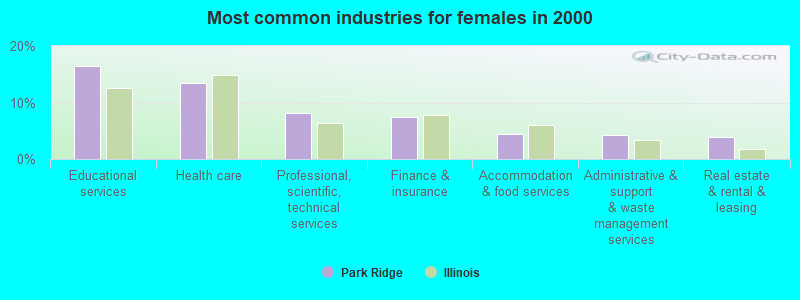
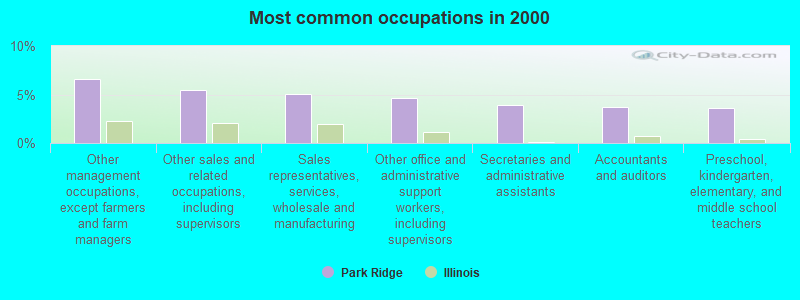
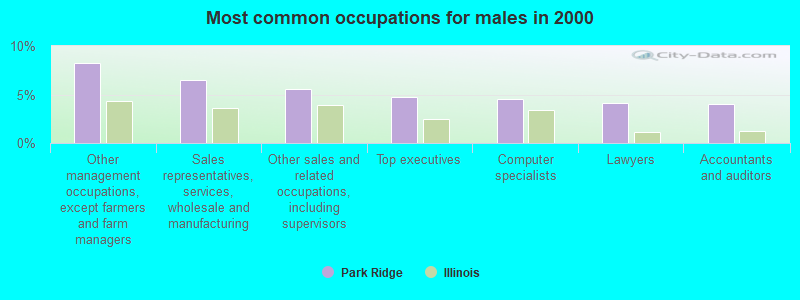
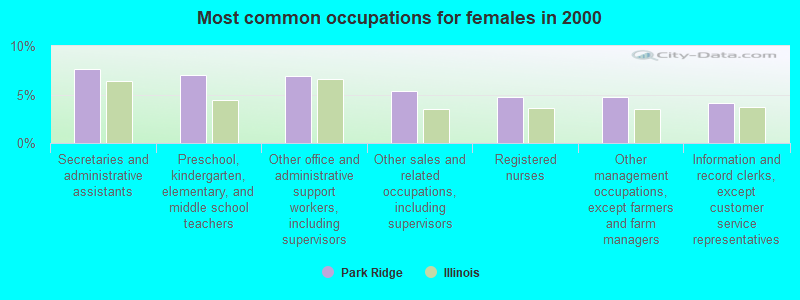
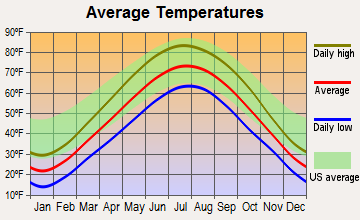
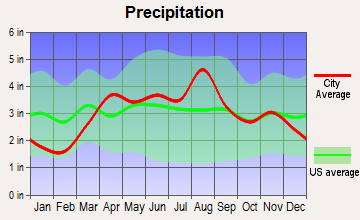
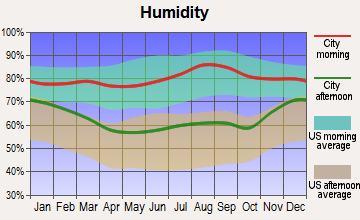
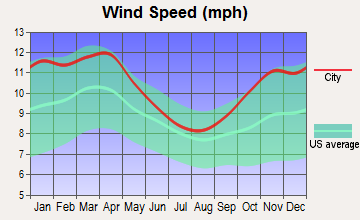
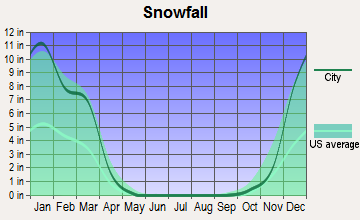
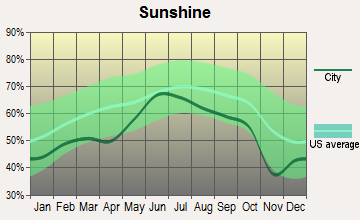
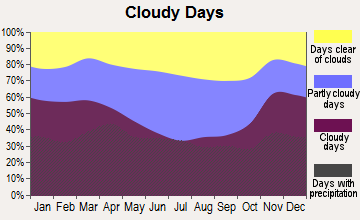


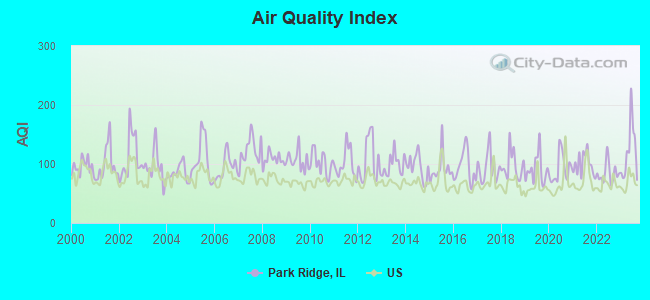
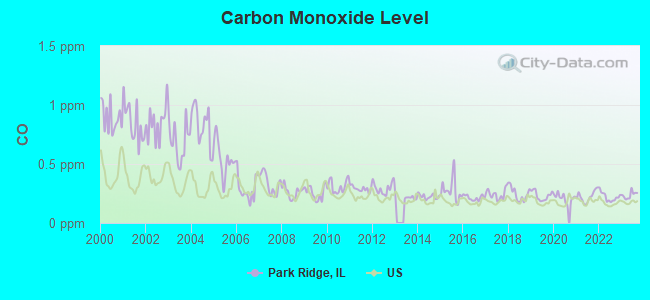
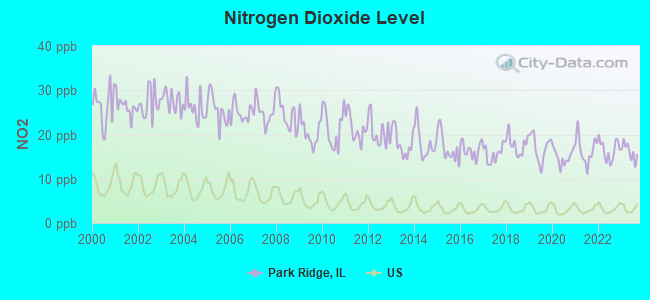
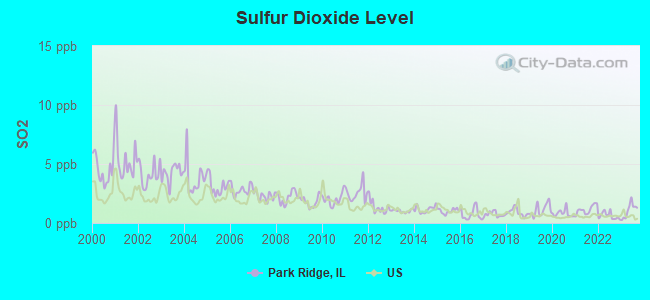
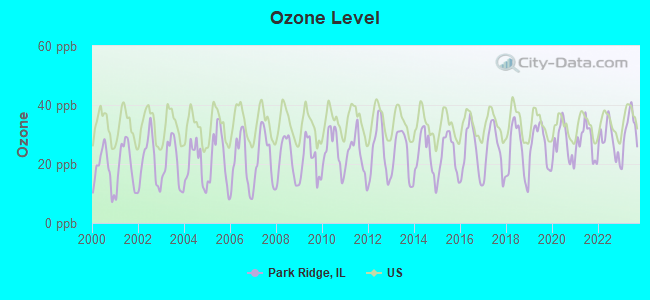
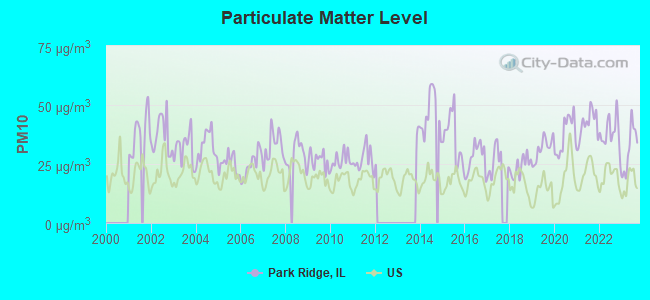
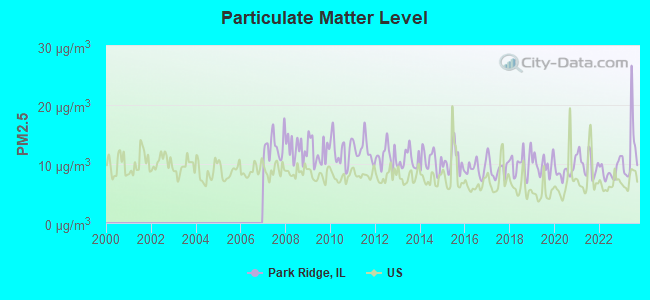
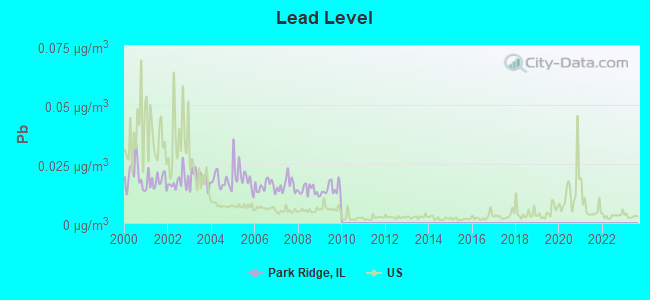

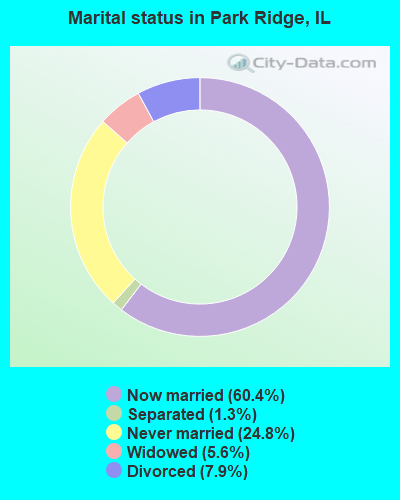
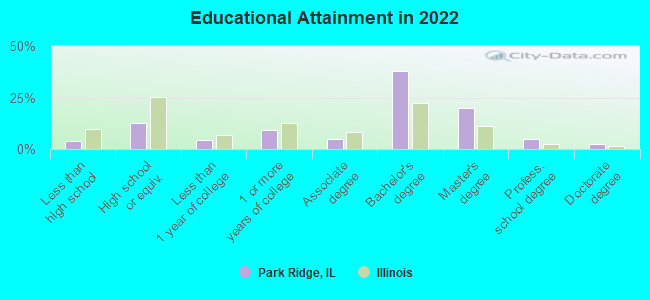
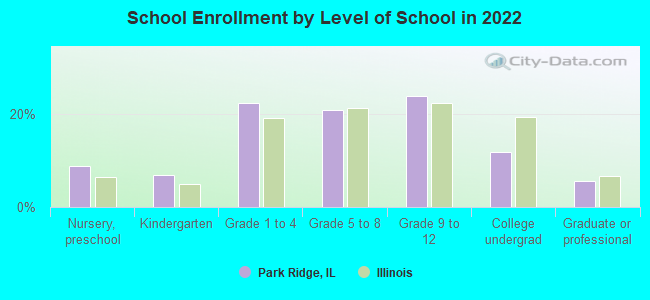
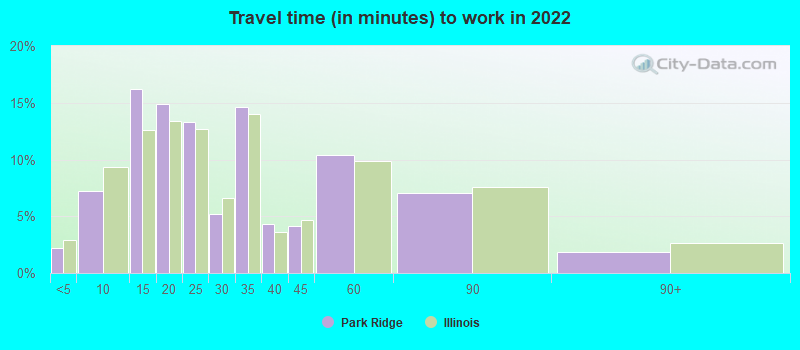
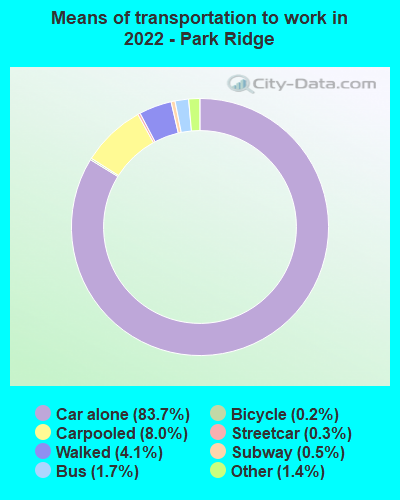


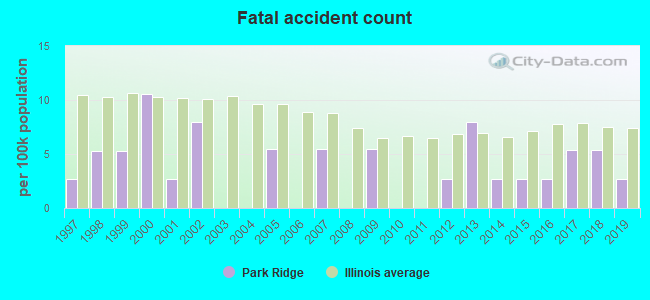
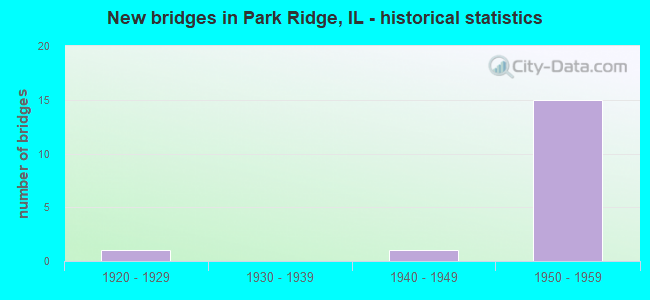
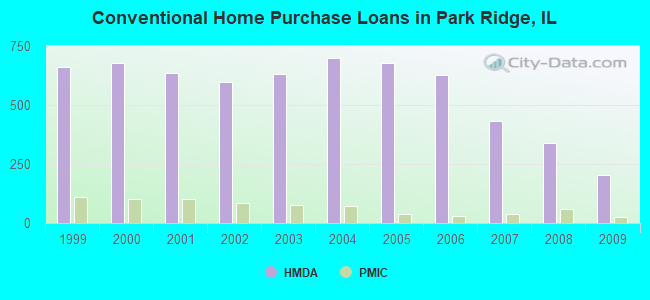
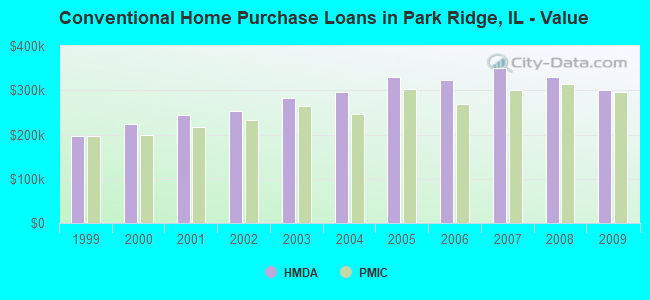
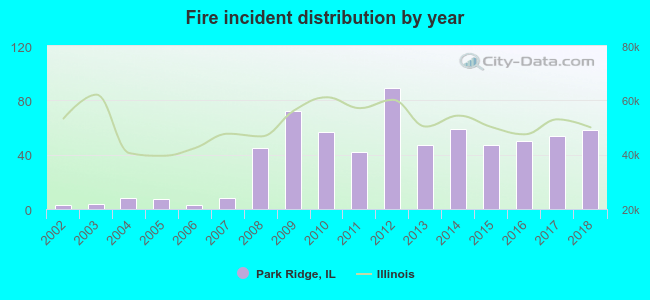 According to the data from the years 2002 - 2018 the average number of fire incidents per year is 38. The highest number of reported fires - 89 took place in 2012, and the least - 3 in 2002. The data has a growing trend.
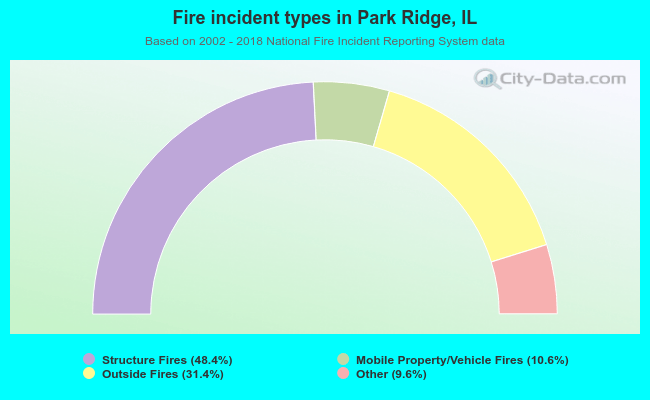 When looking into fire subcategories, the most reports belonged to: Structure Fires (48.4%), and Outside Fires (31.4%).