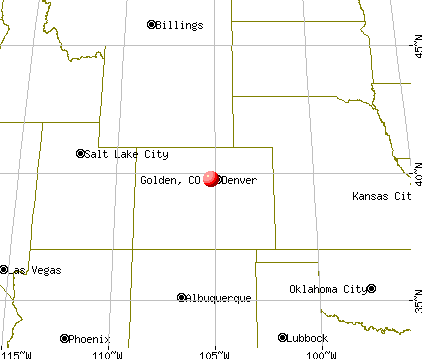
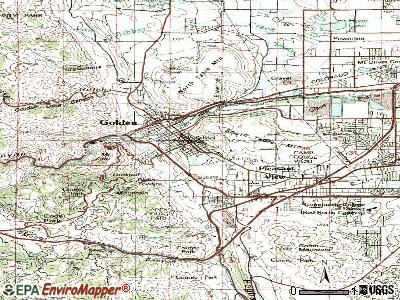
Golden, Colorado
Golden: Museum
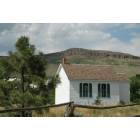
Golden: Museum
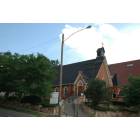
Golden: Church
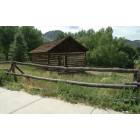
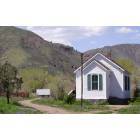
Golden: City of Goldenville
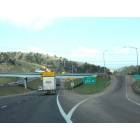
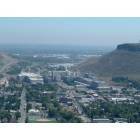
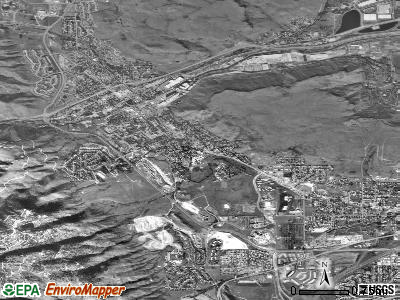
Golden: I-70 in mountains West of Golden
Golden: A church in Golden, Colorado

Golden: Buffalo Bill
Golden: Museum
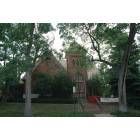
Golden: Church
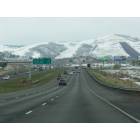
Golden: I-70 in Golden
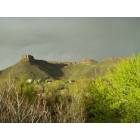
Golden: Table Mtn with dramatic lighting
- see
42
more - add
your
Submit your own pictures of this city and show them to the world
- OSM Map
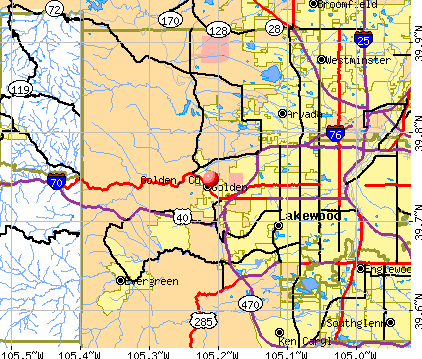
- General Map
- Google Map
- MSN Map
Population change since 2000: +19.2%
 |
| Males: 11,973 | |
| Females: 8,487 |
| Median resident age: | 35.7 years |
| Colorado median age: | 37.7 years |
Zip codes: 80419.
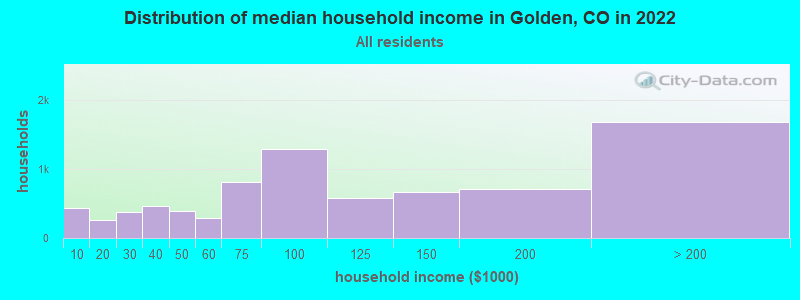
| Golden: | $90,605 |
| CO: | $89,302 |
Estimated per capita income in 2022: $54,951 (it was $25,257 in 2000)
Golden city income, earnings, and wages data
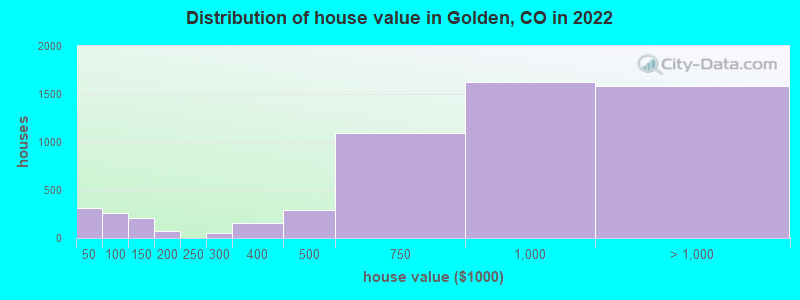
Estimated median house or condo value in 2022: $798,335 (it was $183,800 in 2000)
| Golden: | $798,335 |
| CO: | $531,100 |
Mean prices in 2022: all housing units: $682,162; detached houses: $737,960; townhouses or other attached units: $479,224; in 2-unit structures: $368,153; in 3-to-4-unit structures: $369,160; in 5-or-more-unit structures: $327,636; mobile homes: $135,995; occupied boats, rvs, vans, etc.: $59,729
Median gross rent in 2022: $1,747.
(10.1% for White Non-Hispanic residents, 12.3% for Black residents, 4.5% for Hispanic or Latino residents, 8.1% for other race residents, 13.1% for two or more races residents)
Detailed information about poverty and poor residents in Golden, CO


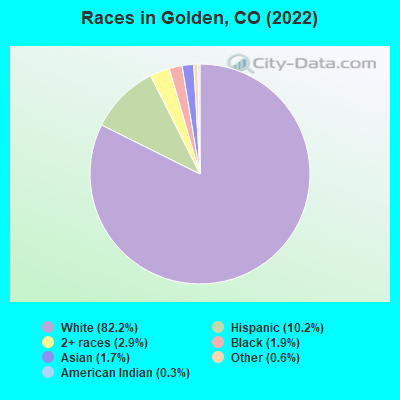
- 16,68482.2%White alone
- 2,07510.2%Hispanic
- 5952.9%Two or more races
- 3791.9%Black alone
- 3501.7%Asian alone
- 1130.6%Other race alone
- 590.3%American Indian alone
- 20.01%Native Hawaiian and Other
Pacific Islander alone
According to our research of Colorado and other state lists, there were 102 registered sex offenders living in Golden, Colorado as of April 27, 2024.
The ratio of all residents to sex offenders in Golden is 203 to 1.
Type |
2009 |
2010 |
2011 |
2012 |
2013 |
2014 |
2015 |
2016 |
2017 |
2018 |
2019 |
2020 |
2021 |
2022 |
|---|---|---|---|---|---|---|---|---|---|---|---|---|---|---|
| Murders (per 100,000) | 1 (5.8) | 0 (0.0) | 1 (5.2) | 0 (0.0) | 1 (5.2) | 1 (5.1) | 0 (0.0) | 0 (0.0) | 1 (4.8) | 0 (0.0) | 0 (0.0) | 0 (0.0) | 0 (0.0) | 0 (0.0) |
| Rapes (per 100,000) | 2 (11.5) | 2 (10.6) | 2 (10.4) | 3 (15.5) | 5 (25.9) | 9 (46.0) | 7 (34.2) | 4 (19.4) | 7 (33.4) | 21 (101.1) | 1 (4.6) | 5 (23.8) | 2 (9.8) | 2 (10.2) |
| Robberies (per 100,000) | 2 (11.5) | 3 (15.9) | 10 (52.1) | 4 (20.7) | 6 (31.0) | 3 (15.3) | 2 (9.8) | 3 (14.6) | 3 (14.3) | 2 (9.6) | 9 (41.8) | 5 (23.8) | 2 (9.8) | 3 (15.3) |
| Assaults (per 100,000) | 37 (213.5) | 16 (84.8) | 28 (145.9) | 24 (124.4) | 17 (87.9) | 31 (158.5) | 19 (92.9) | 24 (116.4) | 12 (57.3) | 27 (130.0) | 33 (153.3) | 23 (109.6) | 43 (209.8) | 36 (183.3) |
| Burglaries (per 100,000) | 66 (380.8) | 60 (318.0) | 59 (307.4) | 56 (290.2) | 43 (222.4) | 44 (225.0) | 45 (220.1) | 36 (174.6) | 58 (276.9) | 55 (264.8) | 54 (250.9) | 120 (571.9) | 85 (414.7) | 112 (570.3) |
| Thefts (per 100,000) | 367 (2,117) | 339 (1,797) | 358 (1,865) | 397 (2,057) | 334 (1,728) | 299 (1,529) | 340 (1,663) | 402 (1,950) | 486 (2,320) | 457 (2,201) | 504 (2,342) | 523 (2,493) | 519 (2,532) | 584 (2,974) |
| Auto thefts (per 100,000) | 20 (115.4) | 11 (58.3) | 25 (130.2) | 19 (98.5) | 25 (129.3) | 32 (163.6) | 38 (185.8) | 42 (203.7) | 53 (253.0) | 53 (255.2) | 47 (218.4) | 88 (419.4) | 121 (590.3) | 101 (514.3) |
| Arson (per 100,000) | 5 (28.8) | 4 (21.2) | 4 (20.8) | 2 (10.4) | 3 (15.5) | 5 (25.6) | 4 (19.6) | 1 (4.9) | 3 (14.3) | 3 (14.4) | 4 (18.6) | 4 (19.1) | 8 (39.0) | 6 (30.6) |
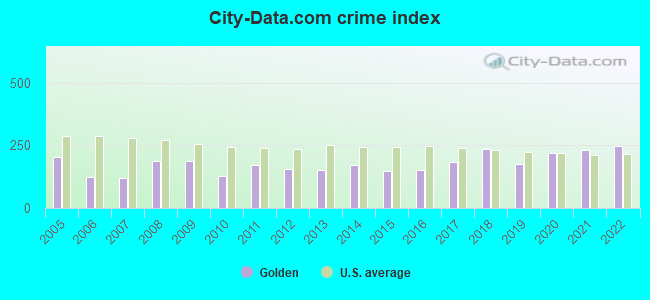
| City-Data.com crime index | 187.5 | 129.0 | 170.1 | 154.0 | 152.9 | 173.3 | 145.7 | 149.7 | 184.5 | 236.8 | 175.6 | 221.4 | 230.2 | 249.4 |
The City-Data.com crime index weighs serious crimes and violent crimes more heavily. Higher means more crime, U.S. average is 246.1. It adjusts for the number of visitors and daily workers commuting into cities.
Crime rate in Golden detailed stats: murders, rapes, robberies, assaults, burglaries, thefts, arson
Full-time law enforcement employees in 2021, including police officers: 65 (50 officers - 41 male; 9 female).
| Officers per 1,000 residents here: | 2.44 |
| Colorado average: | 2.14 |
 Recent articles from our blog. Our writers, many of them Ph.D. graduates or candidates, create easy-to-read articles on a wide variety of topics.

 | Is the poor ozone AQI in Golden worth worrying about? (21 replies) |
| Moving to Golden, Colorado — Advice (3 replies) |
| Golden is ranked as EXCEPTIONALLY LIVABLE (55 replies) |
| Arvada (West Woods), Golden (Tablerock) or Broomfield (McKay/Broadlands) (10 replies) |
| Rock Climber Comparing Golden to Boulder (2 replies) |
| Dilemma: Golden vs Boulder (25 replies) |
Latest news from Golden, CO collected exclusively by city-data.com from local newspapers, TV, and radio stations
Ancestries: English (11.8%), European (10.3%), German (9.6%), Irish (6.6%), American (5.6%), Russian (3.6%).
Current Local Time: MST time zone
Incorporated on 6/33/1886
Elevation: 5674 feet
Land area: 9.01 square miles.
Population density: 2,272 people per square mile (low).
1,282 residents are foreign born (2.2% Europe, 1.8% Latin America, 1.2% Asia).
| This city: | 6.3% |
| Colorado: | 9.5% |
Median real estate property taxes paid for housing units with mortgages in 2022: $3,586 (0.4%)
Median real estate property taxes paid for housing units with no mortgage in 2022: $3,167 (0.5%)
Nearest city with pop. 50,000+: Northeast Jefferson, CO (5.5 miles  , pop. 450,166).
Nearest city with pop. 1,000,000+: Phoenix, AZ (574.2 miles , pop. 1,321,045).
Nearest cities:
), ), ), ), ), ), Latitude: 39.75 N, Longitude: 105.21 W
Daytime population change due to commuting: +14,584 (+71.8%)
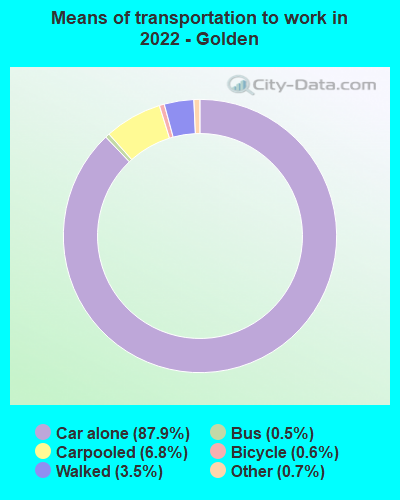
Workers who live and work in this city: 5,666 (53.6%)
Golden tourist attractions:
- Buffalo Bill Grave and Museum - Golden, CO - a look into a controversial piece of history
- National Earthquake Information Center - Golden, CO - information and education on earthquakes
- Denver Marriott West - Golden, CO - luxury hotel with numerous amenities
- Bradford Washburn American Mountaineering Museum - Golden, CO - the history of mountain exploration brought to life
- Lookout Mountain - Golden, CO - a park allowing visitors to enjoy the view from the mountain and discover nature
- Golden Gate Canyon State Park - Golden, CO - a multifunctional vacation spot
- Colorado School of Mines Geology Museum - Golden, CO - a museum dedicated to mining and minerals
- Heritage Square - Golden, CO - a diverse shopping area that originally opened as a theme park
- Rocky Mountain Quilt Museum - Golden, CO - history preserved in quilts
- Golden Pioneer Museum - Golden, CO - history shown through artifacts from the pioneers
- Astor House Museum - Golden, CO - a hotel rich in history and tradition
- Coors Brewery - Golden, CO - a brewing company known for quality
- Colorado Railroad Museum - Golden, CO - a piece of transportation history
- Foothills Art Center - Golden, CO - Engaging education into the world of art
- Golden City Brewery - Golden, CO - Serving up legendary ales in a converted residential home
- Hakushika Sake USA - Golden, CO - Sake made from Rocky Mountain water in the heart of Golden
- Heritage Square Amusement Park - Fish and Farm - Golden, CO - An amusement park with rides, arcade games, mini golf, and more
Golden, Colorado accommodation & food services, waste management - Economy and Business Data
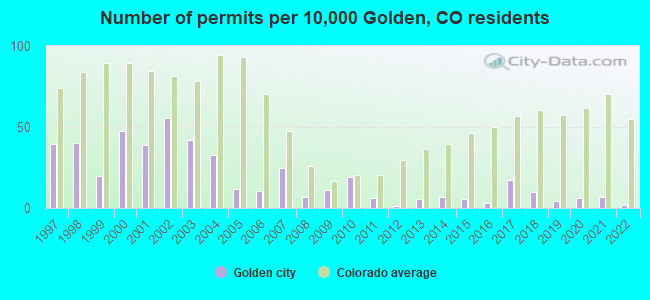
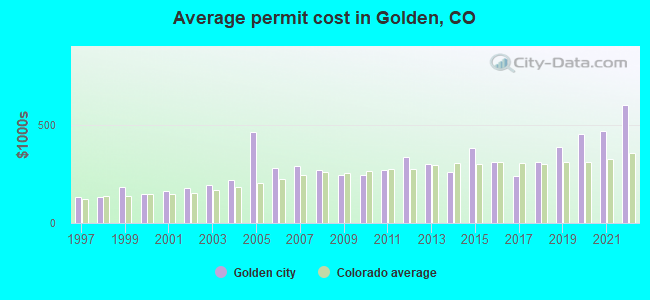
Single-family new house construction building permits:
- 2022: 3 buildings, average cost: $600,000
- 2021: 12 buildings, average cost: $467,400
- 2020: 11 buildings, average cost: $450,600
- 2019: 7 buildings, average cost: $385,700
- 2018: 17 buildings, average cost: $311,700
- 2017: 30 buildings, average cost: $236,700
- 2016: 5 buildings, average cost: $309,300
- 2015: 9 buildings, average cost: $381,900
- 2014: 12 buildings, average cost: $258,200
- 2013: 9 buildings, average cost: $302,000
- 2012: 2 buildings, average cost: $337,500
- 2011: 11 buildings, average cost: $269,000
- 2010: 33 buildings, average cost: $242,600
- 2009: 19 buildings, average cost: $246,400
- 2008: 12 buildings, average cost: $268,100
- 2007: 42 buildings, average cost: $288,200
- 2006: 18 buildings, average cost: $278,100
- 2005: 20 buildings, average cost: $460,900
- 2004: 56 buildings, average cost: $217,600
- 2003: 72 buildings, average cost: $191,800
- 2002: 95 buildings, average cost: $180,300
- 2001: 67 buildings, average cost: $165,100
- 2000: 82 buildings, average cost: $148,200
- 1999: 34 buildings, average cost: $181,900
- 1998: 69 buildings, average cost: $131,700
- 1997: 68 buildings, average cost: $134,300
| Here: | 3.1% |
| Colorado: | 3.2% |
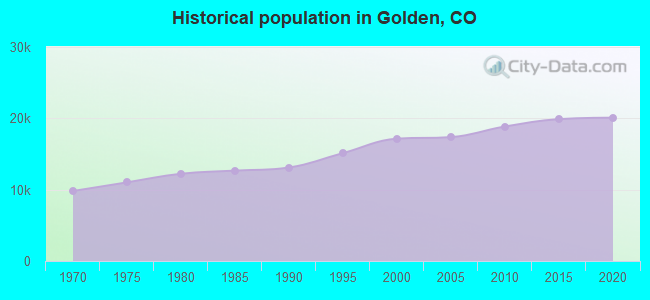
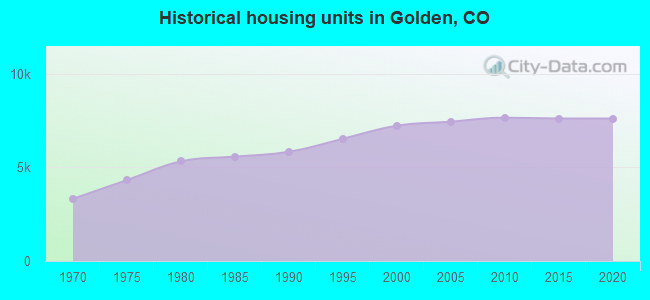
Population change in the 1990s: +4,211 (+32.5%).
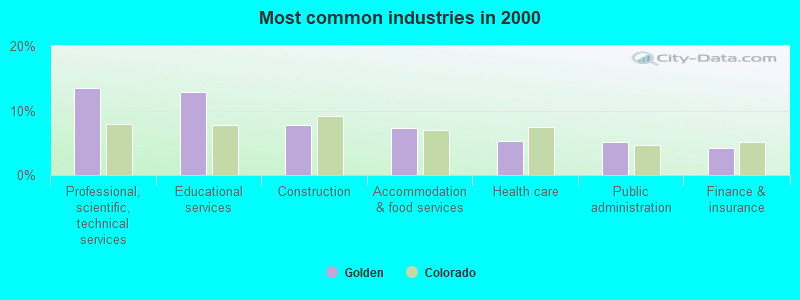
- Professional, scientific, technical services (13.5%)
- Educational services (12.8%)
- Construction (7.7%)
- Accommodation & food services (7.3%)
- Health care (5.3%)
- Public administration (5.2%)
- Finance & insurance (4.2%)

- Professional, scientific, technical services (13.6%)
- Construction (12.0%)
- Educational services (10.9%)
- Accommodation & food services (7.0%)
- Public administration (4.6%)
- Administrative & support & waste management services (3.5%)
- Broadcasting & telecommunications (3.3%)
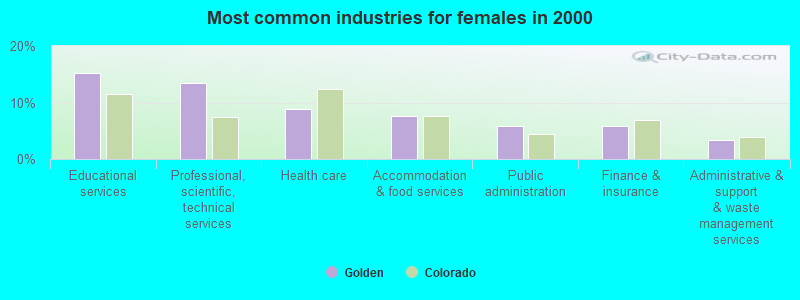
- Educational services (15.2%)
- Professional, scientific, technical services (13.4%)
- Health care (8.9%)
- Accommodation & food services (7.7%)
- Public administration (5.9%)
- Finance & insurance (5.8%)
- Administrative & support & waste management services (3.3%)
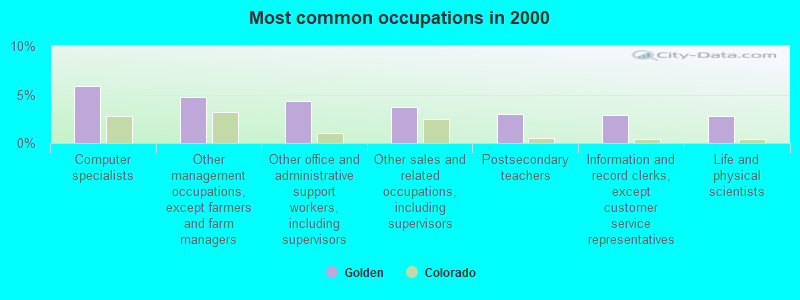
- Computer specialists (5.9%)
- Other management occupations, except farmers and farm managers (4.7%)
- Other office and administrative support workers, including supervisors (4.3%)
- Other sales and related occupations, including supervisors (3.7%)
- Postsecondary teachers (3.0%)
- Information and record clerks, except customer service representatives (2.8%)
- Life and physical scientists (2.8%)
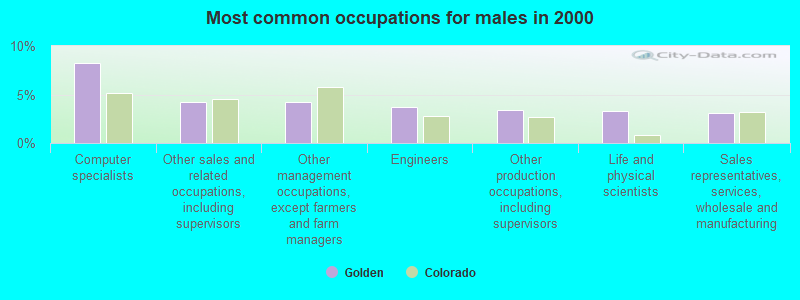
- Computer specialists (8.2%)
- Other sales and related occupations, including supervisors (4.2%)
- Other management occupations, except farmers and farm managers (4.2%)
- Engineers (3.7%)
- Other production occupations, including supervisors (3.4%)
- Life and physical scientists (3.3%)
- Sales representatives, services, wholesale and manufacturing (3.1%)
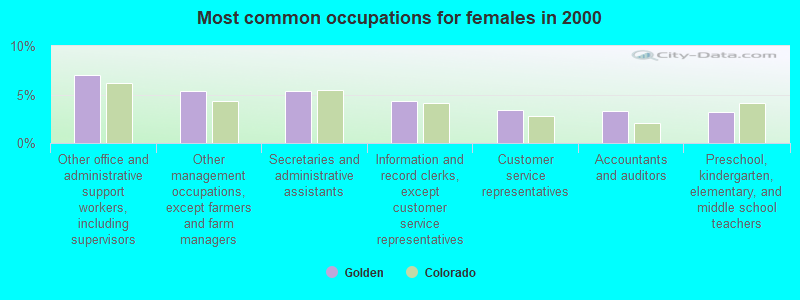
- Other office and administrative support workers, including supervisors (7.0%)
- Other management occupations, except farmers and farm managers (5.4%)
- Secretaries and administrative assistants (5.4%)
- Information and record clerks, except customer service representatives (4.3%)
- Customer service representatives (3.4%)
- Accountants and auditors (3.3%)
- Preschool, kindergarten, elementary, and middle school teachers (3.2%)
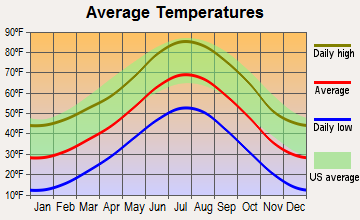
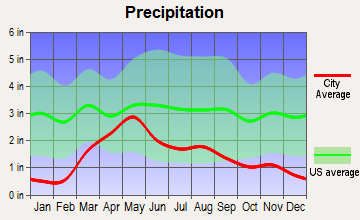
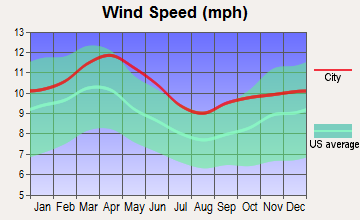
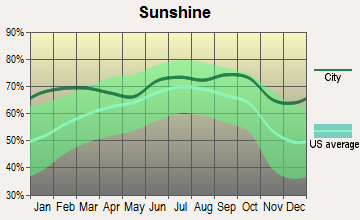
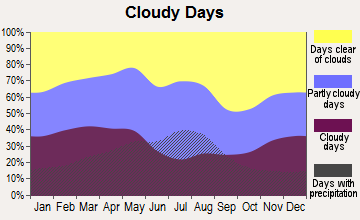
Average climate in Golden, Colorado
Based on data reported by over 4,000 weather stations


|
|

(lower is better)
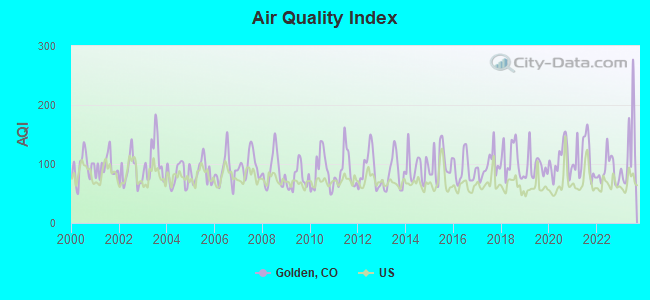
Air Quality Index (AQI) level in 2023 was 124. This is significantly worse than average.
| City: | 124 |
| U.S.: | 73 |
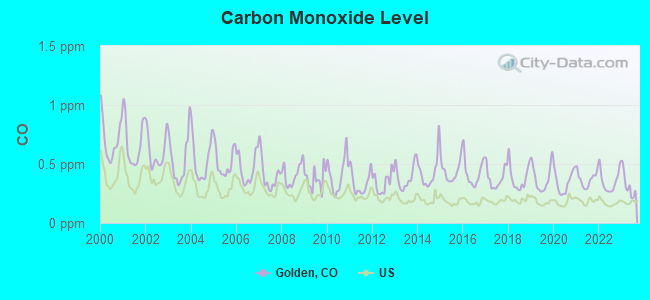
Carbon Monoxide (CO) [ppm] level in 2023 was 0.321. This is worse than average. Closest monitor was 5.7 miles away from the city center.
| City: | 0.321 |
| U.S.: | 0.251 |
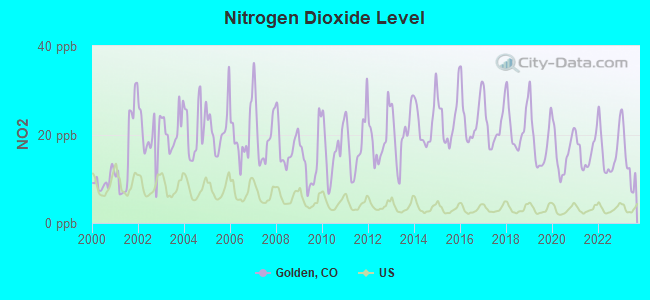
Nitrogen Dioxide (NO2) [ppb] level in 2023 was 14.0. This is significantly worse than average. Closest monitor was 8.0 miles away from the city center.
| City: | 14.0 |
| U.S.: | 5.1 |
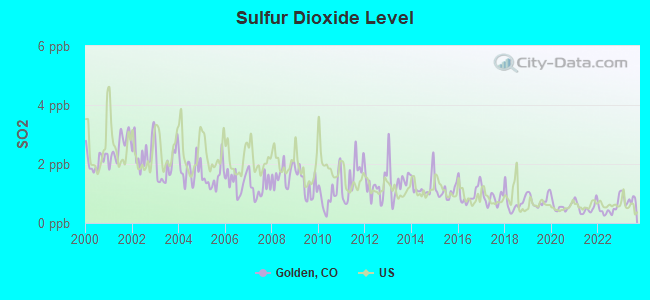
Sulfur Dioxide (SO2) [ppb] level in 2023 was 0.824. This is significantly better than average. Closest monitor was 7.0 miles away from the city center.
| City: | 0.824 |
| U.S.: | 1.515 |
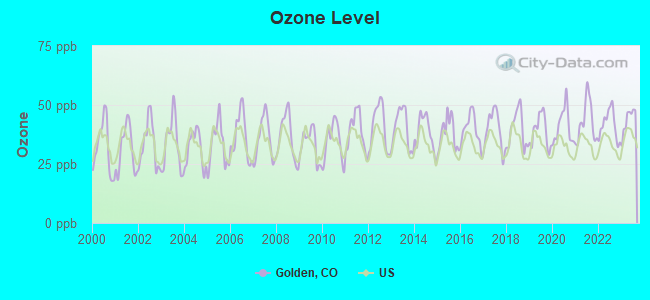
Ozone [ppb] level in 2023 was 43.6. This is worse than average. Closest monitor was 1.7 miles away from the city center.
| City: | 43.6 |
| U.S.: | 33.3 |
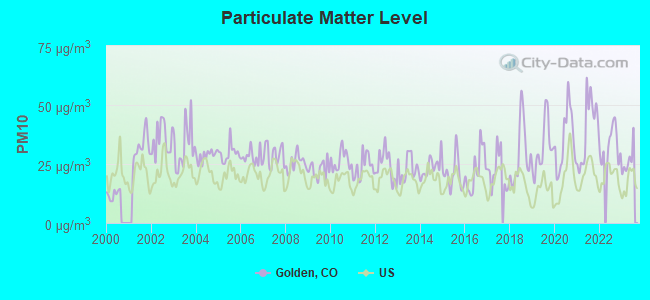
Particulate Matter (PM10) [µg/m3] level in 2023 was 26.4. This is worse than average. Closest monitor was 1.0 miles away from the city center.
| City: | 26.4 |
| U.S.: | 19.2 |
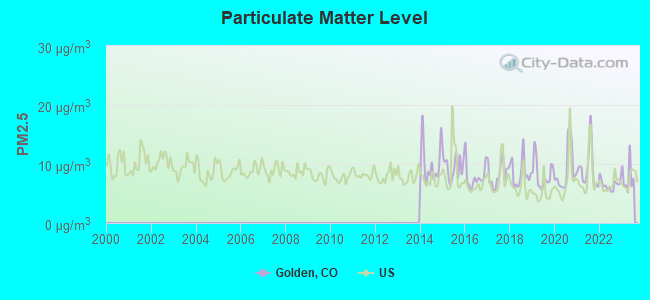
Particulate Matter (PM2.5) [µg/m3] level in 2023 was 7.76. This is about average. Closest monitor was 10.5 miles away from the city center.
| City: | 7.76 |
| U.S.: | 8.11 |
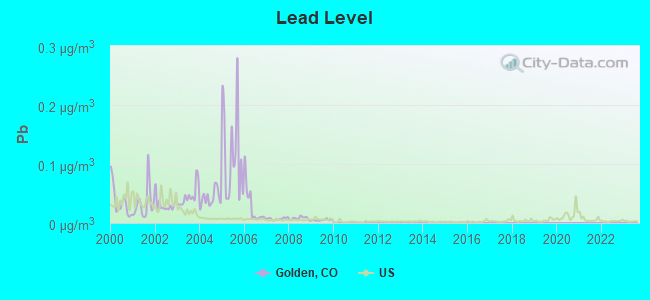
Lead (Pb) [µg/m3] level in 2009 was 0.00502. This is significantly better than average. Closest monitor was 1.0 miles away from the city center.
| City: | 0.00502 |
| U.S.: | 0.00931 |
Tornado activity:
Golden-area historical tornado activity is above Colorado state average. It is 9% greater than the overall U.S. average.
On 6/15/1988, a category F3 (max. wind speeds 158-206 mph) tornado 15.0 miles away from the Golden city center injured 7 people and caused between $5,000,000 and $50,000,000 in damages.
On 5/18/1975, a category F3 tornado 25.8 miles away from the city center .
Earthquake activity:
Golden-area historical earthquake activity is significantly above Colorado state average. It is 739% greater than the overall U.S. average.On 8/18/1959 at 06:37:13, a magnitude 7.7 (7.7 UK, Class: Major, Intensity: VIII - XII) earthquake occurred 434.6 miles away from Golden center, causing $26,000,000 total damage
On 10/18/1984 at 15:30:23, a magnitude 5.5 (5.4 MB, 5.1 MS, 5.5 ML, Class: Moderate, Intensity: VI - VII) earthquake occurred 184.1 miles away from the city center
On 10/28/1983 at 14:06:06, a magnitude 7.3 (6.2 MB, 7.3 MS, 7.0 MW) earthquake occurred 533.6 miles away from the city center, causing 2 deaths (2 shaking deaths) and 3 injuries, causing $15,000,000 total damage
On 8/23/2011 at 05:46:18, a magnitude 5.3 (5.3 MW, Depth: 2.5 mi) earthquake occurred 187.7 miles away from the city center
On 3/28/1975 at 02:31:05, a magnitude 6.2 (6.1 MB, 6.0 MS, 6.2 ML, Class: Strong, Intensity: VII - IX) earthquake occurred 410.8 miles away from the city center
On 8/10/2005 at 22:08:22, a magnitude 5.0 (5.0 MW, Depth: 3.1 mi) earthquake occurred 194.7 miles away from the city center
Magnitude types: body-wave magnitude (MB), local magnitude (ML), surface-wave magnitude (MS), moment magnitude (MW)
Natural disasters:
The number of natural disasters in Jefferson County (12) is smaller than the US average (15).Major Disasters (Presidential) Declared: 4
Emergencies Declared: 4
Causes of natural disasters: Fires: 4, Floods: 4, Storms: 3, Landslides: 2, Mudslides: 2, Snows: 2, Heavy Rain: 1, Hurricane: 1, Snowstorm: 1, Other: 1 (Note: some incidents may be assigned to more than one category).
Main business address for: CANYON RESOURCES CORP (GOLD & SILVER ORES), MOLSON COORS BREWING CO (MALT BEVERAGES), HEALTHETECH INC (SURGICAL & MEDICAL INSTRUMENTS & APPARATUS), NEW WORLD RESTAURANT GROUP INC (RETAIL-EATING PLACES), ACT TELECONFERENCING INC (COMMUNICATION SERVICES, NEC).
Hospitals and medical centers in Golden:
Other hospitals and medical centers near Golden:
- ACCENT ON INDEPENDENCE INC (Home Health Center, about 5 miles away; LAKEWOOD, CO)
- EVERGREEN TERRACE CARE CENTER LLC (Nursing Home, about 5 miles away; LAKEWOOD, CO)
- CENTURA HEALTH-ST ANTHONY HOSPITAL Acute Care Hospitals (about 5 miles away; LAKEWOOD, CO)
- ORTHOCOLORADO HOSPITAL AT ST ANTHONY MED CAMPUS Acute Care Hospitals (about 5 miles away; LAKEWOOD, CO)
- EMERITUS AT GREEN MOUNTAIN LONG TERM CARE COMMUNIT (Nursing Home, about 5 miles away; LAKEWOOD, CO)
- GRAND OAKS CARE CENTER (Nursing Home, about 5 miles away; LAKEWOOD, CO)
- MOUNTAIN VISTA HEALTH CENTER (Nursing Home, about 5 miles away; WHEAT RIDGE, CO)
Heliports located in Golden:
Amtrak station near Golden:
- 12 miles: DENVER (1701 WYNKOOP ST.) . Services: ticket office, fully wheelchair accessible, enclosed waiting area, public restrooms, public payphones, full-service food facilities and snack bar, paid short-term parking, paid long-term parking, call for car rental service, taxi stand, public transit connection.
College/University in Golden:
Other colleges/universities with over 2000 students near Golden:
- Red Rocks Community College (about 4 miles; Lakewood, CO; Full-time enrollment: 6,185)
- Colorado Christian University (about 7 miles; Lakewood, CO; FT enrollment: 2,959)
- Regis University (about 10 miles; Denver, CO; FT enrollment: 6,975)
- Community College of Denver (about 12 miles; Denver, CO; FT enrollment: 7,329)
- Metropolitan State University of Denver (about 12 miles; Denver, CO; FT enrollment: 17,242)
- University of Colorado Denver (about 12 miles; Denver, CO; FT enrollment: 14,727)
- Emily Griffith Technical College (about 12 miles; Denver, CO; FT enrollment: 2,460)
Public high schools in Golden:
- GOLDEN HIGH SCHOOL (Students: 1,329, Location: 701 24TH STREET, Grades: 9-12)
- COMPASS MONTESSORI - GOLDEN CHARTER SCHOOL (Students: 328, Location: 4441 SALVIA STREET, Grades: PK-12, Charter school)
- ROCKY MOUNTAIN DEAF SCHOOL (Students: 39, Location: 1921 YOUNGFIELD STREET, Grades: PK-12, Charter school)
- CONNECTIONS LEARNING CENTER ON THE EARLE JOHNSON C (Location: 1200 JOHNSON ROAD, Grades: 7-12)
- JEFFCO'S 21ST CENTURY VIRTUAL ACADEMY (Location: 1829 DENVER WEST DRIVE BLDG #2, Grades: 7-12)
Biggest public elementary/middle schools in Golden:
- KYFFIN ELEMENTARY SCHOOL (Students: 598, Location: 205 NORTH FLORA WAY, Grades: KG-6)
- BELL MIDDLE SCHOOL (Students: 574, Location: 1001 ULYSSES STREET, Grades: 6-8)
- FAIRMOUNT ELEMENTARY SCHOOL (Students: 521, Location: 15975 WEST 50TH AVENUE, Grades: KG-6)
- SHELTON ELEMENTARY SCHOOL (Students: 429, Location: 420 CRAWFORD STREET, Grades: KG-6)
- MAPLE GROVE ELEMENTARY SCHOOL (Students: 392, Location: 3085 ALKIRE STREET, Grades: KG-6)
- RALSTON ELEMENTARY SCHOOL (Students: 312, Location: 25856 COLUMBINE GLEN, Grades: KG-6)
- WELCHESTER ELEMENTARY SCHOOL (Students: 310, Location: 13000 WEST 10TH AVENUE, Grades: KG-6)
- PLEASANT VIEW ELEMENTARY SCHOOL (Students: 265, Location: 15920 WEST 10TH AVENUE, Grades: PK-6)
- FREE HORIZON MONTESSORI CHARTER SCHOOL (Students: 244, Location: 581 CONFERENCE PLACE, Grades: PK-8, Charter school)
- COAL CREEK CANYON K-8 ELEMENTARY SCHOOL (Students: 105, Location: 11719 RANCH ELSIE ROAD, Grades: KG-8)
Points of interest:
Notable locations in Golden: Heritage Square (A), Coors Technology Center (B), Fossil Trace Golf Club (C), Golden Fire Department Station 1 (D), Golden Branch Jefferson County Public Library (E), Weaver Towers (F), Volk Gymnasium (G), Thomas Residence Hall (H), Stratton Hall (I), Steinhauer Field House (J), Randall Residence Hall (K), Morgan Residence Hall (L), Meyer Hall (M), Hill Hall (N), Guggenheim Hall (O), Green Center (P), Foothills Art Center (Q), Engineering Hall (R), Coolbaugh Hall (S), Chauvenet Hall (T). Display/hide their locations on the map
Main business address in Golden: MOLSON COORS BREWING CO (A). Display/hide its location on the map
Churches in Golden include: Calvary Episcopal Church (A), Christ The Answer Church (B), Faith Lutheran Church (C), First Baptist Church of Golden (D), First Presbyterian Church (E), Golden Church of the Nazarene (F), Golden First United Methodist Church (G), Hillside Community Church (H), Islamic Center of Golden (I). Display/hide their locations on the map
Cemeteries: White Ash Mine Cemetery (1), Golden Cemetery (2). Display/hide their locations on the map
Reservoir: Magic Mountain Reservoir Number 1 (A). Display/hide its location on the map
Parks in Golden include: Benerly Heights Park (1), Lions Park (2), Tony Grampas Memorial Sports Complex (3), Golden Heights Park (4), Heritage Dells Park (5), South Ridge Park (6), Brooks Field (7), Cressman Gulch Park (8), Mesa Meadows Park (9). Display/hide their locations on the map
Tourist attractions: Astor House Museum (822 12th Street), Colorado Ranching Museum (1020 11th Street), Clear Creek History Park (Museums; 822 12th Street), Colorado Ski Museum Resource Center (13401 West 43rd Drive), Daughter's of the American Revolution (Museums; 923 10th Street), Buffalo Bill Memorial Museum (987 Lookout Mountain Road), Clear Creek Mercantile (Museums; 1020 11th Street), Golden Pioneer Museum (923 10th Street), Rocky Mountain Quilt Museum (Cultural Attractions- Events- & Facilities; 1111 Washington Avenue).
Hotels: Days Inn-Denver West-Golden (15059 West Colfax Avenue), Hampton Inn (17150 West Colfax Avenue), Comfort Suites (11909 W 6th Ave), Fortune Valley Hotel & Casino (321 Gregory Drive), LA Quinta - Golden- Inns (3301 Youngfield Street), Courtyard by Marriott-Denver West-Golden (14700 West 6th Avenue), Golden Hotel (800 11th Street Suite B), Golden Motel (24 Ford), Denver Marriott West (1717 Denver West Blvd).
Courts: Jefferson County Government - Courts- General Court Information (800 Jefferson County Pkw), Jefferson County Government - Community Service- Justice Services- Court Serv (800 Jefferson County Pkw), Jefferson County - Historical Records- For Court Files And Records Including Div (100 Jefferson County Pkw).
Birthplace of: Allen G. Rushlight - Mayor of Portland, Roy Hartzell - Baseball player, Cowboy Jones - Baseball player, Jarret Thomas - Snowboarder, John C. Bailar, Jr. - Chemist.
Drinking water stations with addresses in Golden and their reported violations in the past:
GENESEE WSD (Population served: 4,100, Surface water):Past health violations:MORRISON TOWN OF (Population served: 1,382, Surface water):Past monitoring violations:
- MCL, Average - Between JUL-2010 and SEP-2010, Contaminant: TTHM. Follow-up actions: St Public Notif requested (OCT-25-2010), St Violation/Reminder Notice (OCT-25-2010), St Public Notif received (NOV-08-2010), St Compliance achieved (APR-30-2011), St AO (w/o penalty) issued (JUN-14-2011)
- Treatment Technique (SWTR and GWR) - In MAY-2005. Follow-up actions: St Violation/Reminder Notice (JUN-15-2005), St Public Notif requested (JUN-15-2005), St Public Notif received (JUL-11-2005), St Compliance achieved (DEC-31-2005)
- Monitoring and Reporting (DBP) - Between APR-2012 and JUN-2012, Contaminant: TTHM. Follow-up actions: St Public Notif requested (JUL-23-2012), St Violation/Reminder Notice (JUL-23-2012), St Compliance achieved (NOV-30-2012), St Public Notif received (JUN-27-2013)
- Monitoring and Reporting (DBP) - Between APR-2012 and JUN-2012, Contaminant: Total Haloacetic Acids (HAA5). Follow-up actions: St Public Notif requested (JUL-23-2012), St Violation/Reminder Notice (JUL-23-2012), St Compliance achieved (NOV-30-2012), St Public Notif received (JUN-27-2013)
- Monitoring of Treatment (SWTR-Filter) - In SEP-2011. Follow-up actions: St Public Notif requested (NOV-09-2011), St Violation/Reminder Notice (NOV-09-2011), St Public Notif received (JUL-09-2012)
- Monitoring and Reporting (DBP) - Between JUL-2011 and SEP-2011, Contaminant: Chlorine. Follow-up actions: St Public Notif requested (NOV-09-2011), St Violation/Reminder Notice (NOV-09-2011), St Public Notif received (JUL-09-2012)
- Treatment Technique Precursor Removal - Between APR-2011 and JUN-2011, Contaminant: CARBON, TOTAL. Follow-up actions: St AO (w/o penalty) issued (JUN-14-2011), St Public Notif requested (AUG-05-2011), St Violation/Reminder Notice (AUG-05-2011), St Public Notif received (AUG-31-2011), St Compliance achieved (DEC-22-2011)
- 2 routine major monitoring violations
- One minor monitoring violation
- 31 regular monitoring violations
- 16 other older monitoring violations
Past monitoring violations:HOOVER HILLS WSD (Population served: 600, Purch surface water):
- Monitoring of Treatment (SWTR-Filter) - In MAY-2013. Follow-up actions: St Violation/Reminder Notice (JUL-10-2013), St Public Notif requested (JUL-10-2013)
- Monitoring and Reporting (DBP) - Between APR-2013 and JUN-2013, Contaminant: Chlorine. Follow-up actions: St Violation/Reminder Notice (JUL-10-2013), St Public Notif requested (JUL-10-2013)
- Monitoring of Treatment (SWTR-Filter) - In AUG-2012. Follow-up actions: St Public Notif requested (OCT-17-2012), St Violation/Reminder Notice (OCT-17-2012), St Compliance achieved (JUN-21-2013)
- Monitoring and Reporting (DBP) - Between JUL-2012 and SEP-2012, Contaminant: Chlorine. Follow-up actions: St Public Notif requested (OCT-17-2012), St Violation/Reminder Notice (OCT-17-2012), St Compliance achieved (JUN-21-2013)
- Monitoring, Turbidity (Enhanced SWTR) - In JUL-2011, Contaminant: IESWTR. Follow-up actions: St Public Notif requested (AUG-25-2011), St Violation/Reminder Notice (AUG-25-2011), St Compliance achieved (JAN-31-2012)
- 3 routine major monitoring violations
- One minor monitoring violation
- 66 regular monitoring violations
- 3 other older monitoring violations
Past monitoring violations:WONDERVU CONFERENCE AND RETREAT CENTER (Population served: 222, Groundwater):
- Monitoring and Reporting (DBP) - Between OCT-2013 and DEC-2013, Contaminant: TTHM. Follow-up actions: St Violation/Reminder Notice (FEB-13-2014), St Public Notif requested (FEB-13-2014)
- Monitoring and Reporting (DBP) - Between OCT-2013 and DEC-2013, Contaminant: Total Haloacetic Acids (HAA5). Follow-up actions: St Violation/Reminder Notice (FEB-13-2014), St Public Notif requested (FEB-13-2014)
- Monitoring and Reporting (DBP) - Between APR-2013 and JUN-2013, Contaminant: Chlorine. Follow-up actions: St Violation/Reminder Notice (JUL-31-2013), St Public Notif requested (JUL-31-2013)
- Monitoring and Reporting (DBP) - Between JAN-2013 and MAR-2013, Contaminant: Chlorine. Follow-up actions: St Violation/Reminder Notice (APR-30-2013), St Public Notif requested (APR-30-2013)
- Monitoring and Reporting (DBP) - Between OCT-2012 and DEC-2012, Contaminant: Chlorine. Follow-up actions: St Violation/Reminder Notice (FEB-15-2013), St Public Notif requested (FEB-15-2013)
- 6 routine major monitoring violations
- 8 other older monitoring violations
Past monitoring violations:GRANBY JONES MHP (Population served: 201, Groundwater):
- One routine major monitoring violation
Past monitoring violations:WESTFALEN (Population served: 128, Groundwater):
- Monitoring and Reporting (DBP) - Between APR-2014 and JUN-2014, Contaminant: Chlorine. Follow-up actions: St Violation/Reminder Notice (AUG-07-2014), St Public Notif requested (AUG-07-2014)
- Monitoring and Reporting (DBP) - Between JUL-2007 and SEP-2007, Contaminant: Chlorine. Follow-up actions: St Violation/Reminder Notice (NOV-21-2007), St Compliance achieved (NOV-27-2007)
- One routine major monitoring violation
- One regular monitoring violation
Past monitoring violations:TRIBUTARY (Population served: 100, Groundwater under infl of surface water):
- One regular monitoring violation
Past health violations:ROCKY FLATS LOUNGE LLC (Population served: 43, Groundwater):Past monitoring violations:
- Treatment Technique (SWTR and GWR) - In NOV-2011. Follow-up actions: St Public Notif requested (JAN-03-2012), St Violation/Reminder Notice (JAN-03-2012), St AO (w/penalty) issued (MAY-22-2012)
- Treatment Technique (SWTR and GWR) - In OCT-2011. Follow-up actions: St Public Notif requested (DEC-08-2011), St Violation/Reminder Notice (DEC-08-2011), St Public Notif received (MAY-17-2012), St AO (w/penalty) issued (MAY-22-2012)
- Treatment Technique (SWTR and GWR) - In SEP-2011. Follow-up actions: St Public Notif requested (NOV-21-2011), St Violation/Reminder Notice (NOV-21-2011), St AO (w/penalty) issued (MAY-22-2012)
- Failure to Filter (SWTR) - In MAY-01-2008. Follow-up actions: St Public Notif requested (OCT-06-2008), St AO (w/o penalty) issued (OCT-06-2008), St Compliance achieved (MAR-01-2010), St Public Notif received (JUN-24-2010)
- Monthly Turbidity Exceed (Enhanced SWTR) - In MAR-2014, Contaminant: IESWTR. Follow-up actions: St Violation/Reminder Notice (MAY-07-2014), St Public Notif requested (MAY-07-2014)
- Monthly Turbidity Exceed (Enhanced SWTR) - In AUG-2011, Contaminant: IESWTR. Follow-up actions: St Public Notif requested (OCT-07-2011), St Violation/Reminder Notice (OCT-07-2011), St AO (w/penalty) issued (MAY-22-2012)
- Monthly Turbidity Exceed (Enhanced SWTR) - In JUL-2011, Contaminant: IESWTR. Follow-up actions: St Public Notif requested (SEP-08-2011), St Violation/Reminder Notice (SEP-08-2011), St AO (w/penalty) issued (MAY-22-2012)
- Monthly Turbidity Exceed (Enhanced SWTR) - In JUN-2011, Contaminant: IESWTR. Follow-up actions: St Public Notif requested (AUG-09-2011), St Violation/Reminder Notice (AUG-09-2011), St AO (w/penalty) issued (MAY-22-2012)
- Single Turbidity Exceed (Enhanced SWTR) - In JUN-2011, Contaminant: IESWTR. Follow-up actions: St Public Notif requested (AUG-09-2011), St Violation/Reminder Notice (AUG-09-2011), St AO (w/penalty) issued (MAY-22-2012)
- One routine major monitoring violation
- 8 other older monitoring violations
Past monitoring violations:
- 2 routine major monitoring violations
Drinking water stations with addresses in Golden that have no violations reported:
- GOLDEN CITY OF (Population served: 28,232, Primary Water Source Type: Surface water)
| This city: | 2.2 people |
| Colorado: | 2.5 people |
| This city: | 53.9% |
| Whole state: | 63.9% |
| This city: | 5.3% |
| Whole state: | 6.5% |
Likely homosexual households (counted as self-reported same-sex unmarried-partner households)
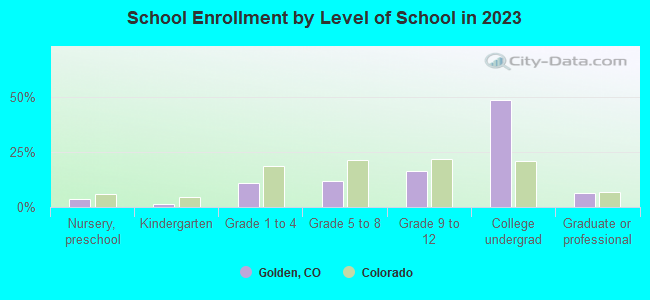
- Lesbian couples: 0.4% of all households
- Gay men: 0.1% of all households
People in group quarters in Golden in 2010:
- 1,060 people in college/university student housing
- 1,053 people in local jails and other municipal confinement facilities
- 177 people in correctional facilities intended for juveniles
- 38 people in emergency and transitional shelters (with sleeping facilities) for people experiencing homelessness
- 5 people in other noninstitutional facilities
People in group quarters in Golden in 2000:
- 563 people in college dormitories (includes college quarters off campus)
- 503 people in local jails and other confinement facilities (including police lockups)
- 212 people in training schools for juvenile delinquents
- 15 people in homes for the mentally ill
Banks with most branches in Golden (2011 data):
- FirstBank: Golden Road Branch at 17171 South Golden Road, branch established on 1999/01/20; Colorado Mills Branch at 14185 West Colfax Drive, branch established on 2004/12/13. Info updated 2011/12/05: Bank assets: $11,597.1 mil, Deposits: $10,530.4 mil, headquarters in Lakewood, CO, positive income, Mortgage Lending Specialization, 130 total offices, Holding Company: Firstbank Holding Company
- Mile High Banks: West Metro Messenger Service at 430 Indianna Street, branch established on 2005/05/23; W Metro Branch at 430 Indiana St, branch established on 2005/05/20. Info updated 2008/09/11: Bank assets: $957.1 mil, Deposits: $929.1 mil, headquarters in Longmont, CO, negative income in the last year, Commercial Lending Specialization, 16 total offices, Holding Company: Big Sandy Holding Company
- CoBiz Bank: Colorado Business Bank-West Branch at 15710 W Colfax Ave, branch established on 1997/12/22. Info updated 2007/04/19: Bank assets: $2,372.4 mil, Deposits: $1,946.0 mil, headquarters in Denver, CO, positive income, Commercial Lending Specialization, 20 total offices, Holding Company: Cobiz Financial, Inc.
- Mutual of Omaha Bank: Golden Branch at 770 Heritage Road, branch established on 1998/06/01. Info updated 2011/07/21: Bank assets: $5,553.2 mil, Deposits: $4,599.7 mil, headquarters in Omaha, NE, positive income, Commercial Lending Specialization, 45 total offices
- Wells Fargo Bank, National Association: Golden Branch at 1301 Jackson Street, branch established on 1937/01/01. Info updated 2011/04/05: Bank assets: $1,161,490.0 mil, Deposits: $905,653.0 mil, headquarters in Sioux Falls, SD, positive income, 6395 total offices, Holding Company: Wells Fargo & Company
- U.S. Bank National Association: Golden Branch at 1801 Jackson, branch established on 1962/05/14. Info updated 2012/01/30: Bank assets: $330,470.8 mil, Deposits: $236,091.5 mil, headquarters in Cincinnati, OH, positive income, 3121 total offices, Holding Company: U.S. Bancorp
- JPMorgan Chase Bank, National Association: Golden Town Center Branch at 17207 S Golden Rd, branch established on 2008/09/25. Info updated 2011/11/10: Bank assets: $1,811,678.0 mil, Deposits: $1,190,738.0 mil, headquarters in Columbus, OH, positive income, International Specialization, 5577 total offices, Holding Company: Jpmorgan Chase & Co.
- KeyBank National Association: Golden Branch at 1222 Arapahoe Street, branch established on 1998/10/19. Info updated 2008/03/03: Bank assets: $86,198.8 mil, Deposits: $64,214.8 mil, headquarters in Cleveland, OH, positive income, Commercial Lending Specialization, 1067 total offices, Holding Company: Keycorp
- Guaranty Bank and Trust Company: Jefferson Branch at 16800 West Colfax Avenue, branch established on 2000/08/07. Info updated 2010/12/21: Bank assets: $1,687.8 mil, Deposits: $1,331.8 mil, headquarters in Denver, CO, positive income, Commercial Lending Specialization, 34 total offices, Holding Company: Guaranty Bancorp
- 2 other banks with 2 local branches
For population 15 years and over in Golden:
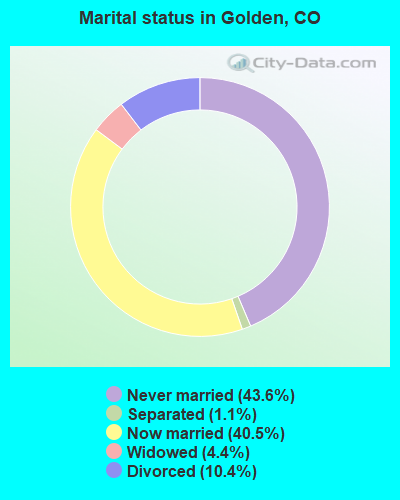
- Never married: 43.6%
- Now married: 40.5%
- Separated: 1.1%
- Widowed: 4.4%
- Divorced: 10.4%
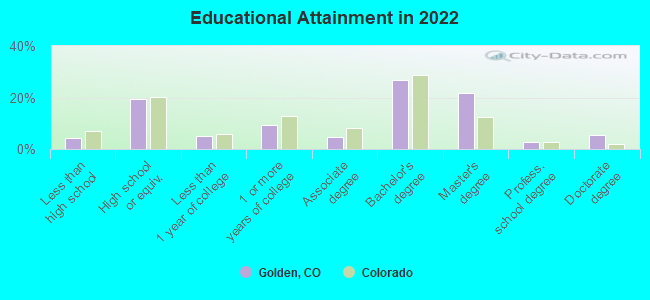
For population 25 years and over in Golden:
- High school or higher: 95.8%
- Bachelor's degree or higher: 54.7%
- Graduate or professional degree: 29.6%
- Unemployed: 3.8%
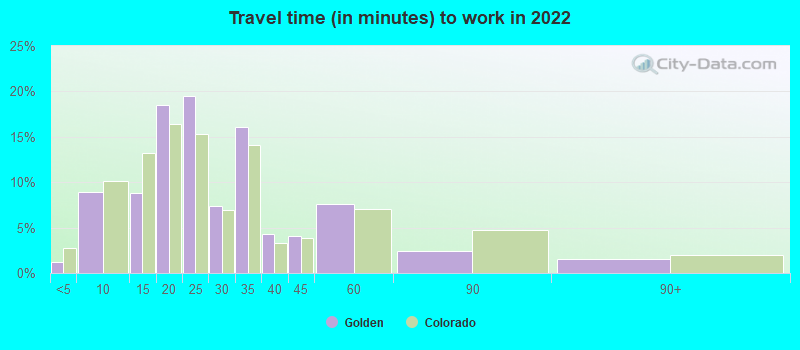
- Mean travel time to work (commute): 15.9 minutes
| Here: | 10.6 |
| Colorado average: | 11.1 |
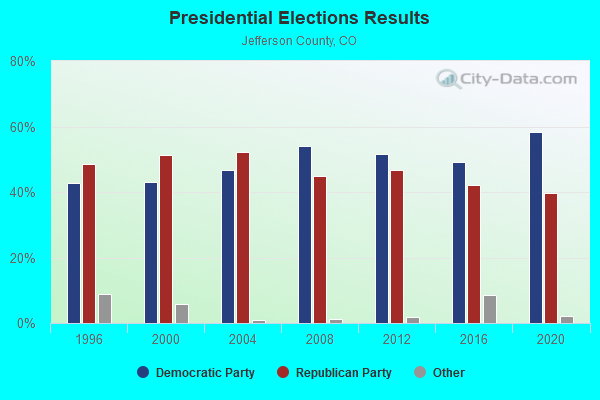
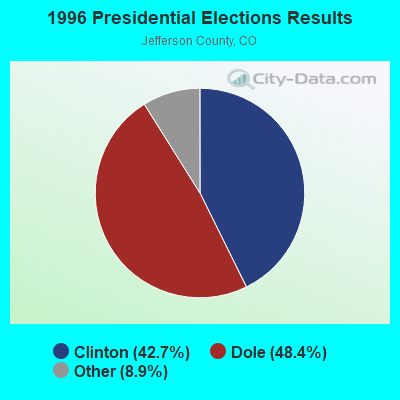

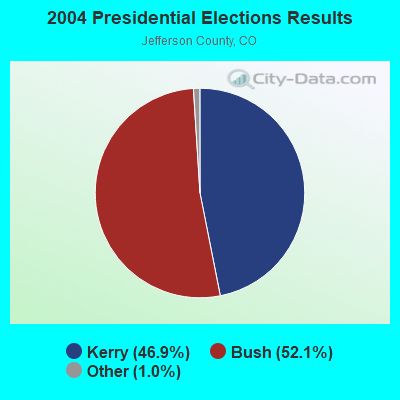
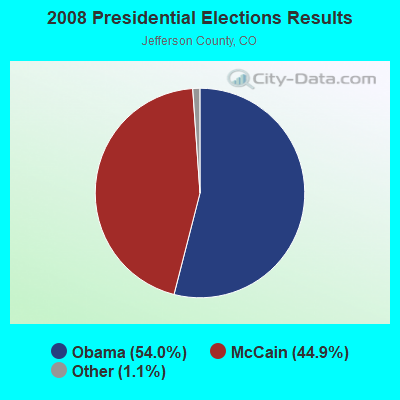
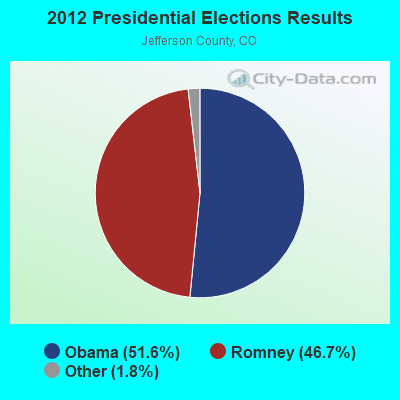
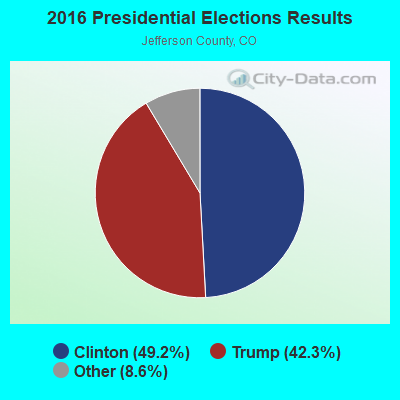

Graphs represent county-level data. Detailed 2008 Election Results
Neighborhoods in Golden:
(Golden, Colorado Neighborhood Map)Religion statistics for Golden, CO (based on Jefferson County data)
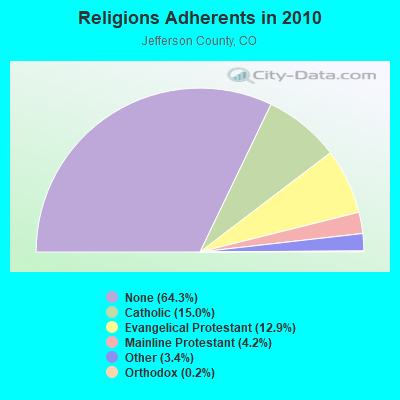
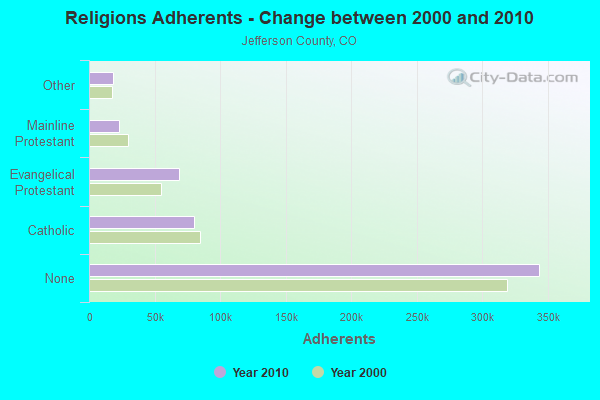
| Religion | Adherents | Congregations |
|---|---|---|
| Catholic | 80,219 | 17 |
| Evangelical Protestant | 68,794 | 196 |
| Mainline Protestant | 22,716 | 57 |
| Other | 17,966 | 62 |
| Orthodox | 1,070 | 3 |
| None | 343,778 | - |
Food Environment Statistics:
| This county: | 1.10 / 10,000 pop. |
| State: | 1.50 / 10,000 pop. |
| Jefferson County: | 0.09 / 10,000 pop. |
| State: | 0.15 / 10,000 pop. |
| Jefferson County: | 0.34 / 10,000 pop. |
| Colorado: | 0.45 / 10,000 pop. |
| This county: | 2.75 / 10,000 pop. |
| Colorado: | 3.13 / 10,000 pop. |
| This county: | 7.76 / 10,000 pop. |
| Colorado: | 8.99 / 10,000 pop. |
| Jefferson County: | 5.3% |
| Colorado: | 5.3% |
| Here: | 17.4% |
| State: | 18.4% |
| Jefferson County: | 9.6% |
| Colorado: | 9.6% |
Health and Nutrition:
| This city: | 49.4% |
| Colorado: | 49.4% |
| Golden: | 47.5% |
| Colorado: | 47.8% |
| Golden: | 28.0 |
| Colorado: | 28.5 |
| This city: | 20.2% |
| Colorado: | 20.7% |
| Golden: | 8.5% |
| Colorado: | 9.7% |
| Here: | 6.8 |
| Colorado: | 6.8 |
| This city: | 31.0% |
| Colorado: | 33.3% |
| Golden: | 58.1% |
| Colorado: | 57.3% |
| This city: | 80.5% |
| Colorado: | 80.2% |
More about Health and Nutrition of Golden, CO Residents
| Local government employment and payroll (March 2022) | |||||
| Function | Full-time employees | Monthly full-time payroll | Average yearly full-time wage | Part-time employees | Monthly part-time payroll |
|---|---|---|---|---|---|
| Police Protection - Officers | 51 | $423,497 | $99,646 | 0 | $0 |
| Parks and Recreation | 36 | $216,839 | $72,280 | 103 | $112,669 |
| Other and Unallocable | 28 | $163,917 | $70,250 | 7 | $15,728 |
| Water Supply | 21 | $132,849 | $75,914 | 0 | $0 |
| Streets and Highways | 18 | $99,480 | $66,320 | 0 | $0 |
| Financial Administration | 18 | $143,320 | $95,547 | 0 | $0 |
| Police - Other | 15 | $89,368 | $71,494 | 4 | $1,852 |
| Other Government Administration | 11 | $96,836 | $105,639 | 9 | $31,858 |
| Firefighters | 7 | $46,124 | $79,070 | 0 | $0 |
| Natural Resources | 6 | $32,906 | $65,812 | 0 | $0 |
| Fire - Other | 5 | $53,035 | $127,284 | 1 | $548 |
| Sewerage | 4 | $29,203 | $87,609 | 0 | $0 |
| Housing and Community Development (Local) | 4 | $31,266 | $93,798 | 0 | $0 |
| Judicial and Legal | 2 | $9,774 | $58,644 | 0 | $0 |
| Totals for Government | 226 | $1,568,411 | $83,278 | 124 | $162,655 |
Golden government finances - Expenditure in 2021 (per resident):
- Assistance and Subsidies - Public Welfare, Cash Assistance Programs - Other: $65,000 ($3.18)
- Construction - Regular Highways: $2,300,000 ($112.41)
Water Utilities: $2,261,000 ($110.51)
Parks and Recreation: $1,566,000 ($76.54)
Sewerage: $792,000 ($38.71)
General Public Buildings: $202,000 ($9.87)
Local Fire Protection: $112,000 ($5.47)
Housing and Community Development: $26,000 ($1.27)
- Current Operations - Police Protection: $9,728,000 ($475.46)
Parks and Recreation: $7,895,000 ($385.87)
General - Other: $4,795,000 ($234.36)
Central Staff Services: $3,659,000 ($178.84)
Water Utilities: $3,422,000 ($167.25)
Local Fire Protection: $2,334,000 ($114.08)
Sewerage: $2,017,000 ($98.58)
Regular Highways: $1,773,000 ($86.66)
Financial Administration: $1,511,000 ($73.85)
Housing and Community Development: $1,086,000 ($53.08)
General Public Buildings: $916,000 ($44.77)
Solid Waste Management: $829,000 ($40.52)
Judicial and Legal Services: $609,000 ($29.77)
Natural Resources - Other: $571,000 ($27.91)
Health - Other: $542,000 ($26.49)
Miscellaneous Commercial Activities - Other: $510,000 ($24.93)
Parking Facilities: $58,000 ($2.83)
Protective Inspection and Regulation - Other: $55,000 ($2.69)
- General - Interest on Debt: $553,000 ($27.03)
- Intergovernmental to Local - Other - General - Other: $675,000 ($32.99)
Other - Housing and Community Development: $284,000 ($13.88)
Other - Sewerage: $170,000 ($8.31)
Other - Public Welfare - Other: $55,000 ($2.69)
Other - Police Protection: $23,000 ($1.12)
Other - Corrections: $21,000 ($1.03)
- Other Capital Outlay - Parks and Recreation: $638,000 ($31.18)
Central Staff Services: $522,000 ($25.51)
Local Fire Protection: $146,000 ($7.14)
Police Protection: $143,000 ($6.99)
Regular Highways: $56,000 ($2.74)
Natural Resources - Other: $49,000 ($2.39)
Water Utilities: $34,000 ($1.66)
Miscellaneous Commercial Activities - Other: $18,000 ($0.88)
Health - Other: $6,000 ($0.29)
Sewerage: $5,000 ($0.24)
Financial Administration: $1,000 ($0.05)
- Total Salaries and Wages: $17,782,000 ($869.11)
- Water Utilities - Interest on Debt: $68,000 ($3.32)
Golden government finances - Revenue in 2021 (per resident):
- Charges - Parks and Recreation: $4,991,000 ($243.94)
Sewerage: $3,876,000 ($189.44)
Other: $1,142,000 ($55.82)
Miscellaneous Commercial Activities: $835,000 ($40.81)
Solid Waste Management: $642,000 ($31.38)
Housing and Community Development: $26,000 ($1.27)
- Federal Intergovernmental - Other: $229,000 ($11.19)
- Local Intergovernmental - Other: $2,471,000 ($120.77)
Housing and Community Development: $1,670,000 ($81.62)
Highways: $496,000 ($24.24)
- Miscellaneous - General Revenue - Other: $1,246,000 ($60.90)
Interest Earnings: $608,000 ($29.72)
Rents: $508,000 ($24.83)
Sale of Property: $318,000 ($15.54)
Fines and Forfeits: $279,000 ($13.64)
Donations From Private Sources: $64,000 ($3.13)
- Revenue - Water Utilities: $7,160,000 ($349.95)
- State Intergovernmental - Highways: $911,000 ($44.53)
Other: $420,000 ($20.53)
General Local Government Support: $168,000 ($8.21)
- Tax - General Sales and Gross Receipts: $21,190,000 ($1035.68)
Property: $8,722,000 ($426.30)
Other Selective Sales: $1,403,000 ($68.57)
Public Utilities Sales: $1,137,000 ($55.57)
Other License: $1,022,000 ($49.95)
Motor Vehicle License: $36,000 ($1.76)
Alcoholic Beverage License: $23,000 ($1.12)
Occupation and Business License - Other: $14,000 ($0.68)
Golden government finances - Debt in 2021 (per resident):
- Long Term Debt - Beginning Outstanding - Unspecified Public Purpose: $26,795,000 ($1309.63)
Outstanding Unspecified Public Purpose: $23,080,000 ($1128.05)
Retired Unspecified Public Purpose: $3,715,000 ($181.57)
Golden government finances - Cash and Securities in 2021 (per resident):
- Bond Funds - Cash and Securities: $2,500,000 ($122.19)
- Other Funds - Cash and Securities: $47,845,000 ($2338.47)
- Sinking Funds - Cash and Securities: $665,000 ($32.50)
11.22% of this county's 2021 resident taxpayers lived in other counties in 2020 ($78,273 average adjusted gross income)
| Here: | 11.22% |
| Colorado average: | 11.28% |
0.01% of residents moved from foreign countries ($77 average AGI)
Jefferson County: 0.01% Colorado average: 0.05%
Top counties from which taxpayers relocated into this county between 2020 and 2021:
| from Denver County, CO | |
| from Adams County, CO | |
| from Arapahoe County, CO |
11.40% of this county's 2020 resident taxpayers moved to other counties in 2021 ($73,305 average adjusted gross income)
| Here: | 11.40% |
| Colorado average: | 11.05% |
0.01% of residents moved to foreign countries ($82 average AGI)
Jefferson County: 0.01% Colorado average: 0.03%
Top counties to which taxpayers relocated from this county between 2020 and 2021:
| to Denver County, CO | |
| to Adams County, CO | |
| to Arapahoe County, CO |
| Businesses in Golden, CO | ||||
| Name | Count | Name | Count | |
|---|---|---|---|---|
| 7-Eleven | 2 | Kroger | 3 | |
| AT&T | 1 | La Quinta | 1 | |
| Advance Auto Parts | 1 | Marriott | 4 | |
| AmericInn | 1 | MasterBrand Cabinets | 2 | |
| Ascend Collection | 1 | McDonald's | 3 | |
| Bed Bath & Beyond | 1 | New Balance | 2 | |
| Big O Tires | 1 | Nike | 2 | |
| Blockbuster | 1 | OfficeMax | 1 | |
| Burger King | 2 | On The Border | 1 | |
| Charlotte Russe | 1 | Outback | 1 | |
| Cricket Wireless | 1 | Outback Steakhouse | 1 | |
| Curves | 2 | Papa John's Pizza | 1 | |
| Dairy Queen | 1 | Pizza Hut | 1 | |
| Days Inn | 1 | Quiznos | 2 | |
| Dennys | 1 | RadioShack | 1 | |
| Domino's Pizza | 1 | SONIC Drive-In | 1 | |
| FedEx | 10 | Staples | 1 | |
| H&R Block | 1 | Starbucks | 5 | |
| Hilton | 1 | Subaru | 1 | |
| Holiday Inn | 1 | T-Mobile | 1 | |
| Home Depot | 2 | Taco Bell | 1 | |
| Honda | 1 | U-Haul | 1 | |
| Jack In The Box | 1 | UPS | 13 | |
| Jamba Juice | 1 | Vons | 1 | |
| Jimmy John's | 1 | Wendy's | 1 | |
| KFC | 1 | Whole Foods Market | 1 | |
| Kohl's | 1 | |||
Strongest AM radio stations in Golden:
- KKZN (760 AM; 50 kW; THORNTON, CO; Owner: JACOR BROADCASTING OF COLORADO, INC.)
- KLTT (670 AM; 50 kW; COMMERCE CITY, CO; Owner: KLZ RADIO, INC.)
- KOA (850 AM; 50 kW; DENVER, CO; Owner: JACOR BROADCASTING OF COLORADO, INC.)
- KCUV (1510 AM; 25 kW; LITTLETON, CO; Owner: PEOPLE WIRELESS, INC.)
- KRKS (990 AM; 10 kW; DENVER, CO; Owner: SALEM MEDIA OF COLORADO, INC.)
- KMXA (1090 AM; 50 kW; AURORA, CO; Owner: ENTRAVISION HOLDINGS, LLC)
- KADZ (1550 AM; 10 kW; ARVADA, CO; Owner: ABC, INC.)
- KPOF (910 AM; 5 kW; DENVER, CO; Owner: PILLAR OF FIRE)
- KDDZ (1690 AM; 10 kW; ARVADA, CO; Owner: ABC, INC.)
- KLZ (560 AM; 5 kW; DENVER, CO; Owner: KLZ RADIO, INC.)
- KBJD (1650 AM; 10 kW; DENVER, CO; Owner: SALEM MEDIA OF COLORADO, INC.)
- KCKK (1600 AM; 5 kW; LAKEWOOD, CO; Owner: JEFFERSON-PILOT COMMUNICATIONS COMPANY OF COLORADO)
- KLMO (1060 AM; 30 kW; LONGMONT, CO; Owner: PILGRIM COMMUNICATIONS, INC.)
Strongest FM radio stations in Golden:
- KALC (105.9 FM; DENVER, CO; Owner: ENTERCOM DENVER LICENSE, LLC)
- KBPI (106.7 FM; DENVER, CO; Owner: JACOR BROADCASTING OF COLORADO, INC.)
- KFMD (95.7 FM; DENVER, CO; Owner: CITICASTERS LICENSES, L.P.)
- KRFX (103.5 FM; DENVER, CO; Owner: JACOR BROADCASTING OF COLORADO, INC.)
- KOSI (101.1 FM; DENVER, CO; Owner: ENTERCOM DENVER LICENSE, LLC)
- KUVO (89.3 FM; DENVER, CO; Owner: DENVER EDUCATIONAL BROADCASTING)
- K209DE (89.7 FM; GOLDEN, CO; Owner: WAY-FM MEDIA GROUP, INC.)
- KQKS (107.5 FM; LAKEWOOD, CO; Owner: JEFFERSON-PILOT COMMUNICATIONS COMPANY OF COLORADO)
- KVOD (90.1 FM; DENVER, CO; Owner: PUBLIC BROADCASTING OF COLORADO, INC)
- KIMN (100.3 FM; DENVER, CO; Owner: INFINITY RADIO OPERATIONS INC.)
- KQMT (99.5 FM; DENVER, CO; Owner: ENTERCOM DENVER LICENSE, LLC)
- KXKL-FM (105.1 FM; DENVER, CO; Owner: INFINITY RADIO OPERATIONS INC.)
- KLDV (91.1 FM; MORRISON, CO; Owner: EDUCATIONAL MEDIA FOUNDATION)
- KBCO-FM (97.3 FM; BOULDER, CO; Owner: CITICASTERS LICENSES, L.P.)
- KYGO-FM (98.5 FM; DENVER, CO; Owner: JEFFERSON-PILOT COMMUNICATIONS COMPANY OF COLORADO)
- KXPK (96.5 FM; EVERGREEN, CO; Owner: ENTRAVISION HOLDINGS, LLC)
- KRKS-FM (94.7 FM; LAFAYETTE, CO; Owner: SALEM MEDIA OF COLORADO, INC)
- KJCD (104.3 FM; LONGMONT, CO; Owner: JEFFERSON-PILOT COMMUNICATIONS COMPANY OF COLORADO)
- KDJM (92.5 FM; BROOMFIELD, CO; Owner: INFINITY RADIO OPERATIONS INC.)
- KJMN (92.1 FM; CASTLE ROCK, CO; Owner: ENTRAVISION HOLDINGS, LLC)
TV broadcast stations around Golden:
- KUSA-TV (Channel 9; DENVER, CO; Owner: MULTIMEDIA HOLDINGS CORPORATION)
- KTVD (Channel 20; DENVER, CO; Owner: TWENVER BROADCAST, INC.)
- KCNC-TV (Channel 4; DENVER, CO; Owner: CBS TELEVISION STATIONS INC.)
- KWGN-TV (Channel 2; DENVER, CO; Owner: KWGN INC.)
- KDVR (Channel 31; DENVER, CO; Owner: FOX TELEVISION STATIONS, INC.)
- KDVT-LP (Channel 36; DENVER, CO; Owner: ENTRAVISION HOLDINGS, LLC)
- KMAS-LP (Channel 63; DENVER, CO; Owner: TELEMUNDO OF STEAMBOAT SPRINGS COLO. LIC. CORP.)
- KCEC (Channel 50; DENVER, CO; Owner: ENTRAVISION HOLDINGS, LLC)
- KMGH-TV (Channel 7; DENVER, CO; Owner: MCGRAW-HILL BROADCASTING COMPANY, INC.)
- KPXC-TV (Channel 59; DENVER, CO; Owner: PAXSON DENVER LICENSE, INC.)
- K57BT (Channel 57; DENVER, CO; Owner: TRINITY BROADCASTING OF DENVER, INC.)
- KRMA-TV (Channel 6; DENVER, CO; Owner: ROCKY MOUNTAIN PUBLIC BROADCASTING NETWORK, INC.)
- K48FW (Channel 48; DENVER, CO; Owner: TRINITY BROADCASTING NETWORK)
- KDEN (Channel 25; LONGMONT, CO; Owner: LONGMONT CHANNEL 25, INC.)
- KDEO-LP (Channel 38; AURORA, CO; Owner: PETER B. VAN DE SANDE)
- KRMT (Channel 41; DENVER, CO; Owner: WORD OF GOD FELLOWSHIP, INC.)
- KDEV-LP (Channel 62; AURORA, CO; Owner: TIGER EYE BROADCASTING CORPORATION)
- K47IH (Channel 47; BOULDER, CO; Owner: CHANNEL 20 TV COMPANY)
- K66FB (Channel 66; DENVER, CO; Owner: TRINITY BROADCASTING NETWORK)
- K44CT (Channel 44; BOULDER, CO; Owner: ROCKY MOUNTAIN PUBLIC BROADCASTING NETWORK, INC.)
- National Bridge Inventory (NBI) Statistics
- 55Number of bridges
- 587ft / 179mTotal length
- $14,513,000Total costs
- 1,296,015Total average daily traffic
- 72,735Total average daily truck traffic
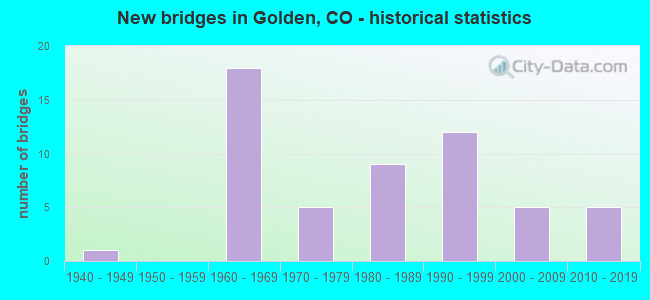
- New bridges - historical statistics
- 11940-1949
- 181960-1969
- 51970-1979
- 91980-1989
- 121990-1999
- 52000-2009
- 52010-2019
FCC Registered Antenna Towers: 102 (See the full list of FCC Registered Antenna Towers)
FCC Registered Commercial Land Mobile Towers: 14 (See the full list of FCC Registered Commercial Land Mobile Towers in Golden, CO)
FCC Registered Private Land Mobile Towers: 12 (See the full list of FCC Registered Private Land Mobile Towers)
FCC Registered Broadcast Land Mobile Towers: 86 (See the full list of FCC Registered Broadcast Land Mobile Towers)
FCC Registered Microwave Towers: 243 (See the full list of FCC Registered Microwave Towers in this town)
FCC Registered Paging Towers: 28 (See the full list of FCC Registered Paging Towers)
FCC Registered Amateur Radio Licenses: 485 (See the full list of FCC Registered Amateur Radio Licenses in Golden)
FAA Registered Aircraft Manufacturers and Dealers: 9 (See the full list of FAA Registered Manufacturers and Dealers in Golden)
FAA Registered Aircraft: 85 (See the full list of FAA Registered Aircraft)
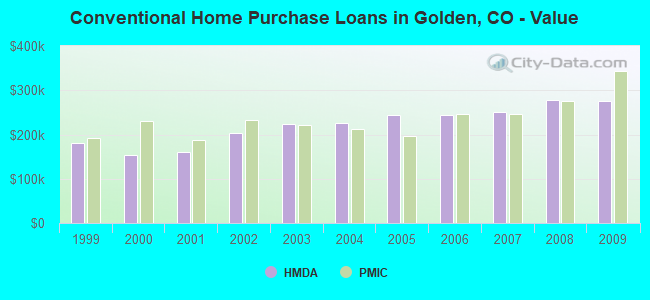
| Home Mortgage Disclosure Act Aggregated Statistics For Year 2009 (Based on 1 full and 4 partial tracts) | ||||||||||||||
| A) FHA, FSA/RHS & VA Home Purchase Loans | B) Conventional Home Purchase Loans | C) Refinancings | D) Home Improvement Loans | E) Loans on Dwellings For 5+ Families | F) Non-occupant Loans on < 5 Family Dwellings (A B C & D) | G) Loans On Manufactured Home Dwelling (A B C & D) | ||||||||
|---|---|---|---|---|---|---|---|---|---|---|---|---|---|---|
| Number | Average Value | Number | Average Value | Number | Average Value | Number | Average Value | Number | Average Value | Number | Average Value | Number | Average Value | |
| LOANS ORIGINATED | 16 | $256,727 | 53 | $276,371 | 260 | $268,896 | 6 | $88,300 | 1 | $1,837,780 | 18 | $251,314 | 0 | $0 |
| APPLICATIONS APPROVED, NOT ACCEPTED | 0 | $0 | 5 | $309,712 | 23 | $289,421 | 1 | $17,190 | 0 | $0 | 1 | $244,750 | 1 | $32,970 |
| APPLICATIONS DENIED | 2 | $178,075 | 8 | $193,868 | 59 | $286,052 | 3 | $189,770 | 0 | $0 | 9 | $205,718 | 2 | $21,045 |
| APPLICATIONS WITHDRAWN | 1 | $172,790 | 10 | $231,004 | 29 | $247,137 | 1 | $224,870 | 0 | $0 | 4 | $165,885 | 0 | $0 |
| FILES CLOSED FOR INCOMPLETENESS | 0 | $0 | 1 | $85,200 | 10 | $404,651 | 1 | $37,120 | 0 | $0 | 1 | $178,220 | 0 | $0 |
Detailed HMDA statistics for the following Tracts: 0098.42 , 0098.43, 0098.44, 0099.00, 0100.00
| Private Mortgage Insurance Companies Aggregated Statistics For Year 2009 (Based on 1 full and 4 partial tracts) | ||||
| A) Conventional Home Purchase Loans | B) Refinancings | |||
|---|---|---|---|---|
| Number | Average Value | Number | Average Value | |
| LOANS ORIGINATED | 5 | $342,756 | 7 | $327,213 |
| APPLICATIONS APPROVED, NOT ACCEPTED | 1 | $215,860 | 1 | $388,940 |
| APPLICATIONS DENIED | 2 | $220,915 | 1 | $386,300 |
| APPLICATIONS WITHDRAWN | 1 | $238,900 | 1 | $370,960 |
| FILES CLOSED FOR INCOMPLETENESS | 0 | $0 | 0 | $0 |
Detailed PMIC statistics for the following Tracts: 0098.42 , 0098.43, 0098.44, 0099.00, 0100.00

2002 - 2018 National Fire Incident Reporting System (NFIRS) incidents
- Fire incident types reported to NFIRS in Golden, CO
- 1,23139.1%Outside Fires
- 91629.1%Structure Fires
- 86327.4%Mobile Property/Vehicle Fires
- 1384.4%Other
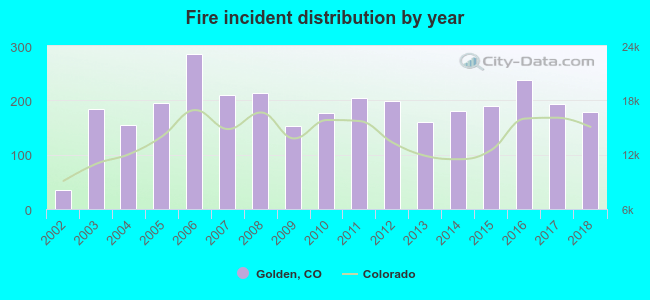 Based on the data from the years 2002 - 2018 the average number of fires per year is 185. The highest number of fires - 285 took place in 2006, and the least - 35 in 2002. The data has an increasing trend.
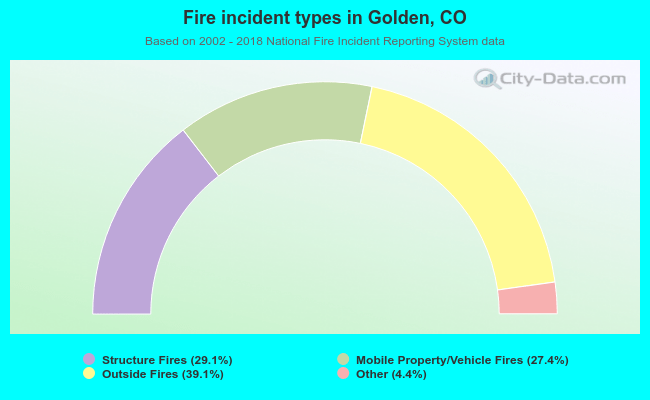 When looking into fire subcategories, the most incidents belonged to: Outside Fires (39.1%), and Structure Fires (29.1%).
Fire-safe hotels and motels in Golden, Colorado:
- La Quinta Inn, 3301 Youngfield Service Rd, Golden, Colorado 80401 , Phone: (303) 279-5565, Fax: (303) 279-5841
- Days Inn & Suites - Golden / Denver West, 15059 W Colfax Ave, Golden, Colorado 80401 , Phone: (303) 277-0200, Fax: (303) 279-2812
- Table Mountain Inn, 1310 Washington Ave, Golden, Colorado 80401 , Phone: (303) 277-9898, Fax: (303) 271-0298
- Fairfield Inn, 11907 W 6TH Ave, Golden, Colorado 80401 , Phone: (303) 231-9939, Fax: (303) 235-4552
- Candlewood Suites Denver Lakewood, 895 Tabor St, Golden, Colorado 80401 , Phone: (303) 232-7171, Fax: (303) 232-7979
- Lakewood Americinn Hotel, 11909 W 6TH Ave, Golden, Colorado 80401 , Phone: (303) 231-9929, Fax: (303) 231-9129
- Quality Suites Of Evergreen, 29300 U S Hwy 40, Golden, Colorado 80401 , Phone: (303) 526-2000, Fax: (303) 526-0330
- Holiday Inn Express, 17140 W Colfax Ave, Golden, Colorado 80401 , Phone: (303) 278-2388, Fax: (303) 278-2389
- 4 other hotels and motels
| Most common first names in Golden, CO among deceased individuals | ||
| Name | Count | Lived (average) |
|---|---|---|
| John | 261 | 74.3 years |
| Mary | 206 | 78.5 years |
| Robert | 201 | 68.9 years |
| William | 196 | 74.2 years |
| James | 138 | 69.0 years |
| Margaret | 114 | 79.3 years |
| Charles | 109 | 74.6 years |
| Helen | 104 | 81.9 years |
| George | 100 | 75.6 years |
| Ruth | 90 | 79.0 years |
| Most common last names in Golden, CO among deceased individuals | ||
| Last name | Count | Lived (average) |
|---|---|---|
| Smith | 86 | 76.2 years |
| Johnson | 78 | 76.2 years |
| Miller | 50 | 79.6 years |
| Jones | 45 | 72.2 years |
| Anderson | 38 | 76.8 years |
| Brown | 38 | 77.9 years |
| Moore | 35 | 70.4 years |
| Thompson | 34 | 76.9 years |
| Williams | 31 | 74.6 years |
| Nelson | 31 | 77.3 years |
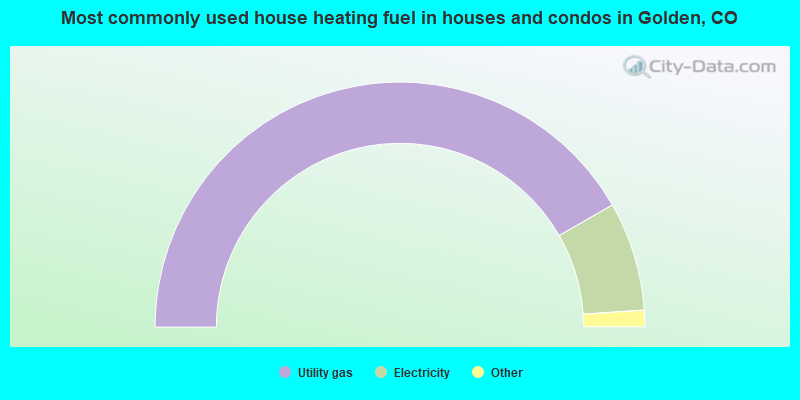
- 83.5%Utility gas
- 14.4%Electricity
- 1.0%Solar energy
- 0.7%Bottled, tank, or LP gas
- 0.3%Wood
- 0.2%Other fuel
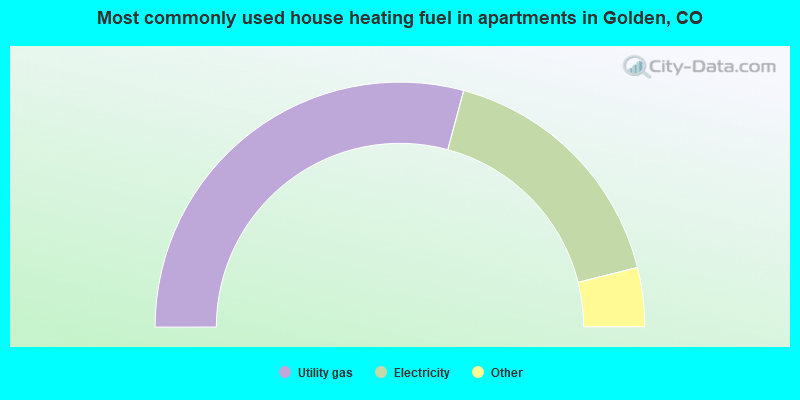
- 58.4%Utility gas
- 33.8%Electricity
- 2.2%Wood
- 2.1%Bottled, tank, or LP gas
- 1.7%No fuel used
- 1.4%Other fuel
- 0.3%Fuel oil, kerosene, etc.
Golden compared to Colorado state average:
- Median house value above state average.
- Unemployed percentage significantly below state average.
- Black race population percentage below state average.
- Hispanic race population percentage below state average.
- Median age below state average.
- Length of stay since moving in significantly above state average.
- Institutionalized population percentage significantly above state average.
- Number of college students above state average.
- Percentage of population with a bachelor's degree or higher above state average.
Golden on our top lists:
- #11 on the list of "Top 101 cities with largest percentage of females in occupations: life, physical, and social science occupations (population 5,000+)"
- #26 on the list of "Top 101 cities with the most local government spending on current operations of parks and recreation per resident (population 10,000+)"
- #47 on the list of "Top 101 cities with the largest percentage of people in training schools for juvenile delinquents (population 1,000+)"
- #83 on the list of "Top 101 cities with largest percentage of females in occupations: architecture and engineering occupations (population 5,000+)"
- #93 on the list of "Top 100 highest located cities (pop. 5,000+)"
- #12 on the list of "Top 101 counties with the highest percentage of residents that exercised in the past month"
- #19 on the list of "Top 101 counties with the largest increase in the number of deaths per 1000 residents 2000-2006 to 2007-2013 (pop. 50,000+)"
- #22 on the list of "Top 101 counties with the best general health status score of residents (1-5), 3 years of data"
- #45 on the list of "Top 101 counties with the lowest average weight of females"
- #55 on the list of "Top 101 counties with the highest surface withdrawal of fresh water for public supply (pop. 50,000+)"

|
|
Total of 1877 patent applications in 2008-2024.