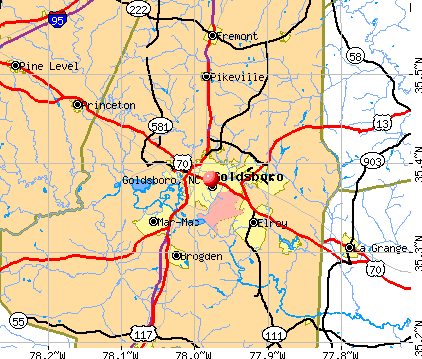
Goldsboro, North Carolina
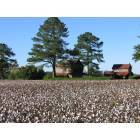
Goldsboro: Old cotton farms
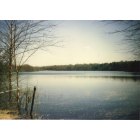
Goldsboro: MacArthur Lake be hind our house
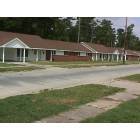
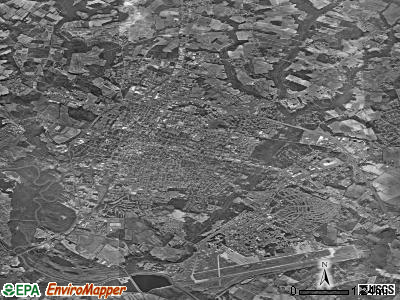
Goldsboro: Seymour Johnson AFB Housing Project Golsdboro NC
- add
your
Submit your own pictures of this city and show them to the world
- OSM Map
- General Map
- Google Map
- MSN Map
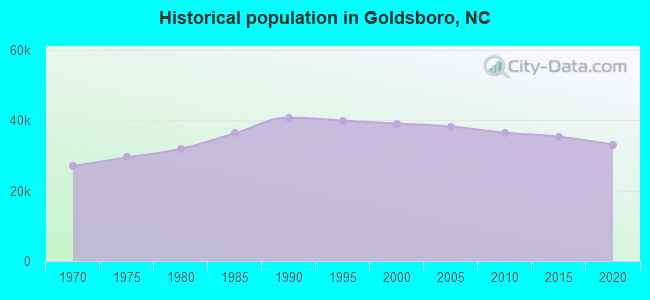
Population change since 2000: -14.9%
 |
| Males: 16,091 | |
| Females: 17,124 |
| Median resident age: | 37.1 years |
| North Carolina median age: | 39.2 years |
Zip codes: 27530.
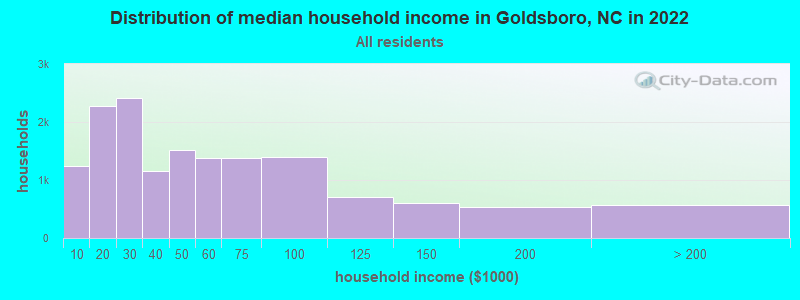
| Goldsboro: | $45,225 |
| NC: | $67,481 |
Estimated per capita income in 2022: $28,006 (it was $16,614 in 2000)
Goldsboro city income, earnings, and wages data
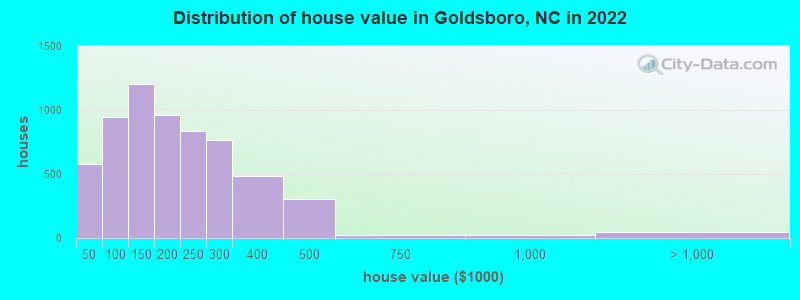
Estimated median house or condo value in 2022: $177,326 (it was $83,400 in 2000)
| Goldsboro: | $177,326 |
| NC: | $280,600 |
Mean prices in 2022: all housing units: $207,270; detached houses: $239,746; townhouses or other attached units: $201,784; in 2-unit structures: $197,760; in 5-or-more-unit structures: $292,594; mobile homes: $95,170; occupied boats, rvs, vans, etc.: $510,425
Median gross rent in 2022: $972.
(11.2% for White Non-Hispanic residents, 28.5% for Black residents, 4.7% for Hispanic or Latino residents, 16.7% for American Indian residents, 100.0% for Native Hawaiian and other Pacific Islander residents, 7.1% for other race residents, 14.9% for two or more races residents)
Detailed information about poverty and poor residents in Goldsboro, NC


Compare current foreclosures in Goldsboro, NC:
| Photo | Address | Area | Beds / Baths | Price | Details |
|---|---|---|---|---|---|

|
#1
Croom Dr
Goldsboro, NC 27530
|
1,328 sq. feet
|
1 baths 3 beds |
$32,000
|
show details |

|
#2
Courtland Ave
Goldsboro, NC 27534
|
1,620 sq. feet
|
2 baths 3 beds |
show details | |

|
#3
Remount Rd
Goldsboro, NC 27534
|
1,531 sq. feet
|
2 baths 3 beds |
show details | |

|
#4
W Hill St
Goldsboro, NC 27534
|
2,356 sq. feet
|
2 baths 3 beds |
show details | |

|
#5
Judy Pl
Goldsboro, NC 27530
|
1,200 sq. feet
|
2 baths 3 beds |
show details | |

|
#6
Sandhill Dr
Goldsboro, NC 27530
|
1,664 sq. feet
|
2 baths 3 beds |
show details | |

|
#7
Creek Ridge Dr
Goldsboro, NC 27530
|
1,424 sq. feet
|
2 baths 3 beds |
show details | |

|
#8
Belfast Ave
Goldsboro, NC 27530
|
780 sq. feet
|
2 baths 5 beds |
show details | |

|
#9
Jacobs Ridge Dr
Goldsboro, NC 27534
|
2,200 sq. feet
|
2 baths 3 beds |
show details | |

|
#10
N James St
Goldsboro, NC 27530
|
1,663 sq. feet
|
2 baths 3 beds |
show details |
| Photo | Address | Area | Beds / Baths | Price | Details |
|---|---|---|---|---|---|

|
#11
Slick Rock Rd
Goldsboro, NC 27534
|
1,248 sq. feet
|
2 baths 3 beds |
show details | |

|
#12
Bayleaf Dr
Goldsboro, NC 27534
|
2,248 sq. feet
|
2 baths 3 beds |
show details | |

|
#13
Johnson Branch Rd
Goldsboro, NC 27534
|
1,885 sq. feet
|
2 baths 3 beds |
show details | |

|
#14
Gurley Ave
Goldsboro, NC 27534
|
1,344 sq. feet
|
2 baths 3 beds |
show details | |

|
#15
Rollins Rd
Goldsboro, NC 27534
|
1,025 sq. feet
|
1 baths 3 beds |
show details | |

|
#16
E Elm St
Goldsboro, NC 27530
|
1,155 sq. feet
|
1 baths 3 beds |
show details | |

|
#17
Randall Ln
Goldsboro, NC 27534
|
1,255 sq. feet
|
1 baths 3 beds |
show details | |

|
#18
S Best St
Goldsboro, NC 27530
|
2,145 sq. feet
|
2 baths 3 beds |
show details | |

|
#19
Beech St
Goldsboro, NC 27530
|
1,404 sq. feet
|
1 baths 3 beds |
show details | |

|
#20
Antioch Rd
Goldsboro, NC 27534
|
1,782 sq. feet
|
2 baths 3 beds |
show details |
| Photo | Address | Area | Beds / Baths | Price | Details |
|---|---|---|---|---|---|

|
#21
Hare Rd
Goldsboro, NC 27534
|
1,440 sq. feet
|
2 baths 3 beds |
show details | |

|
#22
Forest Dr
Goldsboro, NC 27534
|
1,350 sq. feet
|
1 baths 3 beds |
show details | |

|
#23
Ashworth Dr
Goldsboro, NC 27530
|
2,377 sq. feet
|
2 baths 3 beds |
show details | |

|
#24
Adler Ln
Goldsboro, NC 27530
|
2,357 sq. feet
|
2 baths 3 beds |
show details | |

|
#25
Glenhaven Ln
Goldsboro, NC 27530
|
2,026 sq. feet
|
2 baths 3 beds |
show details | |

|
#26
Wesley Dr
Goldsboro, NC 27534
|
1,444 sq. feet
|
2 baths 3 beds |
show details | |

|
#27
Kelly Dr
Goldsboro, NC 27530
|
2,400 sq. feet
|
2 baths 4 beds |
show details | |

|
#28
Shamrock Rd
Goldsboro, NC 27530
|
1,577 sq. feet
|
2 baths 3 beds |
show details | |

|
#29
S Marion Dr
Goldsboro, NC 27534
|
1,691 sq. feet
|
2 baths 3 beds |
show details | |

|
#30
Brantwood Dr
Goldsboro, NC 27534
|
1,278 sq. feet
|
2 baths 3 beds |
show details |
| Photo | Address | Area | Beds / Baths | Price | Details |
|---|---|---|---|---|---|

|
#31
Myrna Dr
Goldsboro, NC 27534
|
1,750 sq. feet
|
2 baths 3 beds |
show details | |

|
#32
Whitfield Dr
Goldsboro, NC 27530
|
1,308 sq. feet
|
1 baths 3 beds |
show details | |

|
#33
Penn Cir
Goldsboro, NC 27530
|
1,665 sq. feet
|
2 baths 3 beds |
show details | |

|
#34
Florence Dr
Goldsboro, NC 27530
|
1,344 sq. feet
|
2 baths 3 beds |
show details | |

|
#35
Bear Creek Rd
Goldsboro, NC 27534
|
1,877 sq. feet
|
2 baths 3 beds |
show details | |

|
#36
Summit Dr
Goldsboro, NC 27530
|
1,884 sq. feet
|
1 baths 3 beds |
show details | |

|
#37
Randall Ln
Goldsboro, NC 27534
|
1,512 sq. feet
|
2 baths 3 beds |
show details | |

|
#38
North Dr
Goldsboro, NC 27534
|
1,144 sq. feet
|
1 baths 3 beds |
show details | |

|
#39
Crestwood Dr
Goldsboro, NC 27530
|
1,502 sq. feet
|
2 baths 3 beds |
show details | |

|
#40
Herbert St
Goldsboro, NC 27530
|
1,234 sq. feet
|
1 baths 3 beds |
show details |
| Photo | Address | Area | Beds / Baths | Price | Details |
|---|---|---|---|---|---|

|
#41
Mcwood Pl
Goldsboro, NC 27530
|
1,923 sq. feet
|
2 baths 3 beds |
show details | |

|
#42
Harvest Moon Dr
Goldsboro, NC 27534
|
- sq. feet
|
- baths - beds |
show details | |

|
#43
Scott Hills Dr Apt I1
Goldsboro, NC 27530
|
- sq. feet
|
- baths - beds |
show details | |

|
#44
Woodmere Ln
Goldsboro, NC 27530
|
- sq. feet
|
- baths - beds |
show details | |

|
#45
Arendale Dr
Goldsboro, NC 27530
|
- sq. feet
|
- baths - beds |
show details | |

|
#46
N Jackson St
Goldsboro, NC 27530
|
- sq. feet
|
- baths - beds |
show details | |

|
#47
N Leslie St # C
Goldsboro, NC 27530
|
- sq. feet
|
- baths - beds |
show details | |

|
#48
Gurley Ave
Goldsboro, NC 27534
|
- sq. feet
|
- baths - beds |
show details | |

|
#49
Peachtree St
Goldsboro, NC 27530
|
- sq. feet
|
- baths - beds |
show details | |

|
Check over 1 million property listings on Foreclosure.com!
|
browse all offers | |||


- 16,39948.9%Black alone
- 11,22333.5%White alone
- 2,4687.4%Two or more races
- 1,7985.4%Hispanic
- 7442.2%Asian alone
- 1070.3%American Indian alone
- 760.2%Native Hawaiian and Other
Pacific Islander alone - 640.2%Other race alone
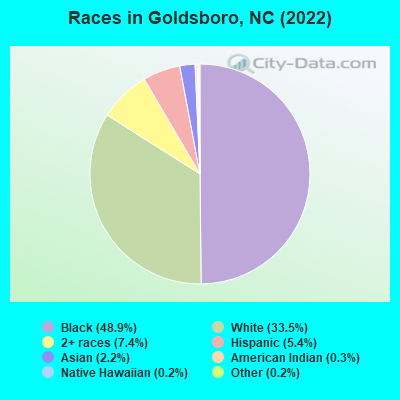
Races in Goldsboro detailed stats: ancestries, foreign born residents, place of birth
According to our research of North Carolina and other state lists, there were 168 registered sex offenders living in Goldsboro, North Carolina as of April 26, 2024.
The ratio of all residents to sex offenders in Goldsboro is 218 to 1.
Type |
2009 |
2010 |
2011 |
2012 |
2013 |
2014 |
2015 |
2016 |
2017 |
2018 |
2019 |
2020 |
2021 |
2022 |
|---|---|---|---|---|---|---|---|---|---|---|---|---|---|---|
| Murders (per 100,000) | 8 (21.4) | 5 (13.7) | 7 (19.0) | 13 (35.0) | 5 (13.4) | 6 (16.4) | 9 (25.0) | 11 (30.7) | 10 (27.9) | 1 (2.8) | 2 (5.9) | 2 (5.9) | 7 (20.4) | 6 (18.5) |
| Rapes (per 100,000) | 9 (24.1) | 3 (8.2) | 2 (5.4) | 3 (8.1) | 3 (8.1) | 1 (2.7) | 2 (5.6) | 3 (8.4) | 1 (2.8) | 2 (5.7) | 8 (23.5) | 11 (32.3) | 12 (34.9) | 15 (46.2) |
| Robberies (per 100,000) | 92 (245.9) | 105 (288.2) | 91 (246.6) | 73 (196.7) | 67 (180.0) | 74 (202.8) | 91 (252.5) | 84 (234.2) | 75 (209.4) | 20 (56.9) | 51 (149.6) | 46 (135.1) | 41 (119.4) | 38 (117.1) |
| Assaults (per 100,000) | 214 (571.9) | 273 (749.2) | 243 (658.6) | 223 (601.0) | 208 (558.7) | 247 (677.1) | 363 (1,007) | 291 (811.2) | 184 (513.6) | 100 (284.4) | 208 (610.2) | 341 (1,001) | 264 (768.5) | 307 (945.7) |
| Burglaries (per 100,000) | 730 (1,951) | 734 (2,014) | 675 (1,829) | 584 (1,574) | 571 (1,534) | 462 (1,266) | 538 (1,493) | 484 (1,349) | 337 (940.7) | 146 (415.3) | 386 (1,132) | 354 (1,040) | 245 (713.2) | 241 (742.4) |
| Thefts (per 100,000) | 1,789 (4,781) | 1,663 (4,564) | 1,840 (4,987) | 1,648 (4,441) | 1,670 (4,486) | 1,655 (4,537) | 1,621 (4,499) | 1,416 (3,947) | 1,399 (3,905) | 530 (1,507) | 1,514 (4,442) | 1,287 (3,780) | 1,151 (3,351) | 1,302 (4,011) |
| Auto thefts (per 100,000) | 138 (368.8) | 128 (351.3) | 140 (379.4) | 125 (336.9) | 103 (276.7) | 92 (252.2) | 85 (235.9) | 99 (276.0) | 60 (167.5) | 43 (122.3) | 100 (293.4) | 89 (261.4) | 98 (285.3) | 117 (360.4) |
| Arson (per 100,000) | 3 (8.0) | 5 (13.7) | 2 (5.4) | 0 (0.0) | 2 (5.4) | 5 (13.7) | 2 (5.6) | 5 (13.9) | 2 (5.6) | 1 (2.8) | 3 (8.8) | 3 (8.8) | 4 (11.6) | 2 (6.2) |
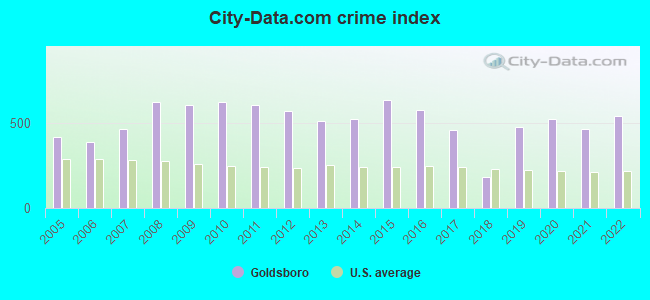
| City-Data.com crime index | 607.4 | 622.0 | 605.8 | 570.5 | 508.0 | 521.6 | 635.0 | 574.9 | 459.0 | 183.3 | 477.9 | 523.3 | 465.0 | 539.4 |
The City-Data.com crime index weighs serious crimes and violent crimes more heavily. Higher means more crime, U.S. average is 246.1. It adjusts for the number of visitors and daily workers commuting into cities.
Crime rate in Goldsboro detailed stats: murders, rapes, robberies, assaults, burglaries, thefts, arson
Full-time law enforcement employees in 2021, including police officers: 92 (80 officers - 69 male; 11 female).
| Officers per 1,000 residents here: | 2.33 |
| North Carolina average: | 2.27 |
 Recent articles from our blog. Our writers, many of them Ph.D. graduates or candidates, create easy-to-read articles on a wide variety of topics.

 | Pros/Cons of Living in Goldsboro (2 replies) |
| Goldsboro is growing again! (1077 replies) |
| Greensboro to Fayetteville: Future I-685 (58 replies) |
| What's the job market like in Goldsboro? (11 replies) |
| I-42 and I-87 (676 replies) |
| Raleigh and Durham Top 10 in US Brain Concentration Index, Goldsboro in Bottom 10 (16 replies) |
Latest news from Goldsboro, NC collected exclusively by city-data.com from local newspapers, TV, and radio stations
Ancestries: English (9.4%), American (5.4%), Irish (4.0%), German (3.9%), European (2.2%), Haitian (1.9%).
Current Local Time: EST time zone
Incorporated in 1847
Elevation: 34 feet
Land area: 24.8 square miles.
Population density: 1,340 people per square mile (low).
1,585 residents are foreign born (1.8% Latin America, 1.6% Asia, 0.7% Europe).
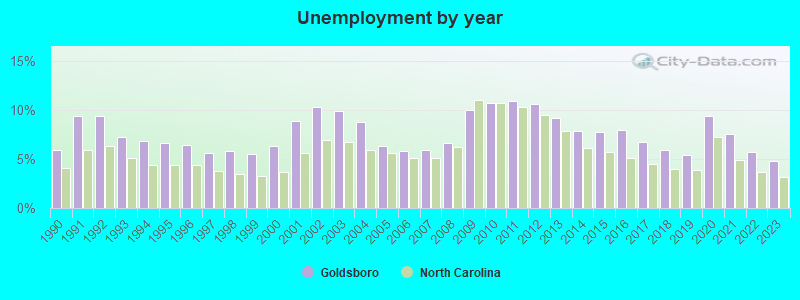
| This city: | 4.7% |
| North Carolina: | 8.3% |
Median real estate property taxes paid for housing units with mortgages in 2022: $1,788 (0.9%)
Median real estate property taxes paid for housing units with no mortgage in 2022: $1,412 (0.9%)
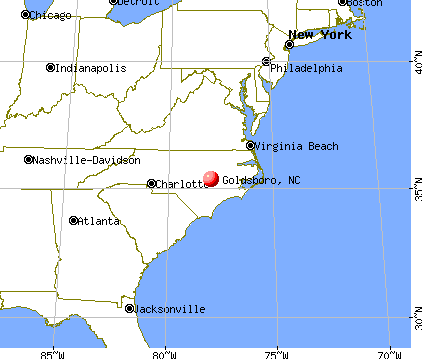
Nearest city with pop. 50,000+: Greenville, NC  (37.3 miles , pop. 60,476).
Nearest city with pop. 200,000+: Raleigh, NC (48.2 miles , pop. 276,093).
Nearest city with pop. 1,000,000+: Philadelphia, PA (354.9 miles , pop. 1,517,550).
Nearest cities:
), ), ), ), ), ), )Latitude: 35.38 N, Longitude: 77.98 W
Daytime population change due to commuting: +19,326 (+57.7%)
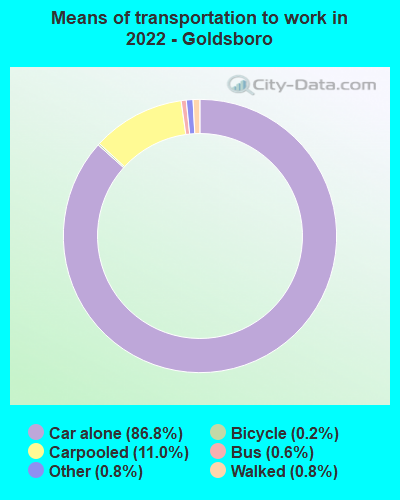
Workers who live and work in this city: 9,404 (66.8%)
Area code: 919
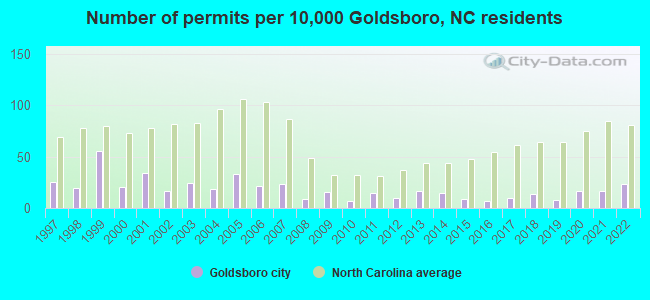
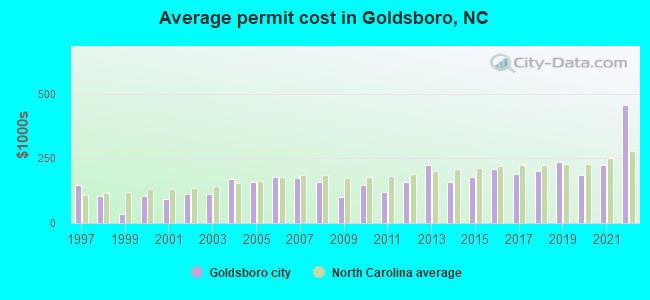
Single-family new house construction building permits:
- 2022: 89 buildings, average cost: $457,800
- 2021: 68 buildings, average cost: $225,600
- 2020: 68 buildings, average cost: $185,100
- 2019: 33 buildings, average cost: $236,400
- 2018: 53 buildings, average cost: $203,400
- 2017: 39 buildings, average cost: $191,100
- 2016: 29 buildings, average cost: $209,000
- 2015: 37 buildings, average cost: $178,700
- 2014: 59 buildings, average cost: $158,700
- 2013: 65 buildings, average cost: $224,400
- 2012: 38 buildings, average cost: $157,700
- 2011: 60 buildings, average cost: $119,700
- 2010: 27 buildings, average cost: $146,200
- 2009: 62 buildings, average cost: $101,400
- 2008: 34 buildings, average cost: $159,500
- 2007: 91 buildings, average cost: $176,400
- 2006: 81 buildings, average cost: $180,200
- 2005: 130 buildings, average cost: $157,400
- 2004: 69 buildings, average cost: $168,700
- 2003: 95 buildings, average cost: $113,900
- 2002: 66 buildings, average cost: $110,700
- 2001: 132 buildings, average cost: $92,700
- 2000: 80 buildings, average cost: $102,500
- 1999: 215 buildings, average cost: $35,300
- 1998: 73 buildings, average cost: $105,000
- 1997: 96 buildings, average cost: $146,900
| Here: | 4.8% |
| North Carolina: | 3.2% |
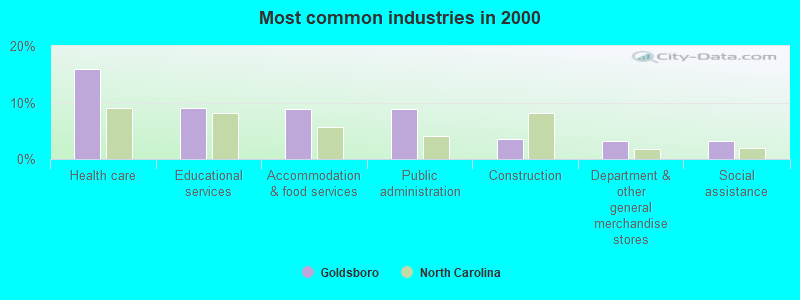
- Health care (15.9%)
- Educational services (8.9%)
- Accommodation & food services (8.8%)
- Public administration (8.8%)
- Construction (3.6%)
- Department & other general merchandise stores (3.2%)
- Social assistance (3.2%)
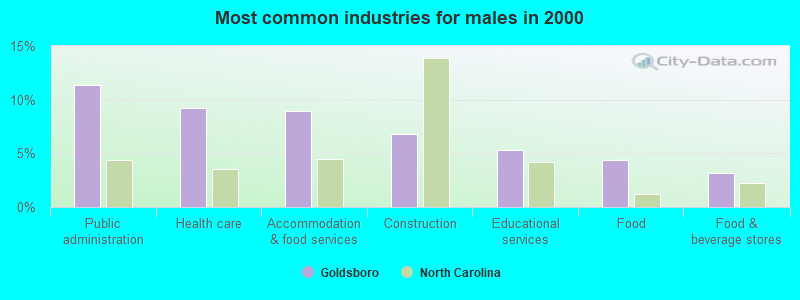
- Public administration (11.4%)
- Health care (9.3%)
- Accommodation & food services (8.9%)
- Construction (6.8%)
- Educational services (5.3%)
- Food (4.4%)
- Food & beverage stores (3.1%)
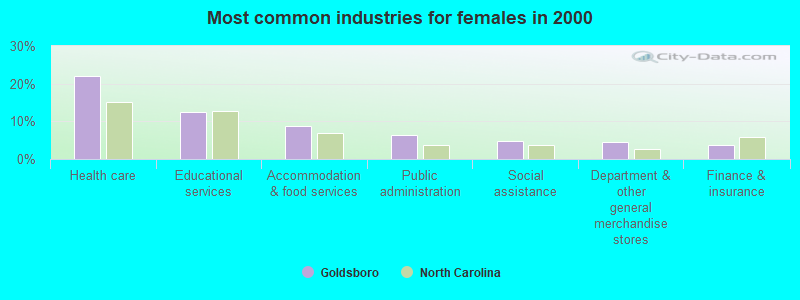
- Health care (22.2%)
- Educational services (12.4%)
- Accommodation & food services (8.7%)
- Public administration (6.3%)
- Social assistance (4.7%)
- Department & other general merchandise stores (4.6%)
- Finance & insurance (3.7%)
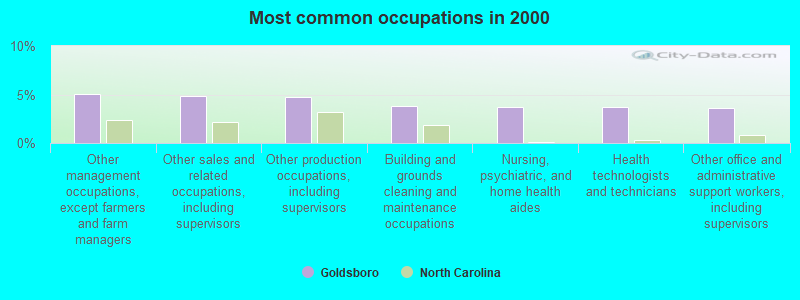
- Other management occupations, except farmers and farm managers (5.1%)
- Other sales and related occupations, including supervisors (4.8%)
- Other production occupations, including supervisors (4.7%)
- Building and grounds cleaning and maintenance occupations (3.8%)
- Nursing, psychiatric, and home health aides (3.7%)
- Health technologists and technicians (3.7%)
- Other office and administrative support workers, including supervisors (3.6%)
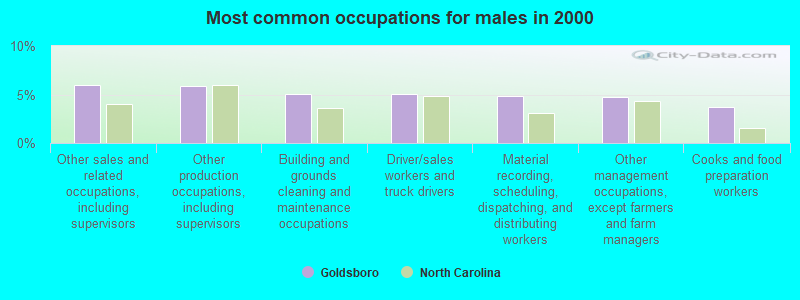
- Other sales and related occupations, including supervisors (5.9%)
- Other production occupations, including supervisors (5.9%)
- Building and grounds cleaning and maintenance occupations (5.0%)
- Driver/sales workers and truck drivers (5.0%)
- Material recording, scheduling, dispatching, and distributing workers (4.8%)
- Other management occupations, except farmers and farm managers (4.8%)
- Cooks and food preparation workers (3.8%)
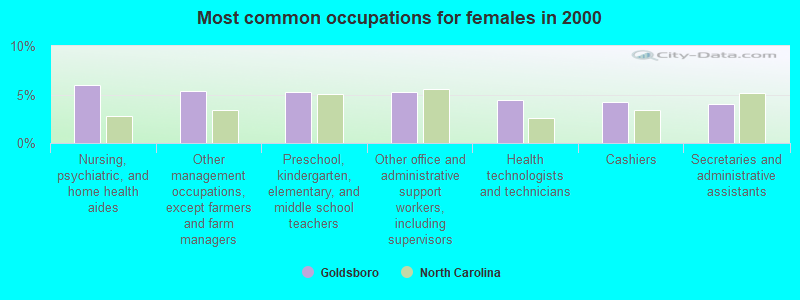
- Nursing, psychiatric, and home health aides (6.0%)
- Other management occupations, except farmers and farm managers (5.4%)
- Preschool, kindergarten, elementary, and middle school teachers (5.3%)
- Other office and administrative support workers, including supervisors (5.2%)
- Health technologists and technicians (4.4%)
- Cashiers (4.2%)
- Secretaries and administrative assistants (4.0%)
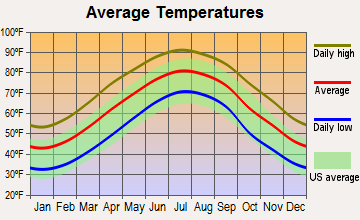
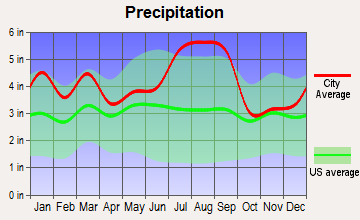
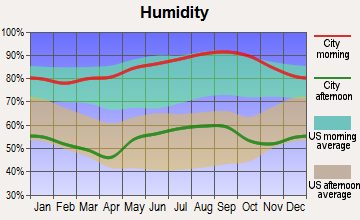
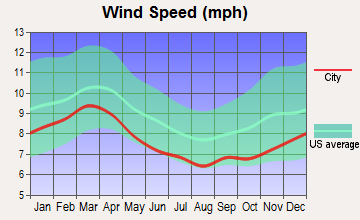
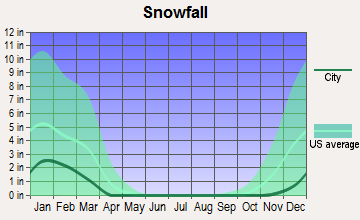
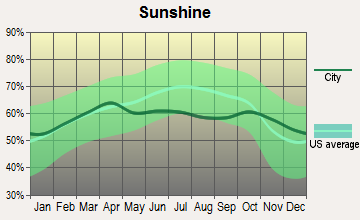
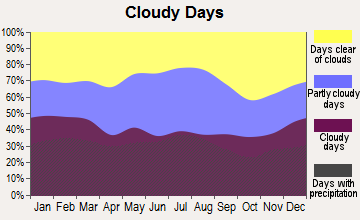
Average climate in Goldsboro, North Carolina
Based on data reported by over 4,000 weather stations
|
|


(lower is better)
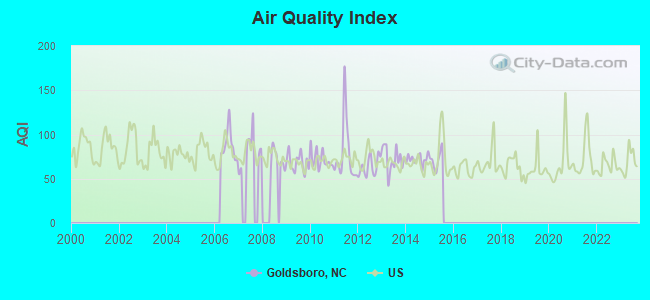
Air Quality Index (AQI) level in 2015 was 71.5. This is about average.
| City: | 71.5 |
| U.S.: | 72.6 |
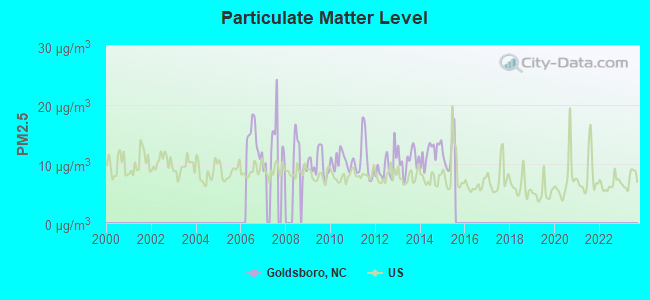
Particulate Matter (PM2.5) [µg/m3] level in 2015 was 11.9. This is significantly worse than average. Closest monitor was 1.3 miles away from the city center.
| City: | 11.9 |
| U.S.: | 8.1 |
Tornado activity:
Goldsboro-area historical tornado activity is slightly above North Carolina state average. It is 16% greater than the overall U.S. average.
On 3/28/1984, a category F4 (max. wind speeds 207-260 mph) tornado 8.2 miles away from the Goldsboro city center killed 3 people and injured 149 people and caused between $5,000,000 and $50,000,000 in damages.
On 3/28/1984, a category F4 tornado 11.7 miles away from the city center killed 16 people and injured 153 people and caused between $5,000,000 and $50,000,000 in damages.
Earthquake activity:
Goldsboro-area historical earthquake activity is significantly above North Carolina state average. It is 59% smaller than the overall U.S. average.On 8/23/2011 at 17:51:04, a magnitude 5.8 (5.8 MW, Depth: 3.7 mi, Class: Moderate, Intensity: VI - VII) earthquake occurred 174.9 miles away from Goldsboro center
On 8/9/2020 at 12:07:37, a magnitude 5.1 (5.1 MW, Depth: 4.7 mi) earthquake occurred 190.2 miles away from the city center
On 12/9/2003 at 20:59:14, a magnitude 4.5 (4.5 MB, 4.5 LG, Class: Light, Intensity: IV - V) earthquake occurred 152.6 miles away from the city center
On 12/9/2003 at 20:59:18, a magnitude 4.5 (4.5 ML, Depth: 6.2 mi) earthquake occurred 165.6 miles away from the city center
On 11/22/1974 at 05:25:55, a magnitude 4.7 (4.7 MB) earthquake occurred 211.8 miles away from Goldsboro center
On 8/25/2011 at 05:07:52, a magnitude 4.5 (4.5 ML, Depth: 4.2 mi) earthquake occurred 177.4 miles away from Goldsboro center
Magnitude types: regional Lg-wave magnitude (LG), body-wave magnitude (MB), local magnitude (ML), moment magnitude (MW)
Natural disasters:
The number of natural disasters in Wayne County (20) is greater than the US average (15).Major Disasters (Presidential) Declared: 10
Emergencies Declared: 6
Causes of natural disasters: Hurricanes: 13, Storms: 3, Tornadoes: 3, Floods: 2, Ice Storms: 2, Drought: 1, Other: 1 (Note: some incidents may be assigned to more than one category).
Hospitals in Goldsboro:
- AIRPORT ROAD GROUP HOME (195 AIRPORT ROAD)
- CHERRY HOSPITAL (provides emergency services, 201 STEVENS MILL ROAD)
- CHERRY HOSPITAL-GENERAL MEDICAL (CALLER BOX 8000)
- HIGHWAY 117 GROUP HOME (3801 US 117 NORTH)
- HOLLY STREET HOME (1509 HOLLY STREET)
- LIFE, INC. WALNUT STREET GROUP HOME (1011 EAST WALNUT STREET)
- LIFE, INC. WILLIAM STREET GROUP HOME (405 1/2 NORTH WILLIAM STREET)
- NORWOOD AVENUE HOME (2510 NORWOOD AVENUE)
- RHA/HOWELL CARE CENTERS/WALNUT CREEK (5709 US 70 EAST)
- SKILL CREATIONS OF GOLDSBORO (2101 ROYALL AVE)
- WAYNE MEMORIAL HOSPITAL (Voluntary non-profit - Private, 2700 WAYNE MEMORIAL DR)
Airports and heliports located in Goldsboro:
- Seymour Johnson Afb Airport (GSB) (Runways: 1, Military Ops: 54,000)
- Wayne Executive Jetport Airport (GWW) (Runways: 1, Air Taxi Ops: 2,000, Itinerant Ops: 6,700, Local Ops: 6,500, Military Ops: 1,000)
- Scottbrook Farm Airport (2NC4) (Runways: 1)
- Carolina Kidney Heliport (5NC0)
- Wayne Memorial Hospital Inc Heliport (0NC0)
Colleges/Universities in Goldsboro:
Other colleges/universities with over 2000 students near Goldsboro:
- Mount Olive College (about 14 miles; Mount Olive, NC; Full-time enrollment: 3,097)
- Johnston Community College (about 22 miles; Smithfield, NC; FT enrollment: 3,657)
- Lenoir Community College (about 26 miles; Kinston, NC; FT enrollment: 2,555)
- Pitt Community College (about 35 miles; Winterville, NC; FT enrollment: 7,026)
- East Carolina University (about 38 miles; Greenville, NC; FT enrollment: 23,943)
- Edgecombe Community College (about 42 miles; Tarboro, NC; FT enrollment: 2,058)
- Nash Community College (about 42 miles; Rocky Mount, NC; FT enrollment: 2,520)
Public high schools in Goldsboro:
- RIVERBEND SCHOOL (Location: RIVERBEND SCHOOL BLDG. U4, Grades: KG-12)
- EDGEWOOD CMTY DEVELOPMENTAL (Location: 1601 PEACHTREE ST, Grades: PK-12)
- GOLDSBORO HIGH (Location: 901 E BEECH STREET, Grades: 9-12)
- EASTERN WAYNE HIGH (Location: 1135 NEW HOPE ROAD, Grades: 9-12)
- ROSEWOOD HIGH (Location: 900 ROSEWOOD ROAD, Grades: 9-12)
- WAYNE EARLY / MIDDLE COLLEGE HIGH (Location: 3000 WAYNE MEMORIAL DRIVE, Grades: 9-12)
- WAYNE SCHOOL OF ENGINEERING (Location: 700 N HERMAN ST, Grades: 6-12)
- WAYNE MIDDLE / HIGH ACADEMY (Location: 801 N LIONEL ST, Grades: 6-12)
Private high schools in Goldsboro:
- WAYNE CHRISTIAN SCHOOL (Students: 504, Location: 1201 PATETOWN RD, Grades: PK-12)
- FAITH CHRISTIAN ACADEMY (Students: 346, Location: 1200 W GRANTHAM ST, Grades: PK-12)
- WAYNE COUNTRY DAY SCHOOL (Students: 270, Location: 480 COUNTRY DAY RD, Grades: PK-12)
- PATHWAY CHRISTIAN ACADEMY (Students: 60, Location: 1302 S GEORGE ST, Grades: KG-12)
- RHEMA CHRISTIAN ACADEMY (Students: 20, Location: 323 WHITFIELD DR, Grades: PK-12)
Biggest public elementary/middle schools in Goldsboro:
- DILLARD ACADEMY (Location: 504 WEST ELM STREET, Grades: KG-5, Charter school)
- WAYNE PREPARATORY ACADEMY (Location: 1404 PATETOWN RD., Grades: KG-4, Charter school)
- CARVER HEIGHTS ELEMENTARY (Location: 411 BUNCHE DRIVE, Grades: KG-4)
- DILLARD MIDDLE (Location: 1101 S DEVEREAUX ST, Grades: 5-8)
- SCHOOL STREET ELEMENTARY (Location: 415 S VIRGINIA STREET, Grades: PK-4)
- NORTH DRIVE ELEMENTARY (Location: 1108 NORTH DRIVE, Grades: PK-4)
- EASTERN WAYNE ELEMENTARY (Location: 1271 NEW HOPE ROAD, Grades: PK-5)
- EASTERN WAYNE MIDDLE (Location: 3518 CENTRAL HEIGHTS RD, Grades: 6-8)
- GRANTHAM (Location: 174 GRANTHAM SCHOOL RD, Grades: KG-8)
- GREENWOOD MIDDLE (Location: 3209 E ASH STREET, Grades: 5-8)
Private elementary/middle schools in Goldsboro:
User-submitted facts and corrections:
- Goldsboro is a very nice and well put together town its a attraction to touristd and anyone who wants a cheap house to rent so come on and stop thourgh Goldsboro!!!!!!!!!!!!!!!!!!!!!!!!!! added by Kim
Points of interest:
Notable locations in Goldsboro: Ashley Plaza (A), Wayne Plaza (B), North Plaza (C), Goldsboro Plaza (D), O'Berry Neuro - Medical Treatment Center (E), John Oliver Center (F), Brian Center Health and Rehabilitation of Goldsboro (G), The Pines at Goldsboro (H), Alterra Sterling House of Goldsboro (I), Wayne County Mental Health Center (J), North Carolina State Highway Patrol (K), Goldsboro Police Department (L), Wayne County Sheriff Civil Division (M), Wayne County Public Library - Main Branch (N). Display/hide their locations on the map
Shopping Centers: Berkeley Mall (1), Sunrise Shopping Center (2), Nichols Shopping Center (3), Eastgate Shopping Center (4). Display/hide their locations on the map
Churches in Goldsboro include: Faith Alliance Church (A), Community Church of Christ (B), First Presbyterian Church (C), First Pentecostal Holiness Church (D), First African Baptist Church (E), Faith United Holy Church (F), Faith Free Will Baptist Church (G), Saint Mark Church of Christ (H), Saint James Church of Christ (I). Display/hide their locations on the map
Cemetery: Willow Dale Cemetery (1). Display/hide its location on the map
Streams, rivers, and creeks: Howell Branch (A), Reedy Branch (B), Billy Branch (C), Stoney Creek (D), Smith Mill Run (E). Display/hide their locations on the map
Parks in Goldsboro include: Herman Park (1), Peacock Park (2), Mina Weil Park (3), Quail Park (4), Fairview Park (5). Display/hide their locations on the map
Tourist attractions: Carolina Amusement Services (Amusement & Theme Parks; 152 Nc Highway 581 South) (1), Amf Boulevard Lanes (Amusement & Theme Parks; 105 South Berkeley Boulevard) (2), Goldsboro Bingo World (Amusement & Theme Parks; 1809 North Berkeley Boulevard Suite C) (3). Display/hide their approximate locations on the map
Hotels: Country Inn-Suites Goldsboro (2302 Norwood Avenue) (1), Econo Lodge Goldsboro (704 US 70 Bypass East) (2), Carolina Motel (2316 North William Street) (3), Days Inn Goldsboro (2000 Wayne Memorial Drive) (4), Econolodge (704 Corporate Drive) (5), Comfort Suites Goldsboro (2613 North Park Drive) (6), Economy Inn (802 West Grantham Street) (7), Hampton Inn Goldsboro (905 North Spence Avenue) (8). Display/hide their approximate locations on the map
Courts: Wayne County Offices - Judicial Offices- Juvenile Court Counselor (109 Ormond Avenue) (1), Wayne County Offices - Clerk's Office- Judicial Offices- Clerk Of Superior Court- Criminal & Tra (Courthouse) (2), Wayne County Offices - Judicial Offices- District Attorney (Courthouse) (3), Casey Country Court (Sheridan Forest Road) (4), Wayne County Offices - Judicial Offices- Superior Court Judge (Courthouse) (5). Display/hide their approximate locations on the map
Birthplace of: Scott Stapp - Leader voice of Creed, Anne Jeffreys - Female singer, Bill Kelly (American football, born 1947) - Football player and coach, Carl Kasell - Radio journalist, Clyde King - Baseball manager, Dan Bullock - Marine, David Thornton - 2005 NFL player (Indianapolis Colts, born: Nov 1, 1978), Greg Warren - 2005 NFL player (Pittsburgh Steelers, born: Oct 18, 1981), Jerry Narron - Baseball player, Johnny Grant (radio personality) - Soilder.
| This city: | 2.3 people |
| North Carolina: | 2.5 people |
| This city: | 60.0% |
| Whole state: | 66.7% |
| This city: | 4.5% |
| Whole state: | 5.9% |
Likely homosexual households (counted as self-reported same-sex unmarried-partner households)
- Lesbian couples: 0.3% of all households
- Gay men: 0.2% of all households
People in group quarters in Goldsboro in 2010:
- 1,123 people in state prisons
- 594 people in military barracks and dormitories (nondisciplinary)
- 394 people in nursing facilities/skilled-nursing facilities
- 89 people in in-patient hospice facilities
- 75 people in other noninstitutional facilities
- 73 people in group homes intended for adults
- 50 people in emergency and transitional shelters (with sleeping facilities) for people experiencing homelessness
- 17 people in residential treatment centers for adults
- 7 people in workers' group living quarters and job corps centers
People in group quarters in Goldsboro in 2000:
- 972 people in state prisons
- 580 people in federal prisons and detention centers
- 557 people in military barracks, etc.
- 513 people in mental (psychiatric) hospitals or wards
- 480 people in nursing homes
- 381 people in homes for the mentally retarded
- 166 people in other noninstitutional group quarters
- 145 people in local jails and other confinement facilities (including police lockups)
- 49 people in other group homes
- 15 people in other nonhousehold living situations
- 14 people in hospitals/wards and hospices for chronically ill
- 14 people in homes for the mentally ill
- 10 people in hospices or homes for chronically ill
- 6 people in military transient quarters for temporary residents
- 5 people in religious group quarters
- 4 people in other hospitals or wards for chronically ill
- 4 people in homes or halfway houses for drug/alcohol abuse
Banks with most branches in Goldsboro (2011 data):
- Branch Banking and Trust Company: Spence Avenue Branch, Goldsboro Main Branch, Highway 70 West Branch, Eastgate Branch. Info updated 2010/03/29: Bank assets: $168,867.6 mil, Deposits: $127,549.5 mil, headquarters in Winston Salem, NC, positive income, Commercial Lending Specialization, 1793 total offices, Holding Company: Bb&T Corporation
- First-Citizens Bank & Trust Company: Pinewood Branch, Goldsboro Branch, Wayne Memorial Branch, East Goldsboro Branch. Info updated 2011/10/11: Bank assets: $20,566.4 mil, Deposits: $17,596.8 mil, headquarters in Raleigh, NC, positive income, Commercial Lending Specialization, 433 total offices, Holding Company: First Citizens Bancshares, Inc.
- Wells Fargo Bank, National Association: Goldsboro Main Branch at 301 East Ash Street, branch established on 1955/04/01; Berkley Mall at 605 North Berkley Boulevard, branch established on 1969/10/20. Info updated 2011/04/05: Bank assets: $1,161,490.0 mil, Deposits: $905,653.0 mil, headquarters in Sioux Falls, SD, positive income, 6395 total offices, Holding Company: Wells Fargo & Company
- Woodforest National Bank: Goldsboro Wal-Mart Branch at 1002 N. Spence Ave., branch established on 2006/04/12; West Goldsboro Walmart at 2908 Us Highway 70 West, branch established on 2007/10/01. Info updated 2011/05/10: Bank assets: $3,488.9 mil, Deposits: $3,097.6 mil, headquarters in Houston, TX, positive income, Commercial Lending Specialization, 766 total offices, Holding Company: Woodforest Financial Group Employee Stock Ownership Plan (With 401(K) Provisions)
- PNC Bank, National Association: Goldsboro Branch at 106 North Spence Avenue, branch established on 1989/09/09; Berkeley Boulevard Branch at 500 N Berkeley Boulevard, branch established on 1998/02/27. Info updated 2012/03/20: Bank assets: $263,309.6 mil, Deposits: $197,343.0 mil, headquarters in Wilmington, DE, positive income, Commercial Lending Specialization, 3085 total offices, Holding Company: Pnc Financial Services Group, Inc., The
- New Century Bank: Goldsboro Branch 4 at 431 North Spence Avenue, branch established on 2004/01/22. Info updated 2008/04/22: Bank assets: $588.7 mil, Deposits: $502.4 mil, headquarters in Dunn, NC, positive income, Commercial Lending Specialization, 9 total offices, Holding Company: New Century Bancorp, Inc.
- The Little Bank, Incorporated: Goldsboro Branch at 201 North Center Street, branch established on 2000/03/30. Info updated 2006/11/03: Bank assets: $312.7 mil, Deposits: $251.9 mil, headquarters in Kinston, NC, positive income, Commercial Lending Specialization, 6 total offices
- KS Bank, Inc.: Goldsboro Branch at 1601 Wayne Memorial Drive, branch established on 1996/04/04. Info updated 2006/07/21: Bank assets: $322.7 mil, Deposits: $246.6 mil, headquarters in Smithfield, NC, positive income, Commercial Lending Specialization, 10 total offices, Holding Company: Ks Bancorp, Inc.
- Bank of America, National Association: Goldsboro Branch at 2801 Cashwell Drive, branch established on 1999/07/01. Info updated 2009/11/18: Bank assets: $1,451,969.3 mil, Deposits: $1,077,176.8 mil, headquarters in Charlotte, NC, positive income, 5782 total offices, Holding Company: Bank Of America Corporation
- 2 other banks with 2 local branches
For population 15 years and over in Goldsboro:
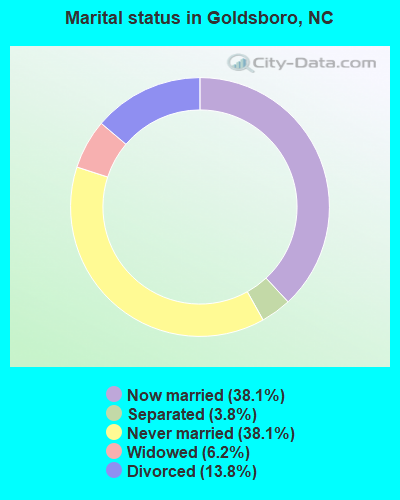
- Never married: 38.1%
- Now married: 38.1%
- Separated: 3.8%
- Widowed: 6.2%
- Divorced: 13.8%
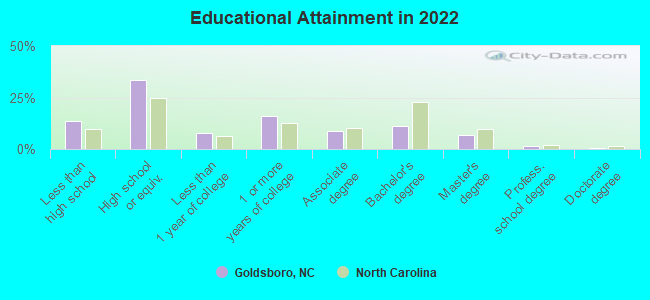
For population 25 years and over in Goldsboro:
- High school or higher: 87.5%
- Bachelor's degree or higher: 21.4%
- Graduate or professional degree: 8.3%
- Unemployed: 9.7%
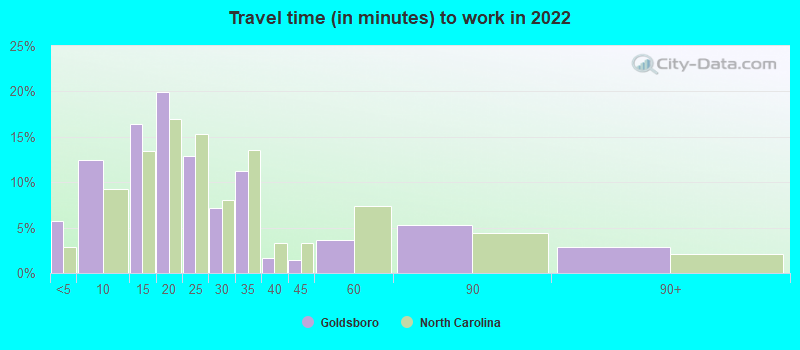
- Mean travel time to work (commute): 15.5 minutes
| Here: | 11.5 |
| North Carolina average: | 11.7 |
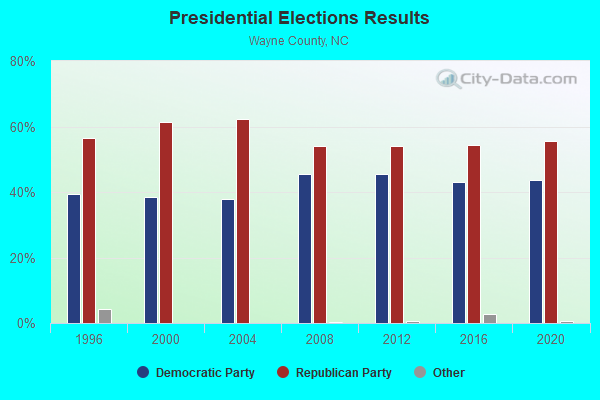
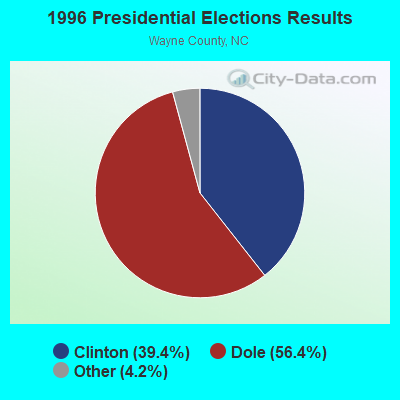
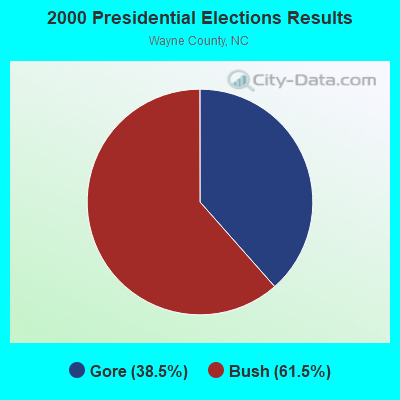
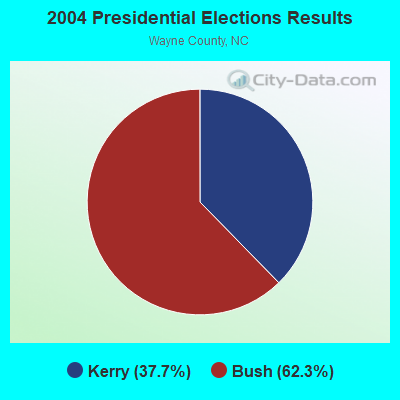
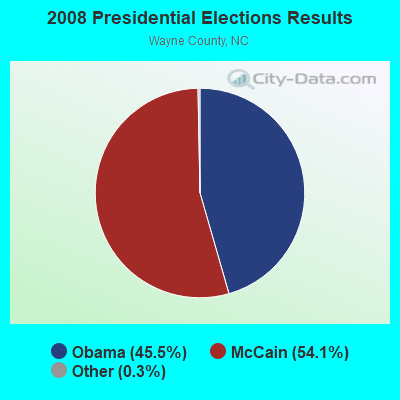
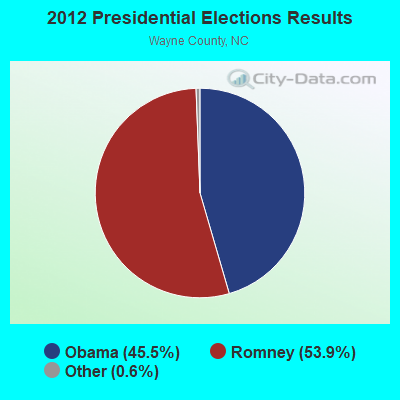
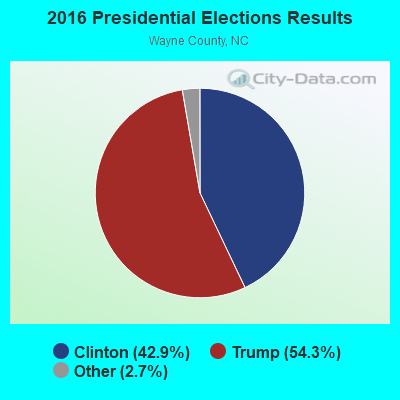
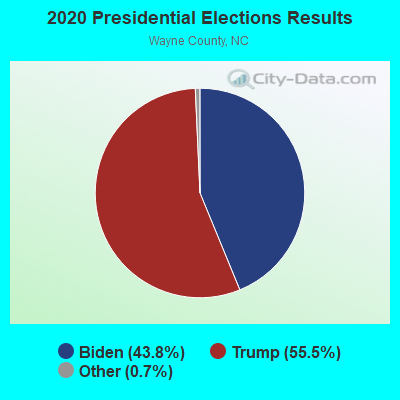
Graphs represent county-level data. Detailed 2008 Election Results
Religion statistics for Goldsboro, NC (based on Wayne County data)
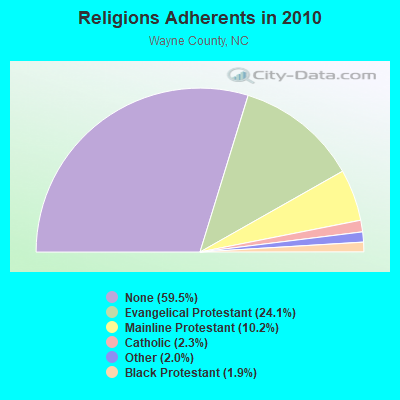
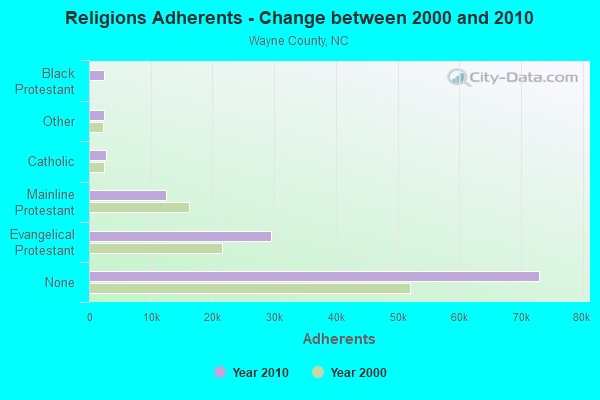
| Religion | Adherents | Congregations |
|---|---|---|
| Evangelical Protestant | 29,543 | 157 |
| Mainline Protestant | 12,482 | 64 |
| Catholic | 2,800 | 2 |
| Other | 2,438 | 10 |
| Black Protestant | 2,384 | 34 |
| None | 72,976 | - |
Food Environment Statistics:
| This county: | 1.94 / 10,000 pop. |
| North Carolina: | 2.05 / 10,000 pop. |
| This county: | 0.18 / 10,000 pop. |
| North Carolina: | 0.14 / 10,000 pop. |
| Wayne County: | 0.97 / 10,000 pop. |
| North Carolina: | 0.92 / 10,000 pop. |
| Wayne County: | 5.38 / 10,000 pop. |
| North Carolina: | 4.75 / 10,000 pop. |
| Wayne County: | 6.61 / 10,000 pop. |
| State: | 7.57 / 10,000 pop. |
| Wayne County: | 10.4% |
| North Carolina: | 9.8% |
| This county: | 30.8% |
| North Carolina: | 28.3% |
| Wayne County: | 17.6% |
| North Carolina: | 15.6% |
Health and Nutrition:
| This city: | 49.0% |
| State: | 48.9% |
| Here: | 46.2% |
| North Carolina: | 46.1% |
| This city: | 29.2 |
| State: | 28.8 |
| Goldsboro: | 18.8% |
| State: | 20.7% |
| This city: | 12.6% |
| North Carolina: | 10.7% |
| Goldsboro: | 6.7 |
| North Carolina: | 6.8 |
| Here: | 34.1% |
| North Carolina: | 33.7% |
| This city: | 55.2% |
| State: | 55.8% |
| Goldsboro: | 81.4% |
| North Carolina: | 79.7% |
More about Health and Nutrition of Goldsboro, NC Residents
| Local government employment and payroll (March 2022) | |||||
| Function | Full-time employees | Monthly full-time payroll | Average yearly full-time wage | Part-time employees | Monthly part-time payroll |
|---|---|---|---|---|---|
| Police Protection - Officers | 82 | $381,942 | $55,894 | 0 | $0 |
| Firefighters | 74 | $375,339 | $60,866 | 0 | $0 |
| Solid Waste Management | 42 | $111,416 | $31,833 | 6 | $13,403 |
| Parks and Recreation | 38 | $144,965 | $45,778 | 61 | $48,026 |
| Sewerage | 35 | $138,136 | $47,361 | 0 | $0 |
| Other and Unallocable | 32 | $136,165 | $51,062 | 0 | $0 |
| Other Government Administration | 31 | $133,849 | $51,813 | 1 | $701 |
| Water Supply | 26 | $96,173 | $44,388 | 1 | $1,594 |
| Financial Administration | 25 | $115,406 | $55,395 | 0 | $0 |
| Streets and Highways | 24 | $101,377 | $50,689 | 0 | $0 |
| Police - Other | 8 | $27,803 | $41,705 | 1 | $1,322 |
| Housing and Community Development (Local) | 3 | $13,403 | $53,612 | 0 | $0 |
| Fire - Other | 1 | $3,702 | $44,424 | 1 | $1,311 |
| Totals for Government | 421 | $1,779,677 | $50,727 | 71 | $66,356 |
7.19% of this county's 2021 resident taxpayers lived in other counties in 2020 ($44,417 average adjusted gross income)
| Here: | 7.19% |
| North Carolina average: | 8.85% |
0.28% of residents moved from foreign countries ($2,002 average AGI)
Wayne County: 0.28% North Carolina average: 0.04%
Top counties from which taxpayers relocated into this county between 2020 and 2021:
| from Johnston County, NC | |
| from Wake County, NC | |
| from Lenoir County, NC |
7.49% of this county's 2020 resident taxpayers moved to other counties in 2021 ($45,703 average adjusted gross income)
| Here: | 7.49% |
| North Carolina average: | 7.89% |
0.31% of residents moved to foreign countries ($2,272 average AGI)
Wayne County: 0.31% North Carolina average: 0.03%
Top counties to which taxpayers relocated from this county between 2020 and 2021:
| to Johnston County, NC | |
| to Wake County, NC | |
| to Lenoir County, NC |
| Businesses in Goldsboro, NC | ||||
| Name | Count | Name | Count | |
|---|---|---|---|---|
| AMF Bowling | 1 | Lane Bryant | 1 | |
| AT&T | 2 | Lane Furniture | 2 | |
| Advance Auto Parts | 2 | LensCrafters | 1 | |
| Aeropostale | 1 | Little Caesars Pizza | 1 | |
| American Eagle Outfitters | 1 | Long John Silver's | 1 | |
| Applebee's | 1 | Lowe's | 1 | |
| Arby's | 1 | MasterBrand Cabinets | 4 | |
| Ashley Furniture | 1 | Maurices | 1 | |
| AutoZone | 3 | McDonald's | 5 | |
| Bath & Body Works | 1 | Nike | 6 | |
| Bed Bath & Beyond | 1 | Nissan | 1 | |
| Blockbuster | 1 | Office Depot | 1 | |
| Burger King | 4 | Old Navy | 1 | |
| CVS | 1 | Outback | 1 | |
| Chevrolet | 1 | Outback Steakhouse | 1 | |
| Chick-Fil-A | 1 | Papa John's Pizza | 1 | |
| Chuck E. Cheese's | 1 | Payless | 1 | |
| Cold Stone Creamery | 1 | Penske | 1 | |
| ColorTyme | 1 | Pizza Hut | 2 | |
| Comfort Suites | 1 | Quiznos | 1 | |
| Curves | 1 | RadioShack | 2 | |
| Dairy Queen | 1 | Rite Aid | 2 | |
| Days Inn | 1 | Ruby Tuesday | 1 | |
| Domino's Pizza | 1 | Rue21 | 1 | |
| Dunkin Donuts | 2 | Ryder Rental & Truck Leasing | 1 | |
| Econo Lodge | 1 | SAS Shoes | 1 | |
| FedEx | 7 | SONIC Drive-In | 1 | |
| Firestone Complete Auto Care | 1 | Sam's Club | 1 | |
| Foot Locker | 1 | Sears | 2 | |
| Ford | 1 | Sprint Nextel | 2 | |
| GNC | 2 | Staples | 1 | |
| GameStop | 2 | Starbucks | 3 | |
| Goodwill | 6 | T-Mobile | 6 | |
| H&R Block | 4 | T.J.Maxx | 1 | |
| Hardee's | 1 | Taco Bell | 2 | |
| Hilton | 1 | Target | 1 | |
| Holiday Inn | 1 | True Value | 1 | |
| Honda | 1 | U-Haul | 11 | |
| Hyundai | 1 | U.S. Cellular | 6 | |
| IHOP | 1 | UPS | 12 | |
| JCPenney | 1 | Vans | 2 | |
| Jones New York | 2 | Verizon Wireless | 1 | |
| Journeys | 1 | Volkswagen | 1 | |
| KFC | 2 | Waffle House | 2 | |
| Kincaid | 1 | Walgreens | 2 | |
| Kmart | 1 | Walmart | 2 | |
| La-Z-Boy | 1 | YMCA | 1 | |
Strongest AM radio stations in Goldsboro:
- WGBR (1150 AM; 5 kW; GOLDSBORO, NC; Owner: NEW AGE COMMUNICATIONS, LTD.)
- WFMC (730 AM; 1 kW; GOLDSBORO, NC; Owner: NEW AGE COMMUNICATIONS, INC)
- WSSG (1300 AM; 1 kW; GOLDSBORO, NC)
- WDJS (1430 AM; 10 kW; MOUNT OLIVE, NC; Owner: MOUNT OLIVE BROADCASTING CO.)
- WPTF (680 AM; 50 kW; RALEIGH, NC; Owner: FIRST STATE COMMUNICATIONS)
- WGTM (590 AM; 5 kW; WILSON, NC; Owner: SPIRIT BROADCASTING, INC.)
- WRNS (960 AM; 5 kW; KINSTON, NC; Owner: NM LICENSING, LLC)
- WFTK (1030 AM; daytime; 50 kW; WAKE FOREST, NC; Owner: POSITIVE RADIO GROUP, INC.)
- WMPM (1270 AM; 5 kW; SMITHFIELD, NC; Owner: CAROLINA BROADCASTING SERVICE, INC.)
- WNCT (1070 AM; 10 kW; GREENVILLE, NC; Owner: WNCT LICENSE LIMITED PARTNERSHIP)
- WETC (540 AM; 8 kW; WENDELL-ZEBULON, NC; Owner: CAROLINA REGIONAL BROADCASTING CORPORATION)
- WCKB (780 AM; 7 kW; DUNN, NC; Owner: NORTH CAROLINA CENTRAL BROADCASTERS, INC.)
- WGHB (1250 AM; 5 kW; FARMVILLE, NC; Owner: CONNER MEDIA, INC.)
Strongest FM radio stations in Goldsboro:
- WKIX (102.3 FM; GOLDSBORO, NC; Owner: NEW AGE COMMUNICATIONS, INC.)
- WYMY (96.9 FM; GOLDSBORO, NC; Owner: NEW AGE COMMUNICATIONS, LTD.)
- W287AI (105.3 FM; GOLDSBORO, NC; Owner: BIBLE BROADCASTING NETWORK, INC.)
- WRNS-FM (95.1 FM; KINSTON, NC; Owner: NM LICENSING, LLC)
- W276AX (103.1 FM; PRINCETON, ETC., NC; Owner: GRACE CHRISTIAN SCHOOL)
- WTRG (100.7 FM; ROCKY MOUNT, NC; Owner: CAPSTAR TX LIMITED PARTNERSHIP)
- WRDU (106.1 FM; WILSON, NC; Owner: CAPSTAR TX LIMITED PARTNERSHIP)
- WERO (93.3 FM; WASHINGTON, NC; Owner: NM LICENSING, LLC)
- WNCT-FM (107.9 FM; GREENVILLE, NC; Owner: WNCT LICENSE LIMITED PARTNERSHIP)
- WKNS (90.3 FM; KINSTON, NC; Owner: CRAVEN COMMUNITY COLLEGE)
- WRAL (101.5 FM; RALEIGH, NC; Owner: WRAL-FM, INC.)
- WZUP (104.7 FM; ROSE HILL, NC; Owner: CONNER MEDIA CORPORATION)
- W255AL (98.9 FM; GOLDSBORO, NC; Owner: RADIO TRAINING NETWORK, INC.)
- WFXK (104.3 FM; TARBORO, NC; Owner: RADIO ONE LICENSES, LLC)
- WQDR (94.7 FM; RALEIGH, NC; Owner: CAROLINA MEDIA GROUP, INC.)
- WCPE (89.7 FM; RALEIGH, NC; Owner: EDUCATIONAL INFORMATION CORPORATION)
- WSFL-FM (106.5 FM; NEW BERN, NC; Owner: WSFL LICENSE LIMITED PARTNERSHIP)
- WRQM (90.9 FM; ROCKY MOUNT, NC; Owner: BOARD OF TRUSTEES UNIVERSITY OF NC AT CHAPEL HILL)
- WELS-FM (102.9 FM; KINSTON, NC; Owner: KINSTON CHRISTIAN RADIO, INC.)
- WRSV (92.1 FM; ROCKY MOUNT, NC; Owner: NORTHSTAR BROADCATING CORPORATION)
TV broadcast stations around Goldsboro:
- WHFL-LP (Channel 56; GOLDSBORO, NC; Owner: FREE LIFE MINISTRIES, INC.)
- W63CW (Channel 63; GOLDSBORO, NC; Owner: TRINITY BROADCASTING NETWORK)
- WITN-TV (Channel 7; WASHINGTON, NC; Owner: WITN LICENSEE CORP.)
- WNCT-TV (Channel 9; GREENVILLE, NC; Owner: MEDIA GENERAL COMMUNICATIONS, INC.)
- WRAL-TV (Channel 5; RALEIGH, NC; Owner: CAPITOL BROADCASTING COMPANY, INC.)
- WTVD (Channel 11; DURHAM, NC; Owner: ABC, INC.)
- WNCN (Channel 17; GOLDSBORO, NC; Owner: OUTLET BROADCASTING, INC.)
- WUNK-TV (Channel 25; GREENVILLE, NC; Owner: UNIVERSITY OF NORTH CAROLINA)
- WRAY-TV (Channel 30; WILSON, NC; Owner: WRAY, INC.)
- WLFL (Channel 22; RALEIGH, NC; Owner: WLFL LICENSEE, LLC)
- WRDC (Channel 28; DURHAM, NC; Owner: RALEIGH (WRDC-TV) LICENSEE, INC.)
- WCTI-TV (Channel 12; NEW BERN, NC; Owner: EASTERN NORTH CAROLINA BROADCASTING CORPORATION)
- WUNM-TV (Channel 19; JACKSONVILLE, NC; Owner: UNIVERSITY OF NORTH CAROLINA)
- WRAZ (Channel 50; RALEIGH, NC; Owner: WRAZ-TV, INC.)
- WRPX (Channel 47; ROCKY MOUNT, NC; Owner: PAXSON RALEIGH LICENSE, INC.)
- WUVC (Channel 40; FAYETTEVILLE, NC; Owner: CAPITAL BROADCASTING PARTNERS)
- W64AZ (Channel 64; KINSTON-GREENVILLE, NC; Owner: GOCOM TELEVISION, L.P.,)
- WARZ-LP (Channel 34; SMITHFIELD/SELMA, NC; Owner: WATERS & BROCK COMMUNICATIONS, INC.)
- WYDO (Channel 14; GREENVILLE, NC; Owner: PIEDMONT TELEVISION OF EASTERN CAROLINA LICENSE LLC)
- WNCR-LP (Channel 20; WILSON, NC; Owner: ON THE MAP, INC.)
- National Bridge Inventory (NBI) Statistics
- 181Number of bridges
- 2,352ft / 717mTotal length
- $75,000Total costs
- 1,645,302Total average daily traffic
- 181,338Total average daily truck traffic
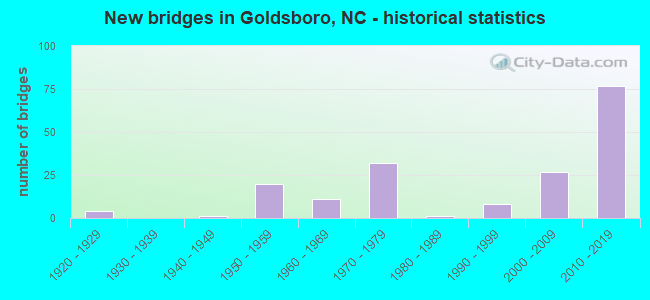
- New bridges - historical statistics
- 41920-1929
- 11940-1949
- 201950-1959
- 111960-1969
- 321970-1979
- 11980-1989
- 81990-1999
- 272000-2009
- 772010-2019
FCC Registered Antenna Towers: 389 (See the full list of FCC Registered Antenna Towers)
FCC Registered Commercial Land Mobile Towers: 6 (See the full list of FCC Registered Commercial Land Mobile Towers in Goldsboro, NC)
FCC Registered Private Land Mobile Towers: 5 (See the full list of FCC Registered Private Land Mobile Towers)
FCC Registered Broadcast Land Mobile Towers: 67 (See the full list of FCC Registered Broadcast Land Mobile Towers)
FCC Registered Microwave Towers: 35 (See the full list of FCC Registered Microwave Towers in this town)
FCC Registered Paging Towers: 6 (See the full list of FCC Registered Paging Towers)
FCC Registered Maritime Coast & Aviation Ground Towers: 6 (See the full list of FCC Registered Maritime Coast & Aviation Ground Towers)
FCC Registered Amateur Radio Licenses: 267 (See the full list of FCC Registered Amateur Radio Licenses in Goldsboro)
FAA Registered Aircraft: 71 (See the full list of FAA Registered Aircraft in Goldsboro)
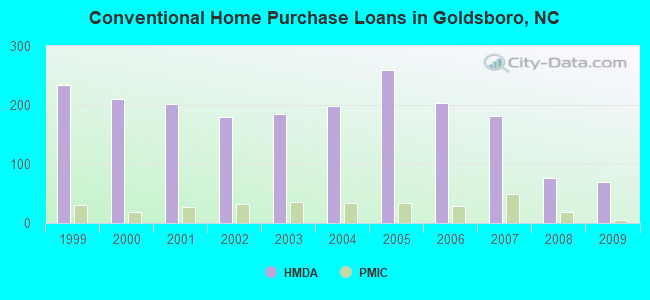
| Home Mortgage Disclosure Act Aggregated Statistics For Year 2009 (Based on 4 full and 13 partial tracts) | ||||||||||||||
| A) FHA, FSA/RHS & VA Home Purchase Loans | B) Conventional Home Purchase Loans | C) Refinancings | D) Home Improvement Loans | E) Loans on Dwellings For 5+ Families | F) Non-occupant Loans on < 5 Family Dwellings (A B C & D) | G) Loans On Manufactured Home Dwelling (A B C & D) | ||||||||
|---|---|---|---|---|---|---|---|---|---|---|---|---|---|---|
| Number | Average Value | Number | Average Value | Number | Average Value | Number | Average Value | Number | Average Value | Number | Average Value | Number | Average Value | |
| LOANS ORIGINATED | 105 | $138,102 | 70 | $125,196 | 260 | $133,172 | 13 | $63,303 | 2 | $655,995 | 50 | $91,391 | 3 | $75,447 |
| APPLICATIONS APPROVED, NOT ACCEPTED | 3 | $173,617 | 2 | $108,180 | 18 | $116,081 | 1 | $7,760 | 0 | $0 | 6 | $86,312 | 1 | $56,000 |
| APPLICATIONS DENIED | 4 | $128,748 | 25 | $85,340 | 97 | $103,948 | 27 | $41,951 | 1 | $279,000 | 20 | $74,850 | 7 | $50,924 |
| APPLICATIONS WITHDRAWN | 5 | $143,732 | 9 | $80,013 | 72 | $132,623 | 4 | $121,998 | 0 | $0 | 8 | $70,954 | 0 | $0 |
| FILES CLOSED FOR INCOMPLETENESS | 0 | $0 | 3 | $136,553 | 14 | $141,561 | 3 | $41,433 | 0 | $0 | 1 | $108,900 | 0 | $0 |
Detailed mortgage data for all 13 tracts in Goldsboro, NC
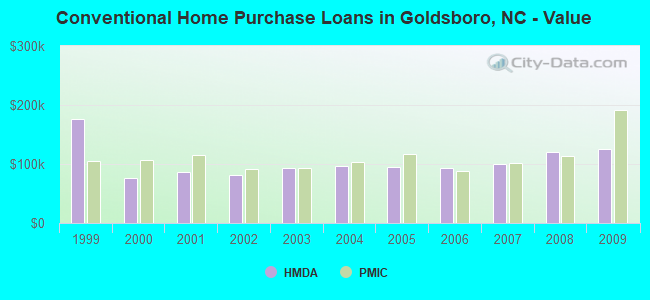
| Private Mortgage Insurance Companies Aggregated Statistics For Year 2009 (Based on 1 full and 9 partial tracts) | ||||
| A) Conventional Home Purchase Loans | B) Refinancings | |||
|---|---|---|---|---|
| Number | Average Value | Number | Average Value | |
| LOANS ORIGINATED | 5 | $191,556 | 6 | $171,492 |
| APPLICATIONS APPROVED, NOT ACCEPTED | 0 | $0 | 0 | $0 |
| APPLICATIONS DENIED | 0 | $0 | 1 | $144,500 |
| APPLICATIONS WITHDRAWN | 0 | $0 | 1 | $72,000 |
| FILES CLOSED FOR INCOMPLETENESS | 0 | $0 | 0 | $0 |
2002 - 2018 National Fire Incident Reporting System (NFIRS) incidents
- Fire incident types reported to NFIRS in Goldsboro, NC
- 2,34643.7%Structure Fires
- 2,08738.9%Outside Fires
- 71213.3%Mobile Property/Vehicle Fires
- 2244.2%Other
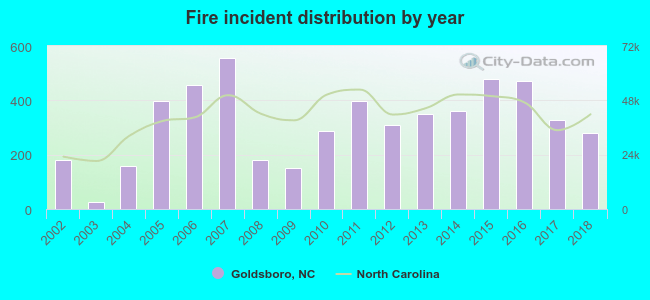 Based on the data from the years 2002 - 2018 the average number of fire incidents per year is 316. The highest number of fires - 554 took place in 2007, and the least - 27 in 2003. The data has a growing trend.
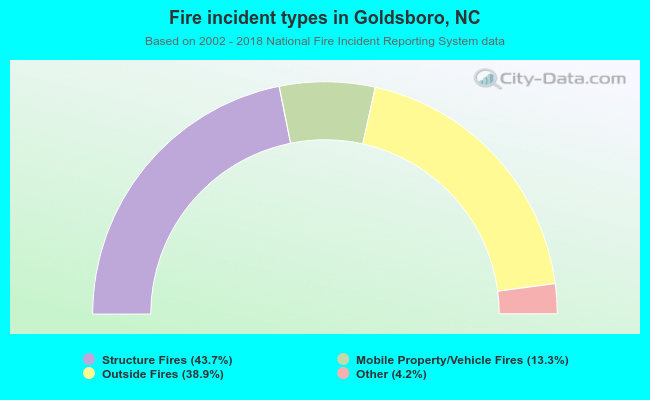 When looking into fire subcategories, the most incidents belonged to: Structure Fires (43.7%), and Outside Fires (38.9%).
Fire-safe hotels and motels in Goldsboro, North Carolina:
- Econo Lodge, 704 Hwy-70 Byp E, Goldsboro, North Carolina 27530 , Phone: (919) 736-4510
- Best Western Plus Goldsboro, 909 N Spence Ave, Goldsboro, North Carolina 27534 , Phone: (919) 751-1999, Fax: (919) 751-1506
- Americas Best Value Inn, 701 Byp 70 E, Goldsboro, North Carolina 27534 , Phone: (919) 734-4542, Fax: (919) 734-3503
- Knights Inn, 808 W Grantham St, Goldsboro, North Carolina 27530 , Phone: (919) 580-1090, Fax: (718) 228-2999
- Days Inn, 801 Hwy 70 Byp E, Goldsboro, North Carolina 27524 , Phone: (919) 735-7911, Fax: (919) 735-5030
- Days Inn-Goldsboro, 2000 Wayne Memorial Dr, Goldsboro, North Carolina 27534 , Phone: (919) 734-9471
- Jameson Inn - Goldsboro, NC, 1408 S Harding Dr, Goldsboro, North Carolina 27530 , Phone: (919) 778-9759, Fax: (919) 778-9760
- Country Inn And Suites By Carlson, 2302 Norwood Ave, Goldsboro, North Carolina 27534 , Phone: (919) 581-0503, Fax: (919) 581-0555
- 6 other hotels and motels
| Most common first names in Goldsboro, NC among deceased individuals | ||
| Name | Count | Lived (average) |
|---|---|---|
| James | 667 | 68.4 years |
| William | 496 | 70.2 years |
| Mary | 458 | 76.8 years |
| John | 427 | 71.6 years |
| George | 247 | 71.8 years |
| Robert | 236 | 68.9 years |
| Annie | 219 | 76.2 years |
| Willie | 214 | 70.3 years |
| Charles | 165 | 67.2 years |
| Joseph | 151 | 69.4 years |
| Most common last names in Goldsboro, NC among deceased individuals | ||
| Last name | Count | Lived (average) |
|---|---|---|
| Smith | 399 | 72.8 years |
| Jones | 307 | 70.4 years |
| Williams | 281 | 71.2 years |
| Best | 250 | 72.0 years |
| Davis | 245 | 71.9 years |
| Johnson | 180 | 70.9 years |
| Howell | 159 | 72.6 years |
| Lewis | 159 | 70.1 years |
| Taylor | 144 | 73.7 years |
| Thompson | 136 | 74.5 years |
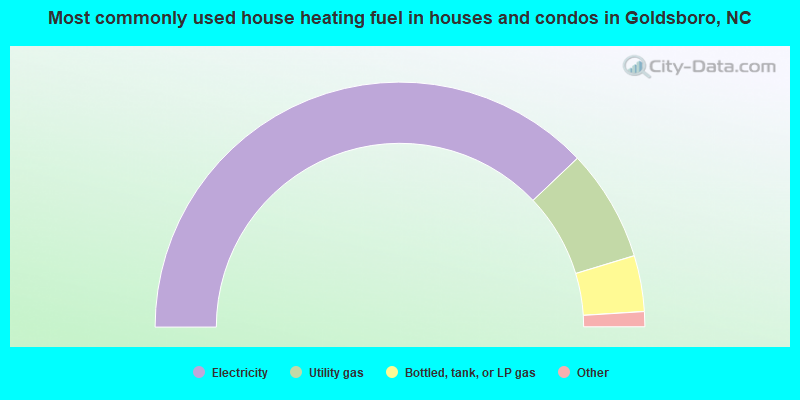
- 75.9%Electricity
- 14.8%Utility gas
- 7.4%Bottled, tank, or LP gas
- 1.5%Fuel oil, kerosene, etc.
- 0.4%No fuel used
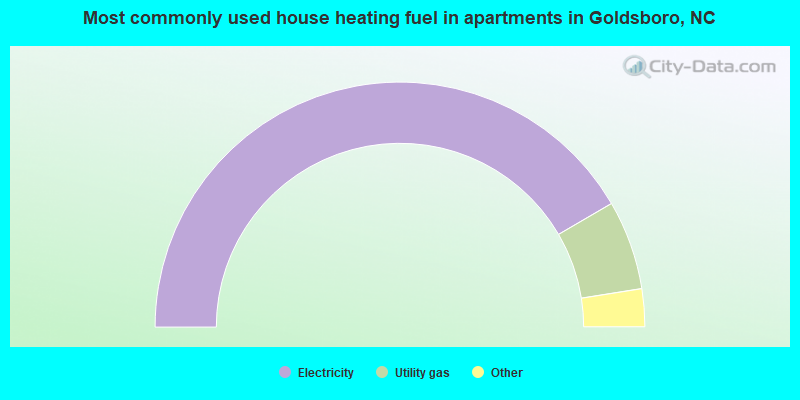
- 83.2%Electricity
- 11.8%Utility gas
- 3.6%Bottled, tank, or LP gas
- 0.7%Fuel oil, kerosene, etc.
- 0.5%No fuel used
- 0.2%Other fuel
Goldsboro compared to North Carolina state average:
- Median house value below state average.
- Black race population percentage above state average.
- Hispanic race population percentage below state average.
- Median age significantly below state average.
- Foreign-born population percentage below state average.
- Renting percentage above state average.
- Length of stay since moving in above state average.
- House age above state average.
- Institutionalized population percentage above state average.
Goldsboro on our top lists:
- #44 on the list of "Top 101 cities with the highest number of murders per 100,000 residents, excludes tourist destinations and others with a lot of outsiders visiting based on city industries data (population 5,000+)"
- #53 on the list of "Top 101 cities with the largest percentage of people in mental (psychiatric) hospitals or wards (population 1,000+)"
- #55 on the list of "Top 101 cities with the largest percentage of people in federal prisons and detention centers (population 1,000+)"
- #79 on the list of "Top 101 cities with the largest percentage of people in military transient quarters for temporary residents (population 1,000+)"
- #28 on the list of "Top 101 counties with the highest Particulate Matter (PM2.5) Annual air pollution readings in 2012 (µg/m3)"
- #29 on the list of "Top 101 counties with the smallest number of people without health insurance coverage in 2000 (pop. 50,000+)"
- #31 on the list of "Top 101 counties with the highest percentage of residents relocating from foreign countries between 2010 and 2011 (pop. 50,000+)"
- #31 on the list of "Top 101 counties with the highest percentage of residents relocating to foreign countries in 2011"
- #45 on the list of "Top 101 counties with the smallest number of children under 18 without health insurance coverage in 2000 (pop. 50,000+)"

|
|
Total of 46 patent applications in 2008-2024.