Haleiwa, Hawaii Submit your own pictures of this place and show them to the world
OSM Map
General Map
Google Map
MSN Map
OSM Map
General Map
Google Map
MSN Map
OSM Map
General Map
Google Map
MSN Map
OSM Map
General Map
Google Map
MSN Map
Please wait while loading the map...
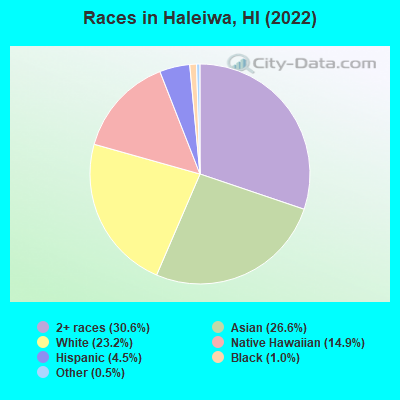
Population in 2010: 3,970. Population change since 2000: +78.4%Males: 1,915 Females: 2,055
March 2022 cost of living index in Haleiwa: 139.4 (high, U.S. average is 100) Percentage of residents living in poverty in 2022: 5.9%for White Non-Hispanic residents , 79.6% for Black residents , 10.5% for Hispanic or Latino residents , 2.6% for Native Hawaiian and other Pacific Islander residents , 25.8% for other race residents , 6.8% for two or more races residents )
Profiles of local businesses
Business Search - 14 Million verified businesses
Data:
Median household income ($)
Median household income (% change since 2000)
Household income diversity
Ratio of average income to average house value (%)
Ratio of average income to average rent
Median household income ($) - White
Median household income ($) - Black or African American
Median household income ($) - Asian
Median household income ($) - Hispanic or Latino
Median household income ($) - American Indian and Alaska Native
Median household income ($) - Multirace
Median household income ($) - Other Race
Median household income for houses/condos with a mortgage ($)
Median household income for apartments without a mortgage ($)
Races - White alone (%)
Races - White alone (% change since 2000)
Races - Black alone (%)
Races - Black alone (% change since 2000)
Races - American Indian alone (%)
Races - American Indian alone (% change since 2000)
Races - Asian alone (%)
Races - Asian alone (% change since 2000)
Races - Hispanic (%)
Races - Hispanic (% change since 2000)
Races - Native Hawaiian and Other Pacific Islander alone (%)
Races - Native Hawaiian and Other Pacific Islander alone (% change since 2000)
Races - Two or more races (%)
Races - Two or more races (% change since 2000)
Races - Other race alone (%)
Races - Other race alone (% change since 2000)
Racial diversity
Unemployment (%)
Unemployment (% change since 2000)
Unemployment (%) - White
Unemployment (%) - Black or African American
Unemployment (%) - Asian
Unemployment (%) - Hispanic or Latino
Unemployment (%) - American Indian and Alaska Native
Unemployment (%) - Multirace
Unemployment (%) - Other Race
Population density (people per square mile)
Population - Males (%)
Population - Females (%)
Population - Males (%) - White
Population - Males (%) - Black or African American
Population - Males (%) - Asian
Population - Males (%) - Hispanic or Latino
Population - Males (%) - American Indian and Alaska Native
Population - Males (%) - Multirace
Population - Males (%) - Other Race
Population - Females (%) - White
Population - Females (%) - Black or African American
Population - Females (%) - Asian
Population - Females (%) - Hispanic or Latino
Population - Females (%) - American Indian and Alaska Native
Population - Females (%) - Multirace
Population - Females (%) - Other Race
Coronavirus confirmed cases (Apr 27, 2024)
Deaths caused by coronavirus (Apr 27, 2024)
Coronavirus confirmed cases (per 100k population) (Apr 27, 2024)
Deaths caused by coronavirus (per 100k population) (Apr 27, 2024)
Daily increase in number of cases (Apr 27, 2024)
Weekly increase in number of cases (Apr 27, 2024)
Cases doubled (in days) (Apr 27, 2024)
Hospitalized patients (Apr 18, 2022)
Negative test results (Apr 18, 2022)
Total test results (Apr 18, 2022)
COVID Vaccine doses distributed (per 100k population) (Sep 19, 2023)
COVID Vaccine doses administered (per 100k population) (Sep 19, 2023)
COVID Vaccine doses distributed (Sep 19, 2023)
COVID Vaccine doses administered (Sep 19, 2023)
Likely homosexual households (%)
Likely homosexual households (% change since 2000)
Likely homosexual households - Lesbian couples (%)
Likely homosexual households - Lesbian couples (% change since 2000)
Likely homosexual households - Gay men (%)
Likely homosexual households - Gay men (% change since 2000)
Cost of living index
Median gross rent ($)
Median contract rent ($)
Median monthly housing costs ($)
Median house or condo value ($)
Median house or condo value ($ change since 2000)
Mean house or condo value by units in structure - 1, detached ($)
Mean house or condo value by units in structure - 1, attached ($)
Mean house or condo value by units in structure - 2 ($)
Mean house or condo value by units in structure by units in structure - 3 or 4 ($)
Mean house or condo value by units in structure - 5 or more ($)
Mean house or condo value by units in structure - Boat, RV, van, etc. ($)
Mean house or condo value by units in structure - Mobile home ($)
Median house or condo value ($) - White
Median house or condo value ($) - Black or African American
Median house or condo value ($) - Asian
Median house or condo value ($) - Hispanic or Latino
Median house or condo value ($) - American Indian and Alaska Native
Median house or condo value ($) - Multirace
Median house or condo value ($) - Other Race
Median resident age
Resident age diversity
Median resident age - Males
Median resident age - Females
Median resident age - White
Median resident age - Black or African American
Median resident age - Asian
Median resident age - Hispanic or Latino
Median resident age - American Indian and Alaska Native
Median resident age - Multirace
Median resident age - Other Race
Median resident age - Males - White
Median resident age - Males - Black or African American
Median resident age - Males - Asian
Median resident age - Males - Hispanic or Latino
Median resident age - Males - American Indian and Alaska Native
Median resident age - Males - Multirace
Median resident age - Males - Other Race
Median resident age - Females - White
Median resident age - Females - Black or African American
Median resident age - Females - Asian
Median resident age - Females - Hispanic or Latino
Median resident age - Females - American Indian and Alaska Native
Median resident age - Females - Multirace
Median resident age - Females - Other Race
Commute - mean travel time to work (minutes)
Travel time to work - Less than 5 minutes (%)
Travel time to work - Less than 5 minutes (% change since 2000)
Travel time to work - 5 to 9 minutes (%)
Travel time to work - 5 to 9 minutes (% change since 2000)
Travel time to work - 10 to 19 minutes (%)
Travel time to work - 10 to 19 minutes (% change since 2000)
Travel time to work - 20 to 29 minutes (%)
Travel time to work - 20 to 29 minutes (% change since 2000)
Travel time to work - 30 to 39 minutes (%)
Travel time to work - 30 to 39 minutes (% change since 2000)
Travel time to work - 40 to 59 minutes (%)
Travel time to work - 40 to 59 minutes (% change since 2000)
Travel time to work - 60 to 89 minutes (%)
Travel time to work - 60 to 89 minutes (% change since 2000)
Travel time to work - 90 or more minutes (%)
Travel time to work - 90 or more minutes (% change since 2000)
Marital status - Never married (%)
Marital status - Now married (%)
Marital status - Separated (%)
Marital status - Widowed (%)
Marital status - Divorced (%)
Median family income ($)
Median family income (% change since 2000)
Median non-family income ($)
Median non-family income (% change since 2000)
Median per capita income ($)
Median per capita income (% change since 2000)
Median family income ($) - White
Median family income ($) - Black or African American
Median family income ($) - Asian
Median family income ($) - Hispanic or Latino
Median family income ($) - American Indian and Alaska Native
Median family income ($) - Multirace
Median family income ($) - Other Race
Median year house/condo built
Median year apartment built
Year house built - Built 2005 or later (%)
Year house built - Built 2000 to 2004 (%)
Year house built - Built 1990 to 1999 (%)
Year house built - Built 1980 to 1989 (%)
Year house built - Built 1970 to 1979 (%)
Year house built - Built 1960 to 1969 (%)
Year house built - Built 1950 to 1959 (%)
Year house built - Built 1940 to 1949 (%)
Year house built - Built 1939 or earlier (%)
Average household size
Household density (households per square mile)
Average household size - White
Average household size - Black or African American
Average household size - Asian
Average household size - Hispanic or Latino
Average household size - American Indian and Alaska Native
Average household size - Multirace
Average household size - Other Race
Occupied housing units (%)
Vacant housing units (%)
Owner occupied housing units (%)
Renter occupied housing units (%)
Vacancy status - For rent (%)
Vacancy status - For sale only (%)
Vacancy status - Rented or sold, not occupied (%)
Vacancy status - For seasonal, recreational, or occasional use (%)
Vacancy status - For migrant workers (%)
Vacancy status - Other vacant (%)
Residents with income below the poverty level (%)
Residents with income below 50% of the poverty level (%)
Children below poverty level (%)
Poor families by family type - Married-couple family (%)
Poor families by family type - Male, no wife present (%)
Poor families by family type - Female, no husband present (%)
Poverty status for native-born residents (%)
Poverty status for foreign-born residents (%)
Poverty among high school graduates not in families (%)
Poverty among people who did not graduate high school not in families (%)
Residents with income below the poverty level (%) - White
Residents with income below the poverty level (%) - Black or African American
Residents with income below the poverty level (%) - Asian
Residents with income below the poverty level (%) - Hispanic or Latino
Residents with income below the poverty level (%) - American Indian and Alaska Native
Residents with income below the poverty level (%) - Multirace
Residents with income below the poverty level (%) - Other Race
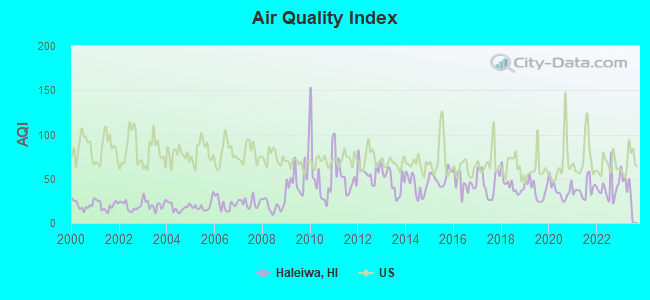
Air pollution - Air Quality Index (AQI)
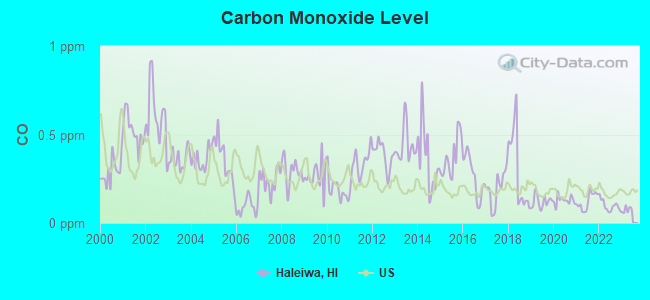
Air pollution - CO
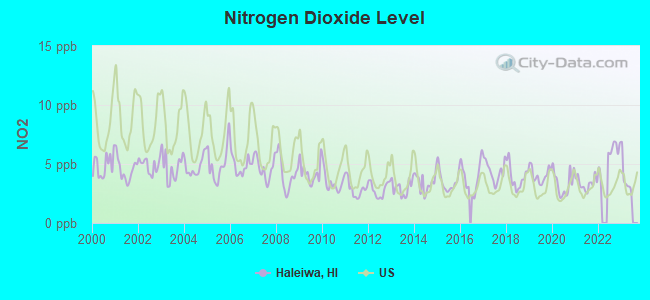
Air pollution - NO2
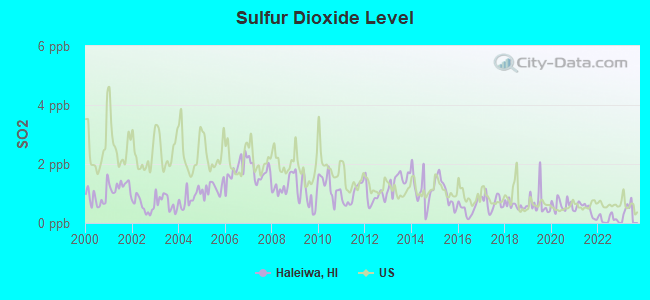
Air pollution - SO2
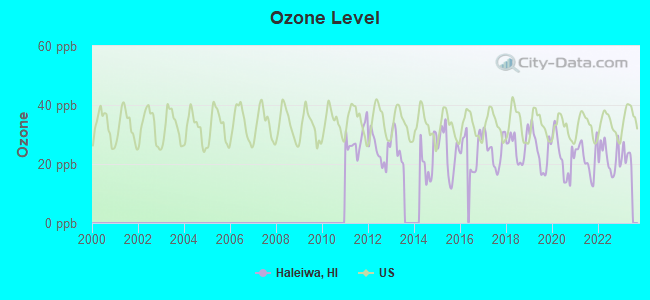
Air pollution - Ozone
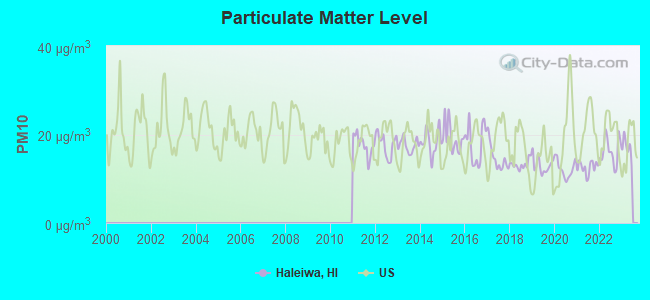
Air pollution - PM10
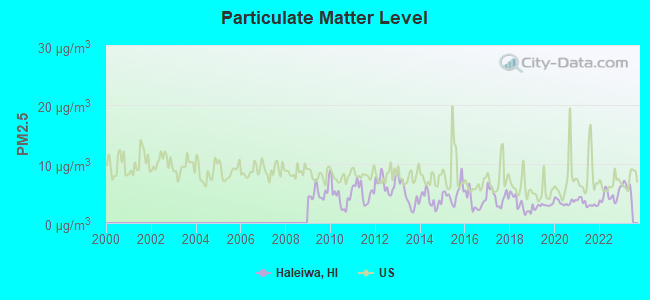
Air pollution - PM25
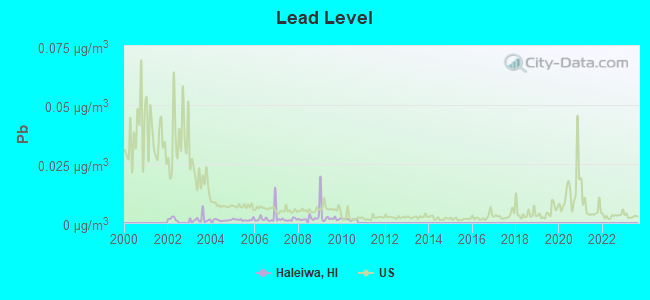
Air pollution - Pb
Crime - Murders per 100,000 population
Crime - Rapes per 100,000 population
Crime - Robberies per 100,000 population
Crime - Assaults per 100,000 population
Crime - Burglaries per 100,000 population
Crime - Thefts per 100,000 population
Crime - Auto thefts per 100,000 population
Crime - Arson per 100,000 population
Crime - City-data.com crime index
Crime - Violent crime index
Crime - Property crime index
Crime - Murders per 100,000 population (5 year average)
Crime - Rapes per 100,000 population (5 year average)
Crime - Robberies per 100,000 population (5 year average)
Crime - Assaults per 100,000 population (5 year average)
Crime - Burglaries per 100,000 population (5 year average)
Crime - Thefts per 100,000 population (5 year average)
Crime - Auto thefts per 100,000 population (5 year average)
Crime - Arson per 100,000 population (5 year average)
Crime - City-data.com crime index (5 year average)
Crime - Violent crime index (5 year average)
Crime - Property crime index (5 year average)
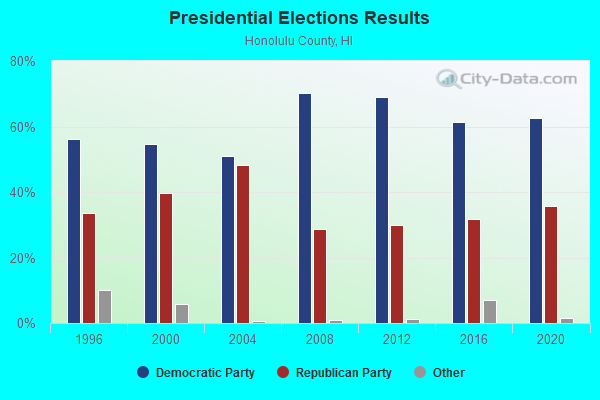
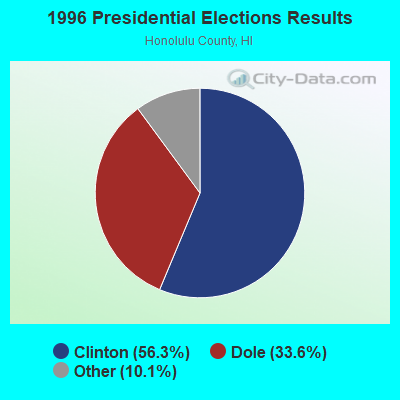
1996 Presidential Elections Results (%) - Democratic Party (Clinton)
1996 Presidential Elections Results (%) - Republican Party (Dole)
1996 Presidential Elections Results (%) - Other
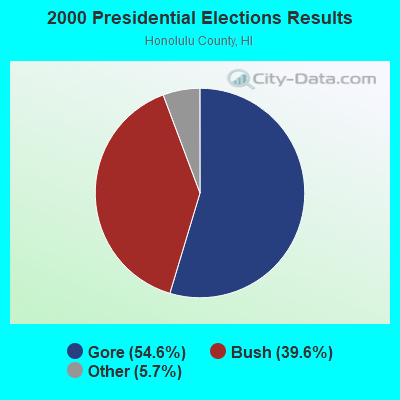
2000 Presidential Elections Results (%) - Democratic Party (Gore)
2000 Presidential Elections Results (%) - Republican Party (Bush)
2000 Presidential Elections Results (%) - Other
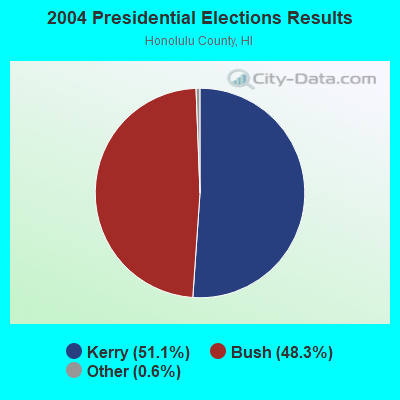
2004 Presidential Elections Results (%) - Democratic Party (Kerry)
2004 Presidential Elections Results (%) - Republican Party (Bush)
2004 Presidential Elections Results (%) - Other
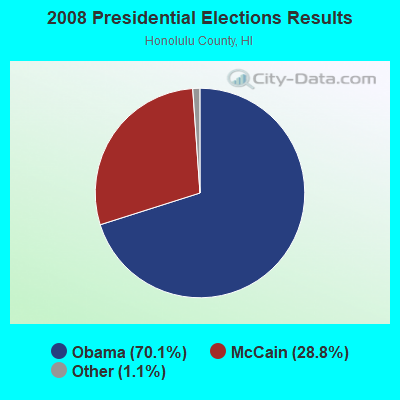
2008 Presidential Elections Results (%) - Democratic Party (Obama)
2008 Presidential Elections Results (%) - Republican Party (McCain)
2008 Presidential Elections Results (%) - Other
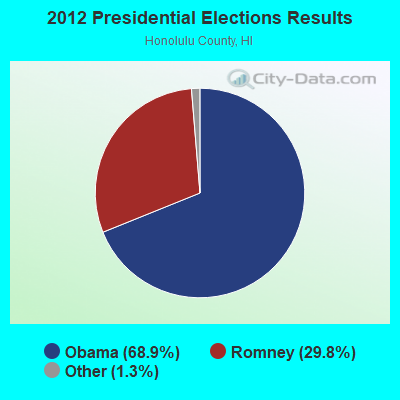
2012 Presidential Elections Results (%) - Democratic Party (Obama)
2012 Presidential Elections Results (%) - Republican Party (Romney)
2012 Presidential Elections Results (%) - Other
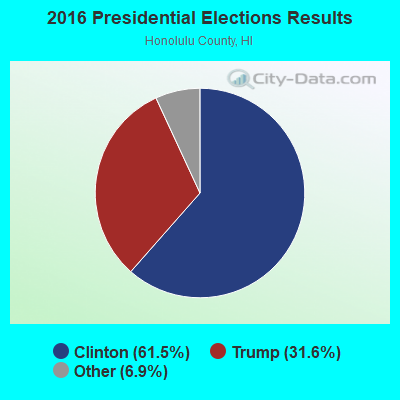
2016 Presidential Elections Results (%) - Democratic Party (Clinton)
2016 Presidential Elections Results (%) - Republican Party (Trump)
2016 Presidential Elections Results (%) - Other
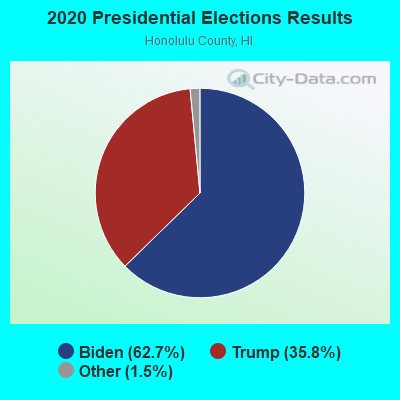
2020 Presidential Elections Results (%) - Democratic Party (Biden)
2020 Presidential Elections Results (%) - Republican Party (Trump)
2020 Presidential Elections Results (%) - Other
Ancestries Reported - Arab (%)
Ancestries Reported - Czech (%)
Ancestries Reported - Danish (%)
Ancestries Reported - Dutch (%)
Ancestries Reported - English (%)
Ancestries Reported - French (%)
Ancestries Reported - French Canadian (%)
Ancestries Reported - German (%)
Ancestries Reported - Greek (%)
Ancestries Reported - Hungarian (%)
Ancestries Reported - Irish (%)
Ancestries Reported - Italian (%)
Ancestries Reported - Lithuanian (%)
Ancestries Reported - Norwegian (%)
Ancestries Reported - Polish (%)
Ancestries Reported - Portuguese (%)
Ancestries Reported - Russian (%)
Ancestries Reported - Scotch-Irish (%)
Ancestries Reported - Scottish (%)
Ancestries Reported - Slovak (%)
Ancestries Reported - Subsaharan African (%)
Ancestries Reported - Swedish (%)
Ancestries Reported - Swiss (%)
Ancestries Reported - Ukrainian (%)
Ancestries Reported - United States (%)
Ancestries Reported - Welsh (%)
Ancestries Reported - West Indian (%)
Ancestries Reported - Other (%)
Educational Attainment - No schooling completed (%)
Educational Attainment - Less than high school (%)
Educational Attainment - High school or equivalent (%)
Educational Attainment - Less than 1 year of college (%)
Educational Attainment - 1 or more years of college (%)
Educational Attainment - Associate degree (%)
Educational Attainment - Bachelor's degree (%)
Educational Attainment - Master's degree (%)
Educational Attainment - Professional school degree (%)
Educational Attainment - Doctorate degree (%)
School Enrollment - Nursery, preschool (%)
School Enrollment - Kindergarten (%)
School Enrollment - Grade 1 to 4 (%)
School Enrollment - Grade 5 to 8 (%)
School Enrollment - Grade 9 to 12 (%)
School Enrollment - College undergrad (%)
School Enrollment - Graduate or professional (%)
School Enrollment - Not enrolled in school (%)
School enrollment - Public schools (%)
School enrollment - Private schools (%)
School enrollment - Not enrolled (%)
Median number of rooms in houses and condos
Median number of rooms in apartments
Housing units lacking complete plumbing facilities (%)
Housing units lacking complete kitchen facilities (%)
Density of houses
Urban houses (%)
Rural houses (%)
Households with people 60 years and over (%)
Households with people 65 years and over (%)
Households with people 75 years and over (%)
Households with one or more nonrelatives (%)
Households with no nonrelatives (%)
Population in households (%)
Family households (%)
Nonfamily households (%)
Population in families (%)
Family households with own children (%)
Median number of bedrooms in owner occupied houses
Mean number of bedrooms in owner occupied houses
Median number of bedrooms in renter occupied houses
Mean number of bedrooms in renter occupied houses
Median number of vehichles in owner occupied houses
Mean number of vehichles in owner occupied houses
Median number of vehichles in renter occupied houses
Mean number of vehichles in renter occupied houses
Mortgage status - with mortgage (%)
Mortgage status - with second mortgage (%)
Mortgage status - with home equity loan (%)
Mortgage status - with both second mortgage and home equity loan (%)
Mortgage status - without a mortgage (%)
Average family size
Average family size - White
Average family size - Black or African American
Average family size - Asian
Average family size - Hispanic or Latino
Average family size - American Indian and Alaska Native
Average family size - Multirace
Average family size - Other Race
Geographical mobility - Same house 1 year ago (%)
Geographical mobility - Moved within same county (%)
Geographical mobility - Moved from different county within same state (%)
Geographical mobility - Moved from different state (%)
Geographical mobility - Moved from abroad (%)
Place of birth - Born in state of residence (%)
Place of birth - Born in other state (%)
Place of birth - Native, outside of US (%)
Place of birth - Foreign born (%)
Housing units in structures - 1, detached (%)
Housing units in structures - 1, attached (%)
Housing units in structures - 2 (%)
Housing units in structures - 3 or 4 (%)
Housing units in structures - 5 to 9 (%)
Housing units in structures - 10 to 19 (%)
Housing units in structures - 20 to 49 (%)
Housing units in structures - 50 or more (%)
Housing units in structures - Mobile home (%)
Housing units in structures - Boat, RV, van, etc. (%)
House/condo owner moved in on average (years ago)
Renter moved in on average (years ago)
Year householder moved into unit - Moved in 1999 to March 2000 (%)
Year householder moved into unit - Moved in 1995 to 1998 (%)
Year householder moved into unit - Moved in 1990 to 1994 (%)
Year householder moved into unit - Moved in 1980 to 1989 (%)
Year householder moved into unit - Moved in 1970 to 1979 (%)
Year householder moved into unit - Moved in 1969 or earlier (%)
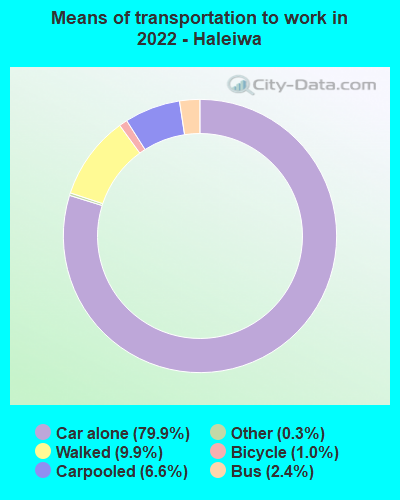
Means of transportation to work - Drove car alone (%)
Means of transportation to work - Carpooled (%)
Means of transportation to work - Public transportation (%)
Means of transportation to work - Bus or trolley bus (%)
Means of transportation to work - Streetcar or trolley car (%)
Means of transportation to work - Subway or elevated (%)
Means of transportation to work - Railroad (%)
Means of transportation to work - Ferryboat (%)
Means of transportation to work - Taxicab (%)
Means of transportation to work - Motorcycle (%)
Means of transportation to work - Bicycle (%)
Means of transportation to work - Walked (%)
Means of transportation to work - Other means (%)
Working at home (%)
Industry diversity
Most Common Industries - Agriculture, forestry, fishing and hunting, and mining (%)
Most Common Industries - Agriculture, forestry, fishing and hunting (%)
Most Common Industries - Mining, quarrying, and oil and gas extraction (%)
Most Common Industries - Construction (%)
Most Common Industries - Manufacturing (%)
Most Common Industries - Wholesale trade (%)
Most Common Industries - Retail trade (%)
Most Common Industries - Transportation and warehousing, and utilities (%)
Most Common Industries - Transportation and warehousing (%)
Most Common Industries - Utilities (%)
Most Common Industries - Information (%)
Most Common Industries - Finance and insurance, and real estate and rental and leasing (%)
Most Common Industries - Finance and insurance (%)
Most Common Industries - Real estate and rental and leasing (%)
Most Common Industries - Professional, scientific, and management, and administrative and waste management services (%)
Most Common Industries - Professional, scientific, and technical services (%)
Most Common Industries - Management of companies and enterprises (%)
Most Common Industries - Administrative and support and waste management services (%)
Most Common Industries - Educational services, and health care and social assistance (%)
Most Common Industries - Educational services (%)
Most Common Industries - Health care and social assistance (%)
Most Common Industries - Arts, entertainment, and recreation, and accommodation and food services (%)
Most Common Industries - Arts, entertainment, and recreation (%)
Most Common Industries - Accommodation and food services (%)
Most Common Industries - Other services, except public administration (%)
Most Common Industries - Public administration (%)
Occupation diversity
Most Common Occupations - Management, business, science, and arts occupations (%)
Most Common Occupations - Management, business, and financial occupations (%)
Most Common Occupations - Management occupations (%)
Most Common Occupations - Business and financial operations occupations (%)
Most Common Occupations - Computer, engineering, and science occupations (%)
Most Common Occupations - Computer and mathematical occupations (%)
Most Common Occupations - Architecture and engineering occupations (%)
Most Common Occupations - Life, physical, and social science occupations (%)
Most Common Occupations - Education, legal, community service, arts, and media occupations (%)
Most Common Occupations - Community and social service occupations (%)
Most Common Occupations - Legal occupations (%)
Most Common Occupations - Education, training, and library occupations (%)
Most Common Occupations - Arts, design, entertainment, sports, and media occupations (%)
Most Common Occupations - Healthcare practitioners and technical occupations (%)
Most Common Occupations - Health diagnosing and treating practitioners and other technical occupations (%)
Most Common Occupations - Health technologists and technicians (%)
Most Common Occupations - Service occupations (%)
Most Common Occupations - Healthcare support occupations (%)
Most Common Occupations - Protective service occupations (%)
Most Common Occupations - Fire fighting and prevention, and other protective service workers including supervisors (%)
Most Common Occupations - Law enforcement workers including supervisors (%)
Most Common Occupations - Food preparation and serving related occupations (%)
Most Common Occupations - Building and grounds cleaning and maintenance occupations (%)
Most Common Occupations - Personal care and service occupations (%)
Most Common Occupations - Sales and office occupations (%)
Most Common Occupations - Sales and related occupations (%)
Most Common Occupations - Office and administrative support occupations (%)
Most Common Occupations - Natural resources, construction, and maintenance occupations (%)
Most Common Occupations - Farming, fishing, and forestry occupations (%)
Most Common Occupations - Construction and extraction occupations (%)
Most Common Occupations - Installation, maintenance, and repair occupations (%)
Most Common Occupations - Production, transportation, and material moving occupations (%)
Most Common Occupations - Production occupations (%)
Most Common Occupations - Transportation occupations (%)
Most Common Occupations - Material moving occupations (%)
People in Group quarters - Institutionalized population (%)
People in Group quarters - Correctional institutions (%)
People in Group quarters - Federal prisons and detention centers (%)
People in Group quarters - Halfway houses (%)
People in Group quarters - Local jails and other confinement facilities (including police lockups) (%)
People in Group quarters - Military disciplinary barracks (%)
People in Group quarters - State prisons (%)
People in Group quarters - Other types of correctional institutions (%)
People in Group quarters - Nursing homes (%)
People in Group quarters - Hospitals/wards, hospices, and schools for the handicapped (%)
People in Group quarters - Hospitals/wards and hospices for chronically ill (%)
People in Group quarters - Hospices or homes for chronically ill (%)
People in Group quarters - Military hospitals or wards for chronically ill (%)
People in Group quarters - Other hospitals or wards for chronically ill (%)
People in Group quarters - Hospitals or wards for drug/alcohol abuse (%)
People in Group quarters - Mental (Psychiatric) hospitals or wards (%)
People in Group quarters - Schools, hospitals, or wards for the mentally retarded (%)
People in Group quarters - Schools, hospitals, or wards for the physically handicapped (%)
People in Group quarters - Institutions for the deaf (%)
People in Group quarters - Institutions for the blind (%)
People in Group quarters - Orthopedic wards and institutions for the physically handicapped (%)
People in Group quarters - Wards in general hospitals for patients who have no usual home elsewhere (%)
People in Group quarters - Wards in military hospitals for patients who have no usual home elsewhere (%)
People in Group quarters - Juvenile institutions (%)
People in Group quarters - Long-term care (%)
People in Group quarters - Homes for abused, dependent, and neglected children (%)
People in Group quarters - Residential treatment centers for emotionally disturbed children (%)
People in Group quarters - Training schools for juvenile delinquents (%)
People in Group quarters - Short-term care, detention or diagnostic centers for delinquent children (%)
People in Group quarters - Type of juvenile institution unknown (%)
People in Group quarters - Noninstitutionalized population (%)
People in Group quarters - College dormitories (includes college quarters off campus) (%)
People in Group quarters - Military quarters (%)
People in Group quarters - On base (%)
People in Group quarters - Barracks, unaccompanied personnel housing (UPH), (Enlisted/Officer), ;and similar group living quarters for military personnel (%)
People in Group quarters - Transient quarters for temporary residents (%)
People in Group quarters - Military ships (%)
People in Group quarters - Group homes (%)
People in Group quarters - Homes or halfway houses for drug/alcohol abuse (%)
People in Group quarters - Homes for the mentally ill (%)
People in Group quarters - Homes for the mentally retarded (%)
People in Group quarters - Homes for the physically handicapped (%)
People in Group quarters - Other group homes (%)
People in Group quarters - Religious group quarters (%)
People in Group quarters - Dormitories (%)
People in Group quarters - Agriculture workers' dormitories on farms (%)
People in Group quarters - Job Corps and vocational training facilities (%)
People in Group quarters - Other workers' dormitories (%)
People in Group quarters - Crews of maritime vessels (%)
People in Group quarters - Other nonhousehold living situations (%)
People in Group quarters - Other noninstitutional group quarters (%)
Residents speaking English at home (%)
Residents speaking English at home - Born in the United States (%)
Residents speaking English at home - Native, born elsewhere (%)
Residents speaking English at home - Foreign born (%)
Residents speaking Spanish at home (%)
Residents speaking Spanish at home - Born in the United States (%)
Residents speaking Spanish at home - Native, born elsewhere (%)
Residents speaking Spanish at home - Foreign born (%)
Residents speaking other language at home (%)
Residents speaking other language at home - Born in the United States (%)
Residents speaking other language at home - Native, born elsewhere (%)
Residents speaking other language at home - Foreign born (%)
Class of Workers - Employee of private company (%)
Class of Workers - Self-employed in own incorporated business (%)
Class of Workers - Private not-for-profit wage and salary workers (%)
Class of Workers - Local government workers (%)
Class of Workers - State government workers (%)
Class of Workers - Federal government workers (%)
Class of Workers - Self-employed workers in own not incorporated business and Unpaid family workers (%)
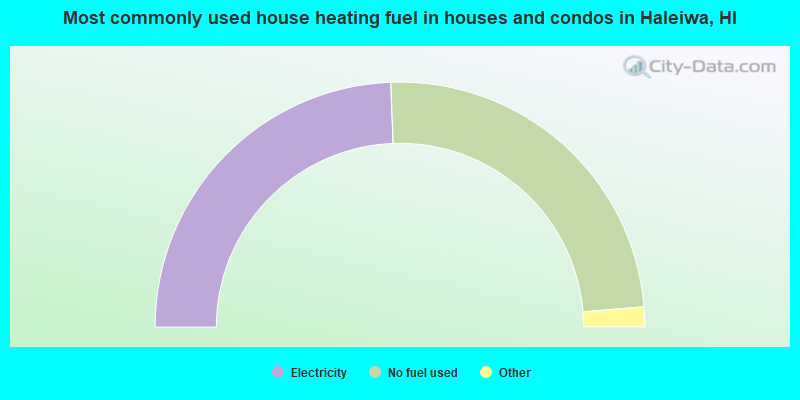
House heating fuel used in houses and condos - Utility gas (%)
House heating fuel used in houses and condos - Bottled, tank, or LP gas (%)
House heating fuel used in houses and condos - Electricity (%)
House heating fuel used in houses and condos - Fuel oil, kerosene, etc. (%)
House heating fuel used in houses and condos - Coal or coke (%)
House heating fuel used in houses and condos - Wood (%)
House heating fuel used in houses and condos - Solar energy (%)
House heating fuel used in houses and condos - Other fuel (%)
House heating fuel used in houses and condos - No fuel used (%)
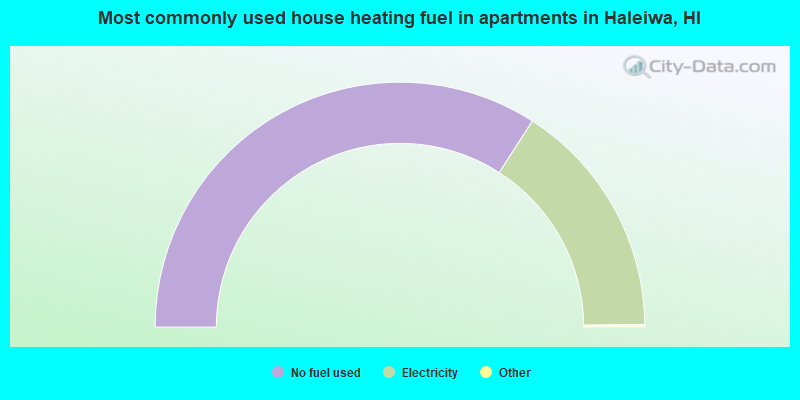
House heating fuel used in apartments - Utility gas (%)
House heating fuel used in apartments - Bottled, tank, or LP gas (%)
House heating fuel used in apartments - Electricity (%)
House heating fuel used in apartments - Fuel oil, kerosene, etc. (%)
House heating fuel used in apartments - Coal or coke (%)
House heating fuel used in apartments - Wood (%)
House heating fuel used in apartments - Solar energy (%)
House heating fuel used in apartments - Other fuel (%)
House heating fuel used in apartments - No fuel used (%)
Armed forces status - In Armed Forces (%)
Armed forces status - Civilian (%)
Armed forces status - Civilian - Veteran (%)
Armed forces status - Civilian - Nonveteran (%)
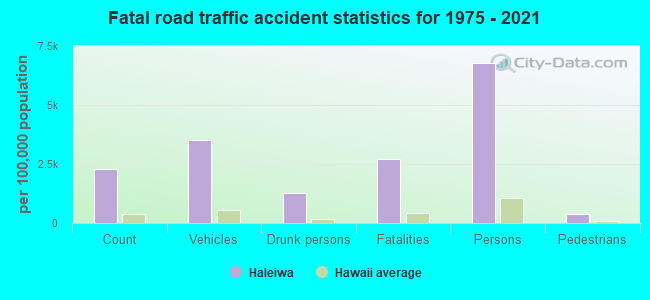
Fatal accidents locations in years 2005-2021
Fatal accidents locations in 2005
Fatal accidents locations in 2006
Fatal accidents locations in 2007
Fatal accidents locations in 2008
Fatal accidents locations in 2009
Fatal accidents locations in 2010
Fatal accidents locations in 2011
Fatal accidents locations in 2012
Fatal accidents locations in 2013
Fatal accidents locations in 2014
Fatal accidents locations in 2015
Fatal accidents locations in 2016
Fatal accidents locations in 2017
Fatal accidents locations in 2018
Fatal accidents locations in 2019
Fatal accidents locations in 2020
Fatal accidents locations in 2021
Alcohol use - People drinking some alcohol every month (%)
Alcohol use - People not drinking at all (%)
Alcohol use - Average days/month drinking alcohol
Alcohol use - Average drinks/week
Alcohol use - Average days/year people drink much
Audiometry - Average condition of hearing (%)
Audiometry - People that can hear a whisper from across a quiet room (%)
Audiometry - People that can hear normal voice from across a quiet room (%)
Audiometry - Ears ringing, roaring, buzzing (%)
Audiometry - Had a job exposure to loud noise (%)
Audiometry - Had off-work exposure to loud noise (%)
Blood Pressure & Cholesterol - Has high blood pressure (%)
Blood Pressure & Cholesterol - Checking blood pressure at home (%)
Blood Pressure & Cholesterol - Frequently checking blood cholesterol (%)
Blood Pressure & Cholesterol - Has high cholesterol level (%)
Consumer Behavior - Money monthly spent on food at supermarket/grocery store
Consumer Behavior - Money monthly spent on food at other stores
Consumer Behavior - Money monthly spent on eating out
Consumer Behavior - Money monthly spent on carryout/delivered foods
Consumer Behavior - Income spent on food at supermarket/grocery store (%)
Consumer Behavior - Income spent on food at other stores (%)
Consumer Behavior - Income spent on eating out (%)
Consumer Behavior - Income spent on carryout/delivered foods (%)
Current Health Status - General health condition (%)
Current Health Status - Blood donors (%)
Current Health Status - Has blood ever tested for HIV virus (%)
Current Health Status - Left-handed people (%)
Dermatology - People using sunscreen (%)
Diabetes - Diabetics (%)
Diabetes - Had a blood test for high blood sugar (%)
Diabetes - People taking insulin (%)
Diet Behavior & Nutrition - Diet health (%)
Diet Behavior & Nutrition - Milk product consumption (# of products/month)
Diet Behavior & Nutrition - Meals not home prepared (#/week)
Diet Behavior & Nutrition - Meals from fast food or pizza place (#/week)
Diet Behavior & Nutrition - Ready-to-eat foods (#/month)
Diet Behavior & Nutrition - Frozen meals/pizza (#/month)
Drug Use - People that ever used marijuana or hashish (%)
Drug Use - Ever used hard drugs (%)
Drug Use - Ever used any form of cocaine (%)
Drug Use - Ever used heroin (%)
Drug Use - Ever used methamphetamine (%)
Health Insurance - People covered by health insurance (%)
Kidney Conditions-Urology - Avg. # of times urinating at night
Medical Conditions - People with asthma (%)
Medical Conditions - People with anemia (%)
Medical Conditions - People with psoriasis (%)
Medical Conditions - People with overweight (%)
Medical Conditions - Elderly people having difficulties in thinking or remembering (%)
Medical Conditions - People who ever received blood transfusion (%)
Medical Conditions - People having trouble seeing even with glass/contacts (%)
Medical Conditions - People with arthritis (%)
Medical Conditions - People with gout (%)
Medical Conditions - People with congestive heart failure (%)
Medical Conditions - People with coronary heart disease (%)
Medical Conditions - People with angina pectoris (%)
Medical Conditions - People who ever had heart attack (%)
Medical Conditions - People who ever had stroke (%)
Medical Conditions - People with emphysema (%)
Medical Conditions - People with thyroid problem (%)
Medical Conditions - People with chronic bronchitis (%)
Medical Conditions - People with any liver condition (%)
Medical Conditions - People who ever had cancer or malignancy (%)
Mental Health - People who have little interest in doing things (%)
Mental Health - People feeling down, depressed, or hopeless (%)
Mental Health - People who have trouble sleeping or sleeping too much (%)
Mental Health - People feeling tired or having little energy (%)
Mental Health - People with poor appetite or overeating (%)
Mental Health - People feeling bad about themself (%)
Mental Health - People who have trouble concentrating on things (%)
Mental Health - People moving or speaking slowly or too fast (%)
Mental Health - People having thoughts they would be better off dead (%)
Oral Health - Average years since last visit a dentist
Oral Health - People embarrassed because of mouth (%)
Oral Health - People with gum disease (%)
Oral Health - General health of teeth and gums (%)
Oral Health - Average days a week using dental floss/device
Oral Health - Average days a week using mouthwash for dental problem
Oral Health - Average number of teeth
Pesticide Use - Households using pesticides to control insects (%)
Pesticide Use - Households using pesticides to kill weeds (%)
Physical Activity - People doing vigorous-intensity work activities (%)
Physical Activity - People doing moderate-intensity work activities (%)
Physical Activity - People walking or bicycling (%)
Physical Activity - People doing vigorous-intensity recreational activities (%)
Physical Activity - People doing moderate-intensity recreational activities (%)
Physical Activity - Average hours a day doing sedentary activities
Physical Activity - Average hours a day watching TV or videos
Physical Activity - Average hours a day using computer
Physical Functioning - People having limitations keeping them from working (%)
Physical Functioning - People limited in amount of work they can do (%)
Physical Functioning - People that need special equipment to walk (%)
Physical Functioning - People experiencing confusion/memory problems (%)
Physical Functioning - People requiring special healthcare equipment (%)
Prescription Medications - Average number of prescription medicines taking
Preventive Aspirin Use - Adults 40+ taking low-dose aspirin (%)
Reproductive Health - Vaginal deliveries (%)
Reproductive Health - Cesarean deliveries (%)
Reproductive Health - Deliveries resulted in a live birth (%)
Reproductive Health - Pregnancies resulted in a delivery (%)
Reproductive Health - Women breastfeeding newborns (%)
Reproductive Health - Women that had a hysterectomy (%)
Reproductive Health - Women that had both ovaries removed (%)
Reproductive Health - Women that have ever taken birth control pills (%)
Reproductive Health - Women taking birth control pills (%)
Reproductive Health - Women that have ever used Depo-Provera or injectables (%)
Reproductive Health - Women that have ever used female hormones (%)
Sexual Behavior - People 18+ that ever had sex (vaginal, anal, or oral) (%)
Sexual Behavior - Males 18+ that ever had vaginal sex with a woman (%)
Sexual Behavior - Males 18+ that ever performed oral sex on a woman (%)
Sexual Behavior - Males 18+ that ever had anal sex with a woman (%)
Sexual Behavior - Males 18+ that ever had any sex with a man (%)
Sexual Behavior - Females 18+ that ever had vaginal sex with a man (%)
Sexual Behavior - Females 18+ that ever performed oral sex on a man (%)
Sexual Behavior - Females 18+ that ever had anal sex with a man (%)
Sexual Behavior - Females 18+ that ever had any kind of sex with a woman (%)
Sexual Behavior - Average age people first had sex
Sexual Behavior - Average number of female sex partners in lifetime (males 18+)
Sexual Behavior - Average number of female vaginal sex partners in lifetime (males 18+)
Sexual Behavior - Average age people first performed oral sex on a woman (18+)
Sexual Behavior - Average number of woman performed oral sex on in lifetime (18+)
Sexual Behavior - Average number of male sex partners in lifetime (males 18+)
Sexual Behavior - Average number of male anal sex partners in lifetime (males 18+)
Sexual Behavior - Average age people first performed oral sex on a man (18+)
Sexual Behavior - Average number of male oral sex partners in lifetime (18+)
Sexual Behavior - People using protection when performing oral sex (%)
Sexual Behavior - Average number of times people have vaginal or anal sex a year
Sexual Behavior - People having sex without condom (%)
Sexual Behavior - Average number of male sex partners in lifetime (females 18+)
Sexual Behavior - Average number of male vaginal sex partners in lifetime (females 18+)
Sexual Behavior - Average number of female sex partners in lifetime (females 18+)
Sexual Behavior - Circumcised males 18+ (%)
Sleep Disorders - Average hours sleeping at night
Sleep Disorders - People that has trouble sleeping (%)
Smoking-Cigarette Use - People smoking cigarettes (%)
Taste & Smell - People 40+ having problems with smell (%)
Taste & Smell - People 40+ having problems with taste (%)
Taste & Smell - People 40+ that ever had wisdom teeth removed (%)
Taste & Smell - People 40+ that ever had tonsils teeth removed (%)
Taste & Smell - People 40+ that ever had a loss of consciousness because of a head injury (%)
Taste & Smell - People 40+ that ever had a broken nose or other serious injury to face or skull (%)
Taste & Smell - People 40+ that ever had two or more sinus infections (%)
Weight - Average height (inches)
Weight - Average weight (pounds)
Weight - Average BMI
Weight - People that are obese (%)
Weight - People that ever were obese (%)
Weight - People trying to lose weight (%)
According to our research of Hawaii and other state lists, there were 8 registered sex offenders living in Haleiwa, Hawaii as of April 27, 2024 . The ratio of all residents to sex offenders in Haleiwa is 426 to 1.The ratio of registered sex offenders to all residents in this city is near the state average.
Latest news from Haleiwa, HI collected exclusively by city-data.com from local newspapers, TV, and radio stations
Ancestries: Scotch-Irish (3.8%), British (2.1%), Irish (1.5%), English (1.4%), European (1.1%), Canadian (1.0%).
Current Local Time:
Land area: 1.83 square miles.
Population density: 2,173 people per square mile (low).
982 residents are foreign born (14.0% Asia , 2.8% Latin America ).
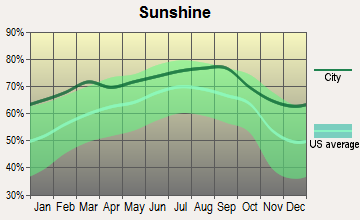
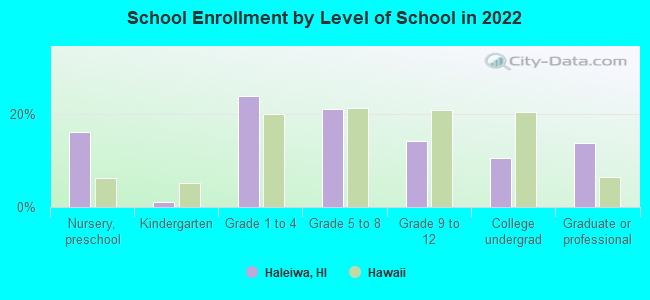
This place:
21.2%Hawaii:
18.0%
Median real estate property taxes paid for housing units with mortgages in 2022: $2,253 (0.2%)Median real estate property taxes paid for housing units with no mortgage in 2022: $2,555 (0.3%)
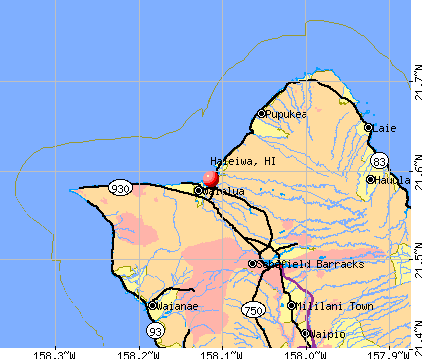
Nearest city with pop. 50,000+: Ewa, HI
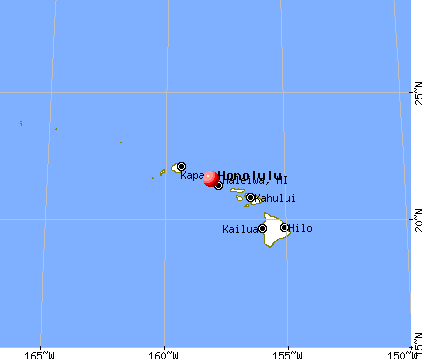
Nearest city with pop. 1,000,000+: Los Angeles, CA
Nearest cities:
Latitude: 21.59 N, Longitude: 158.11 W
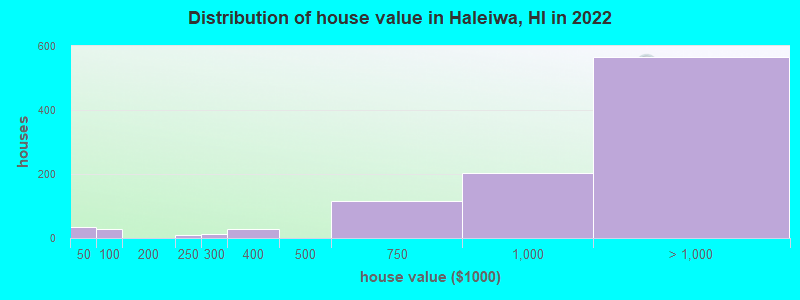
Property values in Haleiwa, HI
Haleiwa tourist attractions:
Unemployment in December 2023:
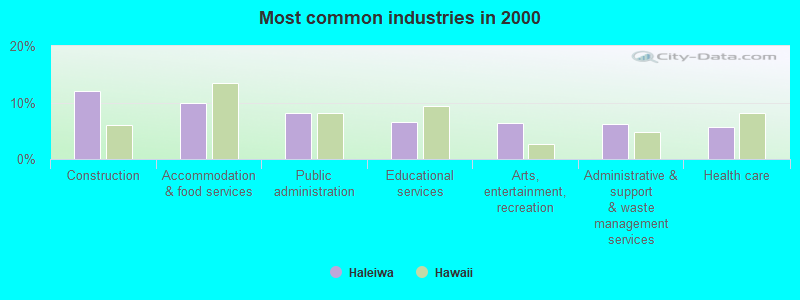
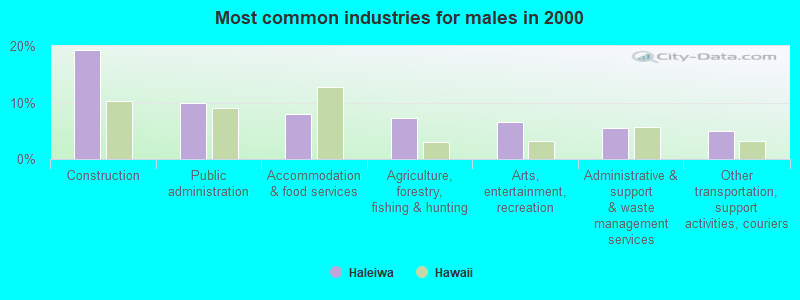
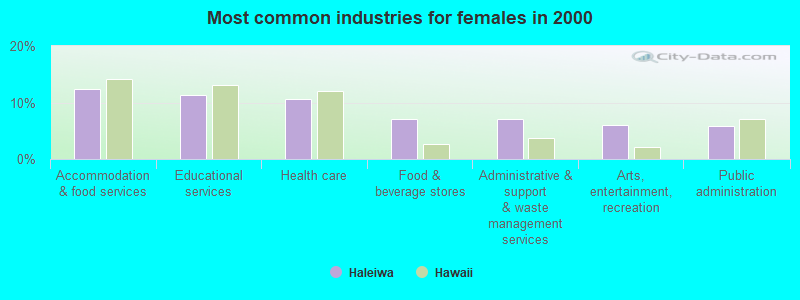
Most common industries in Haleiwa, HI (%)
Both Males Females
Construction (12.1%)
Accommodation & food services (9.9%)
Public administration (8.2%)
Educational services (6.5%)
Arts, entertainment, recreation (6.4%)
Administrative & support & waste management services (6.2%)
Health care (5.7%)
Construction (19.3%)
Public administration (9.9%)
Accommodation & food services (8.0%)
Agriculture, forestry, fishing & hunting (7.3%)
Arts, entertainment, recreation (6.6%)
Administrative & support & waste management services (5.5%)
Other transportation, support activities, couriers (4.9%)
Accommodation & food services (12.4%)
Educational services (11.4%)
Health care (10.6%)
Food & beverage stores (7.1%)
Administrative & support & waste management services (7.1%)
Arts, entertainment, recreation (6.1%)
Public administration (5.8%)
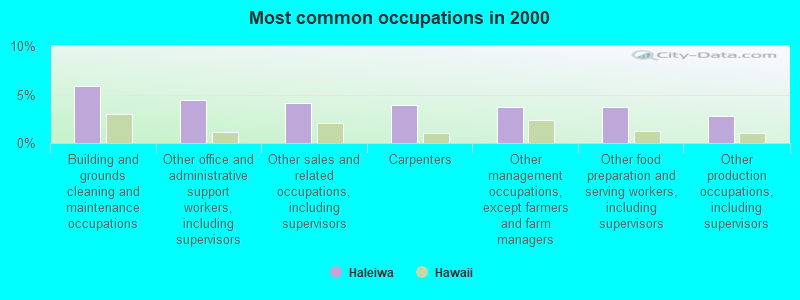
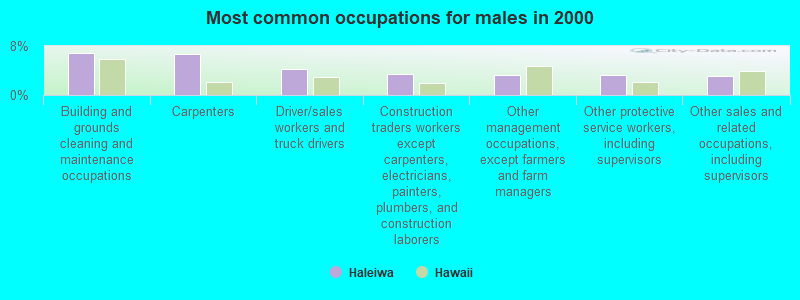
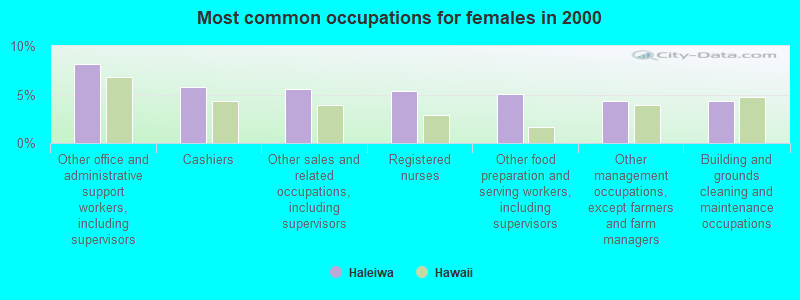
Most common occupations in Haleiwa, HI (%)
Both Males Females
Building and grounds cleaning and maintenance occupations (5.8%)
Other office and administrative support workers, including supervisors (4.5%)
Other sales and related occupations, including supervisors (4.1%)
Carpenters (3.9%)
Other management occupations, except farmers and farm managers (3.7%)
Other food preparation and serving workers, including supervisors (3.7%)
Other production occupations, including supervisors (2.8%)
Building and grounds cleaning and maintenance occupations (6.9%)
Carpenters (6.8%)
Driver/sales workers and truck drivers (4.2%)
Construction traders workers except carpenters, electricians, painters, plumbers, and construction laborers (3.5%)
Other management occupations, except farmers and farm managers (3.3%)
Other protective service workers, including supervisors (3.3%)
Other sales and related occupations, including supervisors (3.1%)
Other office and administrative support workers, including supervisors (8.1%)
Cashiers (5.8%)
Other sales and related occupations, including supervisors (5.6%)
Registered nurses (5.3%)
Other food preparation and serving workers, including supervisors (5.1%)
Other management occupations, except farmers and farm managers (4.3%)
Building and grounds cleaning and maintenance occupations (4.3%)
Earthquake activity:
Haleiwa-area historical earthquake activity is significantly above Hawaii state average. It is 1008% greater than the overall U.S. average. On 11/29/1975 at 14:47:40, a magnitude 7.2 (6.0 MB, 7.1 MS, 7.2 UK, 7.2 MS, Class: Major, Intensity: VIII - XII) earthquake occurred 248.3 miles away from the city center, causing 2 deaths ( 2 shaking deaths) On 8/21/1951 at 10:57:00, a magnitude 6.9 (6.9 UK, Class: Strong, Intensity: VII - IX) earthquake occurred 186.8 miles away from Haleiwa center On 10/15/2006 at 17:07:49, a magnitude 6.7 (6.2 MB, 6.6 MS, 6.7 MW) earthquake occurred 182.2 miles away from the city center On 10/15/2006 at 17:07:49, a magnitude 6.7 (6.7 MD, Depth: 23.7 mi) earthquake occurred 184.1 miles away from the city center On 5/4/2018 at 22:32:54, a magnitude 6.9 (6.9 MW, Depth: 3.6 mi) earthquake occurred 255.8 miles away from Haleiwa center On 11/16/1983 at 16:13:00, a magnitude 6.7 (6.4 MB, 6.7 MS, 6.7 MW) earthquake occurred 231.5 miles away from the city center, causing $6,000,000 total damage Magnitude types: body-wave magnitude (MB), duration magnitude (MD), surface-wave magnitude (MS), moment magnitude (MW) Natural disasters: The number of natural disasters in Honolulu County (16) is near the US average (15).Major Disasters (Presidential) Declared: 10Emergencies Declared: 1Floods: 7, Storms: 7, Fires: 3, Mudslides: 3, Landslides: 2, Earthquake: 1, Flash Flood: 1, Heavy Rain: 1, Hurricane: 1, Tsunami Wave: 1, Typhoon: 1, Other: 1 (Note: some incidents may be assigned to more than one category). Hospitals and medical centers in Haleiwa: CRAWFORD`S CONVALESCENT HOME (58-130 KAMEHAMEHA HIGHWAY)
Other hospitals and medical centers near Haleiwa: FMC WAHIAWA DIALYSIS CENTER (Dialysis Facility, about 9 miles away; WAHIAWA, HI)
WAHIAWA GENERAL HOSPITAL (Nursing Home, about 9 miles away; WAHIAWA, HI)
WAHIAWA GEN HOSP ICF (Nursing Home, about 9 miles away; WHIAWA, HI)
WAHIAWA GENERAL HOSPITAL HHA (Home Health Center, about 9 miles away; WAHIAWA, HI)
WAIMANO TRAINING SCHOOL AND HOSPITAL (Nursing Home, about 16 miles away; PEARL CITY, HI)
Colleges/universities with over 2000 students nearest to Haleiwa:
Brigham Young University-Hawaii (about 13 miles; Laie, HI ; Full-time enrollment: 3,527)
Leeward Community College (about 16 miles; Pearl City, HI ; FT enrollment: 4,589)
Honolulu Community College (about 25 miles; Honolulu, HI ; FT enrollment: 2,538)
Hawaii Pacific University (about 26 miles; Honolulu, HI ; FT enrollment: 5,506)
University of Hawaii at Manoa (about 29 miles; Honolulu, HI ; FT enrollment: 16,461)
Chaminade University of Honolulu (about 29 miles; Honolulu, HI ; FT enrollment: 2,610)
Kapiolani Community College (about 30 miles; Honolulu, HI ; FT enrollment: 5,069)
Public elementary/middle schools in Haleiwa:
Private elementary/middle school in Haleiwa: SUNSET BEACH CHRISTIAN SCHOOL Students: 16, Location: 59-578 KAMEHAMEHA HWY, Grades: KG-6)
See full list of schools located in Haleiwa
Notable locations in Haleiwa: (A) , Honolulu Fire Department Station 14 Waialua (B) , Emergency Medical Services Unit Waialua (C) . Display/hide their locations on the map
Shopping Centers: (1) , Haleiwa Shopping Plaza Shopping Center (2) . Display/hide their locations on the map
Church in Haleiwa: (A) . Display/hide its location on the map
Lakes: (A) , Lokoea (B) . Display/hide their locations on the map
Streams, rivers, and creeks: (A) , Kaukonahua Stream (B) , Helemano Stream (C) . Display/hide their locations on the map
Parks in Haleiwa include: (1) , Kaiaka State Recreation Area (2) . Display/hide their locations on the map
Beaches: (A) , Maeaea (B) . Display/hide their locations on the map
Tourist attractions:
Birthplace of: Brian Ching - Major League Soccer player (San Jose, born : May 24, 1978).
Honolulu County has a predicted average indoor radon screening level less than 2 pCi/L (pico curies per liter) - Low Potential Average household size: This place:
3.3 peopleHawaii:
2.9 people
Percentage of family households: This place:
72.7%Whole state:
68.9%
Percentage of households with unmarried partners: This place:
7.0%Whole state:
7.3%
Likely homosexual households (counted as self-reported same-sex unmarried-partner households)
Lesbian couples: 0.3% of all households Gay men: 0.4% of all households
57 people in other noninstitutional facilities in 2010people in other noninstitutional group quarters in 2000
Banks with branches in Haleiwa (2011 data):
American Savings Bank, FSB: Haleiwa Branch at 66-197 Kamehameha Highway, branch established on 1991/03/01. Info updated 2012/01/09: Bank assets: $4,910.1 mil, Deposits: $4,107.0 mil, headquarters in Honolulu, HI, positive income , Mortgage Lending Specialization, 57 total offices
First Hawaiian Bank: Haleiwa Branch at 66-135 Kamehameha Highway, branch established on 1915/11/18. Info updated 2012/02/02: Bank assets: $15,830.2 mil, Deposits: $12,165.6 mil, headquarters in Honolulu, HI, positive income , 59 total offices , Holding Company: Bnp Paribas
Bank of Hawaii: Haleiwa Branch at 66-165 Kamehameha Highway, branch established on 1981/01/05. Info updated 2010/09/12: Bank assets: $13,868.5 mil, Deposits: $10,599.9 mil, headquarters in Honolulu, HI, positive income , Mortgage Lending Specialization, 71 total offices , Holding Company: Bank Of Hawaii Corporation
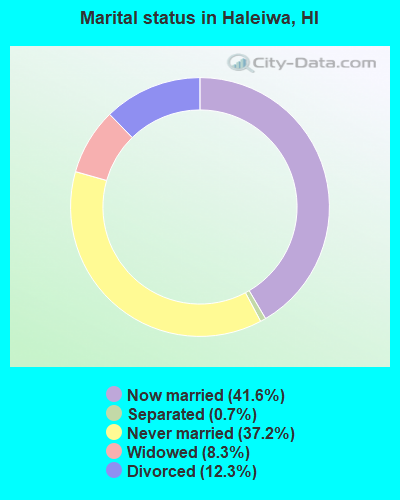
For population 15 years and over in Haleiwa:
Never married: 37.2%Now married: 41.6%Separated: 0.7%Widowed: 8.3%Divorced: 12.3% For population 25 years and over in Haleiwa:
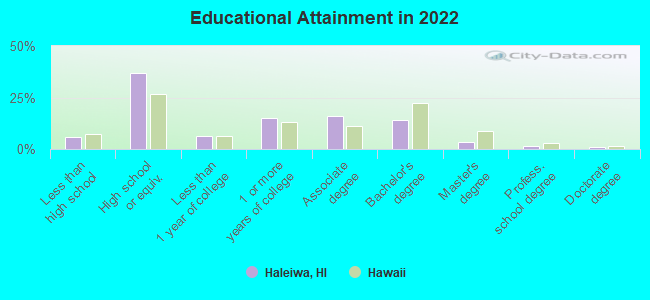
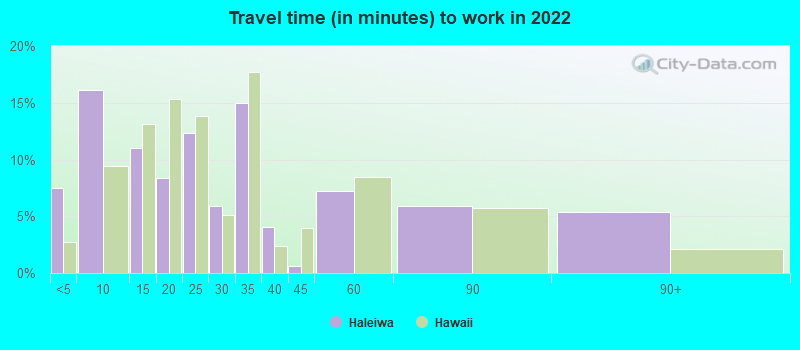
High school or higher: 93.1%Bachelor's degree or higher: 19.0%Graduate or professional degree: 5.3%Unemployed: 5.2%Mean travel time to work (commute): 30.0 minutes
Education Gini index (Inequality in education) Here:
9.3Hawaii average:
11.2
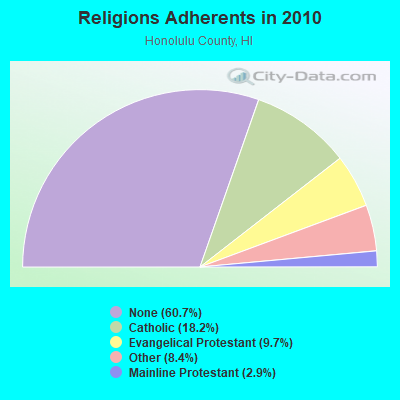
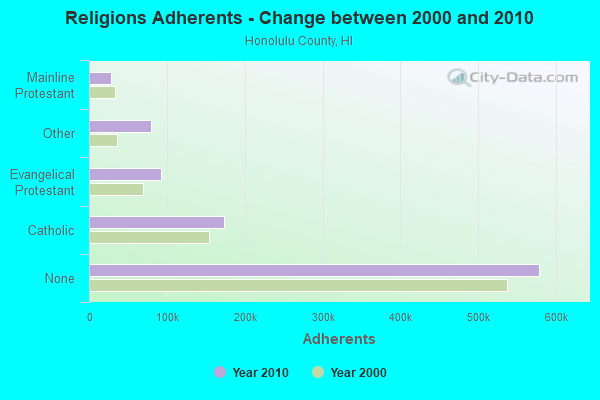
Religion statistics for Haleiwa, HI (based on Honolulu County data)
Religion Adherents Congregations Catholic 173,716 39 Evangelical Protestant 92,310 382 Other 80,221 204 Mainline Protestant 28,013 115 Orthodox 300 4 None 578,647 -
Source: Clifford Grammich, Kirk Hadaway, Richard Houseal, Dale E.Jones, Alexei Krindatch, Richie Stanley and Richard H.Taylor. 2012. 2010 U.S.Religion Census: Religious Congregations & Membership Study. Association of Statisticians of American Religious Bodies. Jones, Dale E., et al. 2002. Congregations and Membership in the United States 2000. Nashville, TN: Glenmary Research Center. Graphs represent county-level data
Food Environment Statistics: Number of grocery stores : 195Honolulu County :
2.17 / 10,000 pop.Hawaii :
2.30 / 10,000 pop.
Number of supercenters and club stores : 9This county :
0.10 / 10,000 pop.State :
0.09 / 10,000 pop.
Number of convenience stores (no gas) : 126Honolulu County :
1.40 / 10,000 pop.Hawaii :
1.57 / 10,000 pop.
Number of convenience stores (with gas) : 141Honolulu County :
1.57 / 10,000 pop.State :
1.72 / 10,000 pop.
Number of full-service restaurants : 734Here :
8.15 / 10,000 pop.State :
9.00 / 10,000 pop.
Adult diabetes rate : This county :
8.3%Hawaii :
8.1%
Adult obesity rate : Honolulu County :
20.5%Hawaii :
20.8%
Low-income preschool obesity rate : This county :
8.9%State :
9.2%
Health and Nutrition:
Average overall health of teeth and gums : This city:
48.4%State:
50.5%
Average BMI : This city:
27.8Hawaii:
26.8
People feeling badly about themselves : People not drinking alcohol at all : Haleiwa:
17.0%Hawaii:
18.1%
Average hours sleeping at night : General health condition : Average condition of hearing : More about Health and Nutrition of Haleiwa, HI Residents
4.80% of this county's 2021 resident taxpayers lived in other counties in 2020 ($72,704 average adjusted gross income )
Here:
4.80%Hawaii average:
4.91%
0.27% of residents moved from foreign countries ($4,064 average AGI )Honolulu County:
0.27%Hawaii average:
0.19%
Top counties from which taxpayers relocated into this county between 2020 and 2021:
5.90% of this county's 2020 resident taxpayers moved to other counties in 2021 ($71,643 average adjusted gross income )
Here:
5.90%Hawaii average:
5.53%
0.21% of residents moved to foreign countries ($2,928 average AGI )Honolulu County:
0.21%Hawaii average:
0.15%
Top counties to which taxpayers relocated from this county between 2020 and 2021:
Businesses in Haleiwa, HI
Name Count Name Count
7-Eleven 1 FedEx 1 Ace Hardware 1 Starbucks 1 CVS 1 Vans 3
Strongest AM radio stations in Haleiwa:
KHNR (650 AM; 10 kW; HONOLULU, HI; Owner: SALEM MEDIA OF HAWAII, INC.)
KHCM (940 AM; 10 kW; WAIPAHU, HI; Owner: SALEM MEDIA OF HAWAII, INC.)
KJPN (1370 AM; 6 kW; PEARL CITY, HI; Owner: DIAMOND BROADCASTING CORPORATION)
KSSK (590 AM; 8 kW; HONOLULU, HI; Owner: CAPSTAR TX LIMITED PARTNERSHIP)
KHVH (830 AM; 10 kW; HONOLULU, HI; Owner: CAPSTAR TX LIMITED PARTNERSHIP)
KORL (690 AM; 10 kW; HONOLULU, HI; Owner: NEW WAVE BROADCASTING, L.P.)
KGU (760 AM; 10 kW; HONOLULU, HI; Owner: SALEM MEDIA OF HAWAII, INC.)
KLHT (1040 AM; 10 kW; HONOLULU, HI; Owner: CALVARY CHAPEL OF HONOLULU, INC.)
KAIM (870 AM; 50 kW; HONOLULU, HI; Owner: SALEM MEDIA OF HAWAII, INC.)
KUMU (1500 AM; 10 kW; HONOLULU, HI; Owner: MAVERICK MEDIA OF OAHU LICENSE LLC)
KHBZ (990 AM; 5 kW; HONOLULU, HI; Owner: CAPSTAR TX LIMITED PARTNERSHIP)
KNDI (1270 AM; 5 kW; HONOLULU, HI; Owner: BROADCAST HOUSE OF THE PACIFIC INC.)
KWAI (1080 AM; 5 kW; HONOLULU, HI; Owner: RADIO HAWAII, INC.)
Strongest FM radio stations in Haleiwa:
KIPO (89.3 FM; HONOLULU, HI; Owner: HAWAII PUBLIC RADIO)
KAHA (105.9 FM; HONOLULU, HI; Owner: KASA MOKU KA PAWA BROADCASTING, INC.)
KCCN-FM (100.3 FM; HONOLULU, HI; Owner: CXR HOLDINGS, INC.)
KGMZ-FM (107.9 FM; AIEA, HI; Owner: HONOLULU BROADCASTING, INC.)
KINE-FM (105.1 FM; HONOLULU, HI; Owner: CXR HOLDINGS, INC.)
KUCD (101.9 FM; PEARL CITY, HI; Owner: CAPSTAR TX LIMITED PARTNERSHIP)
KAIM-FM (95.5 FM; HONOLULU, HI; Owner: SALEM MEDIA OF HAWAII, INC.)
KSSK-FM (92.3 FM; WAIPAHU, HI; Owner: CAPSTAR TX LIMITED PARTNERSHIP)
KDDB (102.7 FM; WAIPAHU, HI; Owner: NEW WAVE BROADCASTING, L.P.)
KPOI-FM (97.5 FM; HONOLULU, HI; Owner: NEW WAVE BROADCASTING, L.P.)
KQMQ-FM (93.1 FM; HONOLULU, HI; Owner: NEW WAVE BROADCASTING, L.P.)
KHUI (99.5 FM; HONOLULU, HI; Owner: NEW WAVE BROADCASTING, L.P.)
KXME (104.3 FM; KANEOHE, HI; Owner: CXR HOLDINGS, INC.)
KRTR-FM (96.3 FM; KAILUA, HI; Owner: CXR HOLDINGS, INC.)
K215EH (90.9 FM; KAILUA, HI; Owner: CALVARY CHAPEL OF TWIN FALLS, INC.)
K204BB (88.7 FM; HALEIWA, ETC., HI; Owner: HAWAII PUBLIC RADIO)
K217AA (91.3 FM; WAIALUA, HI; Owner: UNIVERSITY OF HAWAII)
TV broadcast stations around Haleiwa:
KWHE (Channel 14; HONOLULU, HI; Owner: LESEA BROADCASTING CORPORATION)
KHON-TV (Channel 2; HONOLULU, HI; Owner: EMMIS TELEVISION LICENSE CORPORATION)
KIKU (Channel 20; HONOLULU, HI; Owner: KHLS, INC.)
KGMB (Channel 9; HONOLULU, HI; Owner: EMMIS TELEVISION LICENSE CORPORATION)
KHLU-LP (Channel 60; HONOLULU, HI; Owner: HTV/HTN/HAWAIIAN TV NETWORK, LTD.)
KITV (Channel 4; HONOLULU, HI; Owner: KITV HEARST-ARGYLE TV, INC. (CA CORP.))
K54EX (Channel 54; HONOLULU, HI; Owner: CRAIG ALLYN JUE)
KAAH (Channel 26; HONOLULU, HI; Owner: TRINITY BROADCASTING NETWORK)
KBFD (Channel 32; HONOLULU, HI; Owner: THE ALLEN BROADCASTING CORP.)
KHNL (Channel 13; HONOLULU, HI; Owner: RAYCOM NATIONAL, INC.)
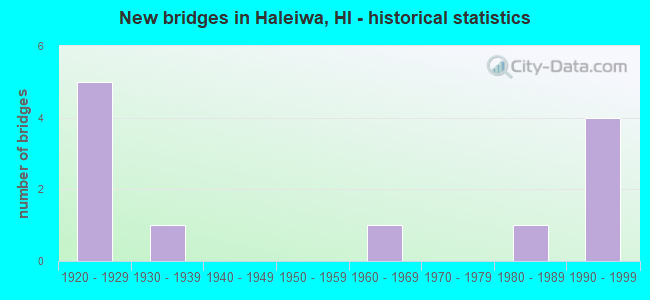
National Bridge Inventory (NBI) Statistics 12 Number of bridges125ft / 37.8m Total length $2,725,000 Total costs139,569 Total average daily traffic2,850 Total average daily truck traffic159,537 Total future (year 2025) average daily traffic
New bridges - historical statistics
5 1920-1929 1 1930-1939 1 1960-1969 1 1980-1989 4 1990-1999
See full National Bridge Inventory statistics for Haleiwa, HI
FCC Registered Cell Phone Towers: 1 (
See the full list of FCC Registered Cell Phone Towers in Haleiwa )
FCC Registered Antenna Towers: 22 (
See the full list of FCC Registered Antenna Towers )
FCC Registered Broadcast Land Mobile Towers: 5
Lat: 21.369333 Lon: -157.998083, Call Sign: WPVS312, Assigned Frequencies: 467.812 MHz, 467.862 MHz, 467.912 MHz, Grant Date: 08/08/2002, Expiration Date: 08/08/2012, Cancellation Date: 10/13/2012, Certifier: Everett Larue, Registrant: Cara Enterprises Inc, Salt Lake City, UT 84117-0503, Phone: (801) 278-9728, Fax: (801) 278-723959-864 Kamehameha Hwy At The Waterfall (Lat: 21.630556 Lon: -158.048611), Type: Pipe, Structure height: 4.6 m, Call Sign: WPYP933, Assigned Frequencies: 464.250 MHz, Grant Date: 07/06/2023, Expiration Date: 09/25/2033, Certifier: Gary L Gill, Registrant: Banyan Networks, 1150 N Nimitz Hwy, # 6, Honolulu, HI 96817, Phone: (808) 536-2058, Fax: (800) 536-2536, Email:
59-360 Kamehameha Hwy (Lat: 21.664111 Lon: -158.051000), Type: Bant, Structure height: 7 m, Overall height: 10 m, Call Sign: WQJK249, Assigned Frequencies: 462.900 MHz, Grant Date: 10/07/2008, Expiration Date: 10/07/2018, Cancellation Date: 12/08/2018, Certifier: Ruth Holmberg, Registrant: Visiplex, Inc., 100 N Fairway Drive, Suite 120, Vernon Hills, IL 60061, Phone: (847) 918-0250, Fax: (847) 918-0259, Email:
1.75 Mi Se Of Joseph P Leong Hwy On Opaeula Rd. (Lat: 21.578222 Lon: -158.077056), Type: Bant, Structure height: 6.1 m, Overall height: 8.1 m, Call Sign: WQNY226, Assigned Frequencies: 451.075 MHz, Grant Date: 07/05/2011, Expiration Date: 07/05/2021, Cancellation Date: 05/05/2021, Certifier: Everett La Rue, Registrant: Cara Enterprises Inc., Las Vegas, NV 89140-0124, Phone: (702) 838-9728, Fax: (702) 363-4607, Email:
62-350 Kawailoa Drive (Lat: 21.605000 Lon: -158.082222), Call Sign: WQOY833, Assigned Frequencies: 456.637 MHz, 457.137 MHz, Grant Date: 03/11/2022, Expiration Date: 03/08/2032, Certifier: Mary M Shaffer, Registrant: Blooston, Mordkofsky, Dickens & Prendergast, LLP, 2120 L Street, N.W., Suite 825, Washington, DC 20037, Phone: (202) 828-5519, Fax: (202) 828-5568, Email:
FCC Registered Microwave Towers: 4 (
See the full list of FCC Registered Microwave Towers in this town )
FCC Registered Paging Towers: 3 (
See the full list of FCC Registered Paging Towers )
FCC Registered Maritime Coast & Aviation Ground Towers: 1 (
See the full list of FCC Registered Maritime Coast & Aviation Ground Towers )
FCC Registered Amateur Radio Licenses: 50 (
See the full list of FCC Registered Amateur Radio Licenses in Haleiwa )
FAA Registered Aircraft Manufacturers and Dealers: 1 (
See the full list of FAA Registered Manufacturers and Dealers in Haleiwa )
FAA Registered Aircraft: 18 (
See the full list of FAA Registered Aircraft )
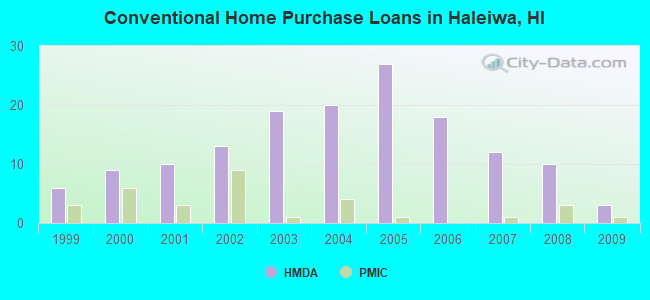
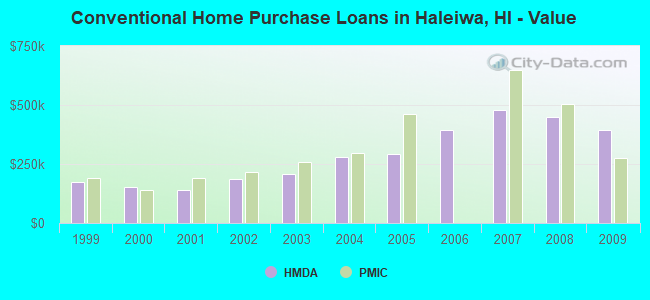
Home Mortgage Disclosure Act Aggregated Statistics For Year 2009(Based on 1 partial tract) A) FHA, FSA/RHS & VA B) Conventional C) Refinancings D) Home Improvement Loans F) Non-occupant Loans on Number Average Value Number Average Value Number Average Value Number Average Value Number Average Value
LOANS ORIGINATED 0 $0 3 $395,557 33 $305,935 2 $75,000 6 $265,468 APPLICATIONS APPROVED, NOT ACCEPTED 0 $0 0 $0 6 $414,517 0 $0 0 $0 APPLICATIONS DENIED 0 $0 1 $260,600 19 $326,866 1 $190,680 1 $130,930 APPLICATIONS WITHDRAWN 1 $317,800 1 $450,000 8 $376,672 1 $214,830 1 $450,000 FILES CLOSED FOR INCOMPLETENESS 0 $0 0 $0 3 $331,570 0 $0 0 $0
Aggregated Statistics For Year 2008(Based on 1 partial tract) A) FHA, FSA/RHS & VA B) Conventional C) Refinancings D) Home Improvement Loans F) Non-occupant Loans on Number Average Value Number Average Value Number Average Value Number Average Value Number Average Value
LOANS ORIGINATED 1 $174,150 10 $447,145 18 $346,402 5 $260,596 6 $344,918 APPLICATIONS APPROVED, NOT ACCEPTED 0 $0 1 $1,259,760 4 $388,988 0 $0 1 $1,259,760 APPLICATIONS DENIED 0 $0 3 $556,150 16 $343,542 6 $227,757 1 $391,530 APPLICATIONS WITHDRAWN 0 $0 1 $181,150 10 $277,376 1 $270,130 1 $181,150 FILES CLOSED FOR INCOMPLETENESS 0 $0 1 $577,760 1 $258,690 0 $0 0 $0
Aggregated Statistics For Year 2007(Based on 1 partial tract) B) Conventional C) Refinancings D) Home Improvement Loans F) Non-occupant Loans on Number Average Value Number Average Value Number Average Value Number Average Value
LOANS ORIGINATED 12 $477,230 36 $360,721 7 $192,406 5 $394,708 APPLICATIONS APPROVED, NOT ACCEPTED 1 $283,480 14 $315,076 1 $38,140 1 $265,050 APPLICATIONS DENIED 9 $381,642 23 $404,131 10 $127,247 4 $482,420 APPLICATIONS WITHDRAWN 7 $616,441 12 $376,540 2 $82,630 1 $700,430 FILES CLOSED FOR INCOMPLETENESS 1 $329,240 1 $286,020 0 $0 0 $0
Aggregated Statistics For Year 2006(Based on 1 partial tract) A) FHA, FSA/RHS & VA B) Conventional C) Refinancings D) Home Improvement Loans F) Non-occupant Loans on Number Average Value Number Average Value Number Average Value Number Average Value Number Average Value
LOANS ORIGINATED 1 $579,030 18 $393,260 44 $313,900 10 $202,502 6 $355,195 APPLICATIONS APPROVED, NOT ACCEPTED 0 $0 3 $334,113 14 $404,151 3 $170,130 0 $0 APPLICATIONS DENIED 0 $0 6 $406,042 14 $265,136 5 $187,756 1 $245,980 APPLICATIONS WITHDRAWN 1 $124,580 3 $503,607 17 $307,855 0 $0 1 $1,256,580 FILES CLOSED FOR INCOMPLETENESS 0 $0 3 $361,443 6 $382,737 0 $0 1 $589,840
Aggregated Statistics For Year 2005(Based on 1 partial tract) A) FHA, FSA/RHS & VA B) Conventional C) Refinancings D) Home Improvement Loans E) Loans on Dwellings For 5+ Families F) Non-occupant Loans on Number Average Value Number Average Value Number Average Value Number Average Value Number Average Value Number Average Value
LOANS ORIGINATED 1 $219,280 27 $290,893 54 $325,569 10 $267,079 1 $870,770 14 $310,127 APPLICATIONS APPROVED, NOT ACCEPTED 0 $0 5 $294,792 8 $262,820 4 $155,245 0 $0 2 $292,060 APPLICATIONS DENIED 0 $0 6 $292,588 20 $252,714 6 $213,138 0 $0 4 $337,822 APPLICATIONS WITHDRAWN 0 $0 3 $437,717 26 $250,793 3 $389,833 0 $0 3 $152,120 FILES CLOSED FOR INCOMPLETENESS 1 $158,900 1 $185,600 11 $358,709 0 $0 0 $0 1 $730,940
Aggregated Statistics For Year 2004(Based on 1 partial tract) B) Conventional C) Refinancings D) Home Improvement Loans F) Non-occupant Loans on Number Average Value Number Average Value Number Average Value Number Average Value
LOANS ORIGINATED 20 $277,852 64 $209,907 9 $109,182 18 $227,474 APPLICATIONS APPROVED, NOT ACCEPTED 4 $201,168 15 $249,664 3 $81,357 2 $263,455 APPLICATIONS DENIED 3 $358,053 14 $247,521 1 $38,140 4 $187,502 APPLICATIONS WITHDRAWN 3 $416,743 12 $259,166 1 $296,830 2 $236,445 FILES CLOSED FOR INCOMPLETENESS 0 $0 3 $223,943 0 $0 0 $0
Aggregated Statistics For Year 2003(Based on 1 partial tract) A) FHA, FSA/RHS & VA B) Conventional C) Refinancings D) Home Improvement Loans F) Non-occupant Loans on Number Average Value Number Average Value Number Average Value Number Average Value Number Average Value
LOANS ORIGINATED 3 $208,263 19 $209,414 68 $190,465 1 $23,520 8 $220,235 APPLICATIONS APPROVED, NOT ACCEPTED 0 $0 9 $192,022 8 $167,958 0 $0 4 $228,498 APPLICATIONS DENIED 0 $0 4 $163,825 18 $200,814 0 $0 4 $245,342 APPLICATIONS WITHDRAWN 0 $0 1 $215,470 15 $207,333 1 $34,960 2 $167,800 FILES CLOSED FOR INCOMPLETENESS 0 $0 0 $0 3 $111,017 0 $0 0 $0
Aggregated Statistics For Year 2002(Based on 1 partial tract) A) FHA, FSA/RHS & VA B) Conventional C) Refinancings D) Home Improvement Loans F) Non-occupant Loans on Number Average Value Number Average Value Number Average Value Number Average Value Number Average Value
LOANS ORIGINATED 2 $152,225 13 $185,008 40 $181,226 2 $14,935 7 $165,710 APPLICATIONS APPROVED, NOT ACCEPTED 0 $0 0 $0 4 $226,750 0 $0 0 $0 APPLICATIONS DENIED 0 $0 2 $163,665 10 $172,947 1 $22,250 2 $136,020 APPLICATIONS WITHDRAWN 0 $0 1 $155,720 11 $202,295 1 $5,080 1 $155,720 FILES CLOSED FOR INCOMPLETENESS 0 $0 0 $0 3 $115,680 0 $0 1 $150,000
Aggregated Statistics For Year 2001(Based on 1 partial tract) A) FHA, FSA/RHS & VA B) Conventional C) Refinancings D) Home Improvement Loans F) Non-occupant Loans on Number Average Value Number Average Value Number Average Value Number Average Value Number Average Value
LOANS ORIGINATED 3 $130,297 10 $141,040 23 $156,164 1 $4,450 8 $144,122 APPLICATIONS APPROVED, NOT ACCEPTED 0 $0 1 $160,170 4 $174,312 0 $0 1 $55,930 APPLICATIONS DENIED 0 $0 2 $137,290 13 $203,881 1 $14,620 2 $207,205 APPLICATIONS WITHDRAWN 0 $0 0 $0 4 $192,588 0 $0 1 $109,960 FILES CLOSED FOR INCOMPLETENESS 1 $88,350 0 $0 4 $221,508 1 $31,780 0 $0
Aggregated Statistics For Year 2000(Based on 1 partial tract) A) FHA, FSA/RHS & VA B) Conventional C) Refinancings D) Home Improvement Loans F) Non-occupant Loans on Number Average Value Number Average Value Number Average Value Number Average Value Number Average Value
LOANS ORIGINATED 1 $170,340 9 $152,402 17 $121,699 4 $12,395 3 $163,983 APPLICATIONS APPROVED, NOT ACCEPTED 0 $0 4 $173,995 4 $147,300 1 $38,140 2 $182,735 APPLICATIONS DENIED 1 $120,760 4 $90,255 9 $150,001 1 $10,170 1 $29,240 APPLICATIONS WITHDRAWN 0 $0 2 $92,800 4 $157,630 0 $0 0 $0 FILES CLOSED FOR INCOMPLETENESS 0 $0 1 $156,990 10 $176,125 0 $0 0 $0
Aggregated Statistics For Year 1999(Based on 1 partial tract) A) FHA, FSA/RHS & VA B) Conventional C) Refinancings D) Home Improvement Loans E) Loans on Dwellings For 5+ Families F) Non-occupant Loans on Number Average Value Number Average Value Number Average Value Number Average Value Number Average Value Number Average Value
LOANS ORIGINATED 3 $191,410 6 $173,093 16 $156,161 8 $20,331 0 $0 2 $70,885 APPLICATIONS APPROVED, NOT ACCEPTED 0 $0 0 $0 5 $145,838 1 $2,200 0 $0 1 $54,950 APPLICATIONS DENIED 0 $0 1 $227,490 10 $158,915 2 $5,220 1 $315,960 2 $144,245 APPLICATIONS WITHDRAWN 0 $0 1 $129,680 13 $188,648 1 $34,070 0 $0 1 $236,290 FILES CLOSED FOR INCOMPLETENESS 0 $0 0 $0 7 $149,543 0 $0 0 $0 0 $0
Detailed HMDA statistics for the following Tracts:
0099.02
Private Mortgage Insurance Companies Aggregated Statistics For Year 2009(Based on 1 partial tract) A) Conventional Number Average Value
LOANS ORIGINATED 1 $274,580 APPLICATIONS APPROVED, NOT ACCEPTED 1 $274,580 APPLICATIONS DENIED 0 $0 APPLICATIONS WITHDRAWN 0 $0 FILES CLOSED FOR INCOMPLETENESS 0 $0
Aggregated Statistics For Year 2008(Based on 1 partial tract) A) Conventional B) Refinancings Number Average Value Number Average Value
LOANS ORIGINATED 3 $503,397 0 $0 APPLICATIONS APPROVED, NOT ACCEPTED 1 $274,580 1 $306,360 APPLICATIONS DENIED 1 $220,550 0 $0 APPLICATIONS WITHDRAWN 1 $274,580 1 $362,290 FILES CLOSED FOR INCOMPLETENESS 0 $0 0 $0
Aggregated Statistics For Year 2007(Based on 1 partial tract) A) Conventional B) Refinancings Number Average Value Number Average Value
LOANS ORIGINATED 1 $646,410 1 $646,410 APPLICATIONS APPROVED, NOT ACCEPTED 1 $266,320 0 $0 APPLICATIONS DENIED 0 $0 0 $0 APPLICATIONS WITHDRAWN 0 $0 0 $0 FILES CLOSED FOR INCOMPLETENESS 0 $0 0 $0
Aggregated Statistics For Year 2005(Based on 1 partial tract) A) Conventional B) Refinancings C) Non-occupant Loans on Number Average Value Number Average Value Number Average Value
LOANS ORIGINATED 1 $460,810 1 $455,730 1 $460,810 APPLICATIONS APPROVED, NOT ACCEPTED 0 $0 0 $0 0 $0 APPLICATIONS DENIED 0 $0 0 $0 0 $0 APPLICATIONS WITHDRAWN 0 $0 0 $0 0 $0 FILES CLOSED FOR INCOMPLETENESS 0 $0 0 $0 0 $0
Aggregated Statistics For Year 2004(Based on 1 partial tract) A) Conventional B) Refinancings C) Non-occupant Loans on Number Average Value Number Average Value Number Average Value
LOANS ORIGINATED 4 $294,600 0 $0 2 $280,935 APPLICATIONS APPROVED, NOT ACCEPTED 0 $0 1 $110,590 0 $0 APPLICATIONS DENIED 0 $0 0 $0 0 $0 APPLICATIONS WITHDRAWN 0 $0 0 $0 0 $0 FILES CLOSED FOR INCOMPLETENESS 0 $0 0 $0 0 $0
Aggregated Statistics For Year 2003(Based on 1 partial tract) A) Conventional B) Refinancings Number Average Value Number Average Value
LOANS ORIGINATED 1 $259,960 7 $231,540 APPLICATIONS APPROVED, NOT ACCEPTED 0 $0 0 $0 APPLICATIONS DENIED 0 $0 0 $0 APPLICATIONS WITHDRAWN 1 $231,990 1 $155,720 FILES CLOSED FOR INCOMPLETENESS 0 $0 0 $0
Aggregated Statistics For Year 2002(Based on 1 partial tract) A) Conventional B) Refinancings C) Non-occupant Loans on Number Average Value Number Average Value Number Average Value
LOANS ORIGINATED 9 $214,268 5 $205,554 1 $205,930 APPLICATIONS APPROVED, NOT ACCEPTED 0 $0 1 $183,050 0 $0 APPLICATIONS DENIED 0 $0 1 $134,750 0 $0 APPLICATIONS WITHDRAWN 0 $0 0 $0 0 $0 FILES CLOSED FOR INCOMPLETENESS 0 $0 1 $108,050 1 $108,050
Aggregated Statistics For Year 2001(Based on 1 partial tract) A) Conventional B) Refinancings C) Non-occupant Loans on Number Average Value Number Average Value Number Average Value
LOANS ORIGINATED 3 $190,893 3 $166,527 1 $179,870 APPLICATIONS APPROVED, NOT ACCEPTED 0 $0 0 $0 0 $0 APPLICATIONS DENIED 0 $0 0 $0 0 $0 APPLICATIONS WITHDRAWN 1 $106,150 0 $0 0 $0 FILES CLOSED FOR INCOMPLETENESS 0 $0 0 $0 0 $0
Aggregated Statistics For Year 2000(Based on 1 partial tract) A) Conventional B) Refinancings Number Average Value Number Average Value
LOANS ORIGINATED 6 $139,727 2 $201,485 APPLICATIONS APPROVED, NOT ACCEPTED 0 $0 1 $285,380 APPLICATIONS DENIED 1 $108,690 0 $0 APPLICATIONS WITHDRAWN 0 $0 0 $0 FILES CLOSED FOR INCOMPLETENESS 0 $0 0 $0
Aggregated Statistics For Year 1999(Based on 1 partial tract) A) Conventional B) Refinancings Number Average Value Number Average Value
LOANS ORIGINATED 3 $191,410 2 $147,815 APPLICATIONS APPROVED, NOT ACCEPTED 0 $0 0 $0 APPLICATIONS DENIED 0 $0 0 $0 APPLICATIONS WITHDRAWN 0 $0 0 $0 FILES CLOSED FOR INCOMPLETENESS 0 $0 0 $0
Detailed PMIC statistics for the following Tracts:
0099.02
Haleiwa compared to Hawaii state average:
Unemployed percentage below state average. Foreign-born population percentage significantly above state average. Length of stay since moving in significantly above state average.
#62 on the list of "Top 101 cities with the most residents born in Philippines (population 500+)"
#7 on the list of "Top 101 counties with the lowest average weight of females"
#15 on the list of "Top 101 counties with the highest ground withdrawal of fresh water for public supply"
#21 on the list of "Top 101 counties with the most Other congregations"
#25 on the list of "Top 101 counties with the most Other adherents"
#25 on the list of "Top 101 counties with the highest carbon monoxide air pollution readings in 2012 (ppm)"
Top Patent Applicants
Charles H. Joyner (4)
Rick Grover (3)
Kunani Nihipali (2)
J. Patrick Stautzenberger (2)
Race Hawaii (1)
Leland Henry Dao (1)
Nicholas Louis Geranio (1)
Lawrence Scott Bicknell (1)
Eurica Califorrniaa (1)
Stephen L. Sherman (1)
Total of 18 patent applications in 2008-2024.


 Recent articles from our blog. Our writers, many of them Ph.D. graduates or candidates, create easy-to-read articles on a wide variety of topics.

 (15.7 miles
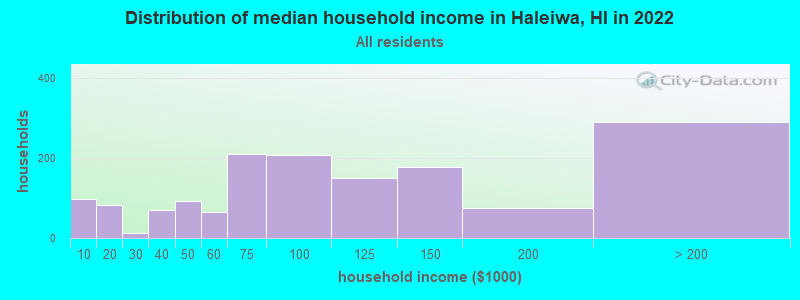

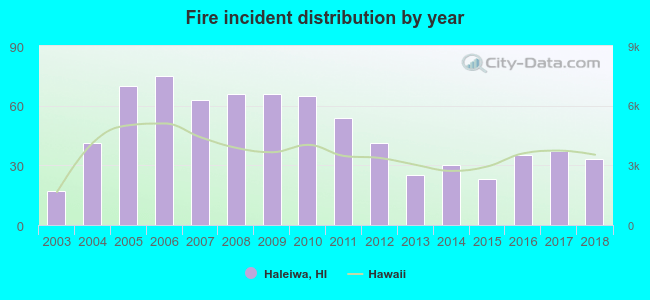 Based on the data from the years 2003 - 2018 the average number of fire incidents per year is 46. The highest number of reported fires - 75 took place in 2006, and the least - 17 in 2003. The data has a rising trend.
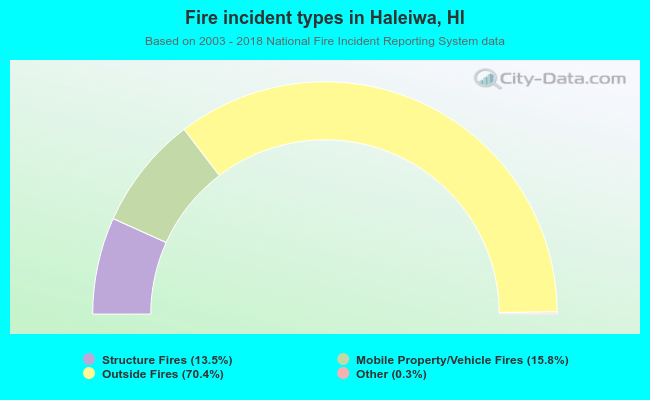 When looking into fire subcategories, the most reports belonged to: Outside Fires (70.4%), and Mobile Property/Vehicle Fires (15.8%).