Happy Valley, Oregon Submit your own pictures of this city and show them to the world
OSM Map
General Map
Google Map
MSN Map
OSM Map
General Map
Google Map
MSN Map
OSM Map
General Map
Google Map
MSN Map
OSM Map
General Map
Google Map
MSN Map
Please wait while loading the map...
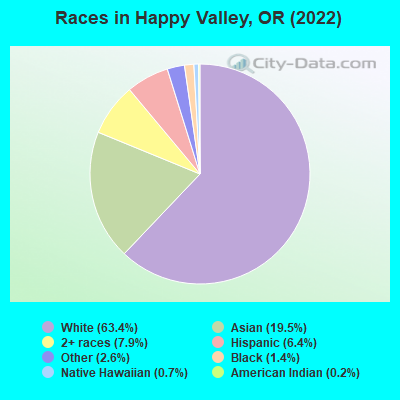
Population in 2022: 26,456 (100% urban, 0% rural). Population change since 2000: +485.4%Males: 13,337 Females: 13,119
March 2022 cost of living index in Happy Valley: 104.0 (near average, U.S. average is 100) Percentage of residents living in poverty in 2022: 5.6%for White Non-Hispanic residents , 2.2% for Black residents , 14.1% for Hispanic or Latino residents , 16.7% for other race residents , 9.7% for two or more races residents )
Profiles of local businesses
Business Search - 14 Million verified businesses
Data:
Median household income ($)
Median household income (% change since 2000)
Household income diversity
Ratio of average income to average house value (%)
Ratio of average income to average rent
Median household income ($) - White
Median household income ($) - Black or African American
Median household income ($) - Asian
Median household income ($) - Hispanic or Latino
Median household income ($) - American Indian and Alaska Native
Median household income ($) - Multirace
Median household income ($) - Other Race
Median household income for houses/condos with a mortgage ($)
Median household income for apartments without a mortgage ($)
Races - White alone (%)
Races - White alone (% change since 2000)
Races - Black alone (%)
Races - Black alone (% change since 2000)
Races - American Indian alone (%)
Races - American Indian alone (% change since 2000)
Races - Asian alone (%)
Races - Asian alone (% change since 2000)
Races - Hispanic (%)
Races - Hispanic (% change since 2000)
Races - Native Hawaiian and Other Pacific Islander alone (%)
Races - Native Hawaiian and Other Pacific Islander alone (% change since 2000)
Races - Two or more races (%)
Races - Two or more races (% change since 2000)
Races - Other race alone (%)
Races - Other race alone (% change since 2000)
Racial diversity
Unemployment (%)
Unemployment (% change since 2000)
Unemployment (%) - White
Unemployment (%) - Black or African American
Unemployment (%) - Asian
Unemployment (%) - Hispanic or Latino
Unemployment (%) - American Indian and Alaska Native
Unemployment (%) - Multirace
Unemployment (%) - Other Race
Population density (people per square mile)
Population - Males (%)
Population - Females (%)
Population - Males (%) - White
Population - Males (%) - Black or African American
Population - Males (%) - Asian
Population - Males (%) - Hispanic or Latino
Population - Males (%) - American Indian and Alaska Native
Population - Males (%) - Multirace
Population - Males (%) - Other Race
Population - Females (%) - White
Population - Females (%) - Black or African American
Population - Females (%) - Asian
Population - Females (%) - Hispanic or Latino
Population - Females (%) - American Indian and Alaska Native
Population - Females (%) - Multirace
Population - Females (%) - Other Race
Coronavirus confirmed cases (Apr 27, 2024)
Deaths caused by coronavirus (Apr 27, 2024)
Coronavirus confirmed cases (per 100k population) (Apr 27, 2024)
Deaths caused by coronavirus (per 100k population) (Apr 27, 2024)
Daily increase in number of cases (Apr 27, 2024)
Weekly increase in number of cases (Apr 27, 2024)
Cases doubled (in days) (Apr 27, 2024)
Hospitalized patients (Apr 18, 2022)
Negative test results (Apr 18, 2022)
Total test results (Apr 18, 2022)
COVID Vaccine doses distributed (per 100k population) (Sep 19, 2023)
COVID Vaccine doses administered (per 100k population) (Sep 19, 2023)
COVID Vaccine doses distributed (Sep 19, 2023)
COVID Vaccine doses administered (Sep 19, 2023)
Likely homosexual households (%)
Likely homosexual households (% change since 2000)
Likely homosexual households - Lesbian couples (%)
Likely homosexual households - Lesbian couples (% change since 2000)
Likely homosexual households - Gay men (%)
Likely homosexual households - Gay men (% change since 2000)
Cost of living index
Median gross rent ($)
Median contract rent ($)
Median monthly housing costs ($)
Median house or condo value ($)
Median house or condo value ($ change since 2000)
Mean house or condo value by units in structure - 1, detached ($)
Mean house or condo value by units in structure - 1, attached ($)
Mean house or condo value by units in structure - 2 ($)
Mean house or condo value by units in structure by units in structure - 3 or 4 ($)
Mean house or condo value by units in structure - 5 or more ($)
Mean house or condo value by units in structure - Boat, RV, van, etc. ($)
Mean house or condo value by units in structure - Mobile home ($)
Median house or condo value ($) - White
Median house or condo value ($) - Black or African American
Median house or condo value ($) - Asian
Median house or condo value ($) - Hispanic or Latino
Median house or condo value ($) - American Indian and Alaska Native
Median house or condo value ($) - Multirace
Median house or condo value ($) - Other Race
Median resident age
Resident age diversity
Median resident age - Males
Median resident age - Females
Median resident age - White
Median resident age - Black or African American
Median resident age - Asian
Median resident age - Hispanic or Latino
Median resident age - American Indian and Alaska Native
Median resident age - Multirace
Median resident age - Other Race
Median resident age - Males - White
Median resident age - Males - Black or African American
Median resident age - Males - Asian
Median resident age - Males - Hispanic or Latino
Median resident age - Males - American Indian and Alaska Native
Median resident age - Males - Multirace
Median resident age - Males - Other Race
Median resident age - Females - White
Median resident age - Females - Black or African American
Median resident age - Females - Asian
Median resident age - Females - Hispanic or Latino
Median resident age - Females - American Indian and Alaska Native
Median resident age - Females - Multirace
Median resident age - Females - Other Race
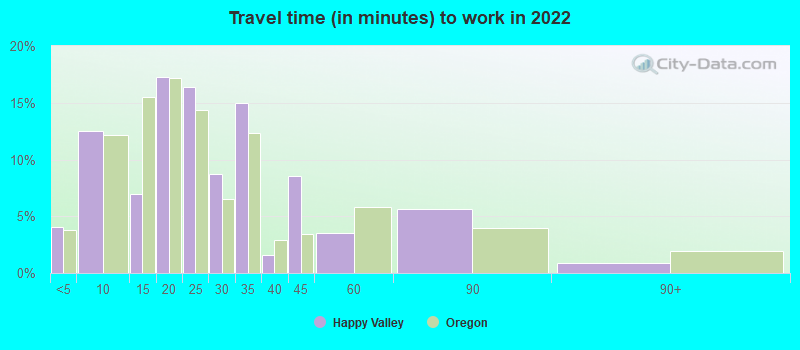
Commute - mean travel time to work (minutes)
Travel time to work - Less than 5 minutes (%)
Travel time to work - Less than 5 minutes (% change since 2000)
Travel time to work - 5 to 9 minutes (%)
Travel time to work - 5 to 9 minutes (% change since 2000)
Travel time to work - 10 to 19 minutes (%)
Travel time to work - 10 to 19 minutes (% change since 2000)
Travel time to work - 20 to 29 minutes (%)
Travel time to work - 20 to 29 minutes (% change since 2000)
Travel time to work - 30 to 39 minutes (%)
Travel time to work - 30 to 39 minutes (% change since 2000)
Travel time to work - 40 to 59 minutes (%)
Travel time to work - 40 to 59 minutes (% change since 2000)
Travel time to work - 60 to 89 minutes (%)
Travel time to work - 60 to 89 minutes (% change since 2000)
Travel time to work - 90 or more minutes (%)
Travel time to work - 90 or more minutes (% change since 2000)
Marital status - Never married (%)
Marital status - Now married (%)
Marital status - Separated (%)
Marital status - Widowed (%)
Marital status - Divorced (%)
Median family income ($)
Median family income (% change since 2000)
Median non-family income ($)
Median non-family income (% change since 2000)
Median per capita income ($)
Median per capita income (% change since 2000)
Median family income ($) - White
Median family income ($) - Black or African American
Median family income ($) - Asian
Median family income ($) - Hispanic or Latino
Median family income ($) - American Indian and Alaska Native
Median family income ($) - Multirace
Median family income ($) - Other Race
Median year house/condo built
Median year apartment built
Year house built - Built 2005 or later (%)
Year house built - Built 2000 to 2004 (%)
Year house built - Built 1990 to 1999 (%)
Year house built - Built 1980 to 1989 (%)
Year house built - Built 1970 to 1979 (%)
Year house built - Built 1960 to 1969 (%)
Year house built - Built 1950 to 1959 (%)
Year house built - Built 1940 to 1949 (%)
Year house built - Built 1939 or earlier (%)
Average household size
Household density (households per square mile)
Average household size - White
Average household size - Black or African American
Average household size - Asian
Average household size - Hispanic or Latino
Average household size - American Indian and Alaska Native
Average household size - Multirace
Average household size - Other Race
Occupied housing units (%)
Vacant housing units (%)
Owner occupied housing units (%)
Renter occupied housing units (%)
Vacancy status - For rent (%)
Vacancy status - For sale only (%)
Vacancy status - Rented or sold, not occupied (%)
Vacancy status - For seasonal, recreational, or occasional use (%)
Vacancy status - For migrant workers (%)
Vacancy status - Other vacant (%)
Residents with income below the poverty level (%)
Residents with income below 50% of the poverty level (%)
Children below poverty level (%)
Poor families by family type - Married-couple family (%)
Poor families by family type - Male, no wife present (%)
Poor families by family type - Female, no husband present (%)
Poverty status for native-born residents (%)
Poverty status for foreign-born residents (%)
Poverty among high school graduates not in families (%)
Poverty among people who did not graduate high school not in families (%)
Residents with income below the poverty level (%) - White
Residents with income below the poverty level (%) - Black or African American
Residents with income below the poverty level (%) - Asian
Residents with income below the poverty level (%) - Hispanic or Latino
Residents with income below the poverty level (%) - American Indian and Alaska Native
Residents with income below the poverty level (%) - Multirace
Residents with income below the poverty level (%) - Other Race
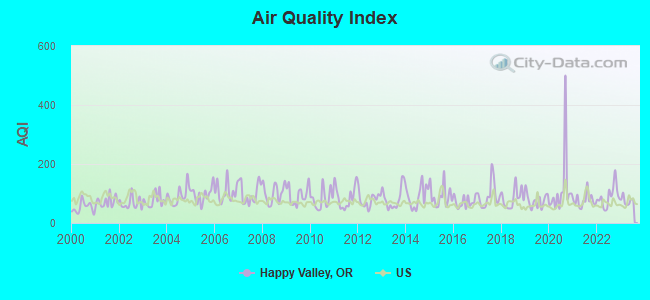
Air pollution - Air Quality Index (AQI)
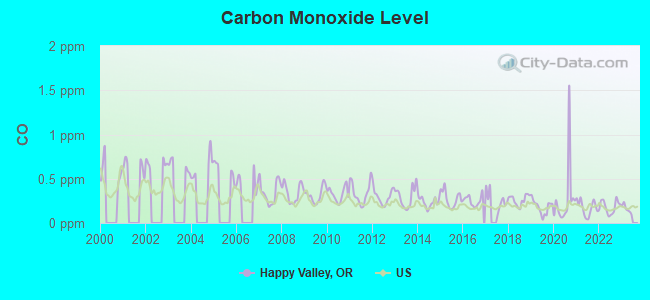
Air pollution - CO
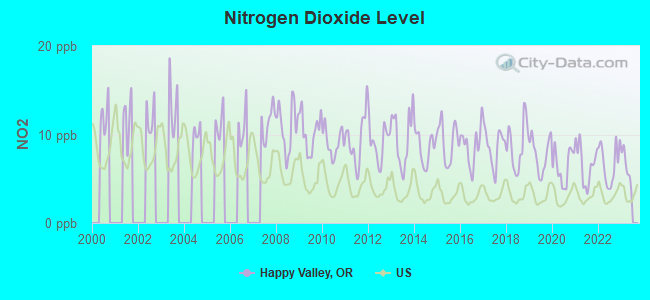
Air pollution - NO2
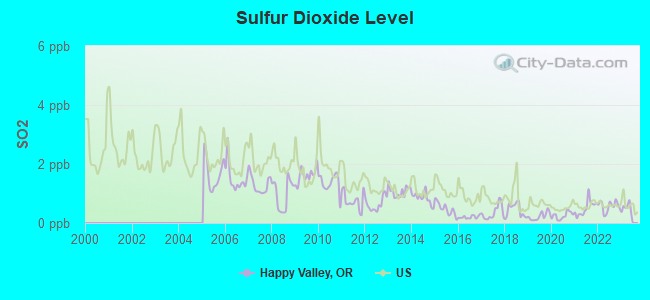
Air pollution - SO2
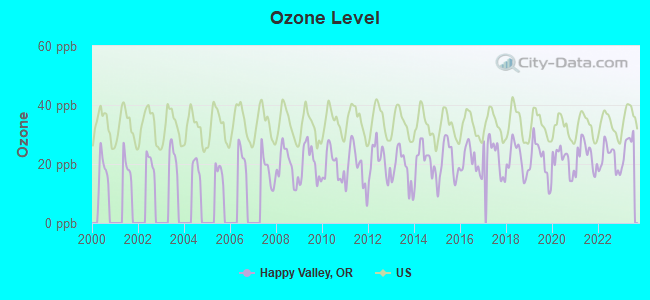
Air pollution - Ozone
Air pollution - PM10
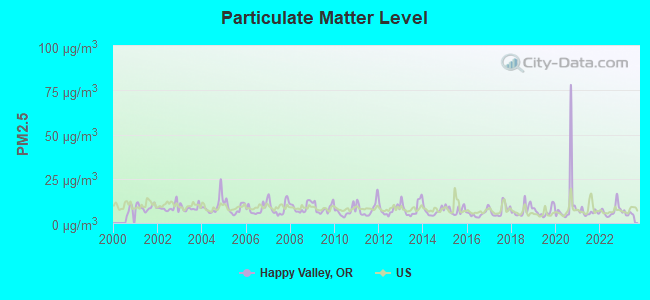
Air pollution - PM25
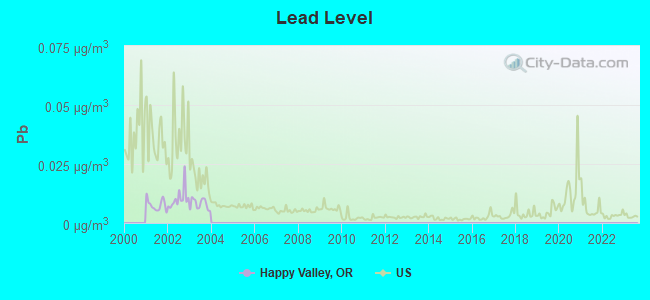
Air pollution - Pb
Crime - Murders per 100,000 population
Crime - Rapes per 100,000 population
Crime - Robberies per 100,000 population
Crime - Assaults per 100,000 population
Crime - Burglaries per 100,000 population
Crime - Thefts per 100,000 population
Crime - Auto thefts per 100,000 population
Crime - Arson per 100,000 population
Crime - City-data.com crime index
Crime - Violent crime index
Crime - Property crime index
Crime - Murders per 100,000 population (5 year average)
Crime - Rapes per 100,000 population (5 year average)
Crime - Robberies per 100,000 population (5 year average)
Crime - Assaults per 100,000 population (5 year average)
Crime - Burglaries per 100,000 population (5 year average)
Crime - Thefts per 100,000 population (5 year average)
Crime - Auto thefts per 100,000 population (5 year average)
Crime - Arson per 100,000 population (5 year average)
Crime - City-data.com crime index (5 year average)
Crime - Violent crime index (5 year average)
Crime - Property crime index (5 year average)
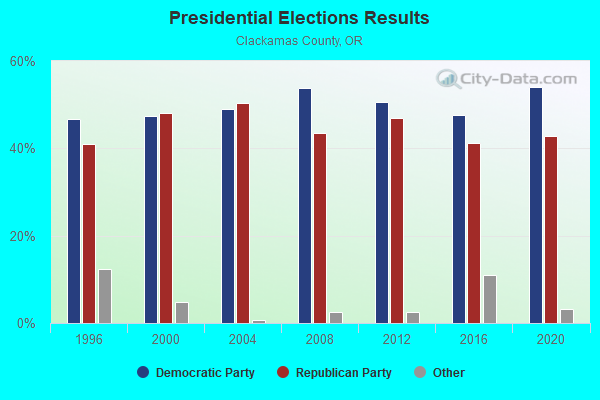
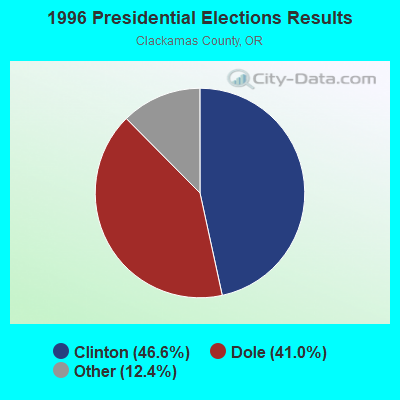
1996 Presidential Elections Results (%) - Democratic Party (Clinton)
1996 Presidential Elections Results (%) - Republican Party (Dole)
1996 Presidential Elections Results (%) - Other
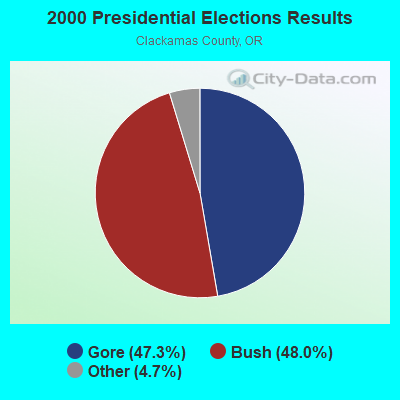
2000 Presidential Elections Results (%) - Democratic Party (Gore)
2000 Presidential Elections Results (%) - Republican Party (Bush)
2000 Presidential Elections Results (%) - Other
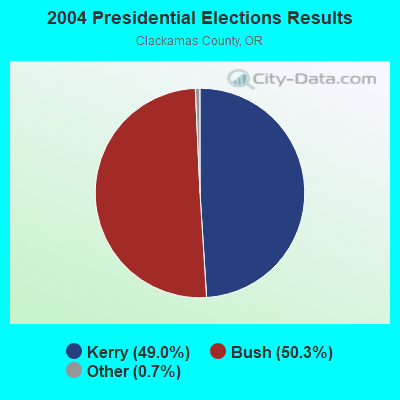
2004 Presidential Elections Results (%) - Democratic Party (Kerry)
2004 Presidential Elections Results (%) - Republican Party (Bush)
2004 Presidential Elections Results (%) - Other
2008 Presidential Elections Results (%) - Democratic Party (Obama)
2008 Presidential Elections Results (%) - Republican Party (McCain)
2008 Presidential Elections Results (%) - Other
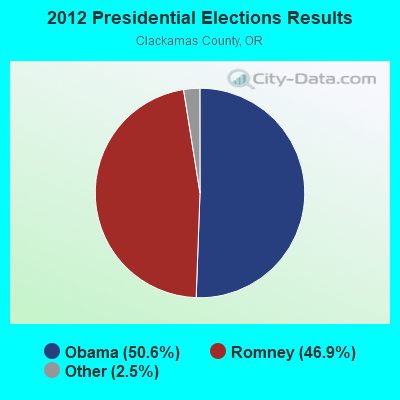
2012 Presidential Elections Results (%) - Democratic Party (Obama)
2012 Presidential Elections Results (%) - Republican Party (Romney)
2012 Presidential Elections Results (%) - Other
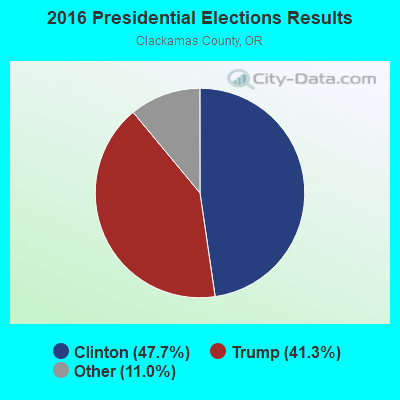
2016 Presidential Elections Results (%) - Democratic Party (Clinton)
2016 Presidential Elections Results (%) - Republican Party (Trump)
2016 Presidential Elections Results (%) - Other
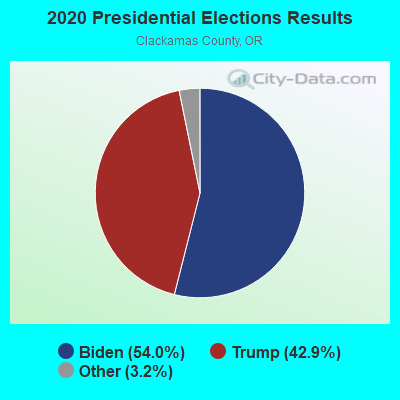
2020 Presidential Elections Results (%) - Democratic Party (Biden)
2020 Presidential Elections Results (%) - Republican Party (Trump)
2020 Presidential Elections Results (%) - Other
Ancestries Reported - Arab (%)
Ancestries Reported - Czech (%)
Ancestries Reported - Danish (%)
Ancestries Reported - Dutch (%)
Ancestries Reported - English (%)
Ancestries Reported - French (%)
Ancestries Reported - French Canadian (%)
Ancestries Reported - German (%)
Ancestries Reported - Greek (%)
Ancestries Reported - Hungarian (%)
Ancestries Reported - Irish (%)
Ancestries Reported - Italian (%)
Ancestries Reported - Lithuanian (%)
Ancestries Reported - Norwegian (%)
Ancestries Reported - Polish (%)
Ancestries Reported - Portuguese (%)
Ancestries Reported - Russian (%)
Ancestries Reported - Scotch-Irish (%)
Ancestries Reported - Scottish (%)
Ancestries Reported - Slovak (%)
Ancestries Reported - Subsaharan African (%)
Ancestries Reported - Swedish (%)
Ancestries Reported - Swiss (%)
Ancestries Reported - Ukrainian (%)
Ancestries Reported - United States (%)
Ancestries Reported - Welsh (%)
Ancestries Reported - West Indian (%)
Ancestries Reported - Other (%)
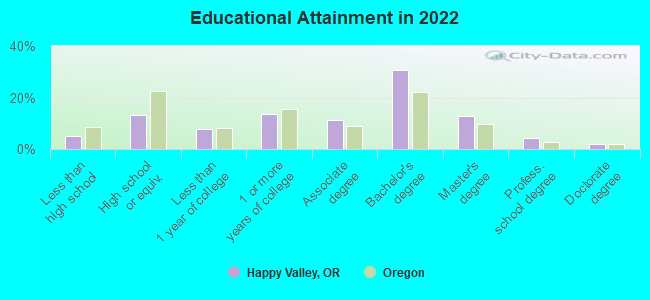
Educational Attainment - No schooling completed (%)
Educational Attainment - Less than high school (%)
Educational Attainment - High school or equivalent (%)
Educational Attainment - Less than 1 year of college (%)
Educational Attainment - 1 or more years of college (%)
Educational Attainment - Associate degree (%)
Educational Attainment - Bachelor's degree (%)
Educational Attainment - Master's degree (%)
Educational Attainment - Professional school degree (%)
Educational Attainment - Doctorate degree (%)
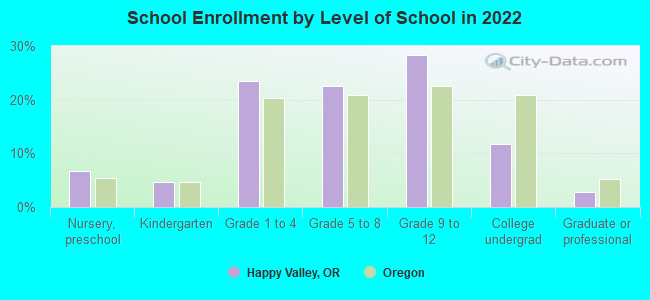
School Enrollment - Nursery, preschool (%)
School Enrollment - Kindergarten (%)
School Enrollment - Grade 1 to 4 (%)
School Enrollment - Grade 5 to 8 (%)
School Enrollment - Grade 9 to 12 (%)
School Enrollment - College undergrad (%)
School Enrollment - Graduate or professional (%)
School Enrollment - Not enrolled in school (%)
School enrollment - Public schools (%)
School enrollment - Private schools (%)
School enrollment - Not enrolled (%)
Median number of rooms in houses and condos
Median number of rooms in apartments
Housing units lacking complete plumbing facilities (%)
Housing units lacking complete kitchen facilities (%)
Density of houses
Urban houses (%)
Rural houses (%)
Households with people 60 years and over (%)
Households with people 65 years and over (%)
Households with people 75 years and over (%)
Households with one or more nonrelatives (%)
Households with no nonrelatives (%)
Population in households (%)
Family households (%)
Nonfamily households (%)
Population in families (%)
Family households with own children (%)
Median number of bedrooms in owner occupied houses
Mean number of bedrooms in owner occupied houses
Median number of bedrooms in renter occupied houses
Mean number of bedrooms in renter occupied houses
Median number of vehichles in owner occupied houses
Mean number of vehichles in owner occupied houses
Median number of vehichles in renter occupied houses
Mean number of vehichles in renter occupied houses
Mortgage status - with mortgage (%)
Mortgage status - with second mortgage (%)
Mortgage status - with home equity loan (%)
Mortgage status - with both second mortgage and home equity loan (%)
Mortgage status - without a mortgage (%)
Average family size
Average family size - White
Average family size - Black or African American
Average family size - Asian
Average family size - Hispanic or Latino
Average family size - American Indian and Alaska Native
Average family size - Multirace
Average family size - Other Race
Geographical mobility - Same house 1 year ago (%)
Geographical mobility - Moved within same county (%)
Geographical mobility - Moved from different county within same state (%)
Geographical mobility - Moved from different state (%)
Geographical mobility - Moved from abroad (%)
Place of birth - Born in state of residence (%)
Place of birth - Born in other state (%)
Place of birth - Native, outside of US (%)
Place of birth - Foreign born (%)
Housing units in structures - 1, detached (%)
Housing units in structures - 1, attached (%)
Housing units in structures - 2 (%)
Housing units in structures - 3 or 4 (%)
Housing units in structures - 5 to 9 (%)
Housing units in structures - 10 to 19 (%)
Housing units in structures - 20 to 49 (%)
Housing units in structures - 50 or more (%)
Housing units in structures - Mobile home (%)
Housing units in structures - Boat, RV, van, etc. (%)
House/condo owner moved in on average (years ago)
Renter moved in on average (years ago)
Year householder moved into unit - Moved in 1999 to March 2000 (%)
Year householder moved into unit - Moved in 1995 to 1998 (%)
Year householder moved into unit - Moved in 1990 to 1994 (%)
Year householder moved into unit - Moved in 1980 to 1989 (%)
Year householder moved into unit - Moved in 1970 to 1979 (%)
Year householder moved into unit - Moved in 1969 or earlier (%)
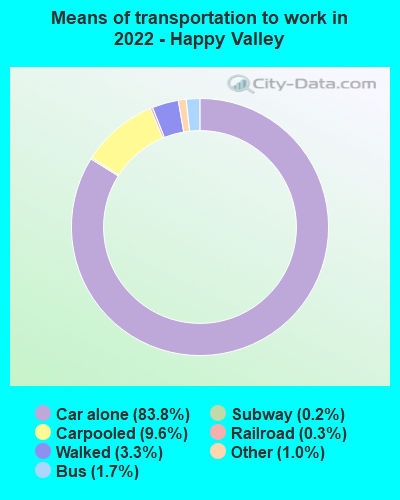
Means of transportation to work - Drove car alone (%)
Means of transportation to work - Carpooled (%)
Means of transportation to work - Public transportation (%)
Means of transportation to work - Bus or trolley bus (%)
Means of transportation to work - Streetcar or trolley car (%)
Means of transportation to work - Subway or elevated (%)
Means of transportation to work - Railroad (%)
Means of transportation to work - Ferryboat (%)
Means of transportation to work - Taxicab (%)
Means of transportation to work - Motorcycle (%)
Means of transportation to work - Bicycle (%)
Means of transportation to work - Walked (%)
Means of transportation to work - Other means (%)
Working at home (%)
Industry diversity
Most Common Industries - Agriculture, forestry, fishing and hunting, and mining (%)
Most Common Industries - Agriculture, forestry, fishing and hunting (%)
Most Common Industries - Mining, quarrying, and oil and gas extraction (%)
Most Common Industries - Construction (%)
Most Common Industries - Manufacturing (%)
Most Common Industries - Wholesale trade (%)
Most Common Industries - Retail trade (%)
Most Common Industries - Transportation and warehousing, and utilities (%)
Most Common Industries - Transportation and warehousing (%)
Most Common Industries - Utilities (%)
Most Common Industries - Information (%)
Most Common Industries - Finance and insurance, and real estate and rental and leasing (%)
Most Common Industries - Finance and insurance (%)
Most Common Industries - Real estate and rental and leasing (%)
Most Common Industries - Professional, scientific, and management, and administrative and waste management services (%)
Most Common Industries - Professional, scientific, and technical services (%)
Most Common Industries - Management of companies and enterprises (%)
Most Common Industries - Administrative and support and waste management services (%)
Most Common Industries - Educational services, and health care and social assistance (%)
Most Common Industries - Educational services (%)
Most Common Industries - Health care and social assistance (%)
Most Common Industries - Arts, entertainment, and recreation, and accommodation and food services (%)
Most Common Industries - Arts, entertainment, and recreation (%)
Most Common Industries - Accommodation and food services (%)
Most Common Industries - Other services, except public administration (%)
Most Common Industries - Public administration (%)
Occupation diversity
Most Common Occupations - Management, business, science, and arts occupations (%)
Most Common Occupations - Management, business, and financial occupations (%)
Most Common Occupations - Management occupations (%)
Most Common Occupations - Business and financial operations occupations (%)
Most Common Occupations - Computer, engineering, and science occupations (%)
Most Common Occupations - Computer and mathematical occupations (%)
Most Common Occupations - Architecture and engineering occupations (%)
Most Common Occupations - Life, physical, and social science occupations (%)
Most Common Occupations - Education, legal, community service, arts, and media occupations (%)
Most Common Occupations - Community and social service occupations (%)
Most Common Occupations - Legal occupations (%)
Most Common Occupations - Education, training, and library occupations (%)
Most Common Occupations - Arts, design, entertainment, sports, and media occupations (%)
Most Common Occupations - Healthcare practitioners and technical occupations (%)
Most Common Occupations - Health diagnosing and treating practitioners and other technical occupations (%)
Most Common Occupations - Health technologists and technicians (%)
Most Common Occupations - Service occupations (%)
Most Common Occupations - Healthcare support occupations (%)
Most Common Occupations - Protective service occupations (%)
Most Common Occupations - Fire fighting and prevention, and other protective service workers including supervisors (%)
Most Common Occupations - Law enforcement workers including supervisors (%)
Most Common Occupations - Food preparation and serving related occupations (%)
Most Common Occupations - Building and grounds cleaning and maintenance occupations (%)
Most Common Occupations - Personal care and service occupations (%)
Most Common Occupations - Sales and office occupations (%)
Most Common Occupations - Sales and related occupations (%)
Most Common Occupations - Office and administrative support occupations (%)
Most Common Occupations - Natural resources, construction, and maintenance occupations (%)
Most Common Occupations - Farming, fishing, and forestry occupations (%)
Most Common Occupations - Construction and extraction occupations (%)
Most Common Occupations - Installation, maintenance, and repair occupations (%)
Most Common Occupations - Production, transportation, and material moving occupations (%)
Most Common Occupations - Production occupations (%)
Most Common Occupations - Transportation occupations (%)
Most Common Occupations - Material moving occupations (%)
People in Group quarters - Institutionalized population (%)
People in Group quarters - Correctional institutions (%)
People in Group quarters - Federal prisons and detention centers (%)
People in Group quarters - Halfway houses (%)
People in Group quarters - Local jails and other confinement facilities (including police lockups) (%)
People in Group quarters - Military disciplinary barracks (%)
People in Group quarters - State prisons (%)
People in Group quarters - Other types of correctional institutions (%)
People in Group quarters - Nursing homes (%)
People in Group quarters - Hospitals/wards, hospices, and schools for the handicapped (%)
People in Group quarters - Hospitals/wards and hospices for chronically ill (%)
People in Group quarters - Hospices or homes for chronically ill (%)
People in Group quarters - Military hospitals or wards for chronically ill (%)
People in Group quarters - Other hospitals or wards for chronically ill (%)
People in Group quarters - Hospitals or wards for drug/alcohol abuse (%)
People in Group quarters - Mental (Psychiatric) hospitals or wards (%)
People in Group quarters - Schools, hospitals, or wards for the mentally retarded (%)
People in Group quarters - Schools, hospitals, or wards for the physically handicapped (%)
People in Group quarters - Institutions for the deaf (%)
People in Group quarters - Institutions for the blind (%)
People in Group quarters - Orthopedic wards and institutions for the physically handicapped (%)
People in Group quarters - Wards in general hospitals for patients who have no usual home elsewhere (%)
People in Group quarters - Wards in military hospitals for patients who have no usual home elsewhere (%)
People in Group quarters - Juvenile institutions (%)
People in Group quarters - Long-term care (%)
People in Group quarters - Homes for abused, dependent, and neglected children (%)
People in Group quarters - Residential treatment centers for emotionally disturbed children (%)
People in Group quarters - Training schools for juvenile delinquents (%)
People in Group quarters - Short-term care, detention or diagnostic centers for delinquent children (%)
People in Group quarters - Type of juvenile institution unknown (%)
People in Group quarters - Noninstitutionalized population (%)
People in Group quarters - College dormitories (includes college quarters off campus) (%)
People in Group quarters - Military quarters (%)
People in Group quarters - On base (%)
People in Group quarters - Barracks, unaccompanied personnel housing (UPH), (Enlisted/Officer), ;and similar group living quarters for military personnel (%)
People in Group quarters - Transient quarters for temporary residents (%)
People in Group quarters - Military ships (%)
People in Group quarters - Group homes (%)
People in Group quarters - Homes or halfway houses for drug/alcohol abuse (%)
People in Group quarters - Homes for the mentally ill (%)
People in Group quarters - Homes for the mentally retarded (%)
People in Group quarters - Homes for the physically handicapped (%)
People in Group quarters - Other group homes (%)
People in Group quarters - Religious group quarters (%)
People in Group quarters - Dormitories (%)
People in Group quarters - Agriculture workers' dormitories on farms (%)
People in Group quarters - Job Corps and vocational training facilities (%)
People in Group quarters - Other workers' dormitories (%)
People in Group quarters - Crews of maritime vessels (%)
People in Group quarters - Other nonhousehold living situations (%)
People in Group quarters - Other noninstitutional group quarters (%)
Residents speaking English at home (%)
Residents speaking English at home - Born in the United States (%)
Residents speaking English at home - Native, born elsewhere (%)
Residents speaking English at home - Foreign born (%)
Residents speaking Spanish at home (%)
Residents speaking Spanish at home - Born in the United States (%)
Residents speaking Spanish at home - Native, born elsewhere (%)
Residents speaking Spanish at home - Foreign born (%)
Residents speaking other language at home (%)
Residents speaking other language at home - Born in the United States (%)
Residents speaking other language at home - Native, born elsewhere (%)
Residents speaking other language at home - Foreign born (%)
Class of Workers - Employee of private company (%)
Class of Workers - Self-employed in own incorporated business (%)
Class of Workers - Private not-for-profit wage and salary workers (%)
Class of Workers - Local government workers (%)
Class of Workers - State government workers (%)
Class of Workers - Federal government workers (%)
Class of Workers - Self-employed workers in own not incorporated business and Unpaid family workers (%)
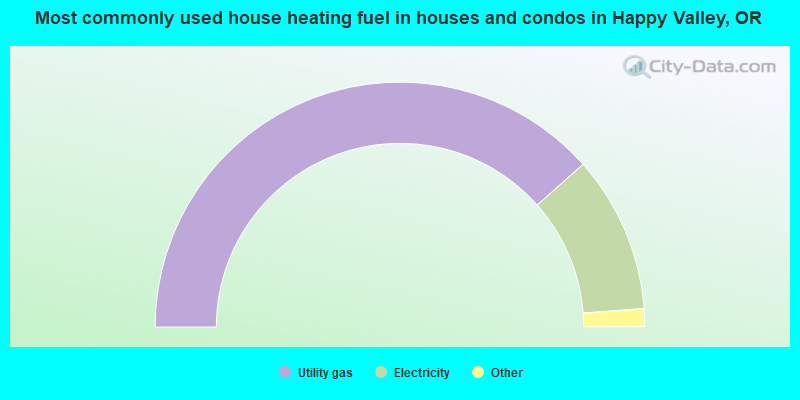
House heating fuel used in houses and condos - Utility gas (%)
House heating fuel used in houses and condos - Bottled, tank, or LP gas (%)
House heating fuel used in houses and condos - Electricity (%)
House heating fuel used in houses and condos - Fuel oil, kerosene, etc. (%)
House heating fuel used in houses and condos - Coal or coke (%)
House heating fuel used in houses and condos - Wood (%)
House heating fuel used in houses and condos - Solar energy (%)
House heating fuel used in houses and condos - Other fuel (%)
House heating fuel used in houses and condos - No fuel used (%)
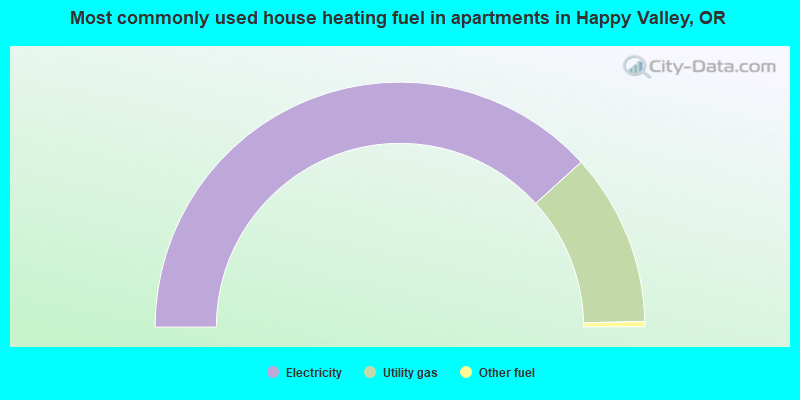
House heating fuel used in apartments - Utility gas (%)
House heating fuel used in apartments - Bottled, tank, or LP gas (%)
House heating fuel used in apartments - Electricity (%)
House heating fuel used in apartments - Fuel oil, kerosene, etc. (%)
House heating fuel used in apartments - Coal or coke (%)
House heating fuel used in apartments - Wood (%)
House heating fuel used in apartments - Solar energy (%)
House heating fuel used in apartments - Other fuel (%)
House heating fuel used in apartments - No fuel used (%)
Armed forces status - In Armed Forces (%)
Armed forces status - Civilian (%)
Armed forces status - Civilian - Veteran (%)
Armed forces status - Civilian - Nonveteran (%)
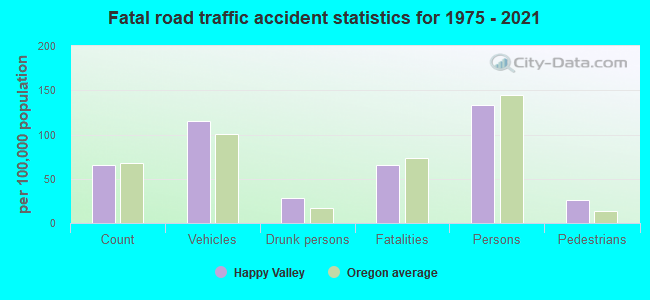
Fatal accidents locations in years 2005-2021
Fatal accidents locations in 2005
Fatal accidents locations in 2006
Fatal accidents locations in 2007
Fatal accidents locations in 2008
Fatal accidents locations in 2009
Fatal accidents locations in 2010
Fatal accidents locations in 2011
Fatal accidents locations in 2012
Fatal accidents locations in 2013
Fatal accidents locations in 2014
Fatal accidents locations in 2015
Fatal accidents locations in 2016
Fatal accidents locations in 2017
Fatal accidents locations in 2018
Fatal accidents locations in 2019
Fatal accidents locations in 2020
Fatal accidents locations in 2021
Alcohol use - People drinking some alcohol every month (%)
Alcohol use - People not drinking at all (%)
Alcohol use - Average days/month drinking alcohol
Alcohol use - Average drinks/week
Alcohol use - Average days/year people drink much
Audiometry - Average condition of hearing (%)
Audiometry - People that can hear a whisper from across a quiet room (%)
Audiometry - People that can hear normal voice from across a quiet room (%)
Audiometry - Ears ringing, roaring, buzzing (%)
Audiometry - Had a job exposure to loud noise (%)
Audiometry - Had off-work exposure to loud noise (%)
Blood Pressure & Cholesterol - Has high blood pressure (%)
Blood Pressure & Cholesterol - Checking blood pressure at home (%)
Blood Pressure & Cholesterol - Frequently checking blood cholesterol (%)
Blood Pressure & Cholesterol - Has high cholesterol level (%)
Consumer Behavior - Money monthly spent on food at supermarket/grocery store
Consumer Behavior - Money monthly spent on food at other stores
Consumer Behavior - Money monthly spent on eating out
Consumer Behavior - Money monthly spent on carryout/delivered foods
Consumer Behavior - Income spent on food at supermarket/grocery store (%)
Consumer Behavior - Income spent on food at other stores (%)
Consumer Behavior - Income spent on eating out (%)
Consumer Behavior - Income spent on carryout/delivered foods (%)
Current Health Status - General health condition (%)
Current Health Status - Blood donors (%)
Current Health Status - Has blood ever tested for HIV virus (%)
Current Health Status - Left-handed people (%)
Dermatology - People using sunscreen (%)
Diabetes - Diabetics (%)
Diabetes - Had a blood test for high blood sugar (%)
Diabetes - People taking insulin (%)
Diet Behavior & Nutrition - Diet health (%)
Diet Behavior & Nutrition - Milk product consumption (# of products/month)
Diet Behavior & Nutrition - Meals not home prepared (#/week)
Diet Behavior & Nutrition - Meals from fast food or pizza place (#/week)
Diet Behavior & Nutrition - Ready-to-eat foods (#/month)
Diet Behavior & Nutrition - Frozen meals/pizza (#/month)
Drug Use - People that ever used marijuana or hashish (%)
Drug Use - Ever used hard drugs (%)
Drug Use - Ever used any form of cocaine (%)
Drug Use - Ever used heroin (%)
Drug Use - Ever used methamphetamine (%)
Health Insurance - People covered by health insurance (%)
Kidney Conditions-Urology - Avg. # of times urinating at night
Medical Conditions - People with asthma (%)
Medical Conditions - People with anemia (%)
Medical Conditions - People with psoriasis (%)
Medical Conditions - People with overweight (%)
Medical Conditions - Elderly people having difficulties in thinking or remembering (%)
Medical Conditions - People who ever received blood transfusion (%)
Medical Conditions - People having trouble seeing even with glass/contacts (%)
Medical Conditions - People with arthritis (%)
Medical Conditions - People with gout (%)
Medical Conditions - People with congestive heart failure (%)
Medical Conditions - People with coronary heart disease (%)
Medical Conditions - People with angina pectoris (%)
Medical Conditions - People who ever had heart attack (%)
Medical Conditions - People who ever had stroke (%)
Medical Conditions - People with emphysema (%)
Medical Conditions - People with thyroid problem (%)
Medical Conditions - People with chronic bronchitis (%)
Medical Conditions - People with any liver condition (%)
Medical Conditions - People who ever had cancer or malignancy (%)
Mental Health - People who have little interest in doing things (%)
Mental Health - People feeling down, depressed, or hopeless (%)
Mental Health - People who have trouble sleeping or sleeping too much (%)
Mental Health - People feeling tired or having little energy (%)
Mental Health - People with poor appetite or overeating (%)
Mental Health - People feeling bad about themself (%)
Mental Health - People who have trouble concentrating on things (%)
Mental Health - People moving or speaking slowly or too fast (%)
Mental Health - People having thoughts they would be better off dead (%)
Oral Health - Average years since last visit a dentist
Oral Health - People embarrassed because of mouth (%)
Oral Health - People with gum disease (%)
Oral Health - General health of teeth and gums (%)
Oral Health - Average days a week using dental floss/device
Oral Health - Average days a week using mouthwash for dental problem
Oral Health - Average number of teeth
Pesticide Use - Households using pesticides to control insects (%)
Pesticide Use - Households using pesticides to kill weeds (%)
Physical Activity - People doing vigorous-intensity work activities (%)
Physical Activity - People doing moderate-intensity work activities (%)
Physical Activity - People walking or bicycling (%)
Physical Activity - People doing vigorous-intensity recreational activities (%)
Physical Activity - People doing moderate-intensity recreational activities (%)
Physical Activity - Average hours a day doing sedentary activities
Physical Activity - Average hours a day watching TV or videos
Physical Activity - Average hours a day using computer
Physical Functioning - People having limitations keeping them from working (%)
Physical Functioning - People limited in amount of work they can do (%)
Physical Functioning - People that need special equipment to walk (%)
Physical Functioning - People experiencing confusion/memory problems (%)
Physical Functioning - People requiring special healthcare equipment (%)
Prescription Medications - Average number of prescription medicines taking
Preventive Aspirin Use - Adults 40+ taking low-dose aspirin (%)
Reproductive Health - Vaginal deliveries (%)
Reproductive Health - Cesarean deliveries (%)
Reproductive Health - Deliveries resulted in a live birth (%)
Reproductive Health - Pregnancies resulted in a delivery (%)
Reproductive Health - Women breastfeeding newborns (%)
Reproductive Health - Women that had a hysterectomy (%)
Reproductive Health - Women that had both ovaries removed (%)
Reproductive Health - Women that have ever taken birth control pills (%)
Reproductive Health - Women taking birth control pills (%)
Reproductive Health - Women that have ever used Depo-Provera or injectables (%)
Reproductive Health - Women that have ever used female hormones (%)
Sexual Behavior - People 18+ that ever had sex (vaginal, anal, or oral) (%)
Sexual Behavior - Males 18+ that ever had vaginal sex with a woman (%)
Sexual Behavior - Males 18+ that ever performed oral sex on a woman (%)
Sexual Behavior - Males 18+ that ever had anal sex with a woman (%)
Sexual Behavior - Males 18+ that ever had any sex with a man (%)
Sexual Behavior - Females 18+ that ever had vaginal sex with a man (%)
Sexual Behavior - Females 18+ that ever performed oral sex on a man (%)
Sexual Behavior - Females 18+ that ever had anal sex with a man (%)
Sexual Behavior - Females 18+ that ever had any kind of sex with a woman (%)
Sexual Behavior - Average age people first had sex
Sexual Behavior - Average number of female sex partners in lifetime (males 18+)
Sexual Behavior - Average number of female vaginal sex partners in lifetime (males 18+)
Sexual Behavior - Average age people first performed oral sex on a woman (18+)
Sexual Behavior - Average number of woman performed oral sex on in lifetime (18+)
Sexual Behavior - Average number of male sex partners in lifetime (males 18+)
Sexual Behavior - Average number of male anal sex partners in lifetime (males 18+)
Sexual Behavior - Average age people first performed oral sex on a man (18+)
Sexual Behavior - Average number of male oral sex partners in lifetime (18+)
Sexual Behavior - People using protection when performing oral sex (%)
Sexual Behavior - Average number of times people have vaginal or anal sex a year
Sexual Behavior - People having sex without condom (%)
Sexual Behavior - Average number of male sex partners in lifetime (females 18+)
Sexual Behavior - Average number of male vaginal sex partners in lifetime (females 18+)
Sexual Behavior - Average number of female sex partners in lifetime (females 18+)
Sexual Behavior - Circumcised males 18+ (%)
Sleep Disorders - Average hours sleeping at night
Sleep Disorders - People that has trouble sleeping (%)
Smoking-Cigarette Use - People smoking cigarettes (%)
Taste & Smell - People 40+ having problems with smell (%)
Taste & Smell - People 40+ having problems with taste (%)
Taste & Smell - People 40+ that ever had wisdom teeth removed (%)
Taste & Smell - People 40+ that ever had tonsils teeth removed (%)
Taste & Smell - People 40+ that ever had a loss of consciousness because of a head injury (%)
Taste & Smell - People 40+ that ever had a broken nose or other serious injury to face or skull (%)
Taste & Smell - People 40+ that ever had two or more sinus infections (%)
Weight - Average height (inches)
Weight - Average weight (pounds)
Weight - Average BMI
Weight - People that are obese (%)
Weight - People that ever were obese (%)
Weight - People trying to lose weight (%)
According to our research of Oregon and other state lists, there were 3 registered sex offenders living in Happy Valley, Oregon as of April 27, 2024 . The ratio of all residents to sex offenders in Happy Valley is 6,018 to 1.The ratio of registered sex offenders to all residents in this city is much lower than the state average.
Latest news from Happy Valley, OR collected exclusively by city-data.com from local newspapers, TV, and radio stations
Ancestries: German (9.9%), European (8.2%), English (7.1%), Irish (6.2%), American (5.4%), Norwegian (3.1%).
Current Local Time:
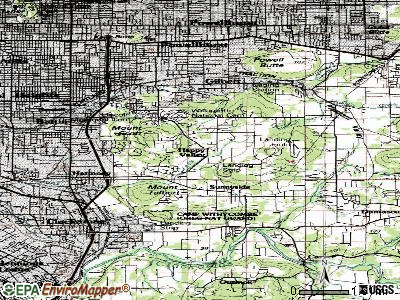
Land area: 2.70 square miles.
Population density: 9,801 people per square mile (high).
3,881 residents are foreign born (11.6% Asia , 1.9% Latin America , 1.8% Europe ).
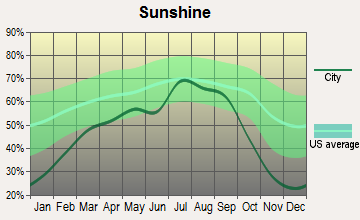
This city:
15.8%Oregon:
9.8%
Median real estate property taxes paid for housing units with mortgages in 2022: $7,059 (1.0%)Median real estate property taxes paid for housing units with no mortgage in 2022: $6,776 (1.0%)
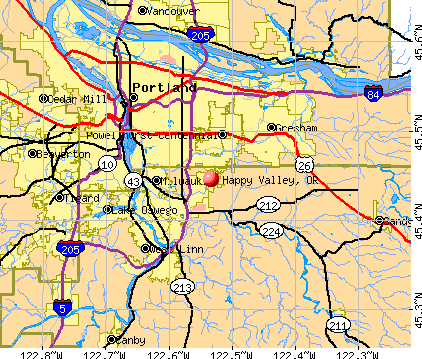
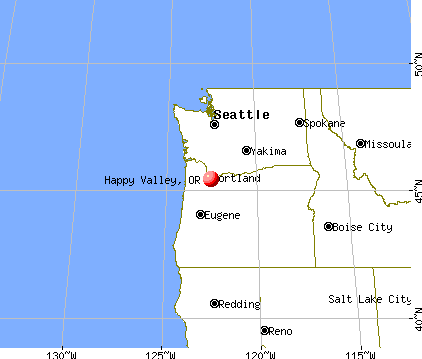
Nearest city with pop. 50,000+: Northwest Clackamas, OR (5.4 miles
Nearest city with pop. 1,000,000+: Los Angeles, CA
Nearest cities:
Latitude: 45.45 N, Longitude: 122.53 W
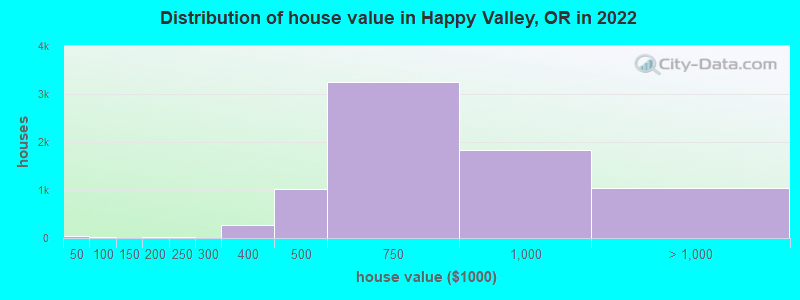
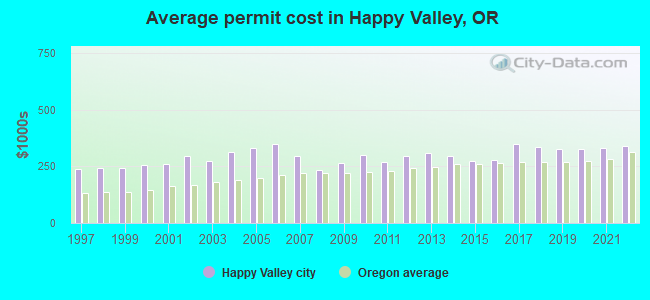
Property values in Happy Valley, OR
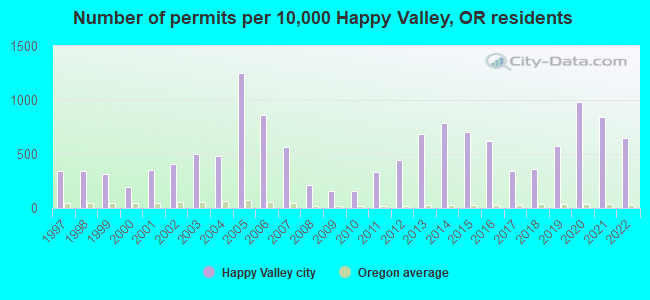
Single-family new house construction building permits:
2022: 292 buildings , average cost: $342,0002021: 381 buildings , average cost: $330,9002020: 443 buildings , average cost: $326,4002019: 259 buildings , average cost: $328,7002018: 163 buildings , average cost: $335,4002017: 154 buildings , average cost: $347,8002016: 281 buildings , average cost: $279,5002015: 317 buildings , average cost: $275,4002014: 354 buildings , average cost: $298,3002013: 309 buildings , average cost: $310,5002012: 200 buildings , average cost: $294,5002011: 151 buildings , average cost: $271,1002010: 71 buildings , average cost: $301,3002009: 70 buildings , average cost: $266,6002008: 95 buildings , average cost: $234,1002007: 256 buildings , average cost: $297,7002006: 388 buildings , average cost: $348,8002005: 566 buildings , average cost: $330,9002004: 216 buildings , average cost: $316,3002003: 224 buildings , average cost: $275,2002002: 184 buildings , average cost: $294,8002001: 159 buildings , average cost: $261,9002000: 87 buildings , average cost: $255,7001999: 141 buildings , average cost: $243,5001998: 153 buildings , average cost: $244,0001997: 153 buildings , average cost: $239,100Unemployment in December 2023:
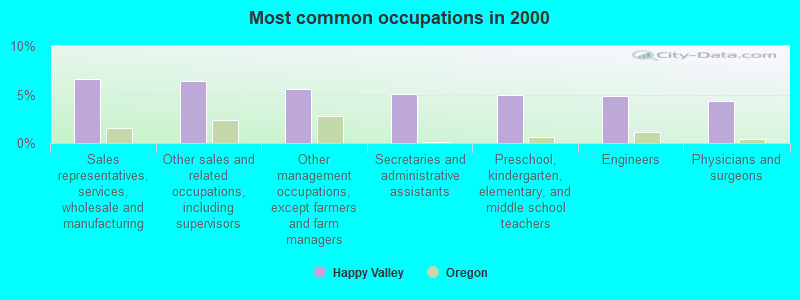
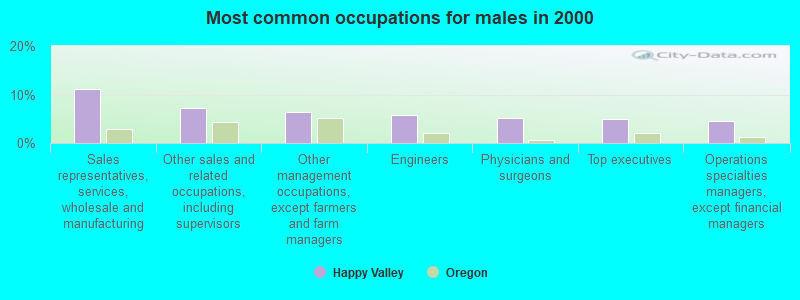
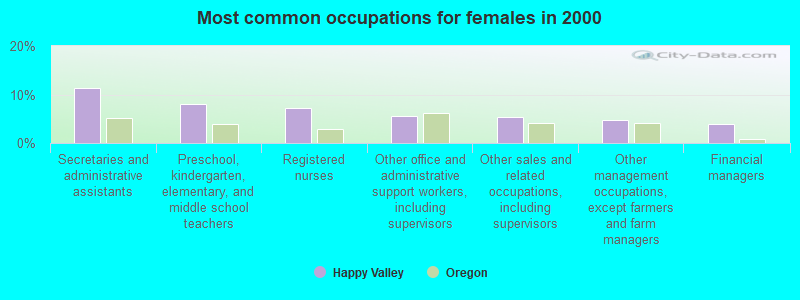
Most common occupations in Happy Valley, OR (%)
Both Males Females
Sales representatives, services, wholesale and manufacturing (6.6%)
Other sales and related occupations, including supervisors (6.4%)
Other management occupations, except farmers and farm managers (5.6%)
Secretaries and administrative assistants (5.0%)
Preschool, kindergarten, elementary, and middle school teachers (4.9%)
Engineers (4.9%)
Physicians and surgeons (4.3%)
Sales representatives, services, wholesale and manufacturing (11.2%)
Other sales and related occupations, including supervisors (7.2%)
Other management occupations, except farmers and farm managers (6.4%)
Engineers (5.8%)
Physicians and surgeons (5.1%)
Top executives (5.0%)
Operations specialties managers, except financial managers (4.6%)
Secretaries and administrative assistants (11.3%)
Preschool, kindergarten, elementary, and middle school teachers (8.0%)
Registered nurses (7.2%)
Other office and administrative support workers, including supervisors (5.5%)
Other sales and related occupations, including supervisors (5.3%)
Other management occupations, except farmers and farm managers (4.6%)
Financial managers (3.9%)
Earthquake activity:
Happy Valley-area historical earthquake activity is significantly above Oregon state average. It is 1478% greater than the overall U.S. average. On 4/13/1949 at 19:55:42, a magnitude 7.0 (7.0 UK, Class: Major, Intensity: VIII - XII) earthquake occurred 124.8 miles away from the city center, causing $80,000,000 total damage On 2/28/2001 at 18:54:32, a magnitude 6.8 (6.5 MB, 6.6 MS, 6.8 MW, Class: Strong, Intensity: VII - IX) earthquake occurred 113.7 miles away from Happy Valley center, causing $2,000,000,000 total damage and $305,000,000 insured lossesOn 2/28/2001 at 18:54:32, a magnitude 6.8 (6.8 MD, Depth: 32.2 mi) earthquake occurred 118.2 miles away from the city center On 4/29/1965 at 15:28:43, a magnitude 6.6 (6.6 UK) earthquake occurred 129.8 miles away from the city center, causing $28,000,000 total damage On 1/31/1922 at 13:17:28, a magnitude 7.6 (7.6 UK) earthquake occurred 361.9 miles away from Happy Valley center On 11/8/1980 at 10:27:34, a magnitude 7.2 (6.2 MB, 7.2 MS, 7.2 MW, 7.0 ML) earthquake occurred 312.8 miles away from the city center Magnitude types: body-wave magnitude (MB), duration magnitude (MD), local magnitude (ML), surface-wave magnitude (MS), moment magnitude (MW) Natural disasters: The number of natural disasters in Clackamas County (13) is near the US average (15).Major Disasters (Presidential) Declared: 11Emergencies Declared: 1Floods: 7, Landslides: 4, Mudslides: 4, Storms: 4, Winter Storms: 4, Snows: 2, Winds: 2, Earthquake: 1, Fire: 1, Heavy Rain: 1, Hurricane: 1, Other: 1 (Note: some incidents may be assigned to more than one category). Hospitals and medical centers in Happy Valley: TOWN CENTER VILLAGE (8607 SE CAUSEY AVENUE)
Other hospitals and medical centers near Happy Valley: CARE VISTA (Nursing Home, about 2 miles away; PORTLAND, OR)
KAISER SUNNYSIDE MEDICAL CENTER (about 2 miles away; CLACKAMAS, OR)
PNRS CLACKAMAS KIDNEY CENTER (Dialysis Facility, about 3 miles away; CLACKAMAS, OR)
HEALTHCARE AT FOSTER CREEK (Nursing Home, about 3 miles away; PORTLAND, OR)
CASCADE TERRACE (Nursing Home, about 3 miles away; PORTLAND, OR)
EAST PORTLAND SURGERY CENTER (Hospital, about 3 miles away; PORTLAND, OR)
MARQUIS CARE AT POWELLHURST (Nursing Home, about 4 miles away; PORTLAND, OR)
Airports located in Happy Valley: Amtrak stations near Happy Valley: 7 miles: OREGON CITY (1757 WASHINGTON ST.) 9 miles: PORTLAND (800 NW 6TH AVE.) Services: ticket office, fully wheelchair accessible, enclosed waiting area, public restrooms, public payphones, full-service food facilities, paid short-term parking, paid long-term parking, call for car rental service, taxi stand, intercity bus service, public transit connection.
15 miles: VANCOUVER (FOOT OF W. 11TH ST.) Services: ticket office, fully wheelchair accessible, enclosed waiting area, public restrooms, public payphones, vending machines, free short-term parking, free long-term parking, call for taxi service.
College/University in Happy Valley: Phagans School of Hair Design Full-time enrollment: 177; Location: 12000 SE 82nd Avenue K217; Private, for-profit; Website: www.phagans.com)
Colleges/universities with over 2000 students nearest to Happy Valley:
Lewis & Clark College (about 7 miles; Portland, OR ; Full-time enrollment: 2,864)
Mt Hood Community College (about 9 miles; Gresham, OR ; FT enrollment: 11,847)
Portland State University (about 9 miles; Portland, OR ; FT enrollment: 21,450)
Clackamas Community College (about 9 miles; Oregon City, OR ; FT enrollment: 4,261)
Portland Community College (about 10 miles; Portland, OR ; FT enrollment: 23,600)
Concordia University-Portland (about 10 miles; Portland, OR ; FT enrollment: 3,996)
University of Portland (about 13 miles; Portland, OR ; FT enrollment: 4,030)
Public high school in Happy Valley:
Public elementary/middle schools in Happy Valley: HAPPY VALLEY ELEMENTARY SCHOOL Students: 902, Location: 13865 SE KING RD, Grades: KG-5)ROCK CREEK MIDDLE SCHOOL Students: 565, Location: 14897 SE PARKLANE DR, Grades: 6-8)SPRING MOUNTAIN ELEMENTARY SCHOOL Students: 550, Location: 11645 SE MASA LN, Grades: KG-5)MOUNT SCOTT ELEMENTARY SCHOOL Students: 474, Location: 11201 SE STEVENS RD, Grades: KG-5)SCOUTERS MOUNTAIN ELEMENTARY Location: 10811 SE 172ND AVE, Grades: KG-5)
VERNE A DUNCAN ELEMENTARY SCHOOL Location: 14898 SE PARKLANE DR, Grades: KG-5)
HAPPY VALLEY MIDDLE SCHOOL Location: 13865 SE KING RD, Grades: 6-8)
See full list of schools located in Happy Valley Clackamas County has a predicted average indoor radon screening level less than 2 pCi/L (pico curies per liter) - Low Potential Average household size: This city:
3.1 peopleOregon:
2.5 people
Percentage of family households: This city:
84.5%Whole state:
63.4%
Percentage of households with unmarried partners: This city:
4.3%Whole state:
8.0%
Likely homosexual households (counted as self-reported same-sex unmarried-partner households)
Lesbian couples: 0.2% of all households Gay men: 0.5% of all households
People in group quarters in Happy Valley in 2010:
15 people in workers' group living quarters and job corps centers
11 people in group homes intended for adults
3 people in nursing facilities/skilled-nursing facilities
Banks with branches in Happy Valley (2011 data):
U.S. Bank National Association: Clackamas Town Center Mall Branch at 12000 Southeast 82nd Ave, Suite 2001, branch established on 2002/07/01; 82nd And Causey Branch at 11333 Southeast 82nd Avenue, branch established on 1990/11/13. Info updated 2012/01/30: Bank assets: $330,470.8 mil, Deposits: $236,091.5 mil, headquarters in Cincinnati, OH, positive income , 3121 total offices , Holding Company: U.S. Bancorp
Umpqua Bank: Town Center Village Retirement Branc at 8611 Se Causey Avenue, branch established on 1997/07/28. Info updated 2011/09/02: Bank assets: $11,556.7 mil, Deposits: $9,325.3 mil, headquarters in Roseburg, OR, positive income , Commercial Lending Specialization, 193 total offices , Holding Company: Umpqua Holdings Corporation
West Coast Bank: Happy Valley Branch at 15820 Se Happy Valley Town Center Dr, branch established on 2008/03/24. Info updated 2010/09/16: Bank assets: $2,424.8 mil, Deposits: $1,925.6 mil, headquarters in Lake Oswego, OR, positive income , Commercial Lending Specialization, 63 total offices , Holding Company: West Coast Bancorp
JPMorgan Chase Bank, National Association: Otty Road Branch at 9980 Se 82nd Ave, branch established on 2008/09/25. Info updated 2011/11/10: Bank assets: $1,811,678.0 mil, Deposits: $1,190,738.0 mil, headquarters in Columbus, OH, positive income , International Specialization, 5577 total offices , Holding Company: Jpmorgan Chase & Co.
Columbia State Bank: 82nd Avenue Branch at 10413 S.E. 82nd Avenue, branch established on 1997/07/21. Info updated 2011/08/09: Bank assets: $4,785.2 mil, Deposits: $3,892.8 mil, headquarters in Tacoma, WA, positive income , Commercial Lending Specialization, 104 total offices , Holding Company: Columbia Banking System, Inc.
Bank of America, National Association: 82nd & Johnson Creek Branch at 9171 Se 82nd Ave, branch established on 2004/10/25. Info updated 2009/11/18: Bank assets: $1,451,969.3 mil, Deposits: $1,077,176.8 mil, headquarters in Charlotte, NC, positive income , 5782 total offices , Holding Company: Bank Of America Corporation
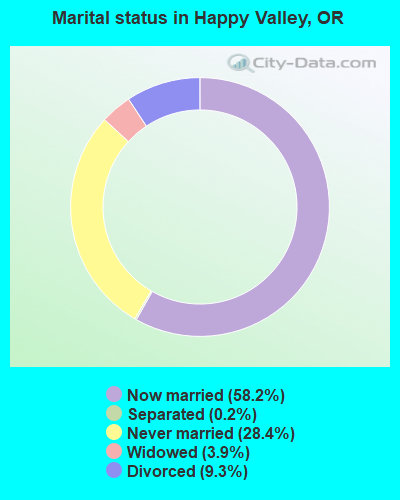
For population 15 years and over in Happy Valley:
Never married: 28.4%Now married: 58.2%Separated: 0.2%Widowed: 3.9%Divorced: 9.3% For population 25 years and over in Happy Valley:
High school or higher: 95.3%Bachelor's degree or higher: 48.6%Graduate or professional degree: 18.3%Unemployed: 2.4%Mean travel time to work (commute): 20.5 minutes
Education Gini index (Inequality in education) Here:
10.2Oregon average:
11.6
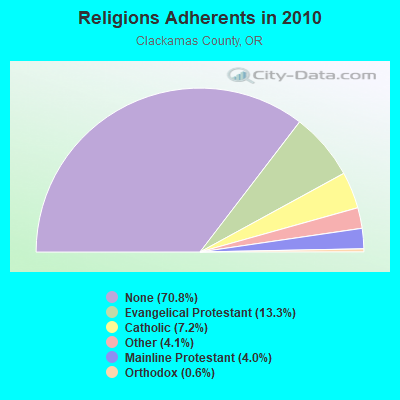
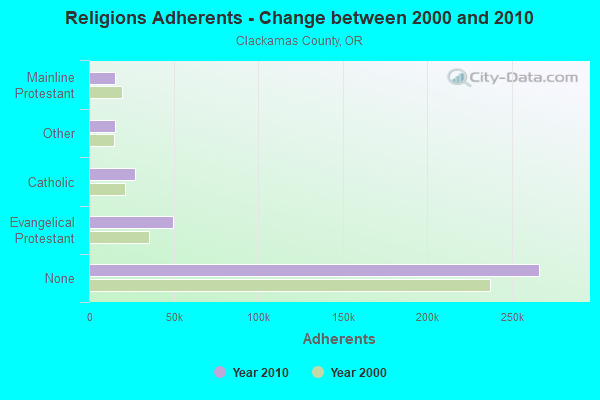
Religion statistics for Happy Valley, OR (based on Clackamas County data)
Religion Adherents Congregations Evangelical Protestant 49,829 194 Catholic 27,128 13 Other 15,447 51 Mainline Protestant 15,118 49 Orthodox 2,275 5 None 266,195 -
Source: Clifford Grammich, Kirk Hadaway, Richard Houseal, Dale E.Jones, Alexei Krindatch, Richie Stanley and Richard H.Taylor. 2012. 2010 U.S.Religion Census: Religious Congregations & Membership Study. Association of Statisticians of American Religious Bodies. Jones, Dale E., et al. 2002. Congregations and Membership in the United States 2000. Nashville, TN: Glenmary Research Center. Graphs represent county-level data
Food Environment Statistics: Number of grocery stores : 56This county :
1.49 / 10,000 pop.Oregon :
2.03 / 10,000 pop.
Number of supercenters and club stores : 10Here :
0.27 / 10,000 pop.Oregon :
0.33 / 10,000 pop.
Number of convenience stores (no gas) : 55Clackamas County :
1.47 / 10,000 pop.Oregon :
2.01 / 10,000 pop.
Number of convenience stores (with gas) : 59Clackamas County :
1.57 / 10,000 pop.State :
1.69 / 10,000 pop.
Number of full-service restaurants : 284Clackamas County :
7.57 / 10,000 pop.Oregon :
9.93 / 10,000 pop.
Adult diabetes rate : Clackamas County :
6.9%Oregon :
7.4%
Adult obesity rate : This county :
25.7%State :
25.6%
Low-income preschool obesity rate : Clackamas County :
13.5%State :
14.2%
Health and Nutrition: Healthy diet rate : This city:
55.0%Oregon:
49.6%
Average overall health of teeth and gums : This city:
54.9%State:
46.8%
People feeling badly about themselves : People not drinking alcohol at all : Happy Valley:
8.6%Oregon:
10.1%
Average hours sleeping at night : Happy Valley:
6.9Oregon:
6.8
Overweight people : Happy Valley:
35.1%State:
33.3%
General health condition : Average condition of hearing : This city:
81.5%Oregon:
78.7%
More about Health and Nutrition of Happy Valley, OR Residents
Local government employment and payroll (March 2022)
Function
Full-time employees
Monthly full-time payroll
Average yearly full-time wage
Part-time employees
Monthly part-time payroll
Other and Unallocable
26 $179,447 $82,822 1 $1,434 Streets and Highways
14 $85,558 $73,335 0 $0 Local Libraries
11 $69,690 $76,025 21 $21,608 Other Government Administration
7 $69,557 $119,241 1 $817 Parks and Recreation
7 $28,918 $49,574 0 $0 Financial Administration
3 $23,134 $92,536 0 $0 Judicial and Legal
2 $9,846 $59,076 0 $0
Totals for Government
70 $466,150 $79,911 23 $23,859
Happy Valley government finances - Expenditure in 2021 (per resident):
Construction - Regular Highways: $2,633,000 ($99.52)
Parks and Recreation: $357,000 ($13.49)Current Operations - Police Protection: $4,103,000 ($155.09)
Financial Administration: $3,217,000 ($121.60)Libraries: $2,095,000 ($79.19)General - Other: $1,077,000 ($40.71)Regular Highways: $1,001,000 ($37.84)Parks and Recreation: $834,000 ($31.52)Protective Inspection and Regulation - Other: $591,000 ($22.34)Judicial and Legal Services: $144,000 ($5.44)Housing and Community Development: $27,000 ($1.02)Other Capital Outlay - Parks and Recreation: $435,000 ($16.44)
Libraries: $35,000 ($1.32)Police Protection: $6,000 ($0.23)Total Salaries and Wages: $5,050,000 ($190.88)
Happy Valley government finances - Revenue in 2021 (per resident):
Charges - Other: $1,425,000 ($53.86)
Parks and Recreation: $70,000 ($2.65)Local Intergovernmental - Other: $3,133,000 ($118.42)
Highways: $52,000 ($1.97)Miscellaneous - Fines and Forfeits: $677,000 ($25.59)
Interest Earnings: $424,000 ($16.03)General Revenue - Other: $95,000 ($3.59)Rents: $12,000 ($0.45)State Intergovernmental - Highways: $1,645,000 ($62.18)
General Local Government Support: $843,000 ($31.86)Other: $589,000 ($22.26)Tax - Other License: $11,443,000 ($432.53)
Property: $9,227,000 ($348.77)Public Utilities Sales: $1,912,000 ($72.27)Motor Fuels Sales: $104,000 ($3.93)
Happy Valley government finances - Cash and Securities in 2021 (per resident):
Other Funds - Cash and Securities: $70,776,000 ($2675.23)
9.10% of this county's 2021 resident taxpayers lived in other counties in 2020 ($99,084 average adjusted gross income )
Here:
9.10%Oregon average:
8.20%
0.01% of residents moved from foreign countries ($71 average AGI )Clackamas County:
0.01%Oregon average:
0.01%
Top counties from which taxpayers relocated into this county between 2020 and 2021:
Businesses in Happy Valley, OR
Name Count Name Count
AT&T 2 Journeys 1 Applebee's 2 Justice 1 AutoZone 1 LensCrafters 1 Bath & Body Works 1 Motherhood Maternity 1 Ben & Jerry's 1 New Balance 1 Burlington Coat Factory 1 Nike 4 Chipotle 1 Nordstrom 1 DHL 1 Quiznos 1 Dairy Queen 1 RadioShack 2 Dennys 1 Spencer Gifts 1 FedEx 1 Sprint Nextel 1 Firestone Complete Auto Care 1 Subway 1 Foot Locker 1 T-Mobile 2 Fredericks Of Hollywood 1 U-Haul 1 GameStop 2 UPS 2 H&M 1 Vans 1 H&R Block 1 Walgreens 2 Home Depot 1 Walmart 1 Hot Topic 1 Wendy's 1
Strongest AM radio stations in Happy Valley:
KPOJ (620 AM; 50 kW; PORTLAND, OR; Owner: CITICASTERS LICENSES, L.P.)
KDZR (1640 AM; 10 kW; LAKE OSWEGO, OR; Owner: ABC, INC.)
KEX (1190 AM; 50 kW; PORTLAND, OR; Owner: CITICASTERS LICENSES, L.P.)
KKPZ (1330 AM; 5 kW; PORTLAND, OR; Owner: KPHP RADIO, INC.)
KKSN (1520 AM; 50 kW; OREGON CITY, OR; Owner: ENTERCOM PORTLAND LICENSE, LLC)
KXL (750 AM; 50 kW; PORTLAND, OR; Owner: ROSE CITY RADIO CORPORATION)
KKSL (1290 AM; 10 kW; LAKE OSWEGO, OR; Owner: ABC, INC.)
KOTK (1080 AM; 50 kW; PORTLAND, OR; Owner: FISHER BROADCASTING - PORTLAND RADIO, L.L.C.)
KPAM (860 AM; 50 kW; TROUTDALE, OR; Owner: PAMPLIN BROADCASTING-OREGON, INC.)
KFXX (910 AM; 10 kW; VANCOUVER, WA; Owner: ENTERCOM PORTLAND LICENSE, LLC (DE))
KKAD (1550 AM; 50 kW; VANCOUVER, WA; Owner: PAMPLIN BROADCASTING-WASHINGTON, INC)
KGUY (1010 AM; daytime; 4 kW; MILWAUKIE, OR; Owner: NORTHWEST RADIO BROADCASTING COMPANY)
KBNP (1410 AM; 5 kW; PORTLAND, OR; Owner: KBNP RADIO, INC.)
Strongest FM radio stations in Happy Valley:
K242AF (96.3 FM; PORTLAND, OR; Owner: EDUCATIONAL MEDIA FOUNDATION)
K274AR (102.7 FM; GRESHAM, OR; Owner: EDUCATIONAL MEDIA FOUNDATION)
KNRK (94.7 FM; CAMAS, WA; Owner: ENTERCOM PORTLAND LICENSE, LLC (DE))
KGON (92.3 FM; PORTLAND, OR; Owner: ENTERCOM PORTLAND LICENSE, LLC (DE))
KKSN-FM (97.1 FM; PORTLAND, OR; Owner: ENTERCOM PORTLAND LICENSE, LLC (DE))
KXJM (95.5 FM; PORTLAND, OR; Owner: ROSE CITY RADIO CORPORATION)
KFIS (104.1 FM; SCAPPOOSE, OR; Owner: CARON BROADCASTING, INC.)
KBOO (90.7 FM; PORTLAND, OR; Owner: THE KBOO FOUNDATION)
KWJJ-FM (99.5 FM; PORTLAND, OR; Owner: FISHER BROADCASTING - PORTLAND RADIO, L.L.C.)
KRRC (104.1 FM; PORTLAND, OR; Owner: THE REED INSTITUTE)
KINK (101.9 FM; PORTLAND, OR; Owner: INFINITY RADIO OPERATIONS INC.)
KKCW (103.3 FM; BEAVERTON, OR; Owner: CITICASTERS LICENSES, L.P.)
KUFO-FM (101.1 FM; PORTLAND, OR; Owner: INFINITY RADIO OPERATIONS INC.)
KMHD (89.1 FM; GRESHAM, OR; Owner: MT. HOOD COMMUNITY COLLEGE DISTRICT)
KVMX (107.5 FM; BANKS, OR; Owner: INFINITY RADIO OPERATIONS INC.)
KLTH (106.7 FM; LAKE OSWEGO, OR; Owner: INIFINITY RADIO OF PORTLAND INC.)
KUPL-FM (98.7 FM; PORTLAND, OR; Owner: INFINITY RADIO OF PORTLAND INC.)
KOPB-FM (91.5 FM; PORTLAND, OR; Owner: OREGON PUBLIC BROADCASTING)
KBVM (88.3 FM; PORTLAND, OR; Owner: CATHOLIC BROADCASTING NORTHWEST, INC)
KPDQ-FM (93.7 FM; PORTLAND, OR; Owner: SALEM MEDIA OF OREGON, INC.)
TV broadcast stations around Happy Valley:
K16CB (Channel 16; HAPPY VALLEY, OR; Owner: MEREDITH CORPORATION)
K58CO (Channel 58; PORTLAND, OR; Owner: NORTHWEST CHRISTIAN BROADCASTING)
KKEI-CA (Channel 56; PORTLAND, OR; Owner: WATCHTV, INC.)
KATU (Channel 2; PORTLAND, OR; Owner: FISHER BROADCASTING - PORTLAND TV, L.L.C.)
KOIN (Channel 6; PORTLAND, OR; Owner: EMMIS TELEVISION LICENSE CORPORATION)
KNMT (Channel 24; PORTLAND, OR; Owner: NATIONAL MINORITY T.V., INC.)
KPDX (Channel 49; VANCOUVER, WA; Owner: MEREDITH CORPORATION)
KPTV (Channel 12; PORTLAND, OR; Owner: MEREDITH CORPORATION)
K57IF (Channel 57; SALEM, OR; Owner: LaGRANDE BROADCASTING, INC.)
KGW (Channel 8; PORTLAND, OR; Owner: KING BROADCASTING COMPANY)
KOPB-TV (Channel 10; PORTLAND, OR; Owner: OREGON PUBLIC BROADCASTING)
KPXG-LP (Channel 54; PORTLAND, OR; Owner: PAXSON COMMUNICATIONS LICENSE COMPANY, LLC)
K14HN (Channel 14; VANCOUVER/CAMAS, WA; Owner: MEREDITH CORPORATION)
KWBP-LP (Channel 4; PORTLAND, OR; Owner: TRIBUNE BROADCASTING HOLDINGS, INC.)
KWBP (Channel 32; SALEM, OR; Owner: TRIBUNE BROADCAST HOLDINGS, INC.)
KPXG (Channel 22; SALEM, OR; Owner: PAXSON SALEM LICENSE, INC.)
KORK-CA (Channel 35; PORTLAND, OR; Owner: WATCHTV, INC.)
K18EL (Channel 18; NEWBERG/TIGARD, OR; Owner: MEREDITH CORPORATION)
National Bridge Inventory (NBI) Statistics 6 Number of bridges82ft / 24.9m Total length $149,000 Total costs176,425 Total average daily traffic15,470 Total average daily truck traffic
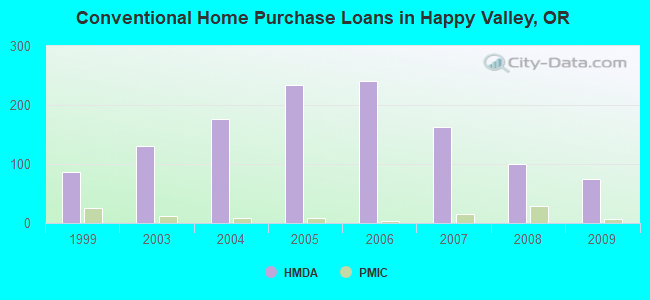
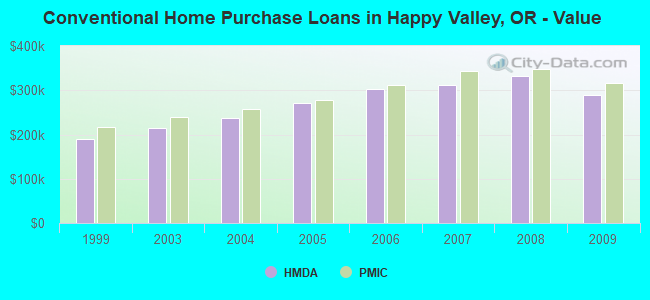
Home Mortgage Disclosure Act Aggregated Statistics For Year 2009(Based on 2 partial tracts) A) FHA, FSA/RHS & VA B) Conventional C) Refinancings D) Home Improvement Loans E) Loans on Dwellings For 5+ Families F) Non-occupant Loans on Number Average Value Number Average Value Number Average Value Number Average Value Number Average Value Number Average Value
LOANS ORIGINATED 33 $307,741 75 $289,156 255 $279,921 7 $217,881 1 $4,468,060 16 $281,296 APPLICATIONS APPROVED, NOT ACCEPTED 5 $284,196 7 $334,306 34 $313,847 1 $289,960 0 $0 1 $345,470 APPLICATIONS DENIED 10 $328,422 18 $393,997 79 $332,512 3 $326,187 0 $0 5 $333,094 APPLICATIONS WITHDRAWN 5 $305,422 14 $353,515 57 $308,323 1 $87,420 0 $0 2 $359,580 FILES CLOSED FOR INCOMPLETENESS 0 $0 5 $410,408 13 $388,451 1 $172,770 0 $0 2 $283,025
Aggregated Statistics For Year 2008(Based on 2 partial tracts) A) FHA, FSA/RHS & VA B) Conventional C) Refinancings D) Home Improvement Loans F) Non-occupant Loans on G) Loans On Manufactured Number Average Value Number Average Value Number Average Value Number Average Value Number Average Value Number Average Value
LOANS ORIGINATED 8 $313,264 100 $332,926 108 $293,181 7 $124,987 18 $271,102 0 $0 APPLICATIONS APPROVED, NOT ACCEPTED 1 $432,210 21 $302,074 24 $368,413 2 $188,550 3 $224,220 1 $37,620 APPLICATIONS DENIED 3 $384,713 37 $363,551 58 $417,710 7 $337,081 9 $300,180 1 $23,590 APPLICATIONS WITHDRAWN 2 $282,180 20 $334,314 37 $370,696 4 $263,290 5 $324,614 0 $0 FILES CLOSED FOR INCOMPLETENESS 0 $0 5 $309,480 8 $444,769 1 $49,890 1 $229,510 0 $0
Aggregated Statistics For Year 2007(Based on 2 partial tracts) A) FHA, FSA/RHS & VA B) Conventional C) Refinancings D) Home Improvement Loans F) Non-occupant Loans on G) Loans On Manufactured Number Average Value Number Average Value Number Average Value Number Average Value Number Average Value Number Average Value
LOANS ORIGINATED 1 $234,230 163 $311,262 154 $334,728 15 $153,525 33 $310,650 0 $0 APPLICATIONS APPROVED, NOT ACCEPTED 0 $0 33 $298,563 36 $379,732 3 $238,420 6 $361,487 0 $0 APPLICATIONS DENIED 0 $0 42 $338,850 87 $417,337 10 $181,989 14 $365,568 2 $28,510 APPLICATIONS WITHDRAWN 0 $0 24 $315,663 41 $414,171 4 $228,090 10 $385,716 0 $0 FILES CLOSED FOR INCOMPLETENESS 0 $0 5 $398,134 11 $408,902 1 $247,470 1 $171,360 0 $0
Aggregated Statistics For Year 2006(Based on 2 partial tracts) A) FHA, FSA/RHS & VA B) Conventional C) Refinancings D) Home Improvement Loans F) Non-occupant Loans on G) Loans On Manufactured Number Average Value Number Average Value Number Average Value Number Average Value Number Average Value Number Average Value
LOANS ORIGINATED 1 $237,490 241 $301,987 162 $301,595 15 $161,397 30 $288,351 0 $0 APPLICATIONS APPROVED, NOT ACCEPTED 0 $0 44 $285,001 32 $292,776 5 $158,144 8 $284,880 1 $25,370 APPLICATIONS DENIED 0 $0 58 $338,774 75 $321,720 9 $106,734 14 $308,149 1 $27,270 APPLICATIONS WITHDRAWN 0 $0 30 $289,438 42 $285,758 1 $96,140 7 $249,781 0 $0 FILES CLOSED FOR INCOMPLETENESS 0 $0 6 $279,403 14 $299,649 1 $171,690 2 $235,850 0 $0
Aggregated Statistics For Year 2005(Based on 2 partial tracts) A) FHA, FSA/RHS & VA B) Conventional C) Refinancings D) Home Improvement Loans F) Non-occupant Loans on G) Loans On Manufactured Number Average Value Number Average Value Number Average Value Number Average Value Number Average Value Number Average Value
LOANS ORIGINATED 1 $324,400 234 $271,757 186 $261,452 19 $166,314 27 $245,181 1 $91,230 APPLICATIONS APPROVED, NOT ACCEPTED 0 $0 32 $257,897 28 $259,607 2 $29,515 3 $185,817 0 $0 APPLICATIONS DENIED 0 $0 47 $283,090 71 $253,020 9 $114,312 9 $232,950 1 $84,990 APPLICATIONS WITHDRAWN 1 $174,870 38 $259,312 54 $262,504 3 $217,523 5 $213,236 0 $0 FILES CLOSED FOR INCOMPLETENESS 0 $0 8 $199,656 17 $293,024 1 $116,510 2 $142,960 0 $0
Aggregated Statistics For Year 2004(Based on 2 partial tracts) A) FHA, FSA/RHS & VA B) Conventional C) Refinancings D) Home Improvement Loans F) Non-occupant Loans on G) Loans On Manufactured Number Average Value Number Average Value Number Average Value Number Average Value Number Average Value Number Average Value
LOANS ORIGINATED 2 $181,120 177 $237,072 171 $236,145 9 $191,038 15 $179,961 0 $0 APPLICATIONS APPROVED, NOT ACCEPTED 0 $0 23 $237,197 28 $225,252 2 $76,915 3 $260,057 0 $0 APPLICATIONS DENIED 1 $93,800 28 $254,366 50 $237,995 6 $71,515 4 $174,715 1 $129,150 APPLICATIONS WITHDRAWN 1 $182,510 16 $244,031 39 $226,635 2 $90,860 4 $153,310 1 $145,970 FILES CLOSED FOR INCOMPLETENESS 0 $0 4 $250,520 7 $195,879 1 $249,330 1 $80,370 0 $0
Aggregated Statistics For Year 2003(Based on 2 partial tracts) A) FHA, FSA/RHS & VA B) Conventional C) Refinancings D) Home Improvement Loans F) Non-occupant Loans on Number Average Value Number Average Value Number Average Value Number Average Value Number Average Value
LOANS ORIGINATED 3 $190,087 131 $215,059 436 $203,465 7 $58,444 15 $174,086 APPLICATIONS APPROVED, NOT ACCEPTED 0 $0 10 $220,669 51 $200,553 2 $57,645 2 $152,665 APPLICATIONS DENIED 1 $144,510 19 $216,389 70 $233,014 3 $45,317 4 $189,172 APPLICATIONS WITHDRAWN 1 $104,160 7 $305,670 61 $228,206 0 $0 2 $217,430 FILES CLOSED FOR INCOMPLETENESS 0 $0 4 $245,168 16 $199,848 0 $0 1 $156,730
Aggregated Statistics For Year 1999(Based on 1 partial tract) A) FHA, FSA/RHS & VA B) Conventional C) Refinancings D) Home Improvement Loans F) Non-occupant Loans on Number Average Value Number Average Value Number Average Value Number Average Value Number Average Value
LOANS ORIGINATED 6 $169,612 87 $189,184 87 $178,221 12 $27,593 7 $136,660 APPLICATIONS APPROVED, NOT ACCEPTED 0 $0 9 $145,159 20 $180,280 2 $31,460 1 $97,500 APPLICATIONS DENIED 1 $110,580 18 $184,269 31 $202,726 8 $39,639 1 $198,110 APPLICATIONS WITHDRAWN 0 $0 7 $165,851 18 $212,236 3 $157,517 3 $161,150 FILES CLOSED FOR INCOMPLETENESS 0 $0 1 $201,850 7 $219,519 0 $0 0 $0
Detailed HMDA statistics for the following Tracts:
0222.03
, 0222.04
Private Mortgage Insurance Companies Aggregated Statistics For Year 2009(Based on 2 partial tracts) A) Conventional B) Refinancings Number Average Value Number Average Value
LOANS ORIGINATED 7 $316,914 4 $295,610 APPLICATIONS APPROVED, NOT ACCEPTED 2 $327,695 3 $327,073 APPLICATIONS DENIED 1 $377,030 1 $222,580 APPLICATIONS WITHDRAWN 0 $0 0 $0 FILES CLOSED FOR INCOMPLETENESS 0 $0 0 $0
Aggregated Statistics For Year 2008(Based on 2 partial tracts) A) Conventional B) Refinancings C) Non-occupant Loans on Number Average Value Number Average Value Number Average Value
LOANS ORIGINATED 28 $348,346 5 $301,266 1 $414,950 APPLICATIONS APPROVED, NOT ACCEPTED 8 $359,651 2 $447,850 1 $196,090 APPLICATIONS DENIED 2 $450,520 1 $334,120 0 $0 APPLICATIONS WITHDRAWN 1 $228,030 1 $416,990 0 $0 FILES CLOSED FOR INCOMPLETENESS 0 $0 0 $0 0 $0
Aggregated Statistics For Year 2007(Based on 2 partial tracts) A) Conventional B) Refinancings C) Non-occupant Loans on Number Average Value Number Average Value Number Average Value
LOANS ORIGINATED 15 $342,597 4 $407,830 0 $0 APPLICATIONS APPROVED, NOT ACCEPTED 4 $406,638 2 $373,400 1 $163,930 APPLICATIONS DENIED 1 $465,280 0 $0 0 $0 APPLICATIONS WITHDRAWN 1 $420,930 1 $385,920 0 $0 FILES CLOSED FOR INCOMPLETENESS 0 $0 0 $0 0 $0
Aggregated Statistics For Year 2006(Based on 2 partial tracts) A) Conventional B) Refinancings C) Non-occupant Loans on Number Average Value Number Average Value Number Average Value
LOANS ORIGINATED 3 $312,983 3 $282,593 1 $195,290 APPLICATIONS APPROVED, NOT ACCEPTED 2 $524,810 2 $365,040 0 $0 APPLICATIONS DENIED 0 $0 0 $0 0 $0 APPLICATIONS WITHDRAWN 1 $381,390 0 $0 0 $0 FILES CLOSED FOR INCOMPLETENESS 0 $0 0 $0 0 $0
Aggregated Statistics For Year 2005(Based on 2 partial tracts) A) Conventional B) Refinancings Number Average Value Number Average Value
LOANS ORIGINATED 8 $278,029 4 $334,870 APPLICATIONS APPROVED, NOT ACCEPTED 1 $382,040 1 $210,690 APPLICATIONS DENIED 0 $0 0 $0 APPLICATIONS WITHDRAWN 1 $376,680 0 $0 FILES CLOSED FOR INCOMPLETENESS 0 $0 0 $0
Aggregated Statistics For Year 2004(Based on 2 partial tracts) A) Conventional B) Refinancings C) Non-occupant Loans on Number Average Value Number Average Value Number Average Value
LOANS ORIGINATED 9 $258,660 4 $251,948 2 $212,495 APPLICATIONS APPROVED, NOT ACCEPTED 3 $220,390 2 $315,380 0 $0 APPLICATIONS DENIED 0 $0 0 $0 0 $0 APPLICATIONS WITHDRAWN 0 $0 1 $214,680 0 $0 FILES CLOSED FOR INCOMPLETENESS 0 $0 0 $0 0 $0
Aggregated Statistics For Year 2003(Based on 2 partial tracts) A) Conventional B) Refinancings C) Non-occupant Loans on Number Average Value Number Average Value Number Average Value
LOANS ORIGINATED 12 $239,575 16 $222,724 1 $143,150 APPLICATIONS APPROVED, NOT ACCEPTED 3 $241,327 4 $202,980 0 $0 APPLICATIONS DENIED 0 $0 0 $0 0 $0 APPLICATIONS WITHDRAWN 1 $179,590 1 $333,840 0 $0 FILES CLOSED FOR INCOMPLETENESS 0 $0 0 $0 0 $0
Aggregated Statistics For Year 1999(Based on 1 partial tract) A) Conventional B) Refinancings Number Average Value Number Average Value
LOANS ORIGINATED 26 $216,756 7 $176,531 APPLICATIONS APPROVED, NOT ACCEPTED 2 $187,680 2 $155,285 APPLICATIONS DENIED 1 $183,790 1 $234,560 APPLICATIONS WITHDRAWN 1 $139,860 1 $115,260 FILES CLOSED FOR INCOMPLETENESS 0 $0 0 $0
Detailed PMIC statistics for the following Tracts:
0222.03
, 0222.04 Happy Valley compared to Oregon state average:
Median household income above state average. Median house value above state average. Unemployed percentage significantly below state average. Black race population percentage significantly above state average. Hispanic race population percentage above state average. Foreign-born population percentage significantly above state average. Renting percentage significantly below state average. Number of rooms per house above state average. House age significantly below state average. Number of college students significantly above state average. Percentage of population with a bachelor's degree or higher above state average. Happy Valley on our top lists :
#49 on the list of "Top 101 cities with most building permits per 10,000 residents (population 5,000+)"
#64 on the list of "Top 101 cities with largest percentage of males in occupations: sales and related occupations (population 5,000+)"
#80 on the list of "Top 100 fastest growing cities from 2000 to 2014 (pop. 5,000+)"
#27 on the list of "Top 101 counties with the highest percentage of residents that exercised in the past month"
#31 on the list of "Top 101 counties with the highest surface withdrawal of fresh water for public supply"
#44 on the list of "Top 101 counties with the highest total withdrawal of fresh water for public supply"
#48 on the list of "Top 101 counties with the highest percentage of residents that keep firearms around their homes"
#78 on the list of "Top 101 counties with the lowest number of births per 1000 residents 2007-2013"
Top Patent Applicants
Lawrence G. Hopkins (12)
Joshua P. Heard (11)
Weiwen Zhao (7)
Michael Bottlang (7)
Chi Thuong-Le La (5)
Hien Tu Le (5)
Aaron Parker (4)
Zareer Cursetjee (4)
Danny Han (3)
David Vinke (3)
Total of 146 patent applications in 2008-2024.


 Recent articles from our blog. Our writers, many of them Ph.D. graduates or candidates, create easy-to-read articles on a wide variety of topics.

 , pop. 224,220).
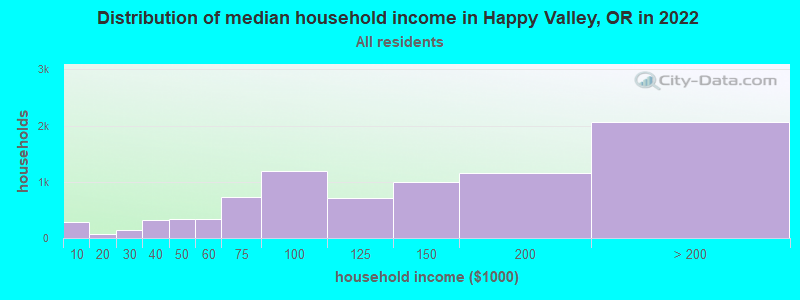

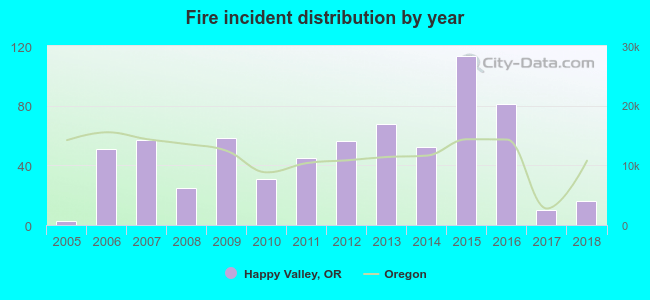 According to the data from the years 2005 - 2018 the average number of fire incidents per year is 48. The highest number of fires - 113 took place in 2015, and the least - 3 in 2005. The data has a growing trend.
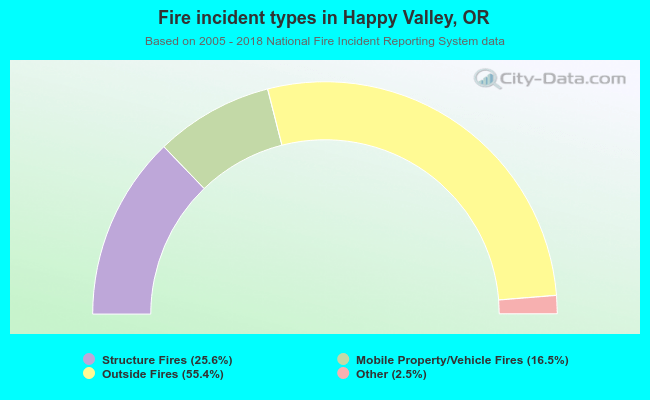 When looking into fire subcategories, the most reports belonged to: Outside Fires (55.4%), and Structure Fires (25.6%).