Hartford, Wisconsin Submit your own pictures of this city and show them to the world
OSM Map
General Map
Google Map
MSN Map
OSM Map
General Map
Google Map
MSN Map
OSM Map
General Map
Google Map
MSN Map
OSM Map
General Map
Google Map
MSN Map
Please wait while loading the map...
Population in 2022: 15,829 (98% urban, 2% rural). Population change since 2000: +45.2%Males: 7,718 Females: 8,111
March 2022 cost of living index in Hartford: 97.2 (near average, U.S. average is 100) Percentage of residents living in poverty in 2022: 8.8%for White Non-Hispanic residents , 83.5% for Black residents , 17.0% for Hispanic or Latino residents , 1.2% for American Indian residents , 11.0% for other race residents , 9.2% for two or more races residents )
Profiles of local businesses
Business Search - 14 Million verified businesses
Data:
Median household income ($)
Median household income (% change since 2000)
Household income diversity
Ratio of average income to average house value (%)
Ratio of average income to average rent
Median household income ($) - White
Median household income ($) - Black or African American
Median household income ($) - Asian
Median household income ($) - Hispanic or Latino
Median household income ($) - American Indian and Alaska Native
Median household income ($) - Multirace
Median household income ($) - Other Race
Median household income for houses/condos with a mortgage ($)
Median household income for apartments without a mortgage ($)
Races - White alone (%)
Races - White alone (% change since 2000)
Races - Black alone (%)
Races - Black alone (% change since 2000)
Races - American Indian alone (%)
Races - American Indian alone (% change since 2000)
Races - Asian alone (%)
Races - Asian alone (% change since 2000)
Races - Hispanic (%)
Races - Hispanic (% change since 2000)
Races - Native Hawaiian and Other Pacific Islander alone (%)
Races - Native Hawaiian and Other Pacific Islander alone (% change since 2000)
Races - Two or more races (%)
Races - Two or more races (% change since 2000)
Races - Other race alone (%)
Races - Other race alone (% change since 2000)
Racial diversity
Unemployment (%)
Unemployment (% change since 2000)
Unemployment (%) - White
Unemployment (%) - Black or African American
Unemployment (%) - Asian
Unemployment (%) - Hispanic or Latino
Unemployment (%) - American Indian and Alaska Native
Unemployment (%) - Multirace
Unemployment (%) - Other Race
Population density (people per square mile)
Population - Males (%)
Population - Females (%)
Population - Males (%) - White
Population - Males (%) - Black or African American
Population - Males (%) - Asian
Population - Males (%) - Hispanic or Latino
Population - Males (%) - American Indian and Alaska Native
Population - Males (%) - Multirace
Population - Males (%) - Other Race
Population - Females (%) - White
Population - Females (%) - Black or African American
Population - Females (%) - Asian
Population - Females (%) - Hispanic or Latino
Population - Females (%) - American Indian and Alaska Native
Population - Females (%) - Multirace
Population - Females (%) - Other Race
Coronavirus confirmed cases (Apr 27, 2024)
Deaths caused by coronavirus (Apr 27, 2024)
Coronavirus confirmed cases (per 100k population) (Apr 27, 2024)
Deaths caused by coronavirus (per 100k population) (Apr 27, 2024)
Daily increase in number of cases (Apr 27, 2024)
Weekly increase in number of cases (Apr 27, 2024)
Cases doubled (in days) (Apr 27, 2024)
Hospitalized patients (Apr 18, 2022)
Negative test results (Apr 18, 2022)
Total test results (Apr 18, 2022)
COVID Vaccine doses distributed (per 100k population) (Sep 19, 2023)
COVID Vaccine doses administered (per 100k population) (Sep 19, 2023)
COVID Vaccine doses distributed (Sep 19, 2023)
COVID Vaccine doses administered (Sep 19, 2023)
Likely homosexual households (%)
Likely homosexual households (% change since 2000)
Likely homosexual households - Lesbian couples (%)
Likely homosexual households - Lesbian couples (% change since 2000)
Likely homosexual households - Gay men (%)
Likely homosexual households - Gay men (% change since 2000)
Cost of living index
Median gross rent ($)
Median contract rent ($)
Median monthly housing costs ($)
Median house or condo value ($)
Median house or condo value ($ change since 2000)
Mean house or condo value by units in structure - 1, detached ($)
Mean house or condo value by units in structure - 1, attached ($)
Mean house or condo value by units in structure - 2 ($)
Mean house or condo value by units in structure by units in structure - 3 or 4 ($)
Mean house or condo value by units in structure - 5 or more ($)
Mean house or condo value by units in structure - Boat, RV, van, etc. ($)
Mean house or condo value by units in structure - Mobile home ($)
Median house or condo value ($) - White
Median house or condo value ($) - Black or African American
Median house or condo value ($) - Asian
Median house or condo value ($) - Hispanic or Latino
Median house or condo value ($) - American Indian and Alaska Native
Median house or condo value ($) - Multirace
Median house or condo value ($) - Other Race
Median resident age
Resident age diversity
Median resident age - Males
Median resident age - Females
Median resident age - White
Median resident age - Black or African American
Median resident age - Asian
Median resident age - Hispanic or Latino
Median resident age - American Indian and Alaska Native
Median resident age - Multirace
Median resident age - Other Race
Median resident age - Males - White
Median resident age - Males - Black or African American
Median resident age - Males - Asian
Median resident age - Males - Hispanic or Latino
Median resident age - Males - American Indian and Alaska Native
Median resident age - Males - Multirace
Median resident age - Males - Other Race
Median resident age - Females - White
Median resident age - Females - Black or African American
Median resident age - Females - Asian
Median resident age - Females - Hispanic or Latino
Median resident age - Females - American Indian and Alaska Native
Median resident age - Females - Multirace
Median resident age - Females - Other Race
Commute - mean travel time to work (minutes)
Travel time to work - Less than 5 minutes (%)
Travel time to work - Less than 5 minutes (% change since 2000)
Travel time to work - 5 to 9 minutes (%)
Travel time to work - 5 to 9 minutes (% change since 2000)
Travel time to work - 10 to 19 minutes (%)
Travel time to work - 10 to 19 minutes (% change since 2000)
Travel time to work - 20 to 29 minutes (%)
Travel time to work - 20 to 29 minutes (% change since 2000)
Travel time to work - 30 to 39 minutes (%)
Travel time to work - 30 to 39 minutes (% change since 2000)
Travel time to work - 40 to 59 minutes (%)
Travel time to work - 40 to 59 minutes (% change since 2000)
Travel time to work - 60 to 89 minutes (%)
Travel time to work - 60 to 89 minutes (% change since 2000)
Travel time to work - 90 or more minutes (%)
Travel time to work - 90 or more minutes (% change since 2000)
Marital status - Never married (%)
Marital status - Now married (%)
Marital status - Separated (%)
Marital status - Widowed (%)
Marital status - Divorced (%)
Median family income ($)
Median family income (% change since 2000)
Median non-family income ($)
Median non-family income (% change since 2000)
Median per capita income ($)
Median per capita income (% change since 2000)
Median family income ($) - White
Median family income ($) - Black or African American
Median family income ($) - Asian
Median family income ($) - Hispanic or Latino
Median family income ($) - American Indian and Alaska Native
Median family income ($) - Multirace
Median family income ($) - Other Race
Median year house/condo built
Median year apartment built
Year house built - Built 2005 or later (%)
Year house built - Built 2000 to 2004 (%)
Year house built - Built 1990 to 1999 (%)
Year house built - Built 1980 to 1989 (%)
Year house built - Built 1970 to 1979 (%)
Year house built - Built 1960 to 1969 (%)
Year house built - Built 1950 to 1959 (%)
Year house built - Built 1940 to 1949 (%)
Year house built - Built 1939 or earlier (%)
Average household size
Household density (households per square mile)
Average household size - White
Average household size - Black or African American
Average household size - Asian
Average household size - Hispanic or Latino
Average household size - American Indian and Alaska Native
Average household size - Multirace
Average household size - Other Race
Occupied housing units (%)
Vacant housing units (%)
Owner occupied housing units (%)
Renter occupied housing units (%)
Vacancy status - For rent (%)
Vacancy status - For sale only (%)
Vacancy status - Rented or sold, not occupied (%)
Vacancy status - For seasonal, recreational, or occasional use (%)
Vacancy status - For migrant workers (%)
Vacancy status - Other vacant (%)
Residents with income below the poverty level (%)
Residents with income below 50% of the poverty level (%)
Children below poverty level (%)
Poor families by family type - Married-couple family (%)
Poor families by family type - Male, no wife present (%)
Poor families by family type - Female, no husband present (%)
Poverty status for native-born residents (%)
Poverty status for foreign-born residents (%)
Poverty among high school graduates not in families (%)
Poverty among people who did not graduate high school not in families (%)
Residents with income below the poverty level (%) - White
Residents with income below the poverty level (%) - Black or African American
Residents with income below the poverty level (%) - Asian
Residents with income below the poverty level (%) - Hispanic or Latino
Residents with income below the poverty level (%) - American Indian and Alaska Native
Residents with income below the poverty level (%) - Multirace
Residents with income below the poverty level (%) - Other Race
Air pollution - Air Quality Index (AQI)
Air pollution - CO
Air pollution - NO2
Air pollution - SO2
Air pollution - Ozone
Air pollution - PM10
Air pollution - PM25
Air pollution - Pb
Crime - Murders per 100,000 population
Crime - Rapes per 100,000 population
Crime - Robberies per 100,000 population
Crime - Assaults per 100,000 population
Crime - Burglaries per 100,000 population
Crime - Thefts per 100,000 population
Crime - Auto thefts per 100,000 population
Crime - Arson per 100,000 population
Crime - City-data.com crime index
Crime - Violent crime index
Crime - Property crime index
Crime - Murders per 100,000 population (5 year average)
Crime - Rapes per 100,000 population (5 year average)
Crime - Robberies per 100,000 population (5 year average)
Crime - Assaults per 100,000 population (5 year average)
Crime - Burglaries per 100,000 population (5 year average)
Crime - Thefts per 100,000 population (5 year average)
Crime - Auto thefts per 100,000 population (5 year average)
Crime - Arson per 100,000 population (5 year average)
Crime - City-data.com crime index (5 year average)
Crime - Violent crime index (5 year average)
Crime - Property crime index (5 year average)
1996 Presidential Elections Results (%) - Democratic Party (Clinton)
1996 Presidential Elections Results (%) - Republican Party (Dole)
1996 Presidential Elections Results (%) - Other
2000 Presidential Elections Results (%) - Democratic Party (Gore)
2000 Presidential Elections Results (%) - Republican Party (Bush)
2000 Presidential Elections Results (%) - Other
2004 Presidential Elections Results (%) - Democratic Party (Kerry)
2004 Presidential Elections Results (%) - Republican Party (Bush)
2004 Presidential Elections Results (%) - Other
2008 Presidential Elections Results (%) - Democratic Party (Obama)
2008 Presidential Elections Results (%) - Republican Party (McCain)
2008 Presidential Elections Results (%) - Other
2012 Presidential Elections Results (%) - Democratic Party (Obama)
2012 Presidential Elections Results (%) - Republican Party (Romney)
2012 Presidential Elections Results (%) - Other
2016 Presidential Elections Results (%) - Democratic Party (Clinton)
2016 Presidential Elections Results (%) - Republican Party (Trump)
2016 Presidential Elections Results (%) - Other
2020 Presidential Elections Results (%) - Democratic Party (Biden)
2020 Presidential Elections Results (%) - Republican Party (Trump)
2020 Presidential Elections Results (%) - Other
Ancestries Reported - Arab (%)
Ancestries Reported - Czech (%)
Ancestries Reported - Danish (%)
Ancestries Reported - Dutch (%)
Ancestries Reported - English (%)
Ancestries Reported - French (%)
Ancestries Reported - French Canadian (%)
Ancestries Reported - German (%)
Ancestries Reported - Greek (%)
Ancestries Reported - Hungarian (%)
Ancestries Reported - Irish (%)
Ancestries Reported - Italian (%)
Ancestries Reported - Lithuanian (%)
Ancestries Reported - Norwegian (%)
Ancestries Reported - Polish (%)
Ancestries Reported - Portuguese (%)
Ancestries Reported - Russian (%)
Ancestries Reported - Scotch-Irish (%)
Ancestries Reported - Scottish (%)
Ancestries Reported - Slovak (%)
Ancestries Reported - Subsaharan African (%)
Ancestries Reported - Swedish (%)
Ancestries Reported - Swiss (%)
Ancestries Reported - Ukrainian (%)
Ancestries Reported - United States (%)
Ancestries Reported - Welsh (%)
Ancestries Reported - West Indian (%)
Ancestries Reported - Other (%)
Educational Attainment - No schooling completed (%)
Educational Attainment - Less than high school (%)
Educational Attainment - High school or equivalent (%)
Educational Attainment - Less than 1 year of college (%)
Educational Attainment - 1 or more years of college (%)
Educational Attainment - Associate degree (%)
Educational Attainment - Bachelor's degree (%)
Educational Attainment - Master's degree (%)
Educational Attainment - Professional school degree (%)
Educational Attainment - Doctorate degree (%)
School Enrollment - Nursery, preschool (%)
School Enrollment - Kindergarten (%)
School Enrollment - Grade 1 to 4 (%)
School Enrollment - Grade 5 to 8 (%)
School Enrollment - Grade 9 to 12 (%)
School Enrollment - College undergrad (%)
School Enrollment - Graduate or professional (%)
School Enrollment - Not enrolled in school (%)
School enrollment - Public schools (%)
School enrollment - Private schools (%)
School enrollment - Not enrolled (%)
Median number of rooms in houses and condos
Median number of rooms in apartments
Housing units lacking complete plumbing facilities (%)
Housing units lacking complete kitchen facilities (%)
Density of houses
Urban houses (%)
Rural houses (%)
Households with people 60 years and over (%)
Households with people 65 years and over (%)
Households with people 75 years and over (%)
Households with one or more nonrelatives (%)
Households with no nonrelatives (%)
Population in households (%)
Family households (%)
Nonfamily households (%)
Population in families (%)
Family households with own children (%)
Median number of bedrooms in owner occupied houses
Mean number of bedrooms in owner occupied houses
Median number of bedrooms in renter occupied houses
Mean number of bedrooms in renter occupied houses
Median number of vehichles in owner occupied houses
Mean number of vehichles in owner occupied houses
Median number of vehichles in renter occupied houses
Mean number of vehichles in renter occupied houses
Mortgage status - with mortgage (%)
Mortgage status - with second mortgage (%)
Mortgage status - with home equity loan (%)
Mortgage status - with both second mortgage and home equity loan (%)
Mortgage status - without a mortgage (%)
Average family size
Average family size - White
Average family size - Black or African American
Average family size - Asian
Average family size - Hispanic or Latino
Average family size - American Indian and Alaska Native
Average family size - Multirace
Average family size - Other Race
Geographical mobility - Same house 1 year ago (%)
Geographical mobility - Moved within same county (%)
Geographical mobility - Moved from different county within same state (%)
Geographical mobility - Moved from different state (%)
Geographical mobility - Moved from abroad (%)
Place of birth - Born in state of residence (%)
Place of birth - Born in other state (%)
Place of birth - Native, outside of US (%)
Place of birth - Foreign born (%)
Housing units in structures - 1, detached (%)
Housing units in structures - 1, attached (%)
Housing units in structures - 2 (%)
Housing units in structures - 3 or 4 (%)
Housing units in structures - 5 to 9 (%)
Housing units in structures - 10 to 19 (%)
Housing units in structures - 20 to 49 (%)
Housing units in structures - 50 or more (%)
Housing units in structures - Mobile home (%)
Housing units in structures - Boat, RV, van, etc. (%)
House/condo owner moved in on average (years ago)
Renter moved in on average (years ago)
Year householder moved into unit - Moved in 1999 to March 2000 (%)
Year householder moved into unit - Moved in 1995 to 1998 (%)
Year householder moved into unit - Moved in 1990 to 1994 (%)
Year householder moved into unit - Moved in 1980 to 1989 (%)
Year householder moved into unit - Moved in 1970 to 1979 (%)
Year householder moved into unit - Moved in 1969 or earlier (%)
Means of transportation to work - Drove car alone (%)
Means of transportation to work - Carpooled (%)
Means of transportation to work - Public transportation (%)
Means of transportation to work - Bus or trolley bus (%)
Means of transportation to work - Streetcar or trolley car (%)
Means of transportation to work - Subway or elevated (%)
Means of transportation to work - Railroad (%)
Means of transportation to work - Ferryboat (%)
Means of transportation to work - Taxicab (%)
Means of transportation to work - Motorcycle (%)
Means of transportation to work - Bicycle (%)
Means of transportation to work - Walked (%)
Means of transportation to work - Other means (%)
Working at home (%)
Industry diversity
Most Common Industries - Agriculture, forestry, fishing and hunting, and mining (%)
Most Common Industries - Agriculture, forestry, fishing and hunting (%)
Most Common Industries - Mining, quarrying, and oil and gas extraction (%)
Most Common Industries - Construction (%)
Most Common Industries - Manufacturing (%)
Most Common Industries - Wholesale trade (%)
Most Common Industries - Retail trade (%)
Most Common Industries - Transportation and warehousing, and utilities (%)
Most Common Industries - Transportation and warehousing (%)
Most Common Industries - Utilities (%)
Most Common Industries - Information (%)
Most Common Industries - Finance and insurance, and real estate and rental and leasing (%)
Most Common Industries - Finance and insurance (%)
Most Common Industries - Real estate and rental and leasing (%)
Most Common Industries - Professional, scientific, and management, and administrative and waste management services (%)
Most Common Industries - Professional, scientific, and technical services (%)
Most Common Industries - Management of companies and enterprises (%)
Most Common Industries - Administrative and support and waste management services (%)
Most Common Industries - Educational services, and health care and social assistance (%)
Most Common Industries - Educational services (%)
Most Common Industries - Health care and social assistance (%)
Most Common Industries - Arts, entertainment, and recreation, and accommodation and food services (%)
Most Common Industries - Arts, entertainment, and recreation (%)
Most Common Industries - Accommodation and food services (%)
Most Common Industries - Other services, except public administration (%)
Most Common Industries - Public administration (%)
Occupation diversity
Most Common Occupations - Management, business, science, and arts occupations (%)
Most Common Occupations - Management, business, and financial occupations (%)
Most Common Occupations - Management occupations (%)
Most Common Occupations - Business and financial operations occupations (%)
Most Common Occupations - Computer, engineering, and science occupations (%)
Most Common Occupations - Computer and mathematical occupations (%)
Most Common Occupations - Architecture and engineering occupations (%)
Most Common Occupations - Life, physical, and social science occupations (%)
Most Common Occupations - Education, legal, community service, arts, and media occupations (%)
Most Common Occupations - Community and social service occupations (%)
Most Common Occupations - Legal occupations (%)
Most Common Occupations - Education, training, and library occupations (%)
Most Common Occupations - Arts, design, entertainment, sports, and media occupations (%)
Most Common Occupations - Healthcare practitioners and technical occupations (%)
Most Common Occupations - Health diagnosing and treating practitioners and other technical occupations (%)
Most Common Occupations - Health technologists and technicians (%)
Most Common Occupations - Service occupations (%)
Most Common Occupations - Healthcare support occupations (%)
Most Common Occupations - Protective service occupations (%)
Most Common Occupations - Fire fighting and prevention, and other protective service workers including supervisors (%)
Most Common Occupations - Law enforcement workers including supervisors (%)
Most Common Occupations - Food preparation and serving related occupations (%)
Most Common Occupations - Building and grounds cleaning and maintenance occupations (%)
Most Common Occupations - Personal care and service occupations (%)
Most Common Occupations - Sales and office occupations (%)
Most Common Occupations - Sales and related occupations (%)
Most Common Occupations - Office and administrative support occupations (%)
Most Common Occupations - Natural resources, construction, and maintenance occupations (%)
Most Common Occupations - Farming, fishing, and forestry occupations (%)
Most Common Occupations - Construction and extraction occupations (%)
Most Common Occupations - Installation, maintenance, and repair occupations (%)
Most Common Occupations - Production, transportation, and material moving occupations (%)
Most Common Occupations - Production occupations (%)
Most Common Occupations - Transportation occupations (%)
Most Common Occupations - Material moving occupations (%)
People in Group quarters - Institutionalized population (%)
People in Group quarters - Correctional institutions (%)
People in Group quarters - Federal prisons and detention centers (%)
People in Group quarters - Halfway houses (%)
People in Group quarters - Local jails and other confinement facilities (including police lockups) (%)
People in Group quarters - Military disciplinary barracks (%)
People in Group quarters - State prisons (%)
People in Group quarters - Other types of correctional institutions (%)
People in Group quarters - Nursing homes (%)
People in Group quarters - Hospitals/wards, hospices, and schools for the handicapped (%)
People in Group quarters - Hospitals/wards and hospices for chronically ill (%)
People in Group quarters - Hospices or homes for chronically ill (%)
People in Group quarters - Military hospitals or wards for chronically ill (%)
People in Group quarters - Other hospitals or wards for chronically ill (%)
People in Group quarters - Hospitals or wards for drug/alcohol abuse (%)
People in Group quarters - Mental (Psychiatric) hospitals or wards (%)
People in Group quarters - Schools, hospitals, or wards for the mentally retarded (%)
People in Group quarters - Schools, hospitals, or wards for the physically handicapped (%)
People in Group quarters - Institutions for the deaf (%)
People in Group quarters - Institutions for the blind (%)
People in Group quarters - Orthopedic wards and institutions for the physically handicapped (%)
People in Group quarters - Wards in general hospitals for patients who have no usual home elsewhere (%)
People in Group quarters - Wards in military hospitals for patients who have no usual home elsewhere (%)
People in Group quarters - Juvenile institutions (%)
People in Group quarters - Long-term care (%)
People in Group quarters - Homes for abused, dependent, and neglected children (%)
People in Group quarters - Residential treatment centers for emotionally disturbed children (%)
People in Group quarters - Training schools for juvenile delinquents (%)
People in Group quarters - Short-term care, detention or diagnostic centers for delinquent children (%)
People in Group quarters - Type of juvenile institution unknown (%)
People in Group quarters - Noninstitutionalized population (%)
People in Group quarters - College dormitories (includes college quarters off campus) (%)
People in Group quarters - Military quarters (%)
People in Group quarters - On base (%)
People in Group quarters - Barracks, unaccompanied personnel housing (UPH), (Enlisted/Officer), ;and similar group living quarters for military personnel (%)
People in Group quarters - Transient quarters for temporary residents (%)
People in Group quarters - Military ships (%)
People in Group quarters - Group homes (%)
People in Group quarters - Homes or halfway houses for drug/alcohol abuse (%)
People in Group quarters - Homes for the mentally ill (%)
People in Group quarters - Homes for the mentally retarded (%)
People in Group quarters - Homes for the physically handicapped (%)
People in Group quarters - Other group homes (%)
People in Group quarters - Religious group quarters (%)
People in Group quarters - Dormitories (%)
People in Group quarters - Agriculture workers' dormitories on farms (%)
People in Group quarters - Job Corps and vocational training facilities (%)
People in Group quarters - Other workers' dormitories (%)
People in Group quarters - Crews of maritime vessels (%)
People in Group quarters - Other nonhousehold living situations (%)
People in Group quarters - Other noninstitutional group quarters (%)
Residents speaking English at home (%)
Residents speaking English at home - Born in the United States (%)
Residents speaking English at home - Native, born elsewhere (%)
Residents speaking English at home - Foreign born (%)
Residents speaking Spanish at home (%)
Residents speaking Spanish at home - Born in the United States (%)
Residents speaking Spanish at home - Native, born elsewhere (%)
Residents speaking Spanish at home - Foreign born (%)
Residents speaking other language at home (%)
Residents speaking other language at home - Born in the United States (%)
Residents speaking other language at home - Native, born elsewhere (%)
Residents speaking other language at home - Foreign born (%)
Class of Workers - Employee of private company (%)
Class of Workers - Self-employed in own incorporated business (%)
Class of Workers - Private not-for-profit wage and salary workers (%)
Class of Workers - Local government workers (%)
Class of Workers - State government workers (%)
Class of Workers - Federal government workers (%)
Class of Workers - Self-employed workers in own not incorporated business and Unpaid family workers (%)
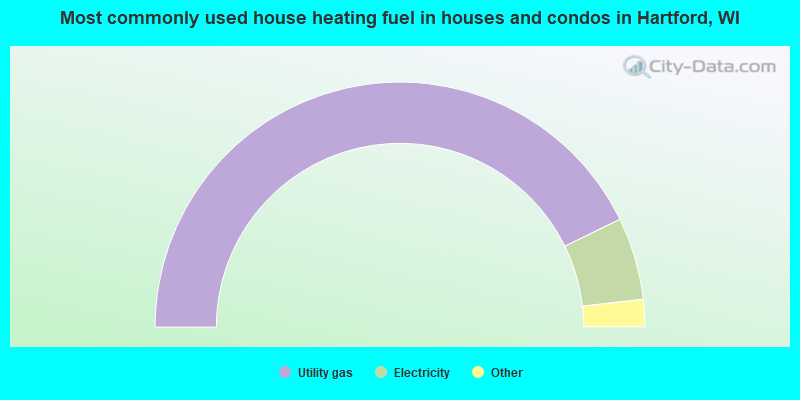
House heating fuel used in houses and condos - Utility gas (%)
House heating fuel used in houses and condos - Bottled, tank, or LP gas (%)
House heating fuel used in houses and condos - Electricity (%)
House heating fuel used in houses and condos - Fuel oil, kerosene, etc. (%)
House heating fuel used in houses and condos - Coal or coke (%)
House heating fuel used in houses and condos - Wood (%)
House heating fuel used in houses and condos - Solar energy (%)
House heating fuel used in houses and condos - Other fuel (%)
House heating fuel used in houses and condos - No fuel used (%)
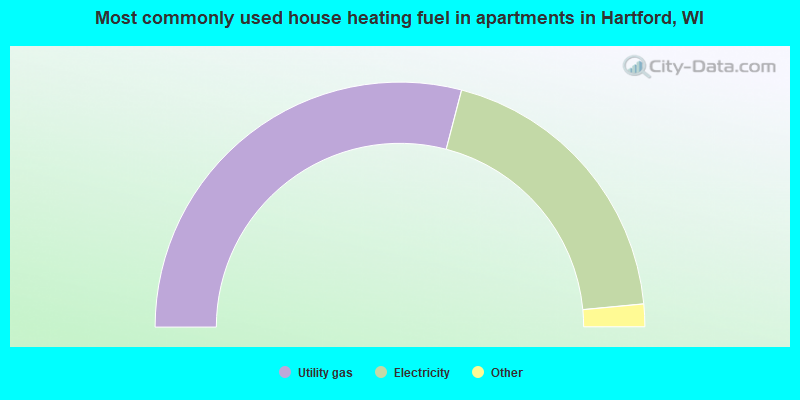
House heating fuel used in apartments - Utility gas (%)
House heating fuel used in apartments - Bottled, tank, or LP gas (%)
House heating fuel used in apartments - Electricity (%)
House heating fuel used in apartments - Fuel oil, kerosene, etc. (%)
House heating fuel used in apartments - Coal or coke (%)
House heating fuel used in apartments - Wood (%)
House heating fuel used in apartments - Solar energy (%)
House heating fuel used in apartments - Other fuel (%)
House heating fuel used in apartments - No fuel used (%)
Armed forces status - In Armed Forces (%)
Armed forces status - Civilian (%)
Armed forces status - Civilian - Veteran (%)
Armed forces status - Civilian - Nonveteran (%)
Fatal accidents locations in years 2005-2021
Fatal accidents locations in 2005
Fatal accidents locations in 2006
Fatal accidents locations in 2007
Fatal accidents locations in 2008
Fatal accidents locations in 2009
Fatal accidents locations in 2010
Fatal accidents locations in 2011
Fatal accidents locations in 2012
Fatal accidents locations in 2013
Fatal accidents locations in 2014
Fatal accidents locations in 2015
Fatal accidents locations in 2016
Fatal accidents locations in 2017
Fatal accidents locations in 2018
Fatal accidents locations in 2019
Fatal accidents locations in 2020
Fatal accidents locations in 2021
Alcohol use - People drinking some alcohol every month (%)
Alcohol use - People not drinking at all (%)
Alcohol use - Average days/month drinking alcohol
Alcohol use - Average drinks/week
Alcohol use - Average days/year people drink much
Audiometry - Average condition of hearing (%)
Audiometry - People that can hear a whisper from across a quiet room (%)
Audiometry - People that can hear normal voice from across a quiet room (%)
Audiometry - Ears ringing, roaring, buzzing (%)
Audiometry - Had a job exposure to loud noise (%)
Audiometry - Had off-work exposure to loud noise (%)
Blood Pressure & Cholesterol - Has high blood pressure (%)
Blood Pressure & Cholesterol - Checking blood pressure at home (%)
Blood Pressure & Cholesterol - Frequently checking blood cholesterol (%)
Blood Pressure & Cholesterol - Has high cholesterol level (%)
Consumer Behavior - Money monthly spent on food at supermarket/grocery store
Consumer Behavior - Money monthly spent on food at other stores
Consumer Behavior - Money monthly spent on eating out
Consumer Behavior - Money monthly spent on carryout/delivered foods
Consumer Behavior - Income spent on food at supermarket/grocery store (%)
Consumer Behavior - Income spent on food at other stores (%)
Consumer Behavior - Income spent on eating out (%)
Consumer Behavior - Income spent on carryout/delivered foods (%)
Current Health Status - General health condition (%)
Current Health Status - Blood donors (%)
Current Health Status - Has blood ever tested for HIV virus (%)
Current Health Status - Left-handed people (%)
Dermatology - People using sunscreen (%)
Diabetes - Diabetics (%)
Diabetes - Had a blood test for high blood sugar (%)
Diabetes - People taking insulin (%)
Diet Behavior & Nutrition - Diet health (%)
Diet Behavior & Nutrition - Milk product consumption (# of products/month)
Diet Behavior & Nutrition - Meals not home prepared (#/week)
Diet Behavior & Nutrition - Meals from fast food or pizza place (#/week)
Diet Behavior & Nutrition - Ready-to-eat foods (#/month)
Diet Behavior & Nutrition - Frozen meals/pizza (#/month)
Drug Use - People that ever used marijuana or hashish (%)
Drug Use - Ever used hard drugs (%)
Drug Use - Ever used any form of cocaine (%)
Drug Use - Ever used heroin (%)
Drug Use - Ever used methamphetamine (%)
Health Insurance - People covered by health insurance (%)
Kidney Conditions-Urology - Avg. # of times urinating at night
Medical Conditions - People with asthma (%)
Medical Conditions - People with anemia (%)
Medical Conditions - People with psoriasis (%)
Medical Conditions - People with overweight (%)
Medical Conditions - Elderly people having difficulties in thinking or remembering (%)
Medical Conditions - People who ever received blood transfusion (%)
Medical Conditions - People having trouble seeing even with glass/contacts (%)
Medical Conditions - People with arthritis (%)
Medical Conditions - People with gout (%)
Medical Conditions - People with congestive heart failure (%)
Medical Conditions - People with coronary heart disease (%)
Medical Conditions - People with angina pectoris (%)
Medical Conditions - People who ever had heart attack (%)
Medical Conditions - People who ever had stroke (%)
Medical Conditions - People with emphysema (%)
Medical Conditions - People with thyroid problem (%)
Medical Conditions - People with chronic bronchitis (%)
Medical Conditions - People with any liver condition (%)
Medical Conditions - People who ever had cancer or malignancy (%)
Mental Health - People who have little interest in doing things (%)
Mental Health - People feeling down, depressed, or hopeless (%)
Mental Health - People who have trouble sleeping or sleeping too much (%)
Mental Health - People feeling tired or having little energy (%)
Mental Health - People with poor appetite or overeating (%)
Mental Health - People feeling bad about themself (%)
Mental Health - People who have trouble concentrating on things (%)
Mental Health - People moving or speaking slowly or too fast (%)
Mental Health - People having thoughts they would be better off dead (%)
Oral Health - Average years since last visit a dentist
Oral Health - People embarrassed because of mouth (%)
Oral Health - People with gum disease (%)
Oral Health - General health of teeth and gums (%)
Oral Health - Average days a week using dental floss/device
Oral Health - Average days a week using mouthwash for dental problem
Oral Health - Average number of teeth
Pesticide Use - Households using pesticides to control insects (%)
Pesticide Use - Households using pesticides to kill weeds (%)
Physical Activity - People doing vigorous-intensity work activities (%)
Physical Activity - People doing moderate-intensity work activities (%)
Physical Activity - People walking or bicycling (%)
Physical Activity - People doing vigorous-intensity recreational activities (%)
Physical Activity - People doing moderate-intensity recreational activities (%)
Physical Activity - Average hours a day doing sedentary activities
Physical Activity - Average hours a day watching TV or videos
Physical Activity - Average hours a day using computer
Physical Functioning - People having limitations keeping them from working (%)
Physical Functioning - People limited in amount of work they can do (%)
Physical Functioning - People that need special equipment to walk (%)
Physical Functioning - People experiencing confusion/memory problems (%)
Physical Functioning - People requiring special healthcare equipment (%)
Prescription Medications - Average number of prescription medicines taking
Preventive Aspirin Use - Adults 40+ taking low-dose aspirin (%)
Reproductive Health - Vaginal deliveries (%)
Reproductive Health - Cesarean deliveries (%)
Reproductive Health - Deliveries resulted in a live birth (%)
Reproductive Health - Pregnancies resulted in a delivery (%)
Reproductive Health - Women breastfeeding newborns (%)
Reproductive Health - Women that had a hysterectomy (%)
Reproductive Health - Women that had both ovaries removed (%)
Reproductive Health - Women that have ever taken birth control pills (%)
Reproductive Health - Women taking birth control pills (%)
Reproductive Health - Women that have ever used Depo-Provera or injectables (%)
Reproductive Health - Women that have ever used female hormones (%)
Sexual Behavior - People 18+ that ever had sex (vaginal, anal, or oral) (%)
Sexual Behavior - Males 18+ that ever had vaginal sex with a woman (%)
Sexual Behavior - Males 18+ that ever performed oral sex on a woman (%)
Sexual Behavior - Males 18+ that ever had anal sex with a woman (%)
Sexual Behavior - Males 18+ that ever had any sex with a man (%)
Sexual Behavior - Females 18+ that ever had vaginal sex with a man (%)
Sexual Behavior - Females 18+ that ever performed oral sex on a man (%)
Sexual Behavior - Females 18+ that ever had anal sex with a man (%)
Sexual Behavior - Females 18+ that ever had any kind of sex with a woman (%)
Sexual Behavior - Average age people first had sex
Sexual Behavior - Average number of female sex partners in lifetime (males 18+)
Sexual Behavior - Average number of female vaginal sex partners in lifetime (males 18+)
Sexual Behavior - Average age people first performed oral sex on a woman (18+)
Sexual Behavior - Average number of woman performed oral sex on in lifetime (18+)
Sexual Behavior - Average number of male sex partners in lifetime (males 18+)
Sexual Behavior - Average number of male anal sex partners in lifetime (males 18+)
Sexual Behavior - Average age people first performed oral sex on a man (18+)
Sexual Behavior - Average number of male oral sex partners in lifetime (18+)
Sexual Behavior - People using protection when performing oral sex (%)
Sexual Behavior - Average number of times people have vaginal or anal sex a year
Sexual Behavior - People having sex without condom (%)
Sexual Behavior - Average number of male sex partners in lifetime (females 18+)
Sexual Behavior - Average number of male vaginal sex partners in lifetime (females 18+)
Sexual Behavior - Average number of female sex partners in lifetime (females 18+)
Sexual Behavior - Circumcised males 18+ (%)
Sleep Disorders - Average hours sleeping at night
Sleep Disorders - People that has trouble sleeping (%)
Smoking-Cigarette Use - People smoking cigarettes (%)
Taste & Smell - People 40+ having problems with smell (%)
Taste & Smell - People 40+ having problems with taste (%)
Taste & Smell - People 40+ that ever had wisdom teeth removed (%)
Taste & Smell - People 40+ that ever had tonsils teeth removed (%)
Taste & Smell - People 40+ that ever had a loss of consciousness because of a head injury (%)
Taste & Smell - People 40+ that ever had a broken nose or other serious injury to face or skull (%)
Taste & Smell - People 40+ that ever had two or more sinus infections (%)
Weight - Average height (inches)
Weight - Average weight (pounds)
Weight - Average BMI
Weight - People that are obese (%)
Weight - People that ever were obese (%)
Weight - People trying to lose weight (%)
According to our research of Wisconsin and other state lists, there were 46 registered sex offenders living in Hartford, Wisconsin as of April 27, 2024 . The ratio of all residents to sex offenders in Hartford is 313 to 1.The ratio of registered sex offenders to all residents in this city is near the state average.
Officers per 1,000 residents here:
0.28Wisconsin average:
2.07
Latest news from Hartford, WI collected exclusively by city-data.com from local newspapers, TV, and radio stations
Ancestries: German (50.4%), American (9.5%), Polish (5.0%), Irish (2.9%), Finnish (2.3%), Italian (1.9%).
Current Local Time:
Land area: 5.99 square miles.
Population density: 2,643 people per square mile (average).
362 residents are foreign born (1.0% Latin America , 0.9% Europe , 0.4% Asia ).
This city:
2.3%Wisconsin:
5.0%
Median real estate property taxes paid for housing units with mortgages in 2022: $3,223 (1.2%)Median real estate property taxes paid for housing units with no mortgage in 2022: $3,261 (1.3%)
Nearest city with pop. 50,000+: Waukesha, WI
Nearest city with pop. 200,000+: Milwaukee, WI
Nearest city with pop. 1,000,000+: Chicago, IL
Nearest cities:
Latitude: 43.32 N, Longitude: 88.38 W
Daytime population change due to commuting: +1,273 (+8.1%)Workers who live and work in this city: 3,491 (42.5%)
Single-family new house construction building permits:
2022: 43 buildings , average cost: $271,0002021: 53 buildings , average cost: $254,7002020: 56 buildings , average cost: $210,6002019: 50 buildings , average cost: $207,0002018: 84 buildings , average cost: $223,8002017: 56 buildings , average cost: $221,5002016: 69 buildings , average cost: $182,9002015: 74 buildings , average cost: $173,6002014: 42 buildings , average cost: $168,5002013: 34 buildings , average cost: $191,4002012: 22 buildings , average cost: $156,8002011: 5 buildings , average cost: $136,0002010: 24 buildings , average cost: $153,3002009: 36 buildings , average cost: $159,2002008: 48 buildings , average cost: $171,3002007: 67 buildings , average cost: $153,4002006: 152 buildings , average cost: $135,6002005: 104 buildings , average cost: $170,6002004: 142 buildings , average cost: $200,0002003: 188 buildings , average cost: $150,0002002: 120 buildings , average cost: $132,6002001: 145 buildings , average cost: $110,2002000: 81 buildings , average cost: $123,7001999: 78 buildings , average cost: $101,7001998: 125 buildings , average cost: $97,1001997: 80 buildings , average cost: $96,700Unemployment in December 2023:
Population change in the 1990s: +2,547 (+30.5%).
Most common occupations in Hartford, WI (%)
Both Males Females
Metal workers and plastic workers (8.7%)
Other production occupations, including supervisors (7.6%)
Electrical equipment mechanics and other installation, maintenance, and repair workers, including supervisors (4.6%)
Other sales and related occupations, including supervisors (3.9%)
Other management occupations, except farmers and farm managers (3.9%)
Other food preparation and serving workers, including supervisors (2.7%)
Retail sales workers, except cashiers (2.6%)
Metal workers and plastic workers (12.9%)
Other production occupations, including supervisors (9.2%)
Electrical equipment mechanics and other installation, maintenance, and repair workers, including supervisors (7.5%)
Other management occupations, except farmers and farm managers (4.6%)
Other sales and related occupations, including supervisors (3.9%)
Driver/sales workers and truck drivers (3.1%)
Construction traders workers except carpenters, electricians, painters, plumbers, and construction laborers (3.0%)
Secretaries and administrative assistants (5.8%)
Other production occupations, including supervisors (5.5%)
Health technologists and technicians (5.2%)
Waiters and waitresses (4.2%)
Other office and administrative support workers, including supervisors (4.0%)
Other sales and related occupations, including supervisors (3.9%)
Retail sales workers, except cashiers (3.8%)
Tornado activity:
Hartford-area historical tornado activity is slightly above Wisconsin state average. It is 49% greater than the overall U.S. average.
On 7/18/1996, a category F5 (max. wind speeds 261-318 mph) tornado 27.8 miles away from the Hartford city center injured 12 people and caused $40 million in damages.
On 4/4/1981, a category F4 (max. wind speeds 207-260 mph) tornado 11.9 miles away from the city center killed 3 people and injured 53 people and caused between $5,000,000 and $50,000,000 in damages.
Earthquake activity:
Hartford-area historical earthquake activity is significantly above Wisconsin state average. It is 10% greater than the overall U.S. average. On 4/18/2008 at 09:36:59, a magnitude 5.4 (5.1 MB, 4.8 MS, 5.4 MW, 5.2 MW, Class: Moderate, Intensity: VI - VII) earthquake occurred 337.6 miles away from the city center On 6/28/2004 at 06:10:52, a magnitude 4.2 (4.2 MW, Depth: 6.2 mi, Class: Light, Intensity: IV - V) earthquake occurred 131.3 miles away from Hartford center On 6/10/1987 at 23:48:54, a magnitude 5.1 (4.9 MB, 4.4 MS, 4.6 MS, 5.1 LG) earthquake occurred 312.1 miles away from Hartford center On 4/18/2008 at 09:36:59, a magnitude 5.2 (5.2 MW, Depth: 8.9 mi) earthquake occurred 337.6 miles away from the city center On 5/2/2015 at 16:23:07, a magnitude 4.2 (4.2 MW, Depth: 2.8 mi) earthquake occurred 167.4 miles away from Hartford center On 2/10/2010 at 09:59:35, a magnitude 3.8 (3.8 MW, Depth: 6.2 mi, Class: Light, Intensity: II - III) earthquake occurred 93.5 miles away from Hartford center Magnitude types: regional Lg-wave magnitude (LG), body-wave magnitude (MB), surface-wave magnitude (MS), moment magnitude (MW) Natural disasters: The number of natural disasters in Washington County (11) is smaller than the US average (15).Major Disasters (Presidential) Declared: 8Emergencies Declared: 3Storms: 6, Floods: 5, Drought: 1, Hurricane: 1, Snow: 1, Snowstorm: 1, Tornado: 1, Wind: 1, Winter Storm: 1, Other: 1 (Note: some incidents may be assigned to more than one category). Hospitals and medical centers in Hartford: AURORA MED CENTER WASHINGTON COUNTY (Voluntary non-profit - Private, provides emergency services, 1032 E SUMNER ST) BRIDGES HOME HEALTHCARE (1111 EAST SUMNER)
HARDFORD CARE CENTER (1202 E SUMNER ST)
HARTFORD HLTHCARE CTR (1202 E SUMNER ST)
Colleges/universities with over 2000 students nearest to Hartford:
Waukesha County Technical College (about 19 miles; Pewaukee, WI ; Full-time enrollment: 4,415)
Carroll University (about 23 miles; Waukesha, WI ; FT enrollment: 3,313)
Concordia University-Wisconsin (about 24 miles; Mequon, WI ; FT enrollment: 5,253)
Cardinal Stritch University (about 27 miles; Milwaukee, WI ; FT enrollment: 3,595)
Marquette University (about 30 miles; Milwaukee, WI ; FT enrollment: 9,844)
Milwaukee Area Technical College (about 30 miles; Milwaukee, WI ; FT enrollment: 13,156)
University of Wisconsin-Milwaukee (about 31 miles; Milwaukee, WI ; FT enrollment: 24,196)
Public high school in Hartford: HARTFORD HIGH Students: 1,499, Location: 805 CEDAR ST, Grades: 9-12)Private high school in Hartford: ST AUGUSTINE SCHOOL Students: 59, Location: 1810 COUNTY ROAD CC, Grades: KG-12)
Public elementary/middle schools in Hartford: ROSSMAN ELEMENTARY Students: 622, Location: 600 HIGHLAND AVE, Grades: PK-5)LINCOLN ELEMENTARY Students: 569, Location: 755 S RURAL ST, Grades: PK-5)CENTRAL MIDDLE Students: 549, Location: 1100 CEDAR ST, Grades: 6-8)ADDISON ELEMENTARY Students: 461, Location: 5050 INDIAN RD, Grades: PK-5)ERIN ELEMENTARY Students: 333, Location: 6901 COUNTY HIGHWAY O, Grades: PK-8)Private elementary/middle schools in Hartford: PEACE LUTHERAN SCHOOL Students: 242, Location: 1025 PEACE LUTHERAN DR, Grades: PK-8)
ST KILIAN SCHOOL Students: 158, Location: 245 HIGH ST, Grades: PK-8)
See full list of schools located in Hartford Library in Hartford: HARTFORD PUBLIC LIBRARY Operating income: $842,606; Location: 115 N. MAIN ST.; 106,776 books ; 8,825 e-books ; 11,041 audio materials ; 4,844 video materials ; 4 local licensed databases ; 28 state licensed databases ; 200 print serial subscriptions )
User-submitted facts and corrections:
University of Wisconsin-Washington County (University is located in WEst BEnd (aprx. 15 miles from Hartford,WI) and is not currently listed
Notable locations in Hartford: (A) , Hartford Public Library (B) , Hartford City Hall (C) , Hartford Fire and Rescue (D) . Display/hide their locations on the map
Churches in Hartford include: (A) , First Baptist Church (B) , First Congregational Church of Hartford (C) , Peace Evangelical Lutheran Church (D) , Redeemer Lutheran Church (E) , Saint Johns United Church of Christ (F) , Saint Kilian Roman Catholic Church (G) . Display/hide their locations on the map
Cemeteries: (1) , Saint Killian Cemetery (2) . Display/hide their locations on the map
Reservoir: (A) . Display/hide its location on the map
Park in Hartford: (1) . Display/hide its location on the map
Hotels:
Birthplace of: Jeremy Unertl - Player of and football, John Shinners - Football player, Ronald A. Sell - Politician.
Washington County has a predicted average indoor radon screening level greater than 4 pCi/L (pico curies per liter) - Highest Potential Drinking water stations with addresses in Hartford and their reported violations in the past:
HARTFORD WATERWORKS (Population served: 13,970, Groundwater):
Past health violations:
MCL, Average - Between JUL-2005 and SEP-2009, Contaminant: Nitrate. Follow-up actions: St Compliance achieved (JUL-25-2005), St Other (JUL-26-2005), St Violation/Reminder Notice (JUL-26-2005), St Public Notif requested (JUL-26-2005), St Public Notif received (AUG-11-2005), St Compliance achieved (SEP-29-2009)
Population served: 103, Groundwater):
Past monitoring violations:
Monitoring, Check/Repeat/Confirmation - Between MAY-17-2005 and JUN-30-2005, Contaminant: Nitrate. Follow-up actions: St Public Notif requested (JUL-12-2005), St Violation/Reminder Notice (JUL-12-2005), St Compliance achieved (JUL-20-2005), St Public Notif received (JUL-26-2005)
Population served: 102, Groundwater):
Past health violations:
MCL, Average - Between JAN-01-2014 and AUG-21-2014, Contaminant: Nitrate-Nitrite. Follow-up actions: St Public Notif requested (APR-04-2014), St Public Notif received (APR-04-2014), St Public Notif issued (APR-04-2014), St Violation/Reminder Notice (APR-04-2014)
MCL, Monthly (TCR) - In AUG-2011, Contaminant: Coliform. Follow-up actions: St Public Notif requested (AUG-12-2011), St Violation/Reminder Notice (AUG-12-2011), St Boil Water Order (AUG-12-2011), St Public Notif issued (AUG-15-2011), St Public Notif received (AUG-15-2011), St Compliance achieved (OCT-07-2011)
Population served: 40, Groundwater):
Past health violations:
MCL, Monthly (TCR) - In JUN-2008, Contaminant: Coliform. Follow-up actions: St Public Notif requested (JUN-04-2008), St Violation/Reminder Notice (JUN-04-2008), St Boil Water Order (JUN-04-2008), St Public Notif issued (JUN-08-2008), St Public Notif received (JUN-16-2008), St Compliance achieved (JUN-18-2008)
MCL, Monthly (TCR) - In APR-2008, Contaminant: Coliform. Follow-up actions: St Public Notif requested (APR-23-2008), St Violation/Reminder Notice (APR-23-2008), St Public Notif received (APR-23-2008), St Public Notif issued (APR-23-2008), St Boil Water Order (APR-23-2008), St Compliance achieved (MAY-05-2008)
Population served: 25, Groundwater):
Past health violations:
MCL, Acute (TCR) - In APR-2012, Contaminant: Coliform. Follow-up actions: St Boil Water Order (APR-26-2012), St Public Notif received (APR-27-2012), St Public Notif issued (APR-27-2012), St Public Notif requested (APR-27-2012), St Violation/Reminder Notice (APR-27-2012), St Compliance achieved (MAY-03-2012)
Drinking water stations with addresses in Hartford that have no violations reported:
M J STEVENS (Population served: 610, Primary Water Source Type: Groundwater)
THE WEDGE (Address: 5327 HWY 175 Population served: 606, Primary Water Source Type: Groundwater)
ST LAWRENCE CHURCH (Population served: 104, Primary Water Source Type: Groundwater)
TRINITY LUTHERAN CHURCH (Population served: 82, Primary Water Source Type: Groundwater)
WEGNERS CEDAR LAKE INN (Population served: 75, Primary Water Source Type: Groundwater)
PIKE LAKE HOUSE (Population served: 53, Primary Water Source Type: Groundwater)
TALLY HO (Population served: 28, Primary Water Source Type: Groundwater)
SCHUBERTS HARTFORD THEATER (Population served: 25, Primary Water Source Type: Groundwater)
Average household size: This city:
2.5 peopleWisconsin:
2.4 people
Percentage of family households: This city:
65.5%Whole state:
64.4%
Percentage of households with unmarried partners: This city:
7.6%Whole state:
7.3%
Likely homosexual households (counted as self-reported same-sex unmarried-partner households)
Lesbian couples: 0.2% of all households Gay men: 0.2% of all households
People in group quarters in Hartford in 2010:
117 people in nursing facilities/skilled-nursing facilities
28 people in group homes intended for adults
8 people in other noninstitutional facilities
People in group quarters in Hartford in 2000:
99 people in nursing homes
18 people in other noninstitutional group quarters
14 people in homes for the mentally retarded
12 people in hospitals/wards and hospices for chronically ill
12 people in other hospitals or wards for chronically ill
7 people in other nonhousehold living situations
Banks with branches in Hartford (2011 data):
Hartford Savings Bank: at 1400 Schauer Drive, branch established on 1916/01/01; County Market Branch at 1566 E Sumner Street, branch established on 1998/02/16. Info updated 2006/11/03: Bank assets: $202.7 mil, Deposits: $180.8 mil, local headquarters , positive income , Commercial Lending Specialization, 4 total offices
Westbury Bank: Hartford West Branch at 25 S. Wacker Drive, branch established on 2006/08/31. Info updated 2011/07/21: Bank assets: $580.5 mil, Deposits: $524.6 mil, headquarters in West Bend, WI, negative income in the last year , Commercial Lending Specialization, 16 total offices
First Bank Financial Centre: Hartford Branch at 940 Bell Avenue, branch established on 1998/12/09. Info updated 2011/03/14: Bank assets: $713.7 mil, Deposits: $565.0 mil, headquarters in Oconomowoc, WI, positive income , Commercial Lending Specialization, 12 total offices , Holding Company: Oconomowoc Bancshares, Inc.
PNC Bank, National Association: Hartford Branch at 709 Grand Avenue, branch established on 1903/08/01. Info updated 2012/03/20: Bank assets: $263,309.6 mil, Deposits: $197,343.0 mil, headquarters in Wilmington, DE, positive income , Commercial Lending Specialization, 3085 total offices , Holding Company: Pnc Financial Services Group, Inc., The
Guaranty Bank: Thiel Street Branch at 1220 Thiel Street, branch established on 2008/03/07. Info updated 2011/07/21: Bank assets: $1,179.1 mil, Deposits: $1,102.7 mil, headquarters in Milwaukee, WI, negative income in the last year , Mortgage Lending Specialization, 166 total offices
U.S. Bank National Association: Hartford Branch at 1472 E. Sumner Street, branch established on 1986/06/30. Info updated 2012/01/30: Bank assets: $330,470.8 mil, Deposits: $236,091.5 mil, headquarters in Cincinnati, OH, positive income , 3121 total offices , Holding Company: U.S. Bancorp
Associated Bank, National Association: Hartford Branch at 1594 East Sumner Street, branch established on 1988/12/01. Info updated 2008/09/12: Bank assets: $21,715.0 mil, Deposits: $15,244.4 mil, headquarters in Green Bay, WI, positive income , Commercial Lending Specialization, 282 total offices , Holding Company: Associated Banc-Corp
The First National Bank of Hartford: The First National Bank Of Hartford at 116 West Sumner Street, branch established on 1907/01/01. Info updated 2006/11/03: Bank assets: $166.2 mil, Deposits: $145.4 mil, local headquarters , positive income , Commercial Lending Specialization, 2 total offices , Holding Company: Fnb Hartford Bancorp., Inc.
For population 15 years and over in Hartford:
Never married: 33.3%Now married: 49.9%Separated: 0.7%Widowed: 6.7%Divorced: 9.5% For population 25 years and over in Hartford:
High school or higher: 92.5%Bachelor's degree or higher: 27.4%Graduate or professional degree: 8.1%Unemployed: 2.5%Mean travel time to work (commute): 22.4 minutes
Education Gini index (Inequality in education) Here:
9.9Wisconsin average:
10.4
Religion statistics for Hartford, WI (based on Washington County data)
Religion Adherents Congregations Catholic 39,943 13 Evangelical Protestant 25,503 49 Mainline Protestant 11,157 30 Other 532 7 Orthodox 28 1 None 54,724 -
Source: Clifford Grammich, Kirk Hadaway, Richard Houseal, Dale E.Jones, Alexei Krindatch, Richie Stanley and Richard H.Taylor. 2012. 2010 U.S.Religion Census: Religious Congregations & Membership Study. Association of Statisticians of American Religious Bodies. Jones, Dale E., et al. 2002. Congregations and Membership in the United States 2000. Nashville, TN: Glenmary Research Center. Graphs represent county-level data
Food Environment Statistics: Number of grocery stores : 16This county :
1.25 / 10,000 pop.Wisconsin :
1.86 / 10,000 pop.
Number of supercenters and club stores : 1Washington County :
0.08 / 10,000 pop.State :
0.11 / 10,000 pop.
Number of convenience stores (no gas) : 2Washington County :
0.16 / 10,000 pop.Wisconsin :
0.38 / 10,000 pop.
Number of convenience stores (with gas) : 49Here :
3.83 / 10,000 pop.Wisconsin :
4.12 / 10,000 pop.
Number of full-service restaurants : 91Washington County :
7.11 / 10,000 pop.Wisconsin :
8.64 / 10,000 pop.
Adult diabetes rate : Washington County :
6.4%Wisconsin :
7.6%
Adult obesity rate : Washington County :
26.5%Wisconsin :
27.5%
Low-income preschool obesity rate : Washington County :
10.7%Wisconsin :
13.0%
Health and Nutrition: Healthy diet rate : Hartford:
50.5%Wisconsin:
49.5%
Average overall health of teeth and gums : Here:
49.0%Wisconsin:
46.6%
People feeling badly about themselves : This city:
20.1%Wisconsin:
21.4%
People not drinking alcohol at all : This city:
8.5%State:
10.2%
Average hours sleeping at night : Overweight people : Hartford:
33.4%Wisconsin:
34.0%
General health condition : Hartford:
58.4%Wisconsin:
56.3%
Average condition of hearing : This city:
79.8%Wisconsin:
78.5%
More about Health and Nutrition of Hartford, WI Residents
Local government employment and payroll (March 2022)
Function
Full-time employees
Monthly full-time payroll
Average yearly full-time wage
Part-time employees
Monthly part-time payroll
Police Protection - Officers
25 $156,570 $75,154 0 $0 Electric Power
12 $94,406 $94,406 0 $0 Streets and Highways
11 $62,241 $67,899 0 $0 Housing and Community Development (Local)
10 $43,143 $51,772 4 $5,839 Police - Other
9 $59,055 $78,740 6 $8,268 Parks and Recreation
8 $39,698 $59,547 66 $17,092 Financial Administration
8 $39,239 $58,859 0 $0 Other Government Administration
7 $44,509 $76,301 10 $4,522 Local Libraries
5 $21,020 $50,448 11 $18,647 Water Supply
5 $28,892 $69,341 0 $0 Sewerage
5 $31,033 $74,479 0 $0 Health
4 $21,160 $63,480 18 $14,183 Other and Unallocable
4 $17,612 $52,836 56 $4,938 Fire - Other
3 $16,020 $64,080 0 $0 Transit
2 $7,664 $45,984 3 $3,866 Firefighters
0 $0 29 $9,393 Solid Waste Management
0 $0 1 $266
Totals for Government
118 $682,264 $69,383 204 $87,013
Hartford government finances - Expenditure in 2021 (per resident):
Construction - Regular Highways: $774,000 ($48.90)
General - Other: $288,000 ($18.19)Parks and Recreation: $134,000 ($8.47)Police Protection: $41,000 ($2.59)Local Fire Protection: $8,000 ($0.51)Libraries: $4,000 ($0.25)Current Operations - Electric Utilities: $24,792,000 ($1566.24)
Police Protection: $4,436,000 ($280.25)Water Utilities: $3,482,000 ($219.98)Sewerage: $3,252,000 ($205.45)Parks and Recreation: $1,402,000 ($88.57)Regular Highways: $1,334,000 ($84.28)Libraries: $999,000 ($63.11)Solid Waste Management: $888,000 ($56.10)Health - Other: $848,000 ($53.57)General - Other: $713,000 ($45.04)Central Staff Services: $385,000 ($24.32)Air Transportation: $361,000 ($22.81)Local Fire Protection: $354,000 ($22.36)Natural Resources - Other: $310,000 ($19.58)Financial Administration: $239,000 ($15.10)Housing and Community Development: $232,000 ($14.66)Transit Utilities: $222,000 ($14.02)Miscellaneous Commercial Activities - Other: $210,000 ($13.27)Protective Inspection and Regulation - Other: $201,000 ($12.70)Judicial and Legal Services: $113,000 ($7.14)General Public Buildings: $85,000 ($5.37)General - Interest on Debt: $1,080,000 ($68.23)
Other Capital Outlay - General - Other: $641,000 ($40.50)
Regular Highways: $302,000 ($19.08)Solid Waste Management: $83,000 ($5.24)Total Salaries and Wages: $8,912,000 ($563.02)
Hartford government finances - Revenue in 2021 (per resident):
Charges - Sewerage: $3,600,000 ($227.43)
Other: $918,000 ($57.99)Parks and Recreation: $462,000 ($29.19)Solid Waste Management: $455,000 ($28.74)Air Transportation: $144,000 ($9.10)Miscellaneous Commercial Activities: $50,000 ($3.16)Regular Highways: $44,000 ($2.78)Federal Intergovernmental - General Local Government Support: $290,000 ($18.32)
Transit Utilities: $68,000 ($4.30)Other: $42,000 ($2.65)Local Intergovernmental - Other: $2,428,000 ($153.39)
Sewerage: $401,000 ($25.33)Miscellaneous - General Revenue - Other: $1,852,000 ($117.00)
Interest Earnings: $327,000 ($20.66)Fines and Forfeits: $186,000 ($11.75)Donations From Private Sources: $162,000 ($10.23)Special Assessments: $114,000 ($7.20)Sale of Property: $60,000 ($3.79)Rents: $45,000 ($2.84)Revenue - Electric Utilities: $25,604,000 ($1617.54)
Water Utilities: $3,248,000 ($205.19)Transit Utilities: $49,000 ($3.10)State Intergovernmental - General Local Government Support: $1,034,000 ($65.32)
Highways: $702,000 ($44.35)Education: $318,000 ($20.09)Other: $95,000 ($6.00)Transit Utilities: $64,000 ($4.04)Tax - Property: $8,199,000 ($517.97)
Other License: $473,000 ($29.88)Other Selective Sales: $36,000 ($2.27)Other: $21,000 ($1.33)Occupation and Business License - Other: $13,000 ($0.82)
Hartford government finances - Debt in 2021 (per resident):
Long Term Debt - Outstanding Unspecified Public Purpose: $23,830,000 ($1505.46)
Beginning Outstanding - Unspecified Public Purpose: $18,567,000 ($1172.97)Issue, Unspecified Public Purpose: $9,823,000 ($620.57)Retired Unspecified Public Purpose: $4,560,000 ($288.08)Short Term Debt Outstanding - Beginning: $9,330,000 ($589.42)
End of Fiscal Year: $7,505,000 ($474.13)
Hartford government finances - Cash and Securities in 2021 (per resident):
Bond Funds - Cash and Securities: $3,953,000 ($249.73)
Other Funds - Cash and Securities: $38,845,000 ($2454.04)
Sinking Funds - Cash and Securities: $2,612,000 ($165.01)
Businesses in Hartford, WI
Name Count Name Count
Advance Auto Parts 1 Nike 2 AmericInn 1 Pizza Hut 1 DHL 1 RadioShack 1 Dairy Queen 1 Sears 1 Domino's Pizza 1 Super 8 1 FedEx 2 Taco Bell 1 Ford 1 U-Haul 2 H&R Block 1 UPS 2 Kmart 1 Vans 1 Lane Furniture 1 Walgreens 1 Maurices 1 Walmart 1 McDonald's 1
Strongest AM radio stations in Hartford:
WTKM (1540 AM; daytime; 0 kW; HARTFORD, WI)
WTMJ (620 AM; 50 kW; MILWAUKEE, WI; Owner: JOURNAL BROADCAST CORPORATION)
WISN (1130 AM; 50 kW; MILWAUKEE, WI; Owner: CAPSTAR TX LIMITED PARTNERSHIP)
WKSH (1640 AM; 10 kW; SUSSEX, WI; Owner: ABC, INC.)
WBKV (1470 AM; 2 kW; WEST BEND, WI; Owner: WEST BEND BROADCASTING CO.)
WNAM (1280 AM; 50 kW; NEENAH-MENASHA, WI; Owner: CUMULUS LICENSING CORP.)
WAUK (1510 AM; daytime; 10 kW; WAUKESHA, WI; Owner: WALT-WEST WISCONSIN, INC.)
WGN (720 AM; 50 kW; CHICAGO, IL; Owner: WGN CONTINENTAL BROADCASTING CO.)
WSCR (670 AM; 50 kW; CHICAGO, IL; Owner: INFINITY BROADCASTING OPERATIONS, INC.)
WBBM (780 AM; 50 kW; CHICAGO, IL; Owner: INFINITY BROADCASTING OPERATIONS, INC.)
WHBY (1150 AM; 25 kW; KIMBERLY, WI; Owner: WOODWARD COMMUNICATIONS, INC.)
WOKY (920 AM; 5 kW; MILWAUKEE, WI; Owner: CLEAR CHANNEL BROADCASTING LICENSES, INC.)
WRRD (540 AM; 0 kW; JACKSON, WI; Owner: SCA LICENSE CORPORATION)
Strongest FM radio stations in Hartford:
WTKM-FM (104.9 FM; HARTFORD, WI; Owner: KETTLE MORAINE B/CTING COMPANY, INC.)
WBWI-FM (92.5 FM; WEST BEND, WI; Owner: WEST BEND BROADCASTING CO.)
WMDC (98.7 FM; MAYVILLE, WI; Owner: RADIO PLUS, INC.)
WHAD (90.7 FM; DELAFIELD, WI; Owner: STATE OF WISCONSIN - EDUCATIONAL COMMUNICATIONS BOARD)
WLTQ (97.3 FM; MILWAUKEE, WI; Owner: CAPSTAR TX LIMITED PARTNERSHIP)
WMIL-FM (106.1 FM; WAUKESHA, WI; Owner: CLEAR CHANNEL BROADCASTING LICENSES, INC.)
WJZI (93.3 FM; MILWAUKEE, WI; Owner: MILWAUKEE RADIO ALLIANCE, LLC)
WKTI-FM (94.5 FM; MILWAUKEE, WI; Owner: JOURNAL BROADCAST CORPORATION)
WUWM (89.7 FM; MILWAUKEE, WI; Owner: BOARD OF REGENTS, UNIVERSITY OF WISCONSIN SYSTEM)
WXSS (103.7 FM; WAUWATOSA, WI; Owner: ENTERCOM MILWAUKEE LICENSE, LLC)
WKLH (96.5 FM; MILWAUKEE, WI; Owner: LAKEFRONT COMMUNICATIONS, LLC)
WLUM-FM (102.1 FM; MILWAUKEE, WI; Owner: MILWAUKEE RADIO ALLIANCE, LLC)
WMWK (88.1 FM; MILWAUKEE, WI; Owner: FAMILY STATIONS, INC.)
WFZH (105.3 FM; MUKWONAGO, WI; Owner: CARON BROADCASTING, INC.)
WFMR (106.9 FM; BROOKFIELD, WI; Owner: SAGA COMMUNICATIONS OF MILWAUKEE, LLC)
WRIT-FM (95.7 FM; MILWAUKEE, WI; Owner: CLEAR CHANNEL BROADCASTING LICENSES, INC.)
WFDL-FM (97.7 FM; LOMIRA, WI; Owner: RADIO PLUS OF FOND DU LAC, INC.)
WVCY-FM (107.7 FM; MILWAUKEE, WI; Owner: VCY AMERICA, INC.)
WLZR (102.9 FM; MILWAUKEE, WI; Owner: LAKEFRONT COMMUNICATIONS, LLC)
WJMR-FM (98.3 FM; MENOMONEE FALLS, WI; Owner: LAKEFRONT COMMUNICATIONS, LLC)
TV broadcast stations around Hartford:
WWRS-TV (Channel 52; MAYVILLE, WI; Owner: NATIONAL MINORITY T.V., INC.)
WITI (Channel 6; MILWAUKEE, WI; Owner: WITI LICENSE,INC.)
WDJT-TV (Channel 58; MILWAUKEE, WI; Owner: WDJT-TV LIMITED PARTNERSHIP)
WISN-TV (Channel 12; MILWAUKEE, WI; Owner: WISN HEARST-ARGYLE TV, INC. (CA CORP.))
WMMF-TV (Channel 68; FOND DU LAC, WI; Owner: PAPPAS TELECASTING OF WISCONSIN, A CALIFORNIA LTD PARTNRSHP)
WPXE (Channel 55; KENOSHA, WI; Owner: PAXSON MILWAUKEE LICENSE, INC.)
WMVS (Channel 10; MILWAUKEE, WI; Owner: MILWAUKEE AREA TECHNICAL COLLEGE DISTRICT BOARD)
WMVT (Channel 36; MILWAUKEE, WI; Owner: MILWAUKEE AREA TECHNICAL COLLEGE DISTRICT BOARD)
WMLW-CA (Channel 46; MILWAUKEE, WI; Owner: CHANNEL 41 AND 63 LIMITED PARTNERSHIP)
W63CU (Channel 63; MILWAUKEE, WI; Owner: CHANNEL 41 AND 63 LIMITED PARTNERSHIP)
WCGV-TV (Channel 24; MILWAUKEE, WI; Owner: WCGV LICENSEE, LLC)
WVTV (Channel 18; MILWAUKEE, WI; Owner: WVTV LICENSEE, INC.)
WTMJ-TV (Channel 4; MILWAUKEE, WI; Owner: JOURNAL BROADCAST CORPORATION)
WVCY-TV (Channel 30; MILWAUKEE, WI; Owner: VCY AMERICA, INC.)
WMKE-CA (Channel 7; MILWAUKEE, WI; Owner: KM LPTV OF MILWAUKEE, L.L.C.)
WJJA (Channel 49; RACINE, WI; Owner: TV-49, INC.)
WTAS-LP (Channel 43; WAUKESHA, WI; Owner: WAUKESHA TOWER ASSOCIATES)
National Bridge Inventory (NBI) Statistics 11 Number of bridges56ft / 17.3m Total length56,067 Total average daily traffic981 Total average daily truck traffic70,820 Total future (year 2039) average daily traffic
New bridges - historical statistics
1 1940-1949 2 1980-1989 3 1990-1999 1 2000-2009 2 2010-2019 2 2020-2022
See full National Bridge Inventory statistics for Hartford, WI
Home Mortgage Disclosure Act Aggregated Statistics For Year 2009(Based on 1 full and 1 partial tracts) A) FHA, FSA/RHS & VA B) Conventional C) Refinancings D) Home Improvement Loans E) Loans on Dwellings For 5+ Families F) Non-occupant Loans on Number Average Value Number Average Value Number Average Value Number Average Value Number Average Value Number Average Value
LOANS ORIGINATED 34 $150,348 41 $145,235 259 $142,461 14 $63,736 2 $504,320 8 $139,671 APPLICATIONS APPROVED, NOT ACCEPTED 2 $116,380 2 $92,080 17 $134,114 1 $15,620 0 $0 1 $68,000 APPLICATIONS DENIED 2 $189,525 3 $128,257 59 $150,391 5 $44,588 0 $0 2 $150,425 APPLICATIONS WITHDRAWN 0 $0 3 $114,560 40 $152,586 1 $46,000 0 $0 1 $113,000 FILES CLOSED FOR INCOMPLETENESS 3 $144,607 1 $87,850 13 $154,998 0 $0 0 $0 0 $0
Aggregated Statistics For Year 2008(Based on 1 full and 1 partial tracts) A) FHA, FSA/RHS & VA B) Conventional C) Refinancings D) Home Improvement Loans E) Loans on Dwellings For 5+ Families F) Non-occupant Loans on Number Average Value Number Average Value Number Average Value Number Average Value Number Average Value Number Average Value
LOANS ORIGINATED 22 $160,089 62 $136,453 137 $141,422 19 $32,483 2 $462,925 15 $110,429 APPLICATIONS APPROVED, NOT ACCEPTED 1 $120,000 4 $132,105 17 $153,371 3 $37,003 0 $0 0 $0 APPLICATIONS DENIED 1 $161,140 2 $97,445 49 $157,624 12 $64,352 0 $0 1 $10,000 APPLICATIONS WITHDRAWN 1 $120,000 8 $169,869 36 $153,292 1 $28,310 0 $0 1 $183,110 FILES CLOSED FOR INCOMPLETENESS 0 $0 3 $118,430 8 $186,255 1 $157,000 0 $0 0 $0
Aggregated Statistics For Year 2007(Based on 1 full and 1 partial tracts) A) FHA, FSA/RHS & VA B) Conventional C) Refinancings D) Home Improvement Loans E) Loans on Dwellings For 5+ Families F) Non-occupant Loans on Number Average Value Number Average Value Number Average Value Number Average Value Number Average Value Number Average Value
LOANS ORIGINATED 18 $165,421 123 $131,340 121 $131,676 31 $38,385 3 $659,577 12 $134,232 APPLICATIONS APPROVED, NOT ACCEPTED 0 $0 8 $113,728 20 $125,760 4 $58,570 1 $126,000 1 $72,500 APPLICATIONS DENIED 1 $189,680 14 $159,509 88 $146,925 20 $51,082 0 $0 3 $278,043 APPLICATIONS WITHDRAWN 1 $138,000 16 $149,121 48 $158,096 2 $73,330 0 $0 3 $104,520 FILES CLOSED FOR INCOMPLETENESS 0 $0 2 $85,860 19 $131,426 1 $146,290 0 $0 1 $80,170
Aggregated Statistics For Year 2006(Based on 1 full and 1 partial tracts) A) FHA, FSA/RHS & VA B) Conventional C) Refinancings D) Home Improvement Loans E) Loans on Dwellings For 5+ Families F) Non-occupant Loans on G) Loans On Manufactured Number Average Value Number Average Value Number Average Value Number Average Value Number Average Value Number Average Value Number Average Value
LOANS ORIGINATED 12 $161,748 144 $129,720 154 $118,912 24 $60,346 4 $252,522 18 $142,685 1 $120,000 APPLICATIONS APPROVED, NOT ACCEPTED 0 $0 12 $108,567 33 $114,825 5 $51,874 0 $0 2 $99,675 0 $0 APPLICATIONS DENIED 0 $0 15 $103,579 77 $146,491 13 $62,975 0 $0 3 $295,847 0 $0 APPLICATIONS WITHDRAWN 1 $143,000 11 $103,614 54 $125,904 5 $48,034 0 $0 2 $85,930 0 $0 FILES CLOSED FOR INCOMPLETENESS 0 $0 5 $122,190 23 $149,503 0 $0 0 $0 0 $0 0 $0
Aggregated Statistics For Year 2005(Based on 1 full and 1 partial tracts) A) FHA, FSA/RHS & VA B) Conventional C) Refinancings D) Home Improvement Loans E) Loans on Dwellings For 5+ Families F) Non-occupant Loans on G) Loans On Manufactured Number Average Value Number Average Value Number Average Value Number Average Value Number Average Value Number Average Value Number Average Value
LOANS ORIGINATED 8 $154,915 211 $132,454 223 $125,737 28 $51,806 4 $850,835 18 $118,715 0 $0 APPLICATIONS APPROVED, NOT ACCEPTED 1 $241,950 12 $157,520 32 $110,382 1 $22,230 0 $0 3 $142,797 0 $0 APPLICATIONS DENIED 1 $56,890 21 $137,748 80 $138,245 13 $30,645 0 $0 4 $48,890 1 $87,050 APPLICATIONS WITHDRAWN 0 $0 12 $159,137 40 $156,695 3 $35,353 0 $0 3 $111,883 0 $0 FILES CLOSED FOR INCOMPLETENESS 1 $196,000 7 $109,387 37 $138,025 2 $33,945 0 $0 3 $92,333 0 $0
Aggregated Statistics For Year 2004(Based on 1 full and 1 partial tracts) A) FHA, FSA/RHS & VA B) Conventional C) Refinancings D) Home Improvement Loans E) Loans on Dwellings For 5+ Families F) Non-occupant Loans on G) Loans On Manufactured Number Average Value Number Average Value Number Average Value Number Average Value Number Average Value Number Average Value Number Average Value
LOANS ORIGINATED 6 $175,450 201 $133,891 210 $123,688 24 $59,181 5 $518,194 16 $129,197 2 $24,345 APPLICATIONS APPROVED, NOT ACCEPTED 1 $104,250 11 $119,963 18 $111,168 5 $75,194 0 $0 2 $92,400 0 $0 APPLICATIONS DENIED 1 $194,150 9 $134,007 64 $117,191 13 $44,005 0 $0 0 $0 0 $0 APPLICATIONS WITHDRAWN 2 $127,490 18 $122,673 41 $131,378 2 $11,730 0 $0 1 $128,340 0 $0 FILES CLOSED FOR INCOMPLETENESS 0 $0 4 $94,825 20 $133,637 2 $78,500 0 $0 0 $0 0 $0
Aggregated Statistics For Year 2003(Based on 1 full and 1 partial tracts) A) FHA, FSA/RHS & VA B) Conventional C) Refinancings D) Home Improvement Loans E) Loans on Dwellings For 5+ Families F) Non-occupant Loans on Number Average Value Number Average Value Number Average Value Number Average Value Number Average Value Number Average Value
LOANS ORIGINATED 13 $139,722 160 $128,771 459 $106,897 15 $19,805 5 $360,960 37 $109,165 APPLICATIONS APPROVED, NOT ACCEPTED 0 $0 7 $133,246 34 $111,199 2 $26,495 0 $0 1 $76,730 APPLICATIONS DENIED 1 $58,740 11 $122,922 103 $112,148 4 $31,765 0 $0 1 $106,630 APPLICATIONS WITHDRAWN 1 $101,000 12 $136,485 57 $115,172 1 $10,000 0 $0 3 $91,810 FILES CLOSED FOR INCOMPLETENESS 0 $0 2 $88,090 12 $118,547 1 $60,590 0 $0 1 $111,940
Aggregated Statistics For Year 2002(Based on 1 full and 1 partial tracts) A) FHA, FSA/RHS & VA B) Conventional C) Refinancings D) Home Improvement Loans E) Loans on Dwellings For 5+ Families F) Non-occupant Loans on Number Average Value Number Average Value Number Average Value Number Average Value Number Average Value Number Average Value
LOANS ORIGINATED 21 $134,946 161 $111,710 371 $104,100 21 $23,526 3 $469,577 23 $120,761 APPLICATIONS APPROVED, NOT ACCEPTED 0 $0 4 $134,290 28 $99,856 2 $12,335 0 $0 1 $189,210 APPLICATIONS DENIED 1 $92,350 8 $93,268 66 $106,181 6 $8,995 0 $0 1 $53,980 APPLICATIONS WITHDRAWN 0 $0 8 $144,405 33 $94,075 3 $43,437 0 $0 2 $56,845 FILES CLOSED FOR INCOMPLETENESS 2 $87,575 2 $110,450 9 $90,112 0 $0 0 $0 1 $105,870
Aggregated Statistics For Year 2001(Based on 1 full and 1 partial tracts) A) FHA, FSA/RHS & VA B) Conventional C) Refinancings D) Home Improvement Loans E) Loans on Dwellings For 5+ Families F) Non-occupant Loans on Number Average Value Number Average Value Number Average Value Number Average Value Number Average Value Number Average Value
LOANS ORIGINATED 11 $121,498 125 $105,941 272 $100,935 29 $25,189 4 $682,432 17 $112,598 APPLICATIONS APPROVED, NOT ACCEPTED 2 $111,755 5 $94,290 15 $99,599 3 $8,520 0 $0 2 $141,055 APPLICATIONS DENIED 2 $109,500 15 $82,242 42 $81,763 5 $8,010 0 $0 1 $135,000 APPLICATIONS WITHDRAWN 1 $119,070 13 $100,505 32 $101,230 3 $24,710 0 $0 2 $95,880 FILES CLOSED FOR INCOMPLETENESS 0 $0 3 $71,487 7 $109,720 0 $0 0 $0 0 $0
Aggregated Statistics For Year 2000(Based on 1 full and 1 partial tracts) A) FHA, FSA/RHS & VA B) Conventional C) Refinancings D) Home Improvement Loans E) Loans on Dwellings For 5+ Families F) Non-occupant Loans on Number Average Value Number Average Value Number Average Value Number Average Value Number Average Value Number Average Value
LOANS ORIGINATED 10 $109,399 105 $103,152 68 $78,749 27 $15,153 2 $920,270 13 $79,397 APPLICATIONS APPROVED, NOT ACCEPTED 1 $102,000 4 $86,455 10 $90,857 3 $10,840 0 $0 0 $0 APPLICATIONS DENIED 0 $0 9 $78,548 31 $85,045 11 $26,236 0 $0 0 $0 APPLICATIONS WITHDRAWN 0 $0 6 $89,013 20 $67,251 0 $0 0 $0 0 $0 FILES CLOSED FOR INCOMPLETENESS 1 $134,950 4 $98,168 4 $95,300 0 $0 0 $0 0 $0
Aggregated Statistics For Year 1999(Based on 1 full and 1 partial tracts) A) FHA, FSA/RHS & VA B) Conventional C) Refinancings D) Home Improvement Loans E) Loans on Dwellings For 5+ Families F) Non-occupant Loans on Number Average Value Number Average Value Number Average Value Number Average Value Number Average Value Number Average Value
LOANS ORIGINATED 17 $118,576 129 $102,221 125 $72,326 20 $27,243 3 $325,787 20 $80,718 APPLICATIONS APPROVED, NOT ACCEPTED 1 $106,000 7 $91,887 13 $105,692 2 $17,425 0 $0 1 $72,020 APPLICATIONS DENIED 1 $107,140 11 $100,264 24 $86,028 4 $9,318 0 $0 2 $101,695 APPLICATIONS WITHDRAWN 3 $107,843 5 $118,422 26 $94,668 2 $86,265 1 $110,000 1 $36,140 FILES CLOSED FOR INCOMPLETENESS 2 $140,500 6 $64,765 13 $82,642 0 $0 0 $0 0 $0
Detailed HMDA statistics for the following Tracts:
4401.01
, 4402.00
Private Mortgage Insurance Companies Aggregated Statistics For Year 2009(Based on 1 full and 1 partial tracts) A) Conventional B) Refinancings Number Average Value Number Average Value
LOANS ORIGINATED 17 $146,177 11 $175,965 APPLICATIONS APPROVED, NOT ACCEPTED 1 $123,570 2 $138,325 APPLICATIONS DENIED 0 $0 3 $173,110 APPLICATIONS WITHDRAWN 0 $0 1 $175,310 FILES CLOSED FOR INCOMPLETENESS 0 $0 0 $0
Aggregated Statistics For Year 2008(Based on 1 full and 1 partial tracts) A) Conventional B) Refinancings C) Non-occupant Loans on Number Average Value Number Average Value Number Average Value
LOANS ORIGINATED 19 $165,555 16 $172,373 1 $108,000 APPLICATIONS APPROVED, NOT ACCEPTED 6 $157,952 8 $190,554 0 $0 APPLICATIONS DENIED 0 $0 1 $185,750 0 $0 APPLICATIONS WITHDRAWN 0 $0 0 $0 0 $0 FILES CLOSED FOR INCOMPLETENESS 0 $0 0 $0 0 $0
Aggregated Statistics For Year 2007(Based on 1 full and 1 partial tracts) A) Conventional B) Refinancings C) Non-occupant Loans on Number Average Value Number Average Value Number Average Value
LOANS ORIGINATED 40 $156,362 17 $183,386 1 $141,030 APPLICATIONS APPROVED, NOT ACCEPTED 5 $170,846 2 $222,985 0 $0 APPLICATIONS DENIED 0 $0 1 $200,000 0 $0 APPLICATIONS WITHDRAWN 0 $0 0 $0 0 $0 FILES CLOSED FOR INCOMPLETENESS 0 $0 0 $0 0 $0
Aggregated Statistics For Year 2006(Based on 1 full and 1 partial tracts) A) Conventional B) Refinancings Number Average Value Number Average Value
LOANS ORIGINATED 32 $153,059 11 $185,527 APPLICATIONS APPROVED, NOT ACCEPTED 3 $172,407 2 $129,915 APPLICATIONS DENIED 0 $0 0 $0 APPLICATIONS WITHDRAWN 1 $149,000 1 $194,860 FILES CLOSED FOR INCOMPLETENESS 0 $0 0 $0
Aggregated Statistics For Year 2005(Based on 1 full and 1 partial tracts) A) Conventional B) Refinancings Number Average Value Number Average Value
LOANS ORIGINATED 38 $159,825 16 $166,492 APPLICATIONS APPROVED, NOT ACCEPTED 2 $160,745 3 $131,453 APPLICATIONS DENIED 0 $0 0 $0 APPLICATIONS WITHDRAWN 2 $110,985 1 $178,690 FILES CLOSED FOR INCOMPLETENESS 0 $0 0 $0
Aggregated Statistics For Year 2004(Based on 1 full and 1 partial tracts) A) Conventional B) Refinancings Number Average Value Number Average Value
LOANS ORIGINATED 49 $152,238 22 $144,160 APPLICATIONS APPROVED, NOT ACCEPTED 6 $147,738 3 $139,770 APPLICATIONS DENIED 0 $0 0 $0 APPLICATIONS WITHDRAWN 4 $117,192 0 $0 FILES CLOSED FOR INCOMPLETENESS 0 $0 0 $0
Aggregated Statistics For Year 2003(Based on 1 full and 1 partial tracts) A) Conventional B) Refinancings C) Non-occupant Loans on Number Average Value Number Average Value Number Average Value
LOANS ORIGINATED 51 $140,676 50 $133,454 0 $0 APPLICATIONS APPROVED, NOT ACCEPTED 3 $137,293 11 $123,762 1 $140,870 APPLICATIONS DENIED 0 $0 1 $73,290 0 $0 APPLICATIONS WITHDRAWN 1 $178,810 2 $116,425 0 $0 FILES CLOSED FOR INCOMPLETENESS 1 $95,000 0 $0 0 $0
Aggregated Statistics For Year 2002(Based on 1 full and 1 partial tracts) A) Conventional B) Refinancings C) Non-occupant Loans on Number Average Value Number Average Value Number Average Value
LOANS ORIGINATED 56 $123,110 40 $124,316 1 $127,000 APPLICATIONS APPROVED, NOT ACCEPTED 6 $131,395 15 $118,387 0 $0 APPLICATIONS DENIED 1 $45,780 0 $0 0 $0 APPLICATIONS WITHDRAWN 1 $111,000 2 $120,315 0 $0 FILES CLOSED FOR INCOMPLETENESS 1 $71,180 0 $0 0 $0
Aggregated Statistics For Year 2001(Based on 1 full and 1 partial tracts) A) Conventional B) Refinancings Number Average Value Number Average Value
LOANS ORIGINATED 41 $119,570 40 $124,752 APPLICATIONS APPROVED, NOT ACCEPTED 3 $124,190 6 $110,377 APPLICATIONS DENIED 0 $0 0 $0 APPLICATIONS WITHDRAWN 1 $89,000 2 $119,760 FILES CLOSED FOR INCOMPLETENESS 0 $0 0 $0
Aggregated Statistics For Year 2000(Based on 1 full and 1 partial tracts) A) Conventional B) Refinancings C) Non-occupant Loans on Number Average Value Number Average Value Number Average Value
LOANS ORIGINATED 43 $110,200 6 $123,532 1 $118,280 APPLICATIONS APPROVED, NOT ACCEPTED 4 $102,180 0 $0 0 $0 APPLICATIONS DENIED 2 $91,030 0 $0 0 $0 APPLICATIONS WITHDRAWN 0 $0 0 $0 0 $0 FILES CLOSED FOR INCOMPLETENESS 0 $0 0 $0 0 $0
Aggregated Statistics For Year 1999(Based on 1 full and 1 partial tracts) A) Conventional B) Refinancings Number Average Value Number Average Value
LOANS ORIGINATED 55 $108,954 14 $105,422 APPLICATIONS APPROVED, NOT ACCEPTED 4 $98,558 2 $126,110 APPLICATIONS DENIED 0 $0 0 $0 APPLICATIONS WITHDRAWN 1 $139,290 0 $0 FILES CLOSED FOR INCOMPLETENESS 0 $0 0 $0
Detailed PMIC statistics for the following Tracts:
4401.01
, 4402.00 Fire-safe hotels and motels in Hartford, Wisconsin:
Super 8 Motel Hartford, 1539 E Sumner St, Hartford, Wisconsin 53027 Phone: (262) 673-7431, Fax: (262) 673-3080
COBBLESTONE HOTEL AND SUITES, 101 PARK Ave, Hartford, Wisconsin 53027 Phone: (262) 670-6010
All 2 fire-safe hotels and motels in Hartford, Wisconsin Hartford compared to Wisconsin state average:
Unemployed percentage significantly below state average. Black race population percentage significantly below state average. Median age below state average. Foreign-born population percentage below state average. House age below state average.
#95 on the list of "Top 101 cities with largest percentage of males in occupations: production occupations (population 5,000+)"
#99 on the list of "Top 101 cities with the most residents born in Iraq (population 500+)"
#38 (53086) on the list of "Top 101 zip codes with the largest percentage of German first ancestries (pop 5,000+)"
#7 on the list of "Top 101 counties with the lowest percentage of residents relocating to foreign countries in 2011"
#28 on the list of "Top 101 counties with the lowest percentage of residents relocating from foreign countries between 2010 and 2011"
#46 on the list of "Top 101 counties with the largest number of people without health insurance coverage in 2000 (pop. 50,000+)"
#59 on the list of "Top 101 counties with the largest decrease in the number of births per 1000 residents 2000-2006 to 2007-2013 (pop 50,000+)"
#73 on the list of "Top 101 counties with the largest number of children under 18 without health insurance coverage in 2000 (pop. 50,000+)"
Top Patent Applicants
Mark David Hobbs (16)
Mark Hobbs (12)
Richard Nicoson (12)
Brandon M. Batzler (10)
Glenn W. Andersen (10)
William F. Mcmahon (10)
Jonathan P. Lobert (10)
Joel H. Mandel (9)
Todd A. Kahle (9)
Joseph A. Yustus (8)
Total of 336 patent applications in 2008-2024.


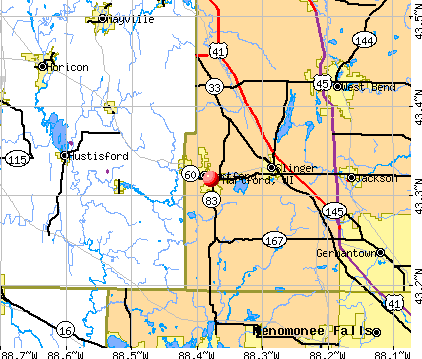


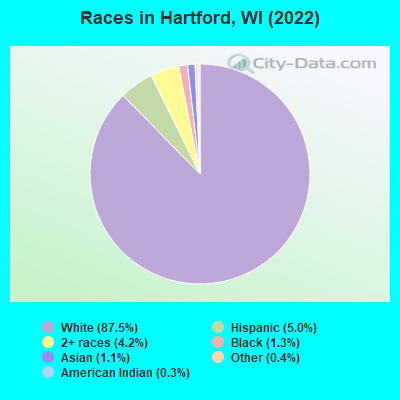
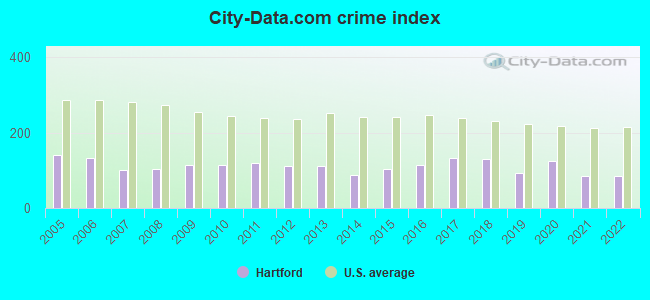
 Recent articles from our blog. Our writers, many of them Ph.D. graduates or candidates, create easy-to-read articles on a wide variety of topics.

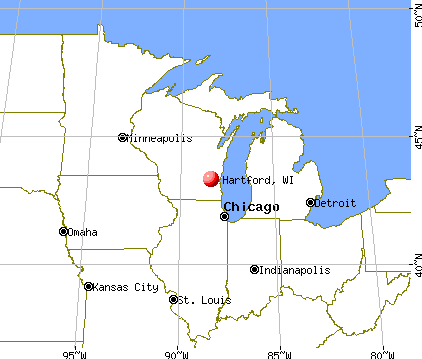
 (22.5 miles
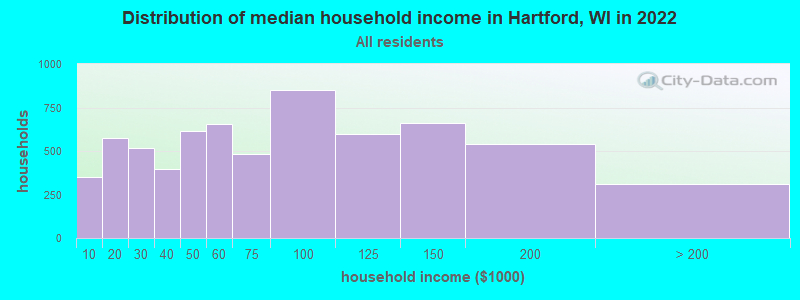
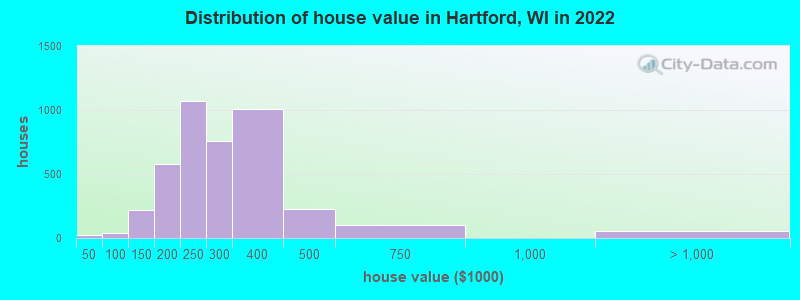

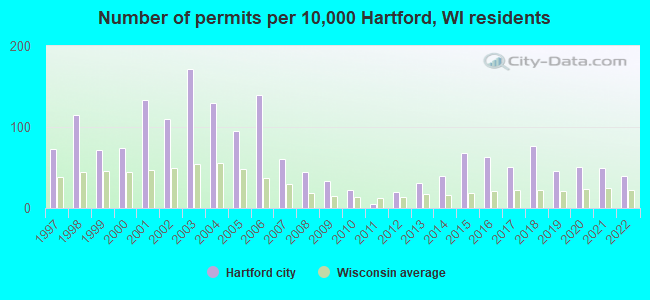
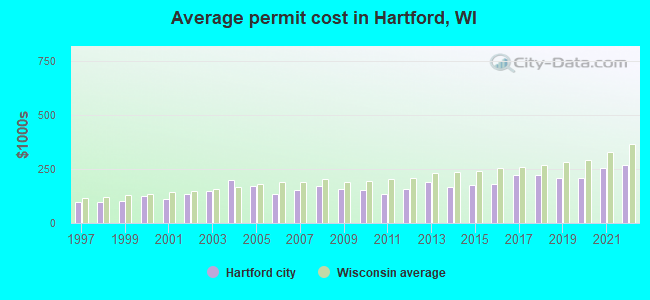
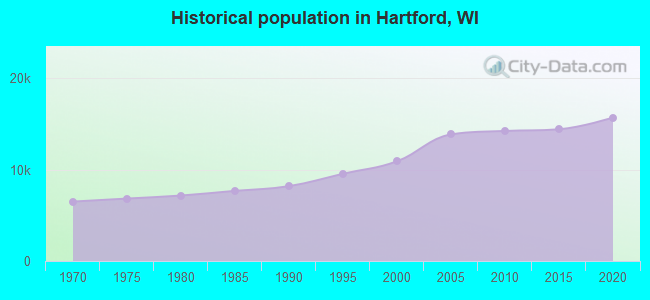
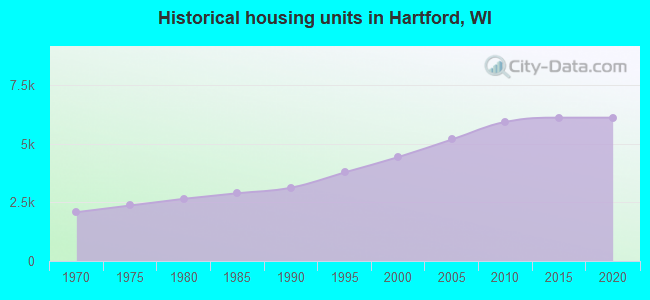
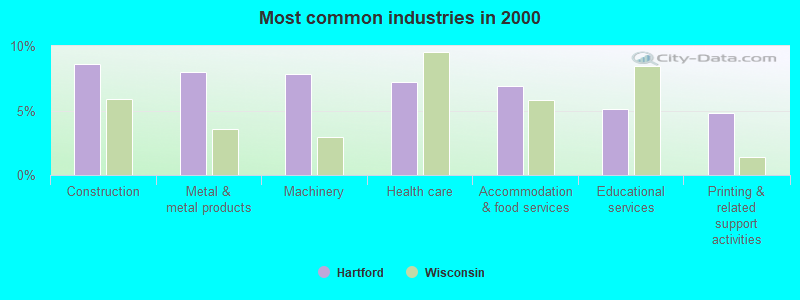
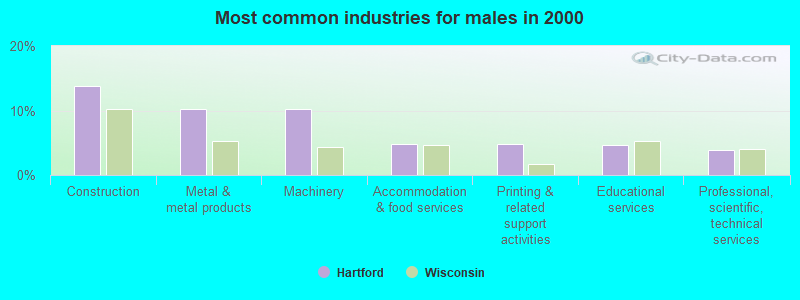
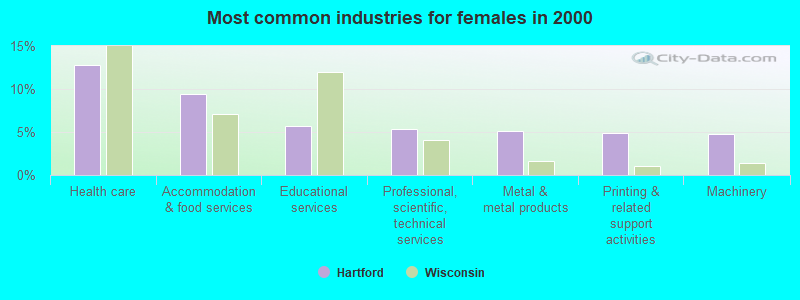
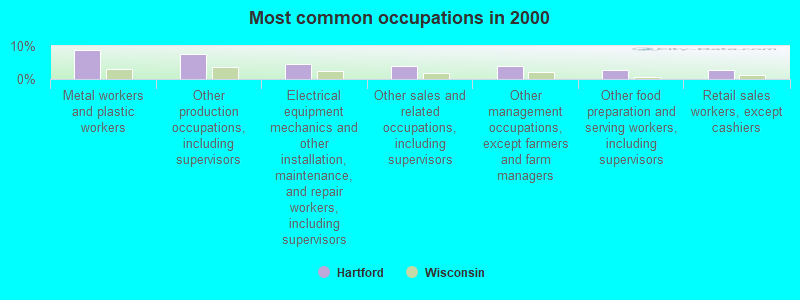
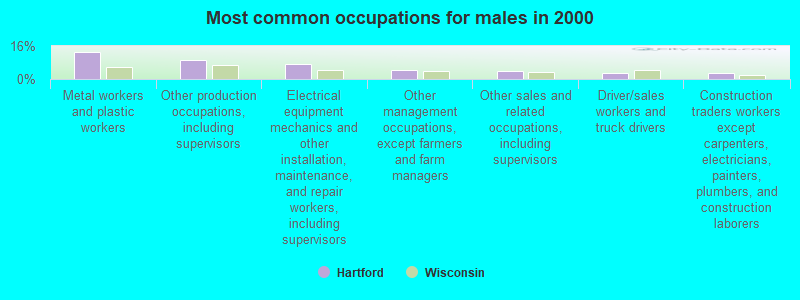
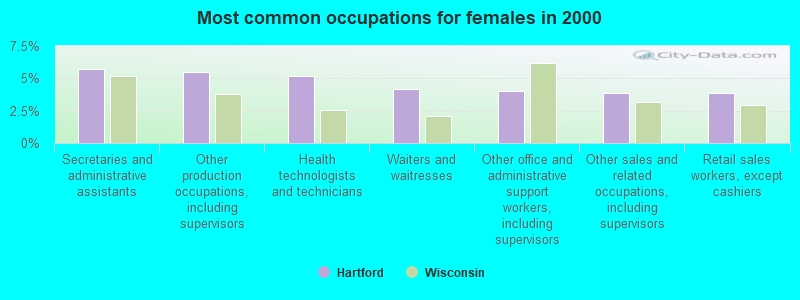
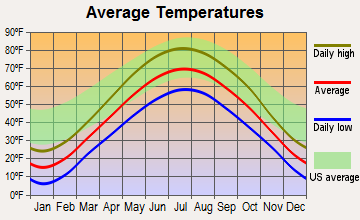
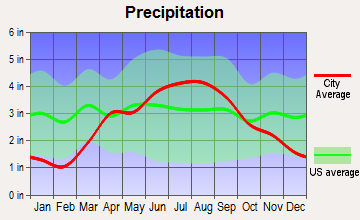
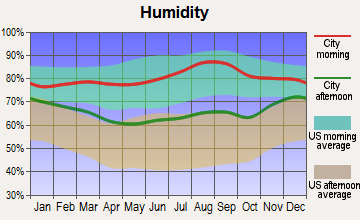
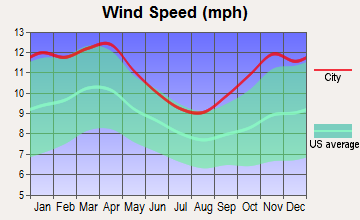
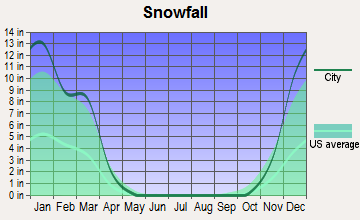
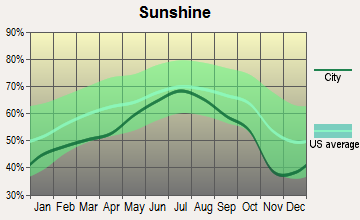
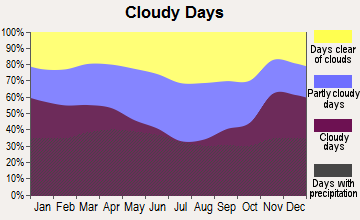


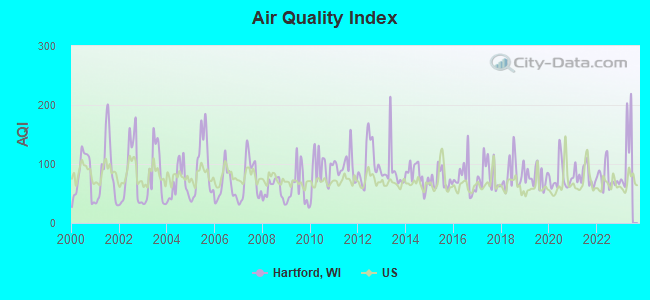
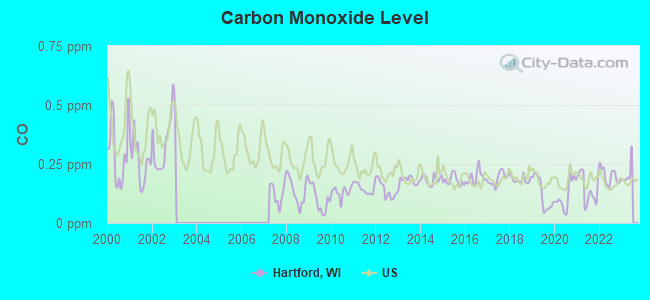
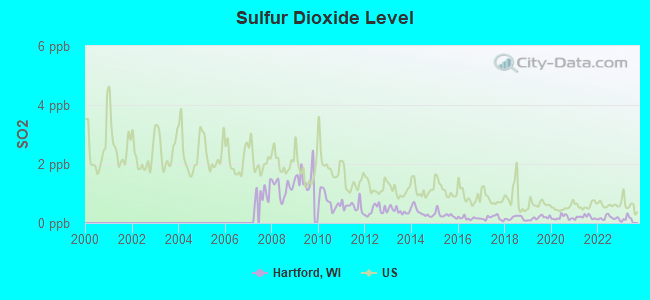
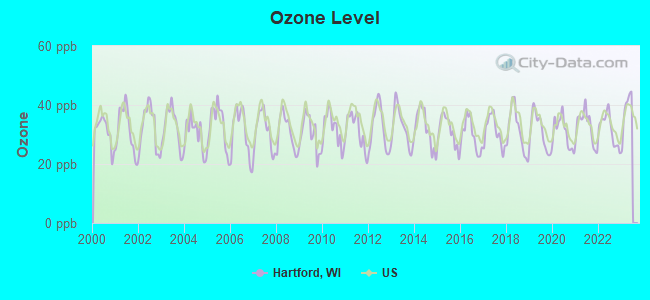
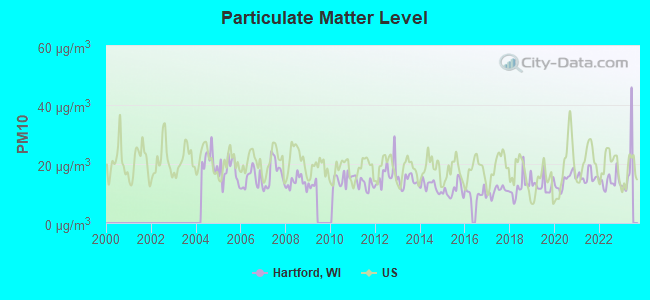
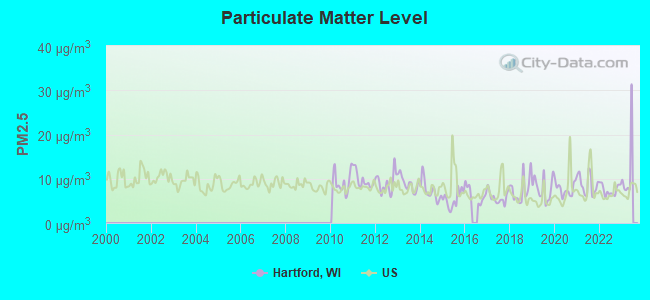
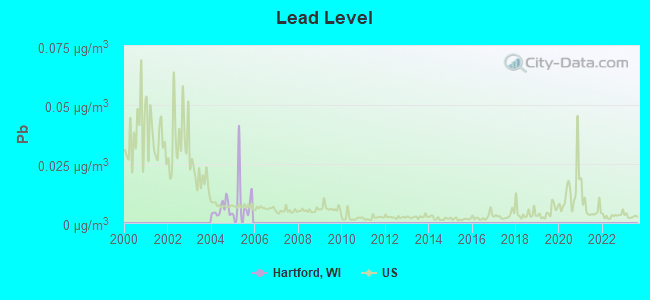

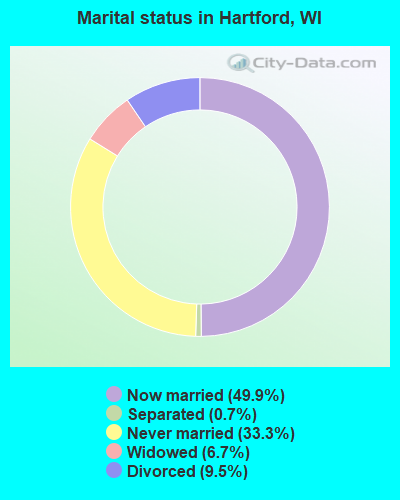
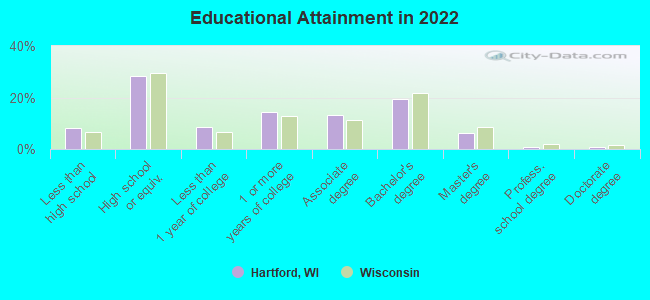
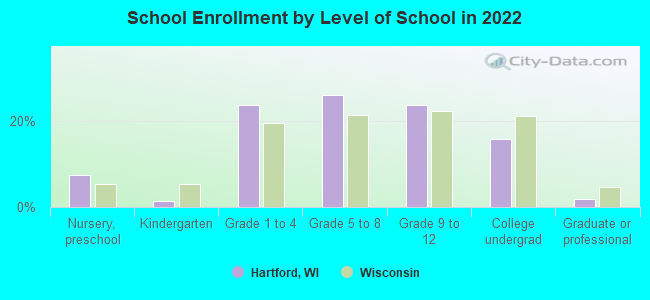
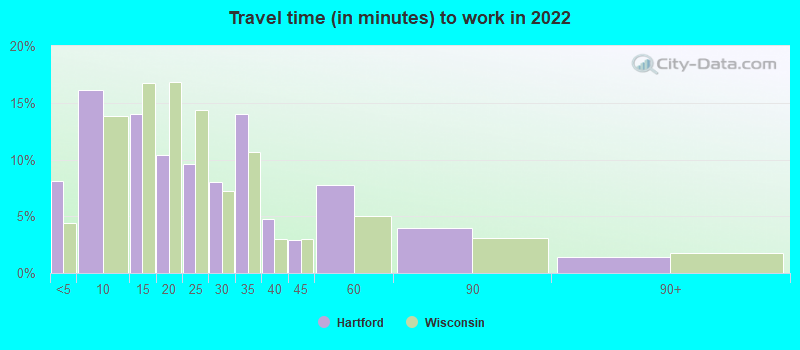
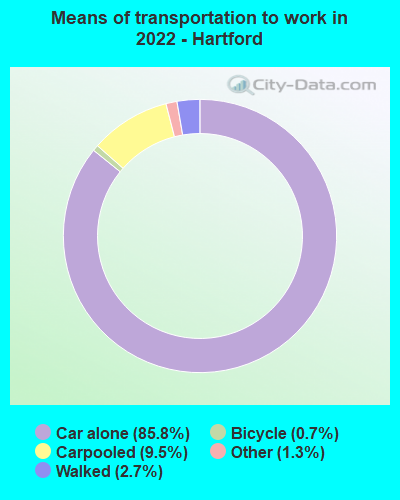
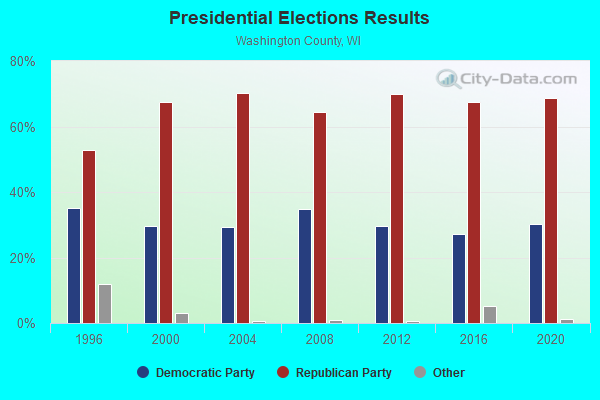
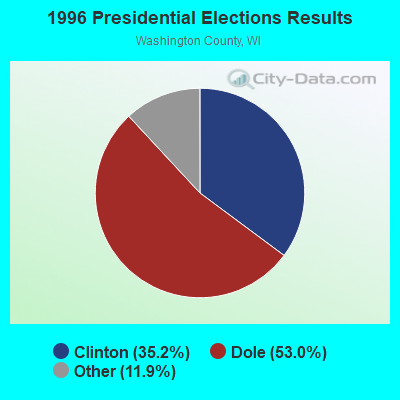

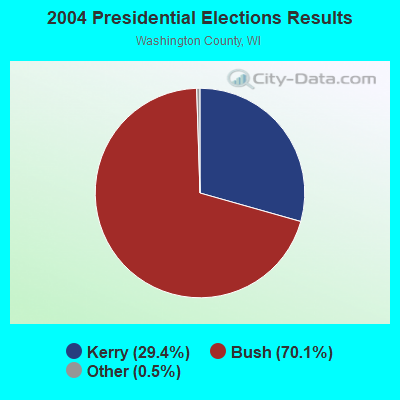
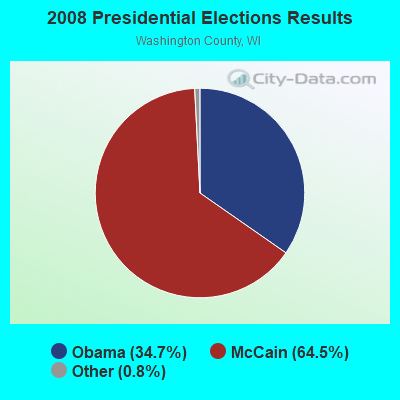

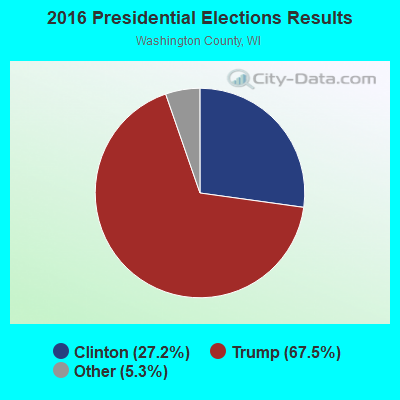

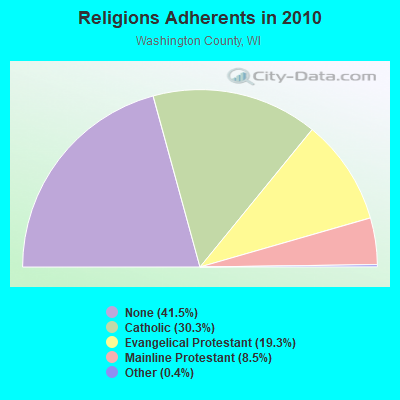
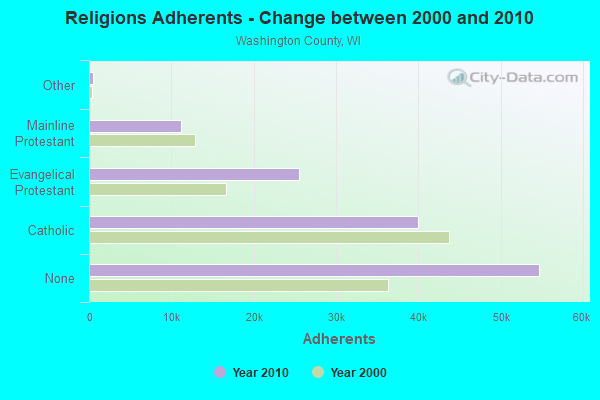
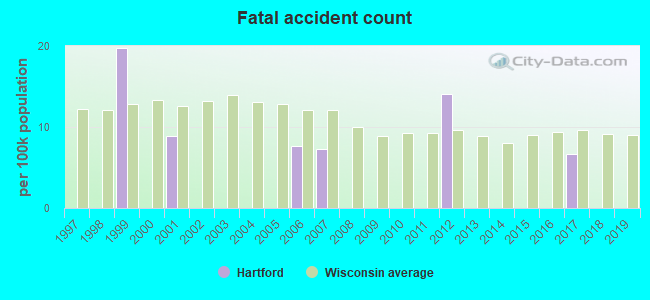
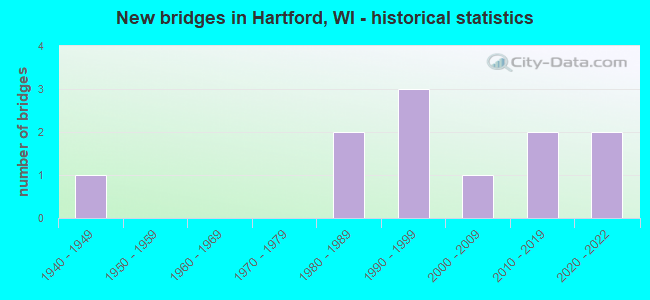
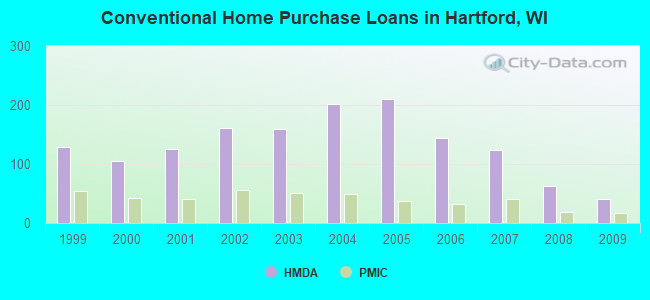
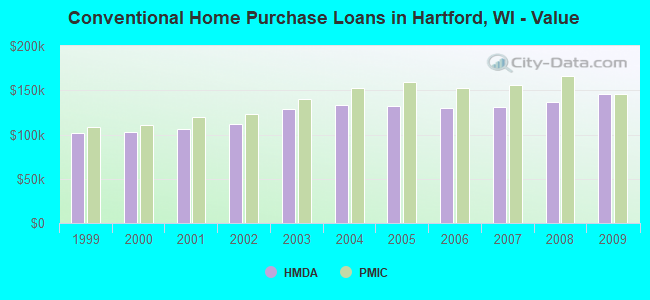
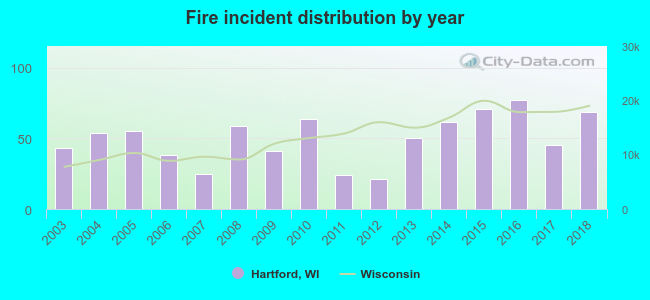 Based on the data from the years 2003 - 2018 the average number of fire incidents per year is 50. The highest number of reported fire incidents - 77 took place in 2016, and the least - 21 in 2012. The data has a rising trend.
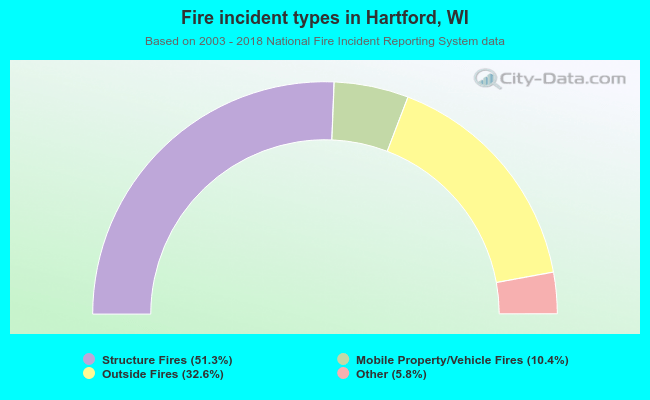 When looking into fire subcategories, the most incidents belonged to: Structure Fires (51.3%), and Outside Fires (32.6%).