Howell, Michigan Submit your own pictures of this city and show them to the world
OSM Map
General Map
Google Map
MSN Map
OSM Map
General Map
Google Map
MSN Map
OSM Map
General Map
Google Map
MSN Map
OSM Map
General Map
Google Map
MSN Map
Please wait while loading the map...
Population in 2022: 10,081 (100% urban, 0% rural). Population change since 2000: +9.2%Males: 4,804 Females: 5,277
March 2022 cost of living index in Howell: 97.4 (near average, U.S. average is 100) Percentage of residents living in poverty in 2022: 5.5%for White Non-Hispanic residents , 2.7% for Black residents , 3.9% for Hispanic or Latino residents , 4.2% for two or more races residents )
Profiles of local businesses
Business Search - 14 Million verified businesses
Data:
Median household income ($)
Median household income (% change since 2000)
Household income diversity
Ratio of average income to average house value (%)
Ratio of average income to average rent
Median household income ($) - White
Median household income ($) - Black or African American
Median household income ($) - Asian
Median household income ($) - Hispanic or Latino
Median household income ($) - American Indian and Alaska Native
Median household income ($) - Multirace
Median household income ($) - Other Race
Median household income for houses/condos with a mortgage ($)
Median household income for apartments without a mortgage ($)
Races - White alone (%)
Races - White alone (% change since 2000)
Races - Black alone (%)
Races - Black alone (% change since 2000)
Races - American Indian alone (%)
Races - American Indian alone (% change since 2000)
Races - Asian alone (%)
Races - Asian alone (% change since 2000)
Races - Hispanic (%)
Races - Hispanic (% change since 2000)
Races - Native Hawaiian and Other Pacific Islander alone (%)
Races - Native Hawaiian and Other Pacific Islander alone (% change since 2000)
Races - Two or more races (%)
Races - Two or more races (% change since 2000)
Races - Other race alone (%)
Races - Other race alone (% change since 2000)
Racial diversity
Unemployment (%)
Unemployment (% change since 2000)
Unemployment (%) - White
Unemployment (%) - Black or African American
Unemployment (%) - Asian
Unemployment (%) - Hispanic or Latino
Unemployment (%) - American Indian and Alaska Native
Unemployment (%) - Multirace
Unemployment (%) - Other Race
Population density (people per square mile)
Population - Males (%)
Population - Females (%)
Population - Males (%) - White
Population - Males (%) - Black or African American
Population - Males (%) - Asian
Population - Males (%) - Hispanic or Latino
Population - Males (%) - American Indian and Alaska Native
Population - Males (%) - Multirace
Population - Males (%) - Other Race
Population - Females (%) - White
Population - Females (%) - Black or African American
Population - Females (%) - Asian
Population - Females (%) - Hispanic or Latino
Population - Females (%) - American Indian and Alaska Native
Population - Females (%) - Multirace
Population - Females (%) - Other Race
Coronavirus confirmed cases (Apr 27, 2024)
Deaths caused by coronavirus (Apr 27, 2024)
Coronavirus confirmed cases (per 100k population) (Apr 27, 2024)
Deaths caused by coronavirus (per 100k population) (Apr 27, 2024)
Daily increase in number of cases (Apr 27, 2024)
Weekly increase in number of cases (Apr 27, 2024)
Cases doubled (in days) (Apr 27, 2024)
Hospitalized patients (Apr 18, 2022)
Negative test results (Apr 18, 2022)
Total test results (Apr 18, 2022)
COVID Vaccine doses distributed (per 100k population) (Sep 19, 2023)
COVID Vaccine doses administered (per 100k population) (Sep 19, 2023)
COVID Vaccine doses distributed (Sep 19, 2023)
COVID Vaccine doses administered (Sep 19, 2023)
Likely homosexual households (%)
Likely homosexual households (% change since 2000)
Likely homosexual households - Lesbian couples (%)
Likely homosexual households - Lesbian couples (% change since 2000)
Likely homosexual households - Gay men (%)
Likely homosexual households - Gay men (% change since 2000)
Cost of living index
Median gross rent ($)
Median contract rent ($)
Median monthly housing costs ($)
Median house or condo value ($)
Median house or condo value ($ change since 2000)
Mean house or condo value by units in structure - 1, detached ($)
Mean house or condo value by units in structure - 1, attached ($)
Mean house or condo value by units in structure - 2 ($)
Mean house or condo value by units in structure by units in structure - 3 or 4 ($)
Mean house or condo value by units in structure - 5 or more ($)
Mean house or condo value by units in structure - Boat, RV, van, etc. ($)
Mean house or condo value by units in structure - Mobile home ($)
Median house or condo value ($) - White
Median house or condo value ($) - Black or African American
Median house or condo value ($) - Asian
Median house or condo value ($) - Hispanic or Latino
Median house or condo value ($) - American Indian and Alaska Native
Median house or condo value ($) - Multirace
Median house or condo value ($) - Other Race
Median resident age
Resident age diversity
Median resident age - Males
Median resident age - Females
Median resident age - White
Median resident age - Black or African American
Median resident age - Asian
Median resident age - Hispanic or Latino
Median resident age - American Indian and Alaska Native
Median resident age - Multirace
Median resident age - Other Race
Median resident age - Males - White
Median resident age - Males - Black or African American
Median resident age - Males - Asian
Median resident age - Males - Hispanic or Latino
Median resident age - Males - American Indian and Alaska Native
Median resident age - Males - Multirace
Median resident age - Males - Other Race
Median resident age - Females - White
Median resident age - Females - Black or African American
Median resident age - Females - Asian
Median resident age - Females - Hispanic or Latino
Median resident age - Females - American Indian and Alaska Native
Median resident age - Females - Multirace
Median resident age - Females - Other Race
Commute - mean travel time to work (minutes)
Travel time to work - Less than 5 minutes (%)
Travel time to work - Less than 5 minutes (% change since 2000)
Travel time to work - 5 to 9 minutes (%)
Travel time to work - 5 to 9 minutes (% change since 2000)
Travel time to work - 10 to 19 minutes (%)
Travel time to work - 10 to 19 minutes (% change since 2000)
Travel time to work - 20 to 29 minutes (%)
Travel time to work - 20 to 29 minutes (% change since 2000)
Travel time to work - 30 to 39 minutes (%)
Travel time to work - 30 to 39 minutes (% change since 2000)
Travel time to work - 40 to 59 minutes (%)
Travel time to work - 40 to 59 minutes (% change since 2000)
Travel time to work - 60 to 89 minutes (%)
Travel time to work - 60 to 89 minutes (% change since 2000)
Travel time to work - 90 or more minutes (%)
Travel time to work - 90 or more minutes (% change since 2000)
Marital status - Never married (%)
Marital status - Now married (%)
Marital status - Separated (%)
Marital status - Widowed (%)
Marital status - Divorced (%)
Median family income ($)
Median family income (% change since 2000)
Median non-family income ($)
Median non-family income (% change since 2000)
Median per capita income ($)
Median per capita income (% change since 2000)
Median family income ($) - White
Median family income ($) - Black or African American
Median family income ($) - Asian
Median family income ($) - Hispanic or Latino
Median family income ($) - American Indian and Alaska Native
Median family income ($) - Multirace
Median family income ($) - Other Race
Median year house/condo built
Median year apartment built
Year house built - Built 2005 or later (%)
Year house built - Built 2000 to 2004 (%)
Year house built - Built 1990 to 1999 (%)
Year house built - Built 1980 to 1989 (%)
Year house built - Built 1970 to 1979 (%)
Year house built - Built 1960 to 1969 (%)
Year house built - Built 1950 to 1959 (%)
Year house built - Built 1940 to 1949 (%)
Year house built - Built 1939 or earlier (%)
Average household size
Household density (households per square mile)
Average household size - White
Average household size - Black or African American
Average household size - Asian
Average household size - Hispanic or Latino
Average household size - American Indian and Alaska Native
Average household size - Multirace
Average household size - Other Race
Occupied housing units (%)
Vacant housing units (%)
Owner occupied housing units (%)
Renter occupied housing units (%)
Vacancy status - For rent (%)
Vacancy status - For sale only (%)
Vacancy status - Rented or sold, not occupied (%)
Vacancy status - For seasonal, recreational, or occasional use (%)
Vacancy status - For migrant workers (%)
Vacancy status - Other vacant (%)
Residents with income below the poverty level (%)
Residents with income below 50% of the poverty level (%)
Children below poverty level (%)
Poor families by family type - Married-couple family (%)
Poor families by family type - Male, no wife present (%)
Poor families by family type - Female, no husband present (%)
Poverty status for native-born residents (%)
Poverty status for foreign-born residents (%)
Poverty among high school graduates not in families (%)
Poverty among people who did not graduate high school not in families (%)
Residents with income below the poverty level (%) - White
Residents with income below the poverty level (%) - Black or African American
Residents with income below the poverty level (%) - Asian
Residents with income below the poverty level (%) - Hispanic or Latino
Residents with income below the poverty level (%) - American Indian and Alaska Native
Residents with income below the poverty level (%) - Multirace
Residents with income below the poverty level (%) - Other Race
Air pollution - Air Quality Index (AQI)
Air pollution - CO
Air pollution - NO2
Air pollution - SO2
Air pollution - Ozone
Air pollution - PM10
Air pollution - PM25
Air pollution - Pb
Crime - Murders per 100,000 population
Crime - Rapes per 100,000 population
Crime - Robberies per 100,000 population
Crime - Assaults per 100,000 population
Crime - Burglaries per 100,000 population
Crime - Thefts per 100,000 population
Crime - Auto thefts per 100,000 population
Crime - Arson per 100,000 population
Crime - City-data.com crime index
Crime - Violent crime index
Crime - Property crime index
Crime - Murders per 100,000 population (5 year average)
Crime - Rapes per 100,000 population (5 year average)
Crime - Robberies per 100,000 population (5 year average)
Crime - Assaults per 100,000 population (5 year average)
Crime - Burglaries per 100,000 population (5 year average)
Crime - Thefts per 100,000 population (5 year average)
Crime - Auto thefts per 100,000 population (5 year average)
Crime - Arson per 100,000 population (5 year average)
Crime - City-data.com crime index (5 year average)
Crime - Violent crime index (5 year average)
Crime - Property crime index (5 year average)
1996 Presidential Elections Results (%) - Democratic Party (Clinton)
1996 Presidential Elections Results (%) - Republican Party (Dole)
1996 Presidential Elections Results (%) - Other
2000 Presidential Elections Results (%) - Democratic Party (Gore)
2000 Presidential Elections Results (%) - Republican Party (Bush)
2000 Presidential Elections Results (%) - Other
2004 Presidential Elections Results (%) - Democratic Party (Kerry)
2004 Presidential Elections Results (%) - Republican Party (Bush)
2004 Presidential Elections Results (%) - Other
2008 Presidential Elections Results (%) - Democratic Party (Obama)
2008 Presidential Elections Results (%) - Republican Party (McCain)
2008 Presidential Elections Results (%) - Other
2012 Presidential Elections Results (%) - Democratic Party (Obama)
2012 Presidential Elections Results (%) - Republican Party (Romney)
2012 Presidential Elections Results (%) - Other
2016 Presidential Elections Results (%) - Democratic Party (Clinton)
2016 Presidential Elections Results (%) - Republican Party (Trump)
2016 Presidential Elections Results (%) - Other
2020 Presidential Elections Results (%) - Democratic Party (Biden)
2020 Presidential Elections Results (%) - Republican Party (Trump)
2020 Presidential Elections Results (%) - Other
Ancestries Reported - Arab (%)
Ancestries Reported - Czech (%)
Ancestries Reported - Danish (%)
Ancestries Reported - Dutch (%)
Ancestries Reported - English (%)
Ancestries Reported - French (%)
Ancestries Reported - French Canadian (%)
Ancestries Reported - German (%)
Ancestries Reported - Greek (%)
Ancestries Reported - Hungarian (%)
Ancestries Reported - Irish (%)
Ancestries Reported - Italian (%)
Ancestries Reported - Lithuanian (%)
Ancestries Reported - Norwegian (%)
Ancestries Reported - Polish (%)
Ancestries Reported - Portuguese (%)
Ancestries Reported - Russian (%)
Ancestries Reported - Scotch-Irish (%)
Ancestries Reported - Scottish (%)
Ancestries Reported - Slovak (%)
Ancestries Reported - Subsaharan African (%)
Ancestries Reported - Swedish (%)
Ancestries Reported - Swiss (%)
Ancestries Reported - Ukrainian (%)
Ancestries Reported - United States (%)
Ancestries Reported - Welsh (%)
Ancestries Reported - West Indian (%)
Ancestries Reported - Other (%)
Educational Attainment - No schooling completed (%)
Educational Attainment - Less than high school (%)
Educational Attainment - High school or equivalent (%)
Educational Attainment - Less than 1 year of college (%)
Educational Attainment - 1 or more years of college (%)
Educational Attainment - Associate degree (%)
Educational Attainment - Bachelor's degree (%)
Educational Attainment - Master's degree (%)
Educational Attainment - Professional school degree (%)
Educational Attainment - Doctorate degree (%)
School Enrollment - Nursery, preschool (%)
School Enrollment - Kindergarten (%)
School Enrollment - Grade 1 to 4 (%)
School Enrollment - Grade 5 to 8 (%)
School Enrollment - Grade 9 to 12 (%)
School Enrollment - College undergrad (%)
School Enrollment - Graduate or professional (%)
School Enrollment - Not enrolled in school (%)
School enrollment - Public schools (%)
School enrollment - Private schools (%)
School enrollment - Not enrolled (%)
Median number of rooms in houses and condos
Median number of rooms in apartments
Housing units lacking complete plumbing facilities (%)
Housing units lacking complete kitchen facilities (%)
Density of houses
Urban houses (%)
Rural houses (%)
Households with people 60 years and over (%)
Households with people 65 years and over (%)
Households with people 75 years and over (%)
Households with one or more nonrelatives (%)
Households with no nonrelatives (%)
Population in households (%)
Family households (%)
Nonfamily households (%)
Population in families (%)
Family households with own children (%)
Median number of bedrooms in owner occupied houses
Mean number of bedrooms in owner occupied houses
Median number of bedrooms in renter occupied houses
Mean number of bedrooms in renter occupied houses
Median number of vehichles in owner occupied houses
Mean number of vehichles in owner occupied houses
Median number of vehichles in renter occupied houses
Mean number of vehichles in renter occupied houses
Mortgage status - with mortgage (%)
Mortgage status - with second mortgage (%)
Mortgage status - with home equity loan (%)
Mortgage status - with both second mortgage and home equity loan (%)
Mortgage status - without a mortgage (%)
Average family size
Average family size - White
Average family size - Black or African American
Average family size - Asian
Average family size - Hispanic or Latino
Average family size - American Indian and Alaska Native
Average family size - Multirace
Average family size - Other Race
Geographical mobility - Same house 1 year ago (%)
Geographical mobility - Moved within same county (%)
Geographical mobility - Moved from different county within same state (%)
Geographical mobility - Moved from different state (%)
Geographical mobility - Moved from abroad (%)
Place of birth - Born in state of residence (%)
Place of birth - Born in other state (%)
Place of birth - Native, outside of US (%)
Place of birth - Foreign born (%)
Housing units in structures - 1, detached (%)
Housing units in structures - 1, attached (%)
Housing units in structures - 2 (%)
Housing units in structures - 3 or 4 (%)
Housing units in structures - 5 to 9 (%)
Housing units in structures - 10 to 19 (%)
Housing units in structures - 20 to 49 (%)
Housing units in structures - 50 or more (%)
Housing units in structures - Mobile home (%)
Housing units in structures - Boat, RV, van, etc. (%)
House/condo owner moved in on average (years ago)
Renter moved in on average (years ago)
Year householder moved into unit - Moved in 1999 to March 2000 (%)
Year householder moved into unit - Moved in 1995 to 1998 (%)
Year householder moved into unit - Moved in 1990 to 1994 (%)
Year householder moved into unit - Moved in 1980 to 1989 (%)
Year householder moved into unit - Moved in 1970 to 1979 (%)
Year householder moved into unit - Moved in 1969 or earlier (%)
Means of transportation to work - Drove car alone (%)
Means of transportation to work - Carpooled (%)
Means of transportation to work - Public transportation (%)
Means of transportation to work - Bus or trolley bus (%)
Means of transportation to work - Streetcar or trolley car (%)
Means of transportation to work - Subway or elevated (%)
Means of transportation to work - Railroad (%)
Means of transportation to work - Ferryboat (%)
Means of transportation to work - Taxicab (%)
Means of transportation to work - Motorcycle (%)
Means of transportation to work - Bicycle (%)
Means of transportation to work - Walked (%)
Means of transportation to work - Other means (%)
Working at home (%)
Industry diversity
Most Common Industries - Agriculture, forestry, fishing and hunting, and mining (%)
Most Common Industries - Agriculture, forestry, fishing and hunting (%)
Most Common Industries - Mining, quarrying, and oil and gas extraction (%)
Most Common Industries - Construction (%)
Most Common Industries - Manufacturing (%)
Most Common Industries - Wholesale trade (%)
Most Common Industries - Retail trade (%)
Most Common Industries - Transportation and warehousing, and utilities (%)
Most Common Industries - Transportation and warehousing (%)
Most Common Industries - Utilities (%)
Most Common Industries - Information (%)
Most Common Industries - Finance and insurance, and real estate and rental and leasing (%)
Most Common Industries - Finance and insurance (%)
Most Common Industries - Real estate and rental and leasing (%)
Most Common Industries - Professional, scientific, and management, and administrative and waste management services (%)
Most Common Industries - Professional, scientific, and technical services (%)
Most Common Industries - Management of companies and enterprises (%)
Most Common Industries - Administrative and support and waste management services (%)
Most Common Industries - Educational services, and health care and social assistance (%)
Most Common Industries - Educational services (%)
Most Common Industries - Health care and social assistance (%)
Most Common Industries - Arts, entertainment, and recreation, and accommodation and food services (%)
Most Common Industries - Arts, entertainment, and recreation (%)
Most Common Industries - Accommodation and food services (%)
Most Common Industries - Other services, except public administration (%)
Most Common Industries - Public administration (%)
Occupation diversity
Most Common Occupations - Management, business, science, and arts occupations (%)
Most Common Occupations - Management, business, and financial occupations (%)
Most Common Occupations - Management occupations (%)
Most Common Occupations - Business and financial operations occupations (%)
Most Common Occupations - Computer, engineering, and science occupations (%)
Most Common Occupations - Computer and mathematical occupations (%)
Most Common Occupations - Architecture and engineering occupations (%)
Most Common Occupations - Life, physical, and social science occupations (%)
Most Common Occupations - Education, legal, community service, arts, and media occupations (%)
Most Common Occupations - Community and social service occupations (%)
Most Common Occupations - Legal occupations (%)
Most Common Occupations - Education, training, and library occupations (%)
Most Common Occupations - Arts, design, entertainment, sports, and media occupations (%)
Most Common Occupations - Healthcare practitioners and technical occupations (%)
Most Common Occupations - Health diagnosing and treating practitioners and other technical occupations (%)
Most Common Occupations - Health technologists and technicians (%)
Most Common Occupations - Service occupations (%)
Most Common Occupations - Healthcare support occupations (%)
Most Common Occupations - Protective service occupations (%)
Most Common Occupations - Fire fighting and prevention, and other protective service workers including supervisors (%)
Most Common Occupations - Law enforcement workers including supervisors (%)
Most Common Occupations - Food preparation and serving related occupations (%)
Most Common Occupations - Building and grounds cleaning and maintenance occupations (%)
Most Common Occupations - Personal care and service occupations (%)
Most Common Occupations - Sales and office occupations (%)
Most Common Occupations - Sales and related occupations (%)
Most Common Occupations - Office and administrative support occupations (%)
Most Common Occupations - Natural resources, construction, and maintenance occupations (%)
Most Common Occupations - Farming, fishing, and forestry occupations (%)
Most Common Occupations - Construction and extraction occupations (%)
Most Common Occupations - Installation, maintenance, and repair occupations (%)
Most Common Occupations - Production, transportation, and material moving occupations (%)
Most Common Occupations - Production occupations (%)
Most Common Occupations - Transportation occupations (%)
Most Common Occupations - Material moving occupations (%)
People in Group quarters - Institutionalized population (%)
People in Group quarters - Correctional institutions (%)
People in Group quarters - Federal prisons and detention centers (%)
People in Group quarters - Halfway houses (%)
People in Group quarters - Local jails and other confinement facilities (including police lockups) (%)
People in Group quarters - Military disciplinary barracks (%)
People in Group quarters - State prisons (%)
People in Group quarters - Other types of correctional institutions (%)
People in Group quarters - Nursing homes (%)
People in Group quarters - Hospitals/wards, hospices, and schools for the handicapped (%)
People in Group quarters - Hospitals/wards and hospices for chronically ill (%)
People in Group quarters - Hospices or homes for chronically ill (%)
People in Group quarters - Military hospitals or wards for chronically ill (%)
People in Group quarters - Other hospitals or wards for chronically ill (%)
People in Group quarters - Hospitals or wards for drug/alcohol abuse (%)
People in Group quarters - Mental (Psychiatric) hospitals or wards (%)
People in Group quarters - Schools, hospitals, or wards for the mentally retarded (%)
People in Group quarters - Schools, hospitals, or wards for the physically handicapped (%)
People in Group quarters - Institutions for the deaf (%)
People in Group quarters - Institutions for the blind (%)
People in Group quarters - Orthopedic wards and institutions for the physically handicapped (%)
People in Group quarters - Wards in general hospitals for patients who have no usual home elsewhere (%)
People in Group quarters - Wards in military hospitals for patients who have no usual home elsewhere (%)
People in Group quarters - Juvenile institutions (%)
People in Group quarters - Long-term care (%)
People in Group quarters - Homes for abused, dependent, and neglected children (%)
People in Group quarters - Residential treatment centers for emotionally disturbed children (%)
People in Group quarters - Training schools for juvenile delinquents (%)
People in Group quarters - Short-term care, detention or diagnostic centers for delinquent children (%)
People in Group quarters - Type of juvenile institution unknown (%)
People in Group quarters - Noninstitutionalized population (%)
People in Group quarters - College dormitories (includes college quarters off campus) (%)
People in Group quarters - Military quarters (%)
People in Group quarters - On base (%)
People in Group quarters - Barracks, unaccompanied personnel housing (UPH), (Enlisted/Officer), ;and similar group living quarters for military personnel (%)
People in Group quarters - Transient quarters for temporary residents (%)
People in Group quarters - Military ships (%)
People in Group quarters - Group homes (%)
People in Group quarters - Homes or halfway houses for drug/alcohol abuse (%)
People in Group quarters - Homes for the mentally ill (%)
People in Group quarters - Homes for the mentally retarded (%)
People in Group quarters - Homes for the physically handicapped (%)
People in Group quarters - Other group homes (%)
People in Group quarters - Religious group quarters (%)
People in Group quarters - Dormitories (%)
People in Group quarters - Agriculture workers' dormitories on farms (%)
People in Group quarters - Job Corps and vocational training facilities (%)
People in Group quarters - Other workers' dormitories (%)
People in Group quarters - Crews of maritime vessels (%)
People in Group quarters - Other nonhousehold living situations (%)
People in Group quarters - Other noninstitutional group quarters (%)
Residents speaking English at home (%)
Residents speaking English at home - Born in the United States (%)
Residents speaking English at home - Native, born elsewhere (%)
Residents speaking English at home - Foreign born (%)
Residents speaking Spanish at home (%)
Residents speaking Spanish at home - Born in the United States (%)
Residents speaking Spanish at home - Native, born elsewhere (%)
Residents speaking Spanish at home - Foreign born (%)
Residents speaking other language at home (%)
Residents speaking other language at home - Born in the United States (%)
Residents speaking other language at home - Native, born elsewhere (%)
Residents speaking other language at home - Foreign born (%)
Class of Workers - Employee of private company (%)
Class of Workers - Self-employed in own incorporated business (%)
Class of Workers - Private not-for-profit wage and salary workers (%)
Class of Workers - Local government workers (%)
Class of Workers - State government workers (%)
Class of Workers - Federal government workers (%)
Class of Workers - Self-employed workers in own not incorporated business and Unpaid family workers (%)
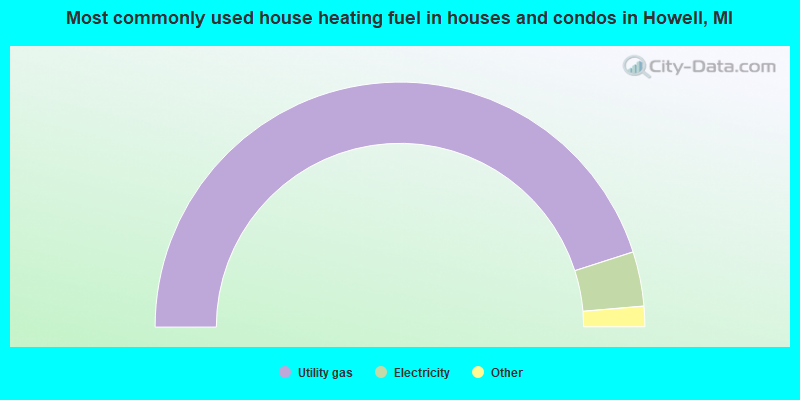
House heating fuel used in houses and condos - Utility gas (%)
House heating fuel used in houses and condos - Bottled, tank, or LP gas (%)
House heating fuel used in houses and condos - Electricity (%)
House heating fuel used in houses and condos - Fuel oil, kerosene, etc. (%)
House heating fuel used in houses and condos - Coal or coke (%)
House heating fuel used in houses and condos - Wood (%)
House heating fuel used in houses and condos - Solar energy (%)
House heating fuel used in houses and condos - Other fuel (%)
House heating fuel used in houses and condos - No fuel used (%)
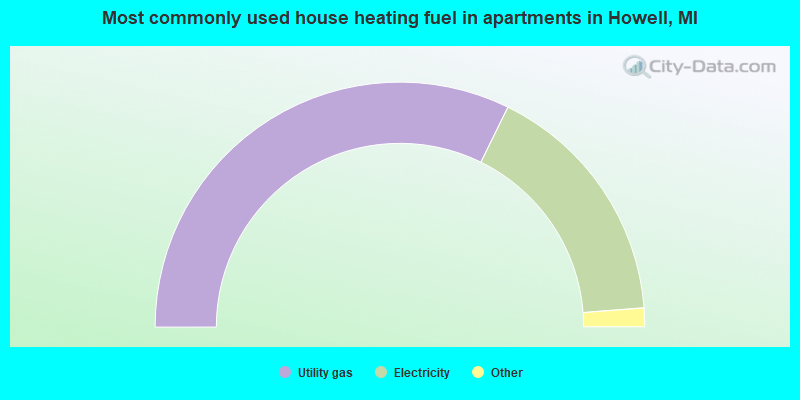
House heating fuel used in apartments - Utility gas (%)
House heating fuel used in apartments - Bottled, tank, or LP gas (%)
House heating fuel used in apartments - Electricity (%)
House heating fuel used in apartments - Fuel oil, kerosene, etc. (%)
House heating fuel used in apartments - Coal or coke (%)
House heating fuel used in apartments - Wood (%)
House heating fuel used in apartments - Solar energy (%)
House heating fuel used in apartments - Other fuel (%)
House heating fuel used in apartments - No fuel used (%)
Armed forces status - In Armed Forces (%)
Armed forces status - Civilian (%)
Armed forces status - Civilian - Veteran (%)
Armed forces status - Civilian - Nonveteran (%)
Fatal accidents locations in years 2005-2021
Fatal accidents locations in 2005
Fatal accidents locations in 2006
Fatal accidents locations in 2007
Fatal accidents locations in 2008
Fatal accidents locations in 2009
Fatal accidents locations in 2010
Fatal accidents locations in 2011
Fatal accidents locations in 2012
Fatal accidents locations in 2013
Fatal accidents locations in 2014
Fatal accidents locations in 2015
Fatal accidents locations in 2016
Fatal accidents locations in 2017
Fatal accidents locations in 2018
Fatal accidents locations in 2019
Fatal accidents locations in 2020
Fatal accidents locations in 2021
Alcohol use - People drinking some alcohol every month (%)
Alcohol use - People not drinking at all (%)
Alcohol use - Average days/month drinking alcohol
Alcohol use - Average drinks/week
Alcohol use - Average days/year people drink much
Audiometry - Average condition of hearing (%)
Audiometry - People that can hear a whisper from across a quiet room (%)
Audiometry - People that can hear normal voice from across a quiet room (%)
Audiometry - Ears ringing, roaring, buzzing (%)
Audiometry - Had a job exposure to loud noise (%)
Audiometry - Had off-work exposure to loud noise (%)
Blood Pressure & Cholesterol - Has high blood pressure (%)
Blood Pressure & Cholesterol - Checking blood pressure at home (%)
Blood Pressure & Cholesterol - Frequently checking blood cholesterol (%)
Blood Pressure & Cholesterol - Has high cholesterol level (%)
Consumer Behavior - Money monthly spent on food at supermarket/grocery store
Consumer Behavior - Money monthly spent on food at other stores
Consumer Behavior - Money monthly spent on eating out
Consumer Behavior - Money monthly spent on carryout/delivered foods
Consumer Behavior - Income spent on food at supermarket/grocery store (%)
Consumer Behavior - Income spent on food at other stores (%)
Consumer Behavior - Income spent on eating out (%)
Consumer Behavior - Income spent on carryout/delivered foods (%)
Current Health Status - General health condition (%)
Current Health Status - Blood donors (%)
Current Health Status - Has blood ever tested for HIV virus (%)
Current Health Status - Left-handed people (%)
Dermatology - People using sunscreen (%)
Diabetes - Diabetics (%)
Diabetes - Had a blood test for high blood sugar (%)
Diabetes - People taking insulin (%)
Diet Behavior & Nutrition - Diet health (%)
Diet Behavior & Nutrition - Milk product consumption (# of products/month)
Diet Behavior & Nutrition - Meals not home prepared (#/week)
Diet Behavior & Nutrition - Meals from fast food or pizza place (#/week)
Diet Behavior & Nutrition - Ready-to-eat foods (#/month)
Diet Behavior & Nutrition - Frozen meals/pizza (#/month)
Drug Use - People that ever used marijuana or hashish (%)
Drug Use - Ever used hard drugs (%)
Drug Use - Ever used any form of cocaine (%)
Drug Use - Ever used heroin (%)
Drug Use - Ever used methamphetamine (%)
Health Insurance - People covered by health insurance (%)
Kidney Conditions-Urology - Avg. # of times urinating at night
Medical Conditions - People with asthma (%)
Medical Conditions - People with anemia (%)
Medical Conditions - People with psoriasis (%)
Medical Conditions - People with overweight (%)
Medical Conditions - Elderly people having difficulties in thinking or remembering (%)
Medical Conditions - People who ever received blood transfusion (%)
Medical Conditions - People having trouble seeing even with glass/contacts (%)
Medical Conditions - People with arthritis (%)
Medical Conditions - People with gout (%)
Medical Conditions - People with congestive heart failure (%)
Medical Conditions - People with coronary heart disease (%)
Medical Conditions - People with angina pectoris (%)
Medical Conditions - People who ever had heart attack (%)
Medical Conditions - People who ever had stroke (%)
Medical Conditions - People with emphysema (%)
Medical Conditions - People with thyroid problem (%)
Medical Conditions - People with chronic bronchitis (%)
Medical Conditions - People with any liver condition (%)
Medical Conditions - People who ever had cancer or malignancy (%)
Mental Health - People who have little interest in doing things (%)
Mental Health - People feeling down, depressed, or hopeless (%)
Mental Health - People who have trouble sleeping or sleeping too much (%)
Mental Health - People feeling tired or having little energy (%)
Mental Health - People with poor appetite or overeating (%)
Mental Health - People feeling bad about themself (%)
Mental Health - People who have trouble concentrating on things (%)
Mental Health - People moving or speaking slowly or too fast (%)
Mental Health - People having thoughts they would be better off dead (%)
Oral Health - Average years since last visit a dentist
Oral Health - People embarrassed because of mouth (%)
Oral Health - People with gum disease (%)
Oral Health - General health of teeth and gums (%)
Oral Health - Average days a week using dental floss/device
Oral Health - Average days a week using mouthwash for dental problem
Oral Health - Average number of teeth
Pesticide Use - Households using pesticides to control insects (%)
Pesticide Use - Households using pesticides to kill weeds (%)
Physical Activity - People doing vigorous-intensity work activities (%)
Physical Activity - People doing moderate-intensity work activities (%)
Physical Activity - People walking or bicycling (%)
Physical Activity - People doing vigorous-intensity recreational activities (%)
Physical Activity - People doing moderate-intensity recreational activities (%)
Physical Activity - Average hours a day doing sedentary activities
Physical Activity - Average hours a day watching TV or videos
Physical Activity - Average hours a day using computer
Physical Functioning - People having limitations keeping them from working (%)
Physical Functioning - People limited in amount of work they can do (%)
Physical Functioning - People that need special equipment to walk (%)
Physical Functioning - People experiencing confusion/memory problems (%)
Physical Functioning - People requiring special healthcare equipment (%)
Prescription Medications - Average number of prescription medicines taking
Preventive Aspirin Use - Adults 40+ taking low-dose aspirin (%)
Reproductive Health - Vaginal deliveries (%)
Reproductive Health - Cesarean deliveries (%)
Reproductive Health - Deliveries resulted in a live birth (%)
Reproductive Health - Pregnancies resulted in a delivery (%)
Reproductive Health - Women breastfeeding newborns (%)
Reproductive Health - Women that had a hysterectomy (%)
Reproductive Health - Women that had both ovaries removed (%)
Reproductive Health - Women that have ever taken birth control pills (%)
Reproductive Health - Women taking birth control pills (%)
Reproductive Health - Women that have ever used Depo-Provera or injectables (%)
Reproductive Health - Women that have ever used female hormones (%)
Sexual Behavior - People 18+ that ever had sex (vaginal, anal, or oral) (%)
Sexual Behavior - Males 18+ that ever had vaginal sex with a woman (%)
Sexual Behavior - Males 18+ that ever performed oral sex on a woman (%)
Sexual Behavior - Males 18+ that ever had anal sex with a woman (%)
Sexual Behavior - Males 18+ that ever had any sex with a man (%)
Sexual Behavior - Females 18+ that ever had vaginal sex with a man (%)
Sexual Behavior - Females 18+ that ever performed oral sex on a man (%)
Sexual Behavior - Females 18+ that ever had anal sex with a man (%)
Sexual Behavior - Females 18+ that ever had any kind of sex with a woman (%)
Sexual Behavior - Average age people first had sex
Sexual Behavior - Average number of female sex partners in lifetime (males 18+)
Sexual Behavior - Average number of female vaginal sex partners in lifetime (males 18+)
Sexual Behavior - Average age people first performed oral sex on a woman (18+)
Sexual Behavior - Average number of woman performed oral sex on in lifetime (18+)
Sexual Behavior - Average number of male sex partners in lifetime (males 18+)
Sexual Behavior - Average number of male anal sex partners in lifetime (males 18+)
Sexual Behavior - Average age people first performed oral sex on a man (18+)
Sexual Behavior - Average number of male oral sex partners in lifetime (18+)
Sexual Behavior - People using protection when performing oral sex (%)
Sexual Behavior - Average number of times people have vaginal or anal sex a year
Sexual Behavior - People having sex without condom (%)
Sexual Behavior - Average number of male sex partners in lifetime (females 18+)
Sexual Behavior - Average number of male vaginal sex partners in lifetime (females 18+)
Sexual Behavior - Average number of female sex partners in lifetime (females 18+)
Sexual Behavior - Circumcised males 18+ (%)
Sleep Disorders - Average hours sleeping at night
Sleep Disorders - People that has trouble sleeping (%)
Smoking-Cigarette Use - People smoking cigarettes (%)
Taste & Smell - People 40+ having problems with smell (%)
Taste & Smell - People 40+ having problems with taste (%)
Taste & Smell - People 40+ that ever had wisdom teeth removed (%)
Taste & Smell - People 40+ that ever had tonsils teeth removed (%)
Taste & Smell - People 40+ that ever had a loss of consciousness because of a head injury (%)
Taste & Smell - People 40+ that ever had a broken nose or other serious injury to face or skull (%)
Taste & Smell - People 40+ that ever had two or more sinus infections (%)
Weight - Average height (inches)
Weight - Average weight (pounds)
Weight - Average BMI
Weight - People that are obese (%)
Weight - People that ever were obese (%)
Weight - People trying to lose weight (%)
Officers per 1,000 residents here:
1.55Michigan average:
1.86
Latest news from Howell, MI collected exclusively by city-data.com from local newspapers, TV, and radio stations
Ancestries: German (17.9%), English (10.7%), American (9.4%), European (7.9%), Polish (6.1%), Irish (5.3%).
Current Local Time:
Land area: 4.11 square miles.
Population density: 2,452 people per square mile (low).
409 residents are foreign born (3.3% Latin America , 0.4% Asia ).
This city:
4.0%Michigan:
6.9%
Median real estate property taxes paid for housing units with mortgages in 2022: $3,004 (1.1%)Median real estate property taxes paid for housing units with no mortgage in 2022: $2,707 (1.2%)
Nearest city with pop. 50,000+: Ann Arbor, MI
Nearest city with pop. 200,000+: Detroit, MI
Nearest city with pop. 1,000,000+: Chicago, IL
Nearest cities:
Latitude: 42.61 N, Longitude: 83.93 W
Daytime population change due to commuting: +4,247 (+41.8%)Workers who live and work in this city: 1,559 (28.3%)
Single-family new house construction building permits:
2022: 8 buildings , average cost: $204,2002021: 12 buildings , average cost: $228,5002020: 19 buildings , average cost: $202,7002019: 19 buildings , average cost: $170,3002018: 28 buildings , average cost: $195,9002017: 15 buildings , average cost: $170,7002016: 5 buildings , average cost: $138,8002015: 8 buildings , average cost: $187,6002014: 13 buildings , average cost: $212,7002013: 3 buildings , average cost: $136,6002010: 1 building , cost: $170,0002007: 2 buildings , average cost: $67,2002006: 10 buildings , average cost: $114,0002005: 22 buildings , average cost: $126,8002004: 41 buildings , average cost: $123,5002003: 29 buildings , average cost: $118,0002002: 33 buildings , average cost: $130,8002001: 31 buildings , average cost: $117,1002000: 18 buildings , average cost: $117,0001999: 63 buildings , average cost: $149,3001998: 55 buildings , average cost: $116,0001997: 15 buildings , average cost: $108,000Unemployment in December 2023:
Population change in the 1990s: +1,188 (+14.8%).
Most common occupations in Howell, MI (%)
Both Males Females
Other production occupations, including supervisors (4.3%)
Material recording, scheduling, dispatching, and distributing workers (4.2%)
Building and grounds cleaning and maintenance occupations (4.0%)
Other sales and related occupations, including supervisors (3.8%)
Other management occupations, except farmers and farm managers (3.6%)
Retail sales workers, except cashiers (3.5%)
Other office and administrative support workers, including supervisors (3.5%)
Engineers (6.3%)
Electrical equipment mechanics and other installation, maintenance, and repair workers, including supervisors (5.3%)
Other production occupations, including supervisors (5.3%)
Metal workers and plastic workers (4.8%)
Material recording, scheduling, dispatching, and distributing workers (4.6%)
Other management occupations, except farmers and farm managers (4.2%)
Other sales and related occupations, including supervisors (4.1%)
Secretaries and administrative assistants (7.1%)
Other office and administrative support workers, including supervisors (6.3%)
Building and grounds cleaning and maintenance occupations (5.6%)
Customer service representatives (4.6%)
Retail sales workers, except cashiers (4.2%)
Preschool, kindergarten, elementary, and middle school teachers (4.0%)
Material recording, scheduling, dispatching, and distributing workers (3.7%)
Air pollution and air quality trends(lower is better)
AQI Ozone
Tornado activity:
Howell-area historical tornado activity is above Michigan state average. It is 70% greater than the overall U.S. average.
On 7/4/1957, a category F4 (max. wind speeds 207-260 mph) tornado 12.1 miles away from the Howell city center injured 6 people and caused between $50,000 and $500,000 in damages.
On 6/8/1953, a category F5 (max. wind speeds 261-318 mph) tornado 34.2 miles away from the city center killed 116 people and injured 844 people and caused between $5,000,000 and $50,000,000 in damages.
Earthquake activity:
Howell-area historical earthquake activity is significantly above Michigan state average. It is 42% smaller than the overall U.S. average. On 9/25/1998 at 19:52:52, a magnitude 5.2 (4.8 MB, 4.3 MS, 5.2 LG, 4.5 MW, Depth: 3.1 mi, Class: Moderate, Intensity: VI - VII) earthquake occurred 197.4 miles away from Howell center On 1/31/1986 at 16:46:43, a magnitude 5.0 (5.0 MB) earthquake occurred 158.4 miles away from Howell center On 5/2/2015 at 16:23:07, a magnitude 4.2 (4.2 MW, Depth: 2.8 mi, Class: Light, Intensity: IV - V) earthquake occurred 80.6 miles away from the city center On 7/12/1986 at 08:19:37, a magnitude 4.5 (4.5 MB) earthquake occurred 145.1 miles away from the city center On 7/27/1980 at 18:52:21, a magnitude 5.2 (5.1 MB, 4.7 MS, 5.0 UK, 5.2 UK) earthquake occurred 304.7 miles away from the city center On 4/18/2008 at 09:36:59, a magnitude 5.4 (5.1 MB, 4.8 MS, 5.4 MW, 5.2 MW) earthquake occurred 354.7 miles away from Howell center Magnitude types: regional Lg-wave magnitude (LG), body-wave magnitude (MB), surface-wave magnitude (MS), moment magnitude (MW) Natural disasters: The number of natural disasters in Livingston County (7) is smaller than the US average (15).Major Disasters (Presidential) Declared: 2Emergencies Declared: 4Floods: 2, Storms: 2, Blizzard: 1, Hurricane: 1, Power Outage: 1, Snowstorm: 1, Tornado: 1, Wind: 1, Winter Storm: 1, Other: 1 (Note: some incidents may be assigned to more than one category). Main business address for: FNBH BANCORP INC NATIONAL COMMERCIAL BANKS ).
Hospitals and medical centers in Howell: HOSPICE OF LIVINGSTON COUNTY INC (1333 W GRAND RIVER) SAINT JOSEPH MERCY LIVINGSTON HOSPITAL (Voluntary non-profit - Other, 620 BYRON RD) ST JOSEPH MERCY LIVINGSTON HOM (907 FOWLER STREET)
HOWELL CARE CENTER (3003 W GRAND RIVER)
MEDILODGE OF HOWELL (1333 W GRAND RIVER)
Colleges/universities with over 2000 students nearest to Howell:
University of Michigan-Ann Arbor (about 26 miles; Ann Arbor, MI ; Full-time enrollment: 39,547)
Oakland Community College (about 26 miles; Bloomfield Hills, MI ; FT enrollment: 18,956)
Washtenaw Community College (about 28 miles; Ann Arbor, MI ; FT enrollment: 8,452)
Baker College of Flint (about 28 miles; Flint, MI ; FT enrollment: 3,877)
Baker College Center for Graduate Studies (about 29 miles; Flint, MI ; FT enrollment: 3,405)
Michigan State University (about 29 miles; East Lansing, MI ; FT enrollment: 41,736)
Baker College of Owosso (about 29 miles; Owosso, MI ; FT enrollment: 2,081)
Public high schools in Howell: HOWELL HIGH SCHOOL Students: 2,600, Location: 1200 WEST GRAND RIVER AVE, Grades: 9-12)LEGACY HIGH SCHOOL Location: 9525 EAST HIGHLAND RD, Grades: 7-12)
HARTLAND VIRTUAL ACADEMY Location: 9525 E. HIGHLAND RD., Grades: KG-12)
PATHWAY SCHOOL Location: 1429 WEST GRAND RIVER AVE, Grades: PK-12)Biggest public elementary/middle schools in Howell: HIGHLANDER WAY MIDDLE SCHOOL Students: 1,111, Location: 511 NORTH HIGHLANDER WAY, Grades: 6-8)THREE FIRES ELEMENTARY Students: 991, Location: 4125 CROOKED LAKE ROAD, Grades: KG-5)CHARYL STOCKWELL ACADEMY Students: 722, Location: 9758 EAST HIGHLAND RD, Grades: KG-5, Charter school )RUAHMAH J. HUTCHINGS ELEMENTARY Students: 622, Location: 3503 BIGELOW RD, Grades: PK-5)SOUTHWEST ELEMENTARY SCHOOL Students: 552, Location: 915 GAY ST, Grades: KG-5)CHALLENGER ELEMENTARY SCHOOL Students: 545, Location: 1066 WEST GRAND RIVER AVE, Grades: KG-5)VOYAGER ELEMENTARY SCHOOL Students: 539, Location: 1450 BYRON RD, Grades: PK-5)NORTHWEST ELEMENTARY SCHOOL Students: 537, Location: 1233 BOWER ST, Grades: KG-5)SOUTHEAST ELEMENTARY SCHOOL Students: 537, Location: 861 EAST SIBLEY ST, Grades: KG-5)PARKER MIDDLE SCHOOL Location: 400 WRIGHT RD, Grades: 6-8)
Private elementary/middle school in Howell: ST JOSEPH CATHOLIC SCHOOL Students: 308, Location: 425 E WASHINGTON ST, Grades: PK-8)
See full list of schools located in Howell Library in Howell: HOWELL CARNEGIE DISTRICT LIBRARY Operating income: $2,021,111; Location: 314 WEST GRAND RIVER AVENUE; 112,632 books ; 6,897 e-books ; 13,759 audio materials ; 18,423 video materials ; 14 local licensed databases ; 393 print serial subscriptions )
User-submitted facts and corrections:
Notable locations in Howell: (A) , Howell Depot Museum (B) , Howell Carnegie District Library (C) , Howell Area Fire Department Station 20 Headquarters (D) , Livingston County Sheriff's Department (E) , Howell City Hall (F) , Howell City Police Department (G) , ReadyCare of Howell (H) , Howell Pediatrics (I) , Howell Area Fire Department Station 21 (J) . Display/hide their locations on the map
Shopping Centers: (1) , Promenade Shopping Center (2) . Display/hide their locations on the map
Main business address in Howell: (A) . Display/hide its location on the map
Churches in Howell include: (A) , Howell Assembly of God Church (B) , Church of the Nazarene (C) , South Side Baptist Church (D) , Church of Christ (E) , Saint John's Episcopal Church (F) , Grace Lutheran Church (G) , Saint Joseph Catholic Church (H) , First Presbyterian Church (I) . Display/hide their locations on the map
Cemeteries: (1) , Mount Olivet Cemetery (2) . Display/hide their locations on the map
Parks in Howell include: (1) , Paul Bennett Recreation Center (2) , Paul Bennett Field (3) , Maple Street Park (4) , West Street Park (5) , McPherson Park (6) , John S Page Athletic Field (7) , Lakeside Park (8) , Howell City Park (9) . Display/hide their locations on the map
Tourist attractions:
Hotels:
Court:
Birthplace of: Trent Daavettila - Ice hockey player, Andy Hilbert - Ice hockey player, Mark Schauer - Politician, Milton C. Pettibone - Politician, Bert Tooley - Baseball player.
Livingston County has a predicted average indoor radon screening level between 2 and 4 pCi/L (pico curies per liter) - Moderate Potential Drinking water stations with addresses in Howell and their reported violations in the past:
ST. JOHN CATHOLIC CHURCH (Population served: 800, Groundwater):
Past monitoring violations:
One regular monitoring violation
Population served: 300, Groundwater):
Past health violations:
MCL, Monthly (TCR) - In JUN-2010, Contaminant: Coliform. Follow-up actions: St Public Notif requested (JUN-25-2010), St Public Notif received (JUN-28-2010), St Compliance achieved (JUL-01-2010)
Past monitoring violations:
4 routine major monitoring violations
One regular monitoring violation
Address: 4171 Woodland Drvie Population served: 250, Groundwater):
Past monitoring violations:
One routine major monitoring violation
Population served: 200, Groundwater):
Past monitoring violations:
One routine major monitoring violation
One regular monitoring violation
Population served: 162, Groundwater):
Past monitoring violations:
One regular monitoring violation
Population served: 150, Groundwater):
Past health violations:
MCL, Monthly (TCR) - In DEC-2007, Contaminant: Coliform. Follow-up actions: St Public Notif issued (JAN-04-2008), St Formal NOV issued (JAN-04-2008), St Unresolved (JAN-04-2008), St Compliance achieved (APR-08-2008)
Past monitoring violations:
One routine major monitoring violation
One regular monitoring violation
Population served: 125, Groundwater):
Past monitoring violations:
One routine major monitoring violation
Population served: 120, Groundwater):
Past monitoring violations:
2 routine major monitoring violations
One minor monitoring violation
Drinking water stations with addresses in Howell that have no violations reported:
LAKE CHEMUNG OUTDOOR RESORT (Population served: 500, Primary Water Source Type: Groundwater)
VENTURE CORNER (Population served: 150, Primary Water Source Type: Groundwater)
VIC & BOBS PARTY STORE (Population served: 150, Primary Water Source Type: Groundwater)
MOBIL STATION-SPENCER RD (Population served: 100, Primary Water Source Type: Groundwater)
WILDWOOD RANCH ( BATH HOUSE) (Population served: 100, Primary Water Source Type: Groundwater)
HUNTERS RIDGE GOLF CLUB HOUSE (Population served: 50, Primary Water Source Type: Groundwater)
PETTYSVILLE JUNCTION (Population served: 25, Primary Water Source Type: Groundwater)
LAKE LANDING MARKET (Population served: 25, Primary Water Source Type: Groundwater)
MARION TOWNSHIP HALL (Population served: 25, Primary Water Source Type: Groundwater)
PARDIAC - SHELL GAS MART (Population served: 25, Primary Water Source Type: Groundwater)
Average household size: This city:
2.2 peopleMichigan:
2.5 people
Percentage of family households: This city:
55.5%Whole state:
66.0%
Percentage of households with unmarried partners: This city:
8.9%Whole state:
6.4%
Likely homosexual households (counted as self-reported same-sex unmarried-partner households)
Lesbian couples: 0.4% of all households Gay men: 0.1% of all households
People in group quarters in Howell in 2010:
210 people in nursing facilities/skilled-nursing facilities
209 people in local jails and other municipal confinement facilities
6 people in group homes intended for adults
People in group quarters in Howell in 2000:
210 people in nursing homes
166 people in local jails and other confinement facilities (including police lockups)
17 people in homes for the mentally retarded
Banks with most branches in Howell (2011 data):
First National Bank in Howell: Genoa Branch, Drive-In Branch, Vg's In-Store Branch, First National Bank In Howell. Info updated 2006/11/03: Bank assets: $292.1 mil, Deposits: $283.8 mil, local headquarters , negative income in the last year , Commercial Lending Specialization, 9 total offices , Holding Company: Fnbh Bancorp, Inc.
Citizens Bank: 622 E Grand River Branch at 611 East Grand River, branch established on 1957/10/30; Highland Road, Howell Branch at 9402 East Highland Road, branch established on 2005/10/03. Info updated 2011/08/01: Bank assets: $9,212.3 mil, Deposits: $7,452.0 mil, headquarters in Flint, MI, positive income , Commercial Lending Specialization, 220 total offices , Holding Company: Citizens Republic Bancorp, Inc.
PNC Bank, National Association: Howell Branch at 207 North Michigan Avenue, branch established on 1865/01/01; Chilson Road Branch at 2350 East Grand River, branch established on 1990/06/25. Info updated 2012/03/20: Bank assets: $263,309.6 mil, Deposits: $197,343.0 mil, headquarters in Wilmington, DE, positive income , Commercial Lending Specialization, 3085 total offices , Holding Company: Pnc Financial Services Group, Inc., The
TCF National Bank: Howell Branch at 3857 E. Grand River Avenue, branch established on 2002/10/14; Hartland Branch at 10065 Highland Road, branch established on 2002/10/21. Info updated 2009/11/23: Bank assets: $19,007.0 mil, Deposits: $12,377.0 mil, headquarters in Sioux Falls, SD, positive income , Commercial Lending Specialization, 441 total offices , Holding Company: Tcf Financial Corporation
Flagstar Bank, FSB: Howell M-59 Branch at 126 West Highland, branch established on 2006/04/12; Howell Branch at 4173 East Grand River, branch established on 1999/04/28. Info updated 2011/07/21: Bank assets: $13,623.5 mil, Deposits: $7,802.8 mil, headquarters in Troy, MI, negative income in the last year , Mortgage Lending Specialization, 135 total offices
JPMorgan Chase Bank, National Association: Howell Branch at 2410 West Grand River Avenue, branch established on 1980/10/06; Howell Meijer Banking Ctr. Branch at 3883 East Grand River Avenue, branch established on 2006/03/31. Info updated 2011/11/10: Bank assets: $1,811,678.0 mil, Deposits: $1,190,738.0 mil, headquarters in Columbus, OH, positive income , International Specialization, 5577 total offices , Holding Company: Jpmorgan Chase & Co.
Bank of America, National Association: Howell Branch at 3400 E. Grand River Road, branch established on 2000/11/08. Info updated 2009/11/18: Bank assets: $1,451,969.3 mil, Deposits: $1,077,176.8 mil, headquarters in Charlotte, NC, positive income , 5782 total offices , Holding Company: Bank Of America Corporation
Comerica Bank: Latson-Grand River Branch at 1050 South Latson, branch established on 2002/12/18. Info updated 2011/07/29: Bank assets: $60,970.5 mil, Deposits: $48,300.9 mil, headquarters in Dallas, TX, positive income , Commercial Lending Specialization, 497 total offices , Holding Company: Comerica Incorporated
Fifth Third Bank: Howell at 3866 East Grand River, branch established on 2000/12/11. Info updated 2009/10/05: Bank assets: $114,540.4 mil, Deposits: $89,689.1 mil, headquarters in Cincinnati, OH, positive income , Commercial Lending Specialization, 1378 total offices , Holding Company: Fifth Third Bancorp
For population 15 years and over in Howell:
Never married: 37.0%Now married: 37.4%Separated: 0.4%Widowed: 9.4%Divorced: 15.8% For population 25 years and over in Howell:
High school or higher: 93.8%Bachelor's degree or higher: 29.3%Graduate or professional degree: 9.0%Unemployed: 3.9%Mean travel time to work (commute): 21.9 minutes
Education Gini index (Inequality in education) Here:
8.9Michigan average:
11.0
Religion statistics for Howell, MI (based on Livingston County data)
Religion Adherents Congregations Catholic 36,976 9 Evangelical Protestant 19,679 59 Mainline Protestant 10,563 25 Other 1,249 7 Black Protestant 123 1 None 112,377 -
Source: Clifford Grammich, Kirk Hadaway, Richard Houseal, Dale E.Jones, Alexei Krindatch, Richie Stanley and Richard H.Taylor. 2012. 2010 U.S.Religion Census: Religious Congregations & Membership Study. Association of Statisticians of American Religious Bodies. Jones, Dale E., et al. 2002. Congregations and Membership in the United States 2000. Nashville, TN: Glenmary Research Center. Graphs represent county-level data
Food Environment Statistics: Number of grocery stores : 25Livingston County :
1.37 / 10,000 pop.Michigan :
2.34 / 10,000 pop.
Number of supercenters and club stores : 4This county :
0.22 / 10,000 pop.Michigan :
0.18 / 10,000 pop.
Number of convenience stores (no gas) : 17Livingston County :
0.93 / 10,000 pop.State :
1.52 / 10,000 pop.
Number of convenience stores (with gas) : 37Livingston County :
2.03 / 10,000 pop.Michigan :
2.99 / 10,000 pop.
Number of full-service restaurants : 100Livingston County :
5.47 / 10,000 pop.Michigan :
6.80 / 10,000 pop.
Adult diabetes rate : Livingston County :
7.9%Michigan :
9.7%
Adult obesity rate : This county :
25.7%Michigan :
29.7%
Low-income preschool obesity rate : Livingston County :
14.3%Michigan :
13.4%
Health and Nutrition: Healthy diet rate : This city:
51.0%Michigan:
50.3%
Average overall health of teeth and gums : Average BMI : This city:
28.3Michigan:
28.7
People feeling badly about themselves : This city:
20.9%Michigan:
20.6%
People not drinking alcohol at all : This city:
10.2%Michigan:
10.4%
Average hours sleeping at night : Overweight people : This city:
32.6%Michigan:
34.1%
General health condition : This city:
58.5%Michigan:
57.0%
Average condition of hearing : Howell:
79.9%Michigan:
79.6%
More about Health and Nutrition of Howell, MI Residents
Local government employment and payroll (March 2022)
Function
Full-time employees
Monthly full-time payroll
Average yearly full-time wage
Part-time employees
Monthly part-time payroll
Police Protection - Officers
14 $88,931 $76,227 0 $0 Streets and Highways
9 $46,953 $62,604 4 $7,095 Sewerage
6 $33,901 $67,802 0 $0 Other and Unallocable
6 $38,586 $77,172 3 $2,291 Other Government Administration
5 $32,433 $77,839 0 $0 Water Supply
5 $27,931 $67,034 0 $0 Financial Administration
5 $30,208 $72,499 2 $6,657 Police - Other
4 $24,864 $74,592 3 $1,329
Totals for Government
54 $323,806 $71,957 12 $17,371
Howell government finances - Expenditure in 2017 (per resident):
Current Operations - Sewerage: $3,422,000 ($339.45)
Police Protection: $2,360,000 ($234.10)Regular Highways: $1,379,000 ($136.79)General - Other: $1,297,000 ($128.66)Solid Waste Management: $659,000 ($65.37)Central Staff Services: $535,000 ($53.07)Parks and Recreation: $492,000 ($48.80)Financial Administration: $368,000 ($36.50)Judicial and Legal Services: $109,000 ($10.81)Protective Inspection and Regulation - Other: $76,000 ($7.54)General - Interest on Debt: $407,000 ($40.37)
Other Capital Outlay - Regular Highways: $1,298,000 ($128.76)
General - Other: $393,000 ($38.98)Water Utilities: $260,000 ($25.79)Sewerage: $247,000 ($24.50)Total Salaries and Wages: $3,798,000 ($376.75)
Water Utilities - Interest on Debt: $140,000 ($13.89)
Howell government finances - Revenue in 2017 (per resident):
Charges - Sewerage: $2,177,000 ($215.95)
Other: $176,000 ($17.46)Solid Waste Management: $174,000 ($17.26)Miscellaneous - General Revenue - Other: $522,000 ($51.78)
Rents: $140,000 ($13.89)Fines and Forfeits: $60,000 ($5.95)Interest Earnings: $9,000 ($0.89)Revenue - Water Utilities: $2,304,000 ($228.55)
State Intergovernmental - Highways: $941,000 ($93.34)
General Local Government Support: $857,000 ($85.01)Other: $604,000 ($59.91)Tax - Property: $5,235,000 ($519.29)
Occupation and Business License - Other: $323,000 ($32.04)
Howell government finances - Debt in 2017 (per resident):
Long Term Debt - Outstanding Unspecified Public Purpose: $18,709,000 ($1855.87)
Beginning Outstanding - Unspecified Public Purpose: $17,919,000 ($1777.50)Issue, Unspecified Public Purpose: $3,260,000 ($323.38)Retired Unspecified Public Purpose: $2,470,000 ($245.02)
Howell government finances - Cash and Securities in 2017 (per resident):
Other Funds - Cash and Securities: $8,042,000 ($797.74)
Businesses in Howell, MI
Name Count Name Count
7-Eleven 1 Kohl's 1 ALDI 1 Kroger 2 AT&T 1 La-Z-Boy 1 Ace Hardware 1 Lane Bryant 1 Advance Auto Parts 1 Lane Furniture 1 Aeropostale 1 Little Caesars Pizza 1 Ann Taylor 2 Lowe's 1 Applebee's 1 MasterBrand Cabinets 2 AutoZone 1 Maurices 1 Banana Republic 1 McDonald's 3 Baskin-Robbins 1 Meijer 1 Bath & Body Works 1 Motherhood Maternity 1 Baymont Inn 1 Nike 5 Best Western 1 Old Navy 1 Blockbuster 2 Pac Sun 1 Buffalo Wild Wings 1 Papa John's Pizza 1 Burger King 1 Payless 1 CVS 3 Penske 1 Carson Pirie Scott 1 Pier 1 Imports 1 Casual Male XL 1 Pizza Hut 1 Chevrolet 1 RadioShack 1 Curves 1 Rite Aid 1 Dairy Queen 1 Rue21 1 Decora Cabinetry 2 Sears 1 Discount Tire 1 Skechers USA 1 DressBarn 1 Sprint Nextel 3 Dressbarn 1 Staples 1 Dunkin Donuts 1 Starbucks 1 Eddie Bauer 1 Subway 5 Famous Footwear 1 T-Mobile 2 FedEx 2 T.J.Maxx 1 Ford 1 Taco Bell 1 GNC 2 Target 1 Gap 1 The Room Place 1 Gymboree 1 Toys"R"Us 1 H&R Block 2 True Value 1 Holiday Inn 1 U-Haul 2 Home Depot 1 UPS 11 J.Crew 1 Vans 1 Jimmy John's 1 Walgreens 1 Jones New York 2 Walmart 1 Journeys 1 Wendy's 2 Justice 1 White Castle 1 KFC 1 YMCA 1
Strongest AM radio stations in Howell:
WOAP (1080 AM; 50 kW; OWOSSO, MI)
WWJ (950 AM; 50 kW; DETROIT, MI; Owner: INFINITY BROADCASTING OPERATIONS, INC.)
WXYT (1270 AM; 50 kW; DETROIT, MI; Owner: INFINITY BROADCASTING CORP. OF DETROIT)
WJR (760 AM; 50 kW; DETROIT, MI; Owner: ABC, INC.)
WFDF (910 AM; 50 kW; FLINT, MI; Owner: ABC, INC.)
WCHB (1200 AM; 50 kW; TAYLOR, MI; Owner: RADIO ONE OF DETROIT, LLC)
WDFN (1130 AM; 50 kW; DETROIT, MI; Owner: AMFM RADIO LICENSES, L.L.C.)
WKAR (870 AM; daytime; 10 kW; EAST LANSING, MI; Owner: MICHIGAN STATE UNIVERSITY)
WDEO (990 AM; 9 kW; YPSILANTI, MI; Owner: WORD BROADCASTERS, INC.)
WTKA (1050 AM; 10 kW; ANN ARBOR, MI; Owner: CAPSTAR TX LIMITED PARTNERSHIP)
WTRX (1330 AM; 5 kW; FLINT, MI; Owner: CITADEL BROADCASTING COMPANY)
WFNT (1470 AM; 5 kW; FLINT, MI)
WILS (1320 AM; 5 kW; LANSING, MI)
Strongest FM radio stations in Howell:
WHMI-FM (93.5 FM; HOWELL, MI; Owner: THE LIVINGSTON RADIO COMPANY)
WUOM (91.7 FM; ANN ARBOR, MI; Owner: THE REGENTS OF THE UNIV. OF MICH.)
WKAR-FM (90.5 FM; EAST LANSING, MI; Owner: MICHIGAN STATE UNIVERSITY)
WLGH (88.1 FM; LEROY TOWNSHIP, MI; Owner: SUPERIOR COMMUNICATIONS)
WAAQ (88.3 FM; ONSTED, MI; Owner: GREAT LAKES COMMUNITY BROADCASTING, INC.)
WRIF (101.1 FM; DETROIT, MI; Owner: GREATER BOSTON RADIO, INC.)
WFMK (99.1 FM; EAST LANSING, MI; Owner: CITADEL BROADCASTING COMPANY)
WITL-FM (100.7 FM; LANSING, MI; Owner: CITADEL BROADCASTING COMPANY)
WKRK-FM (97.1 FM; DETROIT, MI; Owner: INFINITY BROADCASTING OPERATIONS, INC.)
WMGC-FM (105.1 FM; DETROIT, MI; Owner: GREATER BOSTON RADIO, INC.)
WCSX (94.7 FM; BIRMINGHAM, MI; Owner: GREATER BOSTON RADIO, INC.)
WWWW (102.9 FM; ANN ARBOR, MI; Owner: CAPSTAR TX LIMITED PARTNERSHIP)
WYCD (99.5 FM; DETROIT, MI; Owner: INFINITY BROADCASTING CORPORATION OF MICHIGAN)
WFBE (95.1 FM; FLINT, MI; Owner: CITADEL BROADCASTING COMPANY)
WFUM-FM (91.1 FM; FLINT, MI; Owner: THE REGENTS OF THE UNIV. OF MICHIGAN)
WQKL (107.1 FM; ANN ARBOR, MI; Owner: CAPSTAR TX LIMITED PARTNERSHIP)
TV broadcast stations around Howell:
WPXD (Channel 31; ANN ARBOR, MI; Owner: PAXSON COMMUNICATIONS LICENSE COMPANY, LLC)
WLNS-TV (Channel 6; LANSING, MI; Owner: YOUNG BROADCASTING OF LANSING, INC.)
WKAR-TV (Channel 23; EAST LANSING, MI; Owner: BOARD OF TRUSTEES, MICH. STATE UNIV.)
WXYZ-TV (Channel 7; DETROIT, MI; Owner: CHANNEL 7 OF DETROIT, INC.)
WJBK (Channel 2; DETROIT, MI; Owner: FOX TELEVISION STATIONS, INC.)
WKBD (Channel 50; DETROIT, MI; Owner: VIACOM STATIONS GROUP OF DETROIT INC.)
WLAJ (Channel 53; LANSING, MI; Owner: FREEDOM BROADCASTING OF MICHIGAN, INC.)
WHTV (Channel 18; JACKSON, MI; Owner: SPARTAN-TV, L.L.C.)
WFUM (Channel 28; FLINT, MI; Owner: UNIVERSITY OF MICHIGAN)
WEYI-TV (Channel 25; SAGINAW, MI; Owner: WEYI BROADCASTING, LLC)
WILX-TV (Channel 10; ONONDAGA, MI; Owner: GRAY MIDAMERICA TV LICENSEE CORP.)
W69BJ (Channel 69; LANSING, MI; Owner: TRI-STATE CHRISTIAN TV, INC.)
WDIV-TV (Channel 4; DETROIT, MI; Owner: POST-NEWSWEEK STATIONS, MICHIGAN, INC.)
WWJ-TV (Channel 62; DETROIT, MI; Owner: CBS BROADCASTING INC.)
WDWB (Channel 20; DETROIT, MI; Owner: WXON LICENSE, INC.)
WTVS (Channel 56; DETROIT, MI; Owner: DETROIT EDUC. TV FOUNDATION)
WSYM-TV (Channel 47; LANSING, MI; Owner: JOURNAL BROADCAST CORPORATION)
WSMH (Channel 66; FLINT, MI; Owner: WSMH LICENSEE, LLC)
WAQP (Channel 49; SAGINAW, MI; Owner: TCT OF MICHIGAN, INC.)
WJRT-TV (Channel 12; FLINT, MI; Owner: FLINT LICENSE SUBSIDIARY CORP.)
W24CG (Channel 24; HOUGHTON LAKE, MI; Owner: MS COMMUNICATIONS, LLC)
National Bridge Inventory (NBI) Statistics 37 Number of bridges338ft / 103m Total length $30,000 Total costs604,927 Total average daily traffic49,364 Total average daily truck traffic
New bridges - historical statistics
1 1910-1919 1 1920-1929 2 1930-1939 2 1940-1949 1 1950-1959 14 1960-1969 6 1980-1989 6 2000-2009 3 2010-2019 1 2020-2022
See full National Bridge Inventory statistics for Howell, MI
Home Mortgage Disclosure Act Aggregated Statistics For Year 2009(Based on 2 full tracts) A) FHA, FSA/RHS & VA B) Conventional C) Refinancings D) Home Improvement Loans E) Loans on Dwellings For 5+ Families F) Non-occupant Loans on G) Loans On Manufactured Number Average Value Number Average Value Number Average Value Number Average Value Number Average Value Number Average Value Number Average Value
LOANS ORIGINATED 40 $112,687 16 $77,111 81 $139,088 4 $59,488 1 $2,118,000 12 $88,984 0 $0 APPLICATIONS APPROVED, NOT ACCEPTED 3 $107,590 3 $85,330 9 $154,620 1 $11,990 1 $675,000 0 $0 1 $18,990 APPLICATIONS DENIED 7 $93,991 5 $79,000 44 $152,635 6 $12,828 0 $0 5 $136,800 0 $0 APPLICATIONS WITHDRAWN 6 $96,138 4 $93,492 15 $138,769 0 $0 0 $0 1 $37,970 0 $0 FILES CLOSED FOR INCOMPLETENESS 1 $142,900 1 $104,000 5 $146,174 1 $9,990 0 $0 2 $95,000 0 $0
Aggregated Statistics For Year 2008(Based on 2 full tracts) A) FHA, FSA/RHS & VA B) Conventional C) Refinancings D) Home Improvement Loans F) Non-occupant Loans on G) Loans On Manufactured Number Average Value Number Average Value Number Average Value Number Average Value Number Average Value Number Average Value
LOANS ORIGINATED 36 $133,371 33 $118,915 72 $134,333 9 $23,997 17 $123,511 2 $11,000 APPLICATIONS APPROVED, NOT ACCEPTED 1 $85,940 5 $64,972 20 $133,470 1 $5,000 2 $63,980 2 $29,000 APPLICATIONS DENIED 12 $132,304 24 $63,109 53 $158,943 10 $51,281 4 $72,482 14 $28,206 APPLICATIONS WITHDRAWN 6 $121,780 3 $172,967 18 $156,782 1 $164,880 3 $172,300 0 $0 FILES CLOSED FOR INCOMPLETENESS 2 $147,960 2 $100,500 4 $137,690 0 $0 0 $0 0 $0
Aggregated Statistics For Year 2007(Based on 2 full tracts) A) FHA, FSA/RHS & VA B) Conventional C) Refinancings D) Home Improvement Loans E) Loans on Dwellings For 5+ Families F) Non-occupant Loans on G) Loans On Manufactured Number Average Value Number Average Value Number Average Value Number Average Value Number Average Value Number Average Value Number Average Value
LOANS ORIGINATED 6 $140,120 131 $125,852 134 $133,715 8 $71,460 1 $3,997,200 32 $121,756 8 $30,729 APPLICATIONS APPROVED, NOT ACCEPTED 0 $0 18 $96,573 33 $120,863 5 $103,378 0 $0 5 $124,152 4 $12,742 APPLICATIONS DENIED 2 $166,440 44 $108,863 123 $143,029 19 $47,521 0 $0 17 $161,077 16 $30,298 APPLICATIONS WITHDRAWN 0 $0 21 $122,412 28 $132,535 0 $0 0 $0 4 $115,472 0 $0 FILES CLOSED FOR INCOMPLETENESS 0 $0 4 $132,498 10 $160,940 0 $0 0 $0 2 $82,940 0 $0
Aggregated Statistics For Year 2006(Based on 2 full tracts) A) FHA, FSA/RHS & VA B) Conventional C) Refinancings D) Home Improvement Loans E) Loans on Dwellings For 5+ Families F) Non-occupant Loans on G) Loans On Manufactured Number Average Value Number Average Value Number Average Value Number Average Value Number Average Value Number Average Value Number Average Value
LOANS ORIGINATED 9 $136,077 161 $131,455 189 $119,576 15 $80,707 2 $444,780 14 $163,376 10 $18,889 APPLICATIONS APPROVED, NOT ACCEPTED 0 $0 36 $90,136 36 $149,634 3 $11,663 0 $0 7 $143,680 9 $26,983 APPLICATIONS DENIED 1 $133,000 53 $118,762 133 $149,197 22 $36,984 0 $0 4 $127,705 11 $40,082 APPLICATIONS WITHDRAWN 0 $0 24 $104,152 58 $147,519 5 $169,168 0 $0 3 $86,277 2 $8,495 FILES CLOSED FOR INCOMPLETENESS 0 $0 3 $125,297 23 $157,601 1 $150,000 0 $0 1 $67,000 0 $0
Aggregated Statistics For Year 2005(Based on 2 full tracts) A) FHA, FSA/RHS & VA B) Conventional C) Refinancings D) Home Improvement Loans E) Loans on Dwellings For 5+ Families F) Non-occupant Loans on G) Loans On Manufactured Number Average Value Number Average Value Number Average Value Number Average Value Number Average Value Number Average Value Number Average Value
LOANS ORIGINATED 7 $142,079 221 $128,043 271 $135,737 19 $75,336 0 $0 32 $134,237 10 $30,579 APPLICATIONS APPROVED, NOT ACCEPTED 0 $0 30 $153,175 40 $138,690 1 $11,000 1 $196,000 6 $98,620 0 $0 APPLICATIONS DENIED 1 $152,890 83 $82,254 131 $146,760 11 $48,356 0 $0 9 $135,939 44 $24,009 APPLICATIONS WITHDRAWN 0 $0 37 $130,584 63 $149,375 6 $208,333 0 $0 5 $170,920 0 $0 FILES CLOSED FOR INCOMPLETENESS 1 $152,890 10 $112,949 29 $160,277 0 $0 0 $0 0 $0 1 $18,990
Aggregated Statistics For Year 2004(Based on 2 full tracts) A) FHA, FSA/RHS & VA B) Conventional C) Refinancings D) Home Improvement Loans E) Loans on Dwellings For 5+ Families F) Non-occupant Loans on G) Loans On Manufactured Number Average Value Number Average Value Number Average Value Number Average Value Number Average Value Number Average Value Number Average Value
LOANS ORIGINATED 12 $155,598 327 $149,266 327 $138,129 27 $64,904 1 $1,598,880 45 $128,160 4 $10,745 APPLICATIONS APPROVED, NOT ACCEPTED 2 $147,445 35 $159,745 38 $150,966 2 $23,000 0 $0 5 $124,184 0 $0 APPLICATIONS DENIED 1 $279,800 53 $120,573 106 $135,444 19 $38,458 0 $0 7 $150,627 20 $25,237 APPLICATIONS WITHDRAWN 1 $169,000 29 $138,016 60 $134,676 5 $31,792 0 $0 5 $95,970 3 $22,650 FILES CLOSED FOR INCOMPLETENESS 2 $164,885 10 $103,265 28 $147,081 2 $110,940 0 $0 0 $0 2 $24,485
Aggregated Statistics For Year 2003(Based on 2 full tracts) A) FHA, FSA/RHS & VA B) Conventional C) Refinancings D) Home Improvement Loans E) Loans on Dwellings For 5+ Families F) Non-occupant Loans on Number Average Value Number Average Value Number Average Value Number Average Value Number Average Value Number Average Value
LOANS ORIGINATED 27 $150,756 252 $153,766 682 $139,315 22 $17,450 2 $534,500 42 $100,975 APPLICATIONS APPROVED, NOT ACCEPTED 2 $159,500 28 $157,537 73 $141,573 4 $12,745 0 $0 7 $125,369 APPLICATIONS DENIED 3 $184,957 50 $96,038 135 $166,763 20 $24,395 1 $649,550 10 $133,900 APPLICATIONS WITHDRAWN 0 $0 16 $154,318 97 $128,885 2 $20,485 0 $0 8 $138,704 FILES CLOSED FOR INCOMPLETENESS 6 $132,250 9 $163,850 25 $166,412 1 $14,990 0 $0 2 $121,455
Aggregated Statistics For Year 2002(Based on 2 full tracts) A) FHA, FSA/RHS & VA B) Conventional C) Refinancings D) Home Improvement Loans E) Loans on Dwellings For 5+ Families F) Non-occupant Loans on Number Average Value Number Average Value Number Average Value Number Average Value Number Average Value Number Average Value
LOANS ORIGINATED 17 $141,185 196 $127,999 463 $125,481 27 $17,105 2 $402,305 29 $123,376 APPLICATIONS APPROVED, NOT ACCEPTED 1 $124,000 38 $102,946 39 $134,936 6 $13,660 0 $0 2 $49,965 APPLICATIONS DENIED 6 $142,612 53 $51,075 106 $114,981 25 $16,152 0 $0 5 $143,744 APPLICATIONS WITHDRAWN 3 $132,600 14 $128,098 58 $114,930 0 $0 0 $0 5 $117,760 FILES CLOSED FOR INCOMPLETENESS 2 $138,405 4 $84,190 22 $153,456 0 $0 0 $0 3 $113,980
Aggregated Statistics For Year 2001(Based on 2 full tracts) A) FHA, FSA/RHS & VA B) Conventional C) Refinancings D) Home Improvement Loans E) Loans on Dwellings For 5+ Families F) Non-occupant Loans on Number Average Value Number Average Value Number Average Value Number Average Value Number Average Value Number Average Value
LOANS ORIGINATED 34 $130,580 146 $129,825 371 $126,225 33 $18,325 0 $0 14 $113,538 APPLICATIONS APPROVED, NOT ACCEPTED 1 $118,000 25 $103,020 40 $105,867 4 $63,985 0 $0 0 $0 APPLICATIONS DENIED 5 $144,382 123 $36,650 105 $94,788 34 $8,378 0 $0 4 $52,962 APPLICATIONS WITHDRAWN 2 $148,395 11 $98,892 60 $123,435 5 $16,190 1 $659,540 2 $85,465 FILES CLOSED FOR INCOMPLETENESS 0 $0 4 $201,205 21 $143,219 0 $0 0 $0 1 $116,000
Aggregated Statistics For Year 2000(Based on 2 full tracts) A) FHA, FSA/RHS & VA B) Conventional C) Refinancings D) Home Improvement Loans E) Loans on Dwellings For 5+ Families F) Non-occupant Loans on Number Average Value Number Average Value Number Average Value Number Average Value Number Average Value Number Average Value
LOANS ORIGINATED 39 $133,177 184 $108,190 98 $101,653 44 $20,470 0 $0 21 $109,393 APPLICATIONS APPROVED, NOT ACCEPTED 1 $117,920 52 $54,392 17 $125,912 22 $21,677 0 $0 2 $69,485 APPLICATIONS DENIED 5 $129,138 127 $37,052 52 $66,171 39 $15,045 0 $0 12 $76,831 APPLICATIONS WITHDRAWN 1 $166,880 10 $111,675 48 $108,310 7 $29,563 2 $259,000 4 $122,185 FILES CLOSED FOR INCOMPLETENESS 0 $0 8 $133,710 8 $110,336 0 $0 0 $0 1 $118,920
Aggregated Statistics For Year 1999(Based on 1 full and 1 partial tracts) A) FHA, FSA/RHS & VA B) Conventional C) Refinancings D) Home Improvement Loans E) Loans on Dwellings For 5+ Families F) Non-occupant Loans on Number Average Value Number Average Value Number Average Value Number Average Value Number Average Value Number Average Value
LOANS ORIGINATED 16 $129,621 153 $95,422 161 $103,337 31 $17,005 1 $408,480 15 $88,640 APPLICATIONS APPROVED, NOT ACCEPTED 0 $0 44 $57,952 31 $92,680 6 $30,238 0 $0 5 $71,560 APPLICATIONS DENIED 0 $0 112 $34,469 62 $85,560 17 $17,835 0 $0 13 $87,472 APPLICATIONS WITHDRAWN 2 $104,775 14 $780,236 34 $107,789 4 $42,220 0 $0 1 $63,950 FILES CLOSED FOR INCOMPLETENESS 1 $127,890 4 $140,870 16 $110,994 0 $0 0 $0 0 $0
Detailed HMDA statistics for the following Tracts:
7250.00
, 7251.00
Private Mortgage Insurance Companies Aggregated Statistics For Year 2009(Based on 2 full tracts) A) Conventional B) Refinancings Number Average Value Number Average Value
LOANS ORIGINATED 1 $113,000 1 $124,910 APPLICATIONS APPROVED, NOT ACCEPTED 2 $118,500 1 $137,900 APPLICATIONS DENIED 0 $0 0 $0 APPLICATIONS WITHDRAWN 0 $0 1 $137,900 FILES CLOSED FOR INCOMPLETENESS 0 $0 0 $0
Aggregated Statistics For Year 2008(Based on 2 full tracts) A) Conventional B) Refinancings C) Non-occupant Loans on Number Average Value Number Average Value Number Average Value
LOANS ORIGINATED 16 $122,719 11 $160,413 2 $64,975 APPLICATIONS APPROVED, NOT ACCEPTED 10 $141,552 3 $213,963 0 $0 APPLICATIONS DENIED 2 $105,450 0 $0 2 $105,450 APPLICATIONS WITHDRAWN 0 $0 0 $0 0 $0 FILES CLOSED FOR INCOMPLETENESS 1 $229,840 0 $0 1 $229,840
Aggregated Statistics For Year 2007(Based on 2 full tracts) A) Conventional B) Refinancings C) Non-occupant Loans on Number Average Value Number Average Value Number Average Value
LOANS ORIGINATED 37 $158,125 14 $201,978 1 $257,000 APPLICATIONS APPROVED, NOT ACCEPTED 5 $177,310 4 $157,720 0 $0 APPLICATIONS DENIED 0 $0 1 $129,000 0 $0 APPLICATIONS WITHDRAWN 1 $257,000 1 $129,000 1 $257,000 FILES CLOSED FOR INCOMPLETENESS 1 $143,900 0 $0 0 $0
Aggregated Statistics For Year 2006(Based on 2 full tracts) A) Conventional B) Refinancings C) Non-occupant Loans on Number Average Value Number Average Value Number Average Value
LOANS ORIGINATED 23 $165,777 13 $178,107 3 $151,573 APPLICATIONS APPROVED, NOT ACCEPTED 2 $128,935 6 $205,050 2 $199,860 APPLICATIONS DENIED 1 $147,000 0 $0 0 $0 APPLICATIONS WITHDRAWN 1 $255,000 1 $223,000 0 $0 FILES CLOSED FOR INCOMPLETENESS 0 $0 0 $0 0 $0
Aggregated Statistics For Year 2005(Based on 2 full tracts) A) Conventional B) Refinancings C) Non-occupant Loans on Number Average Value Number Average Value Number Average Value
LOANS ORIGINATED 29 $183,034 20 $203,034 3 $156,300 APPLICATIONS APPROVED, NOT ACCEPTED 10 $219,473 9 $189,381 2 $170,950 APPLICATIONS DENIED 0 $0 0 $0 0 $0 APPLICATIONS WITHDRAWN 0 $0 1 $281,800 0 $0 FILES CLOSED FOR INCOMPLETENESS 0 $0 0 $0 0 $0
Aggregated Statistics For Year 2004(Based on 2 full tracts) A) Conventional B) Refinancings C) Non-occupant Loans on Number Average Value Number Average Value Number Average Value
LOANS ORIGINATED 35 $163,624 22 $157,966 4 $112,728 APPLICATIONS APPROVED, NOT ACCEPTED 10 $179,265 5 $170,560 0 $0 APPLICATIONS DENIED 0 $0 0 $0 0 $0 APPLICATIONS WITHDRAWN 2 $166,500 1 $207,000 0 $0 FILES CLOSED FOR INCOMPLETENESS 0 $0 1 $129,910 0 $0
Aggregated Statistics For Year 2003(Based on 2 full tracts) A) Conventional B) Refinancings C) Non-occupant Loans on Number Average Value Number Average Value Number Average Value
LOANS ORIGINATED 39 $170,528 62 $169,854 4 $99,750 APPLICATIONS APPROVED, NOT ACCEPTED 5 $176,364 11 $147,735 1 $64,950 APPLICATIONS DENIED 0 $0 1 $186,870 0 $0 APPLICATIONS WITHDRAWN 1 $152,000 7 $178,670 2 $140,455 FILES CLOSED FOR INCOMPLETENESS 0 $0 1 $202,860 0 $0
Aggregated Statistics For Year 2002(Based on 2 full tracts) A) Conventional B) Refinancings C) Non-occupant Loans on Number Average Value Number Average Value Number Average Value
LOANS ORIGINATED 41 $145,751 56 $145,306 8 $152,942 APPLICATIONS APPROVED, NOT ACCEPTED 11 $130,289 12 $149,423 1 $143,900 APPLICATIONS DENIED 0 $0 2 $138,445 0 $0 APPLICATIONS WITHDRAWN 4 $149,722 6 $133,267 1 $152,890 FILES CLOSED FOR INCOMPLETENESS 0 $0 0 $0 0 $0
Aggregated Statistics For Year 2001(Based on 2 full tracts) A) Conventional B) Refinancings C) Non-occupant Loans on Number Average Value Number Average Value Number Average Value
LOANS ORIGINATED 46 $146,935 61 $151,852 2 $127,950 APPLICATIONS APPROVED, NOT ACCEPTED 8 $148,991 12 $134,045 0 $0 APPLICATIONS DENIED 0 $0 2 $146,395 0 $0 APPLICATIONS WITHDRAWN 0 $0 0 $0 0 $0 FILES CLOSED FOR INCOMPLETENESS 0 $0 1 $202,000 0 $0
Aggregated Statistics For Year 2000(Based on 2 full tracts) A) Conventional B) Refinancings C) Non-occupant Loans on Number Average Value Number Average Value Number Average Value
LOANS ORIGINATED 41 $134,665 10 $133,840 4 $116,940 APPLICATIONS APPROVED, NOT ACCEPTED 1 $124,000 3 $123,270 0 $0 APPLICATIONS DENIED 2 $123,455 0 $0 1 $125,000 APPLICATIONS WITHDRAWN 1 $135,900 0 $0 0 $0 FILES CLOSED FOR INCOMPLETENESS 0 $0 0 $0 0 $0
Aggregated Statistics For Year 1999(Based on 1 full and 1 partial tracts) A) Conventional B) Refinancings C) Non-occupant Loans on Number Average Value Number Average Value Number Average Value
LOANS ORIGINATED 36 $121,152 8 $112,606 2 $100,780 APPLICATIONS APPROVED, NOT ACCEPTED 1 $88,540 2 $191,720 0 $0 APPLICATIONS DENIED 0 $0 1 $119,040 0 $0 APPLICATIONS WITHDRAWN 2 $82,125 2 $98,380 1 $66,900 FILES CLOSED FOR INCOMPLETENESS 0 $0 0 $0 0 $0
Detailed PMIC statistics for the following Tracts:
7250.00
, 7251.00 Fire-safe hotels and motels in Howell, Michigan:
Knights Inn, 124 Holiday Ln, Howell, Michigan 48843 Phone: (517) 548-3510, Fax: (517) 548-1122
Holiday Inn Express & Suites, 1397 N Burkhart Rd, Howell, Michigan 48855 Phone: (517) 548-0100, Fax: (517) 548-0717
Baymont Inn & Suites, 4120 Lambert Dr, Howell, Michigan 48855 Phone: (517) 546-0712, Fax: (517) 546-0752
Best Western Of Howell, 1500 Pinckney Rd, Howell, Michigan 48843 Phone: (517) 548-2900, Fax: (517) 548-2163
All 4 fire-safe hotels and motels in Howell, Michigan
Most common first names in Howell, MI among deceased individuals Name Count Lived (average)
William 170 74.9 years Mary 162 79.2 years John 161 74.6 years Robert 150 71.6 years James 115 69.4 years Helen 106 82.4 years Charles 88 77.9 years Margaret 87 81.3 years George 84 77.7 years Dorothy 82 78.3 years
Most common last names in Howell, MI among deceased individuals Last name Count Lived (average)
Smith 86 74.5 years Brown 38 78.5 years Miller 38 77.0 years Johnson 38 74.3 years Williams 29 76.7 years Cook 26 76.2 years White 26 76.6 years Clark 25 81.9 years Walker 23 77.2 years Wright 22 75.9 years
Howell compared to Michigan state average:
Unemployed percentage significantly below state average. Black race population percentage significantly below state average. Median age below state average. Foreign-born population percentage below state average. Renting percentage above state average. Number of rooms per house below state average. Institutionalized population percentage above state average.
Top Patent Applicants
Michael J. Paratore, Jr. (91)
Edwin T. Grochowski (34)
Christopher Whitt (30)
Reid Alan Baldwin (22)
Joel Colombo (20)
Matthew D. Whitton (18)
Todd Ekonen (18)
Hashem Akhavan-Tafti (17)
Donald J. Lewis (16)
Thomas Larose, Jr. (16)
Total of 1202 patent applications in 2008-2024.


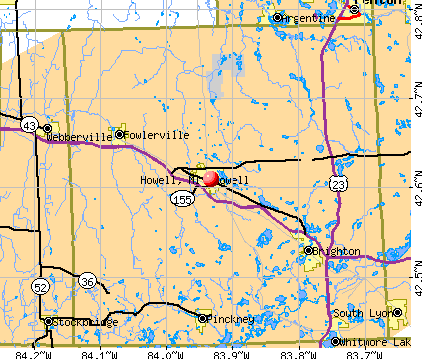


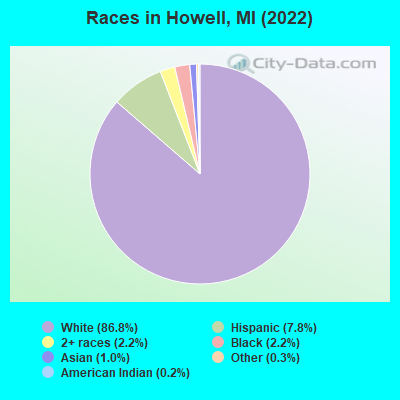
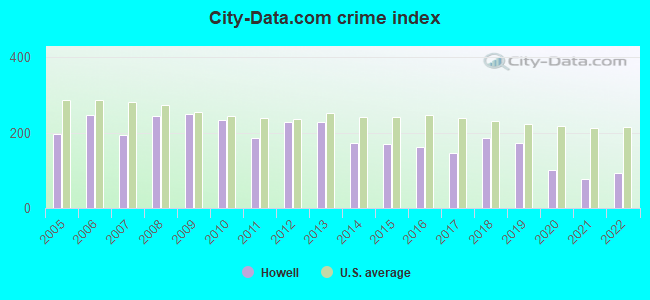
 Recent articles from our blog. Our writers, many of them Ph.D. graduates or candidates, create easy-to-read articles on a wide variety of topics.

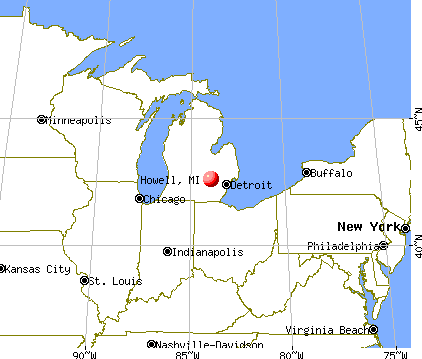
 (25.2 miles
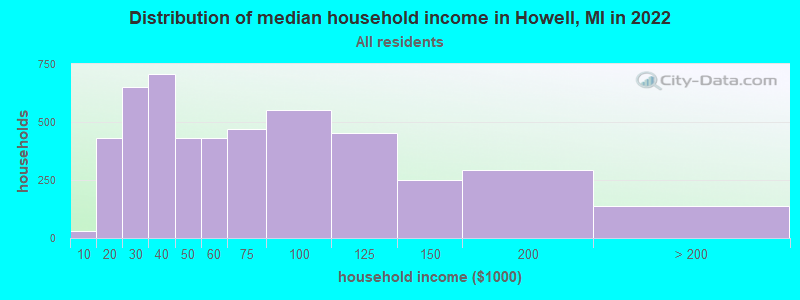
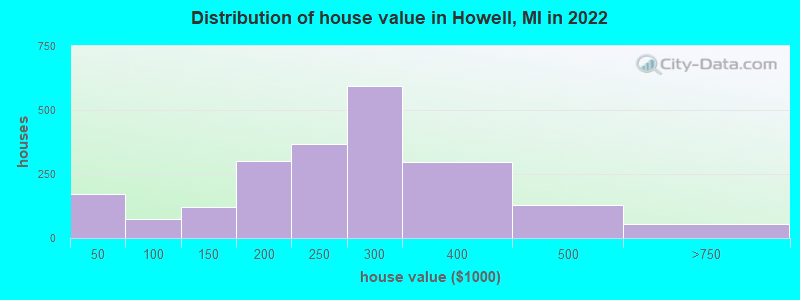
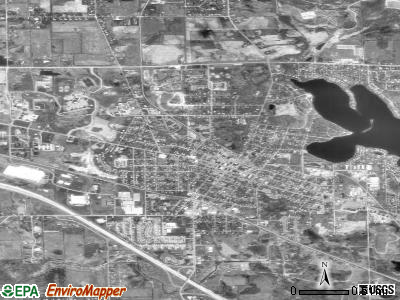
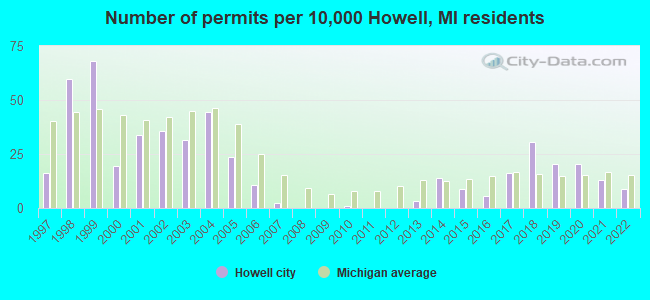
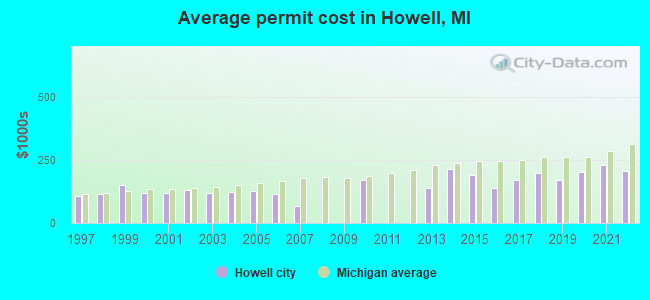
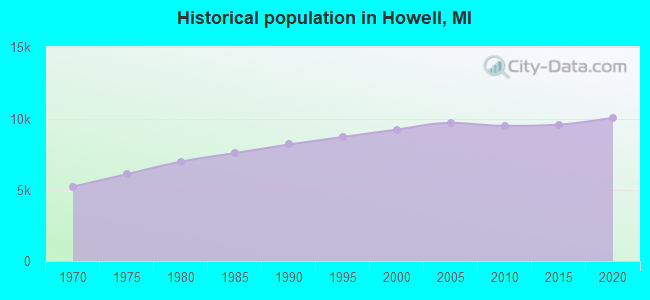
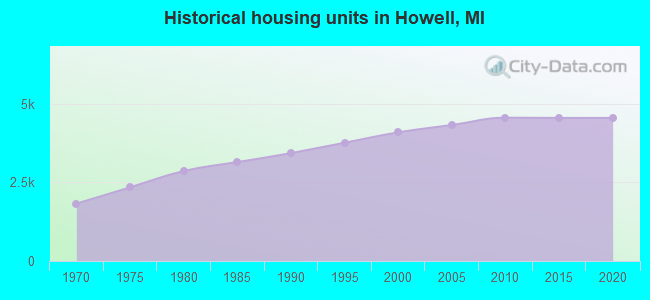
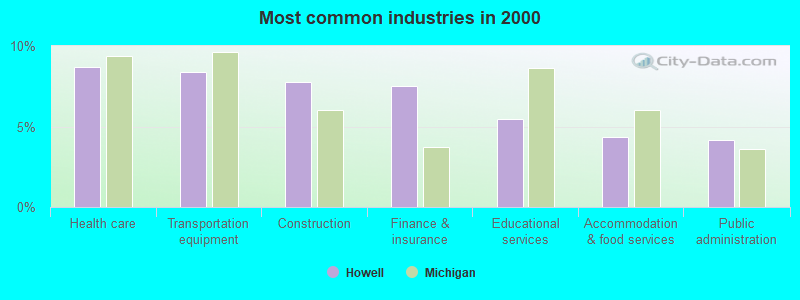
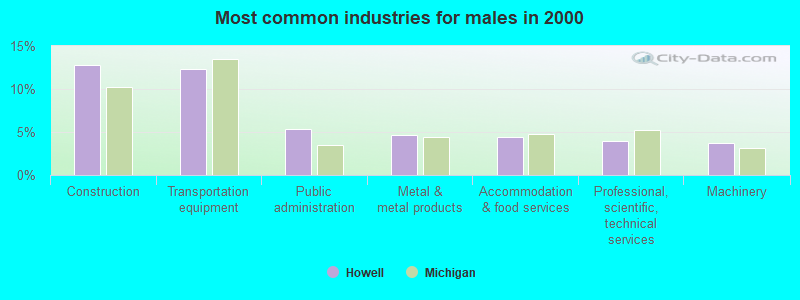
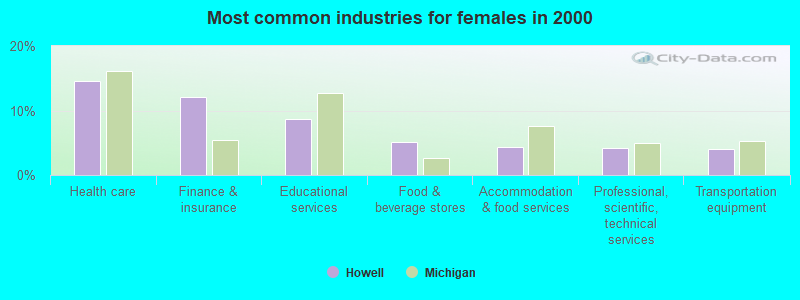
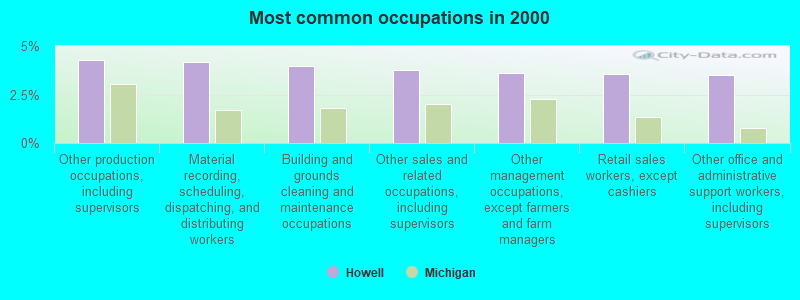
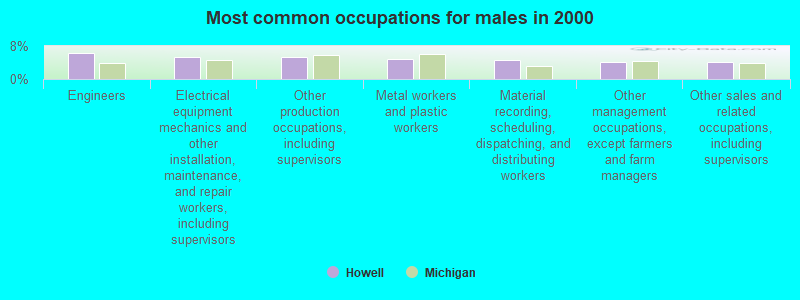
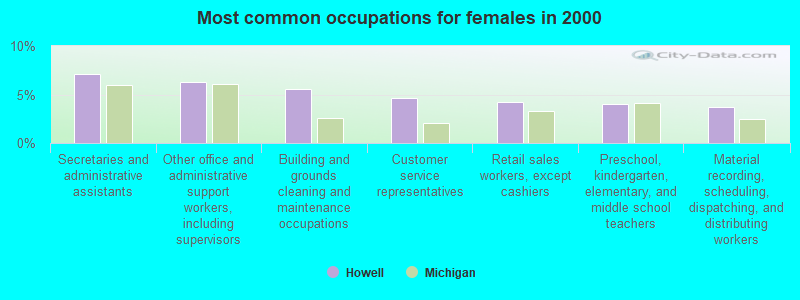
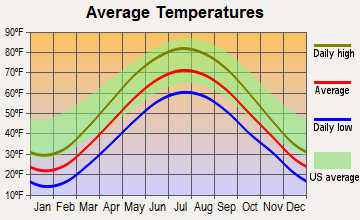
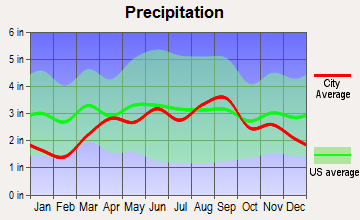
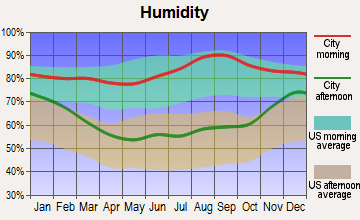
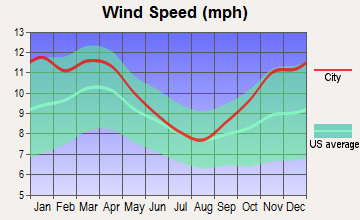
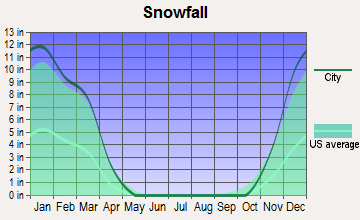
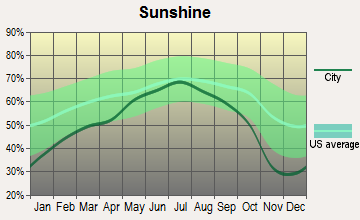
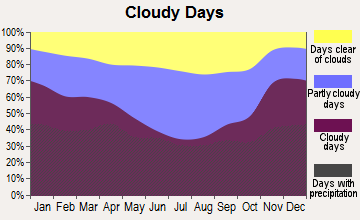
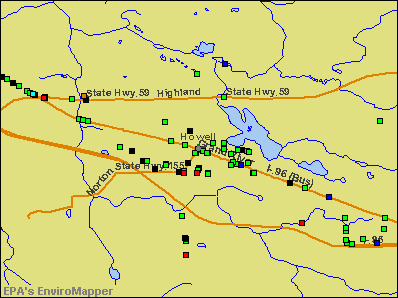

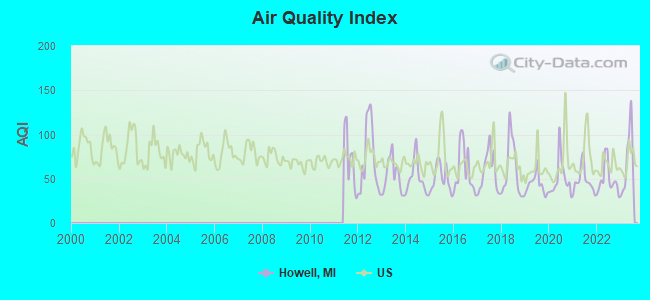
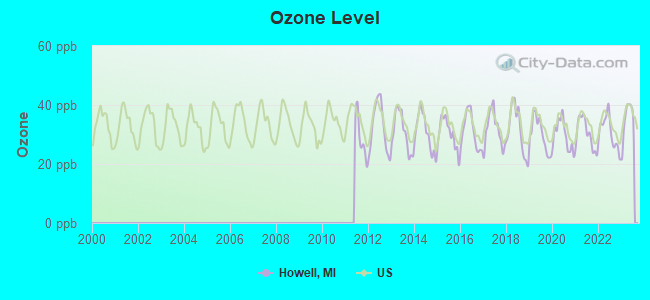
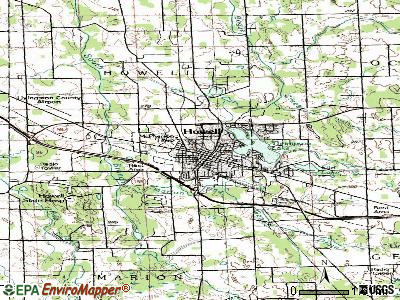
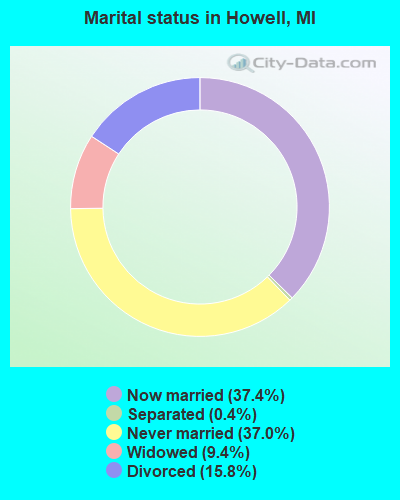
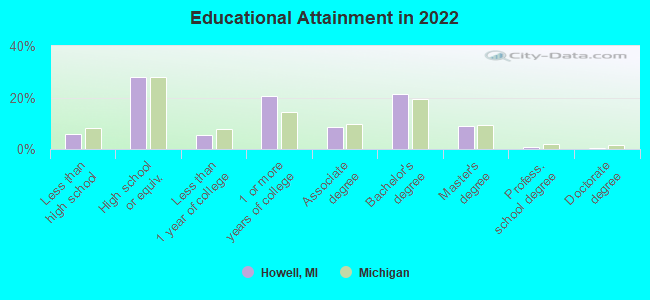
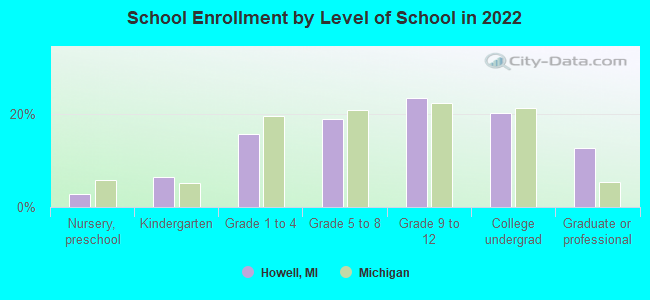
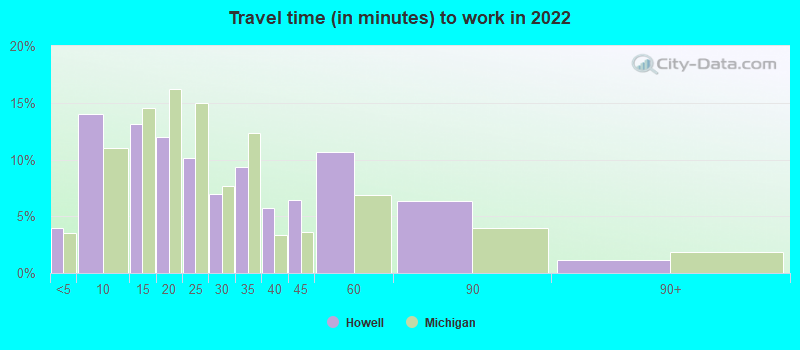
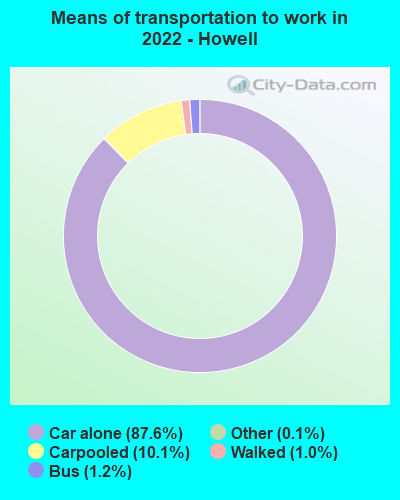
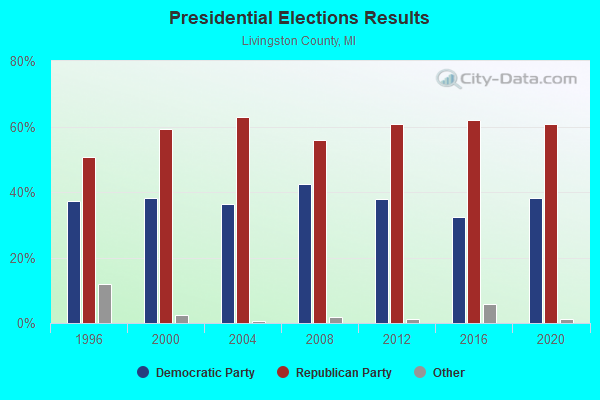
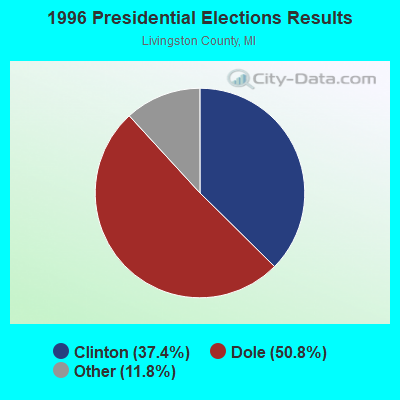
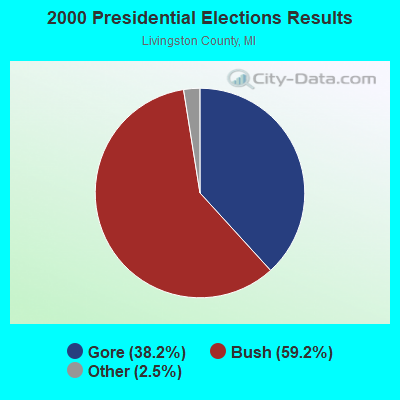
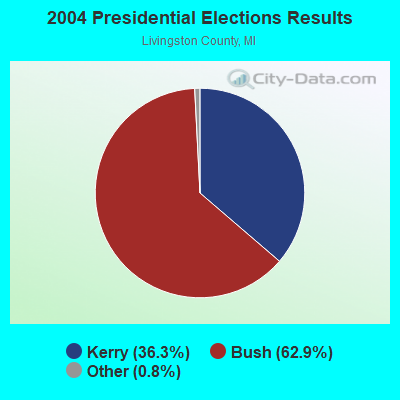
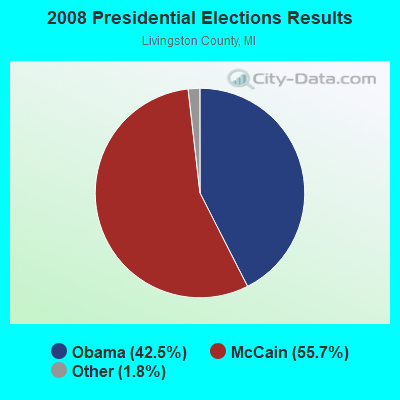
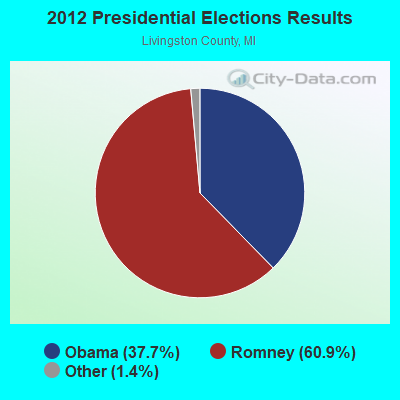
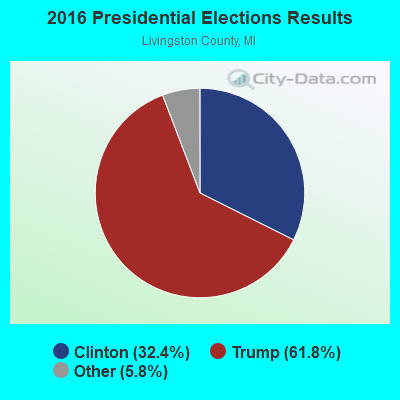
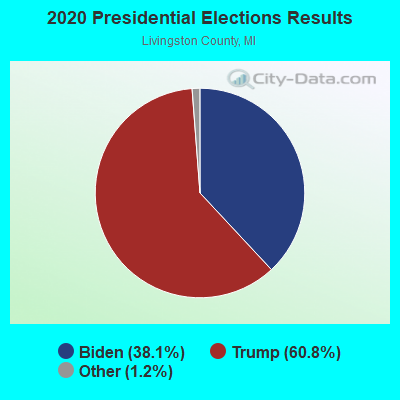
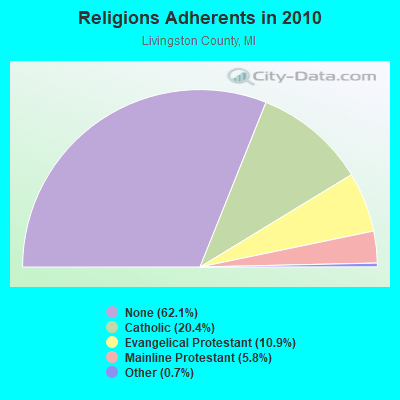
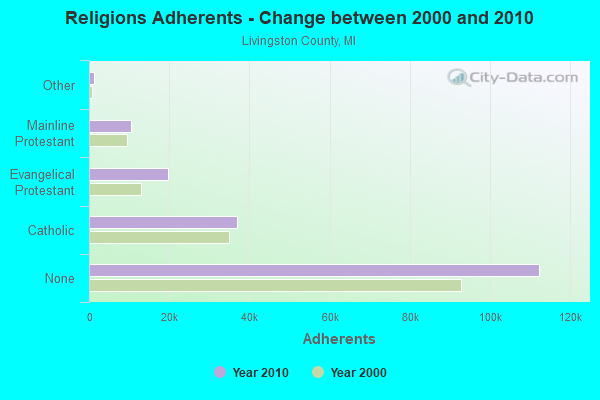
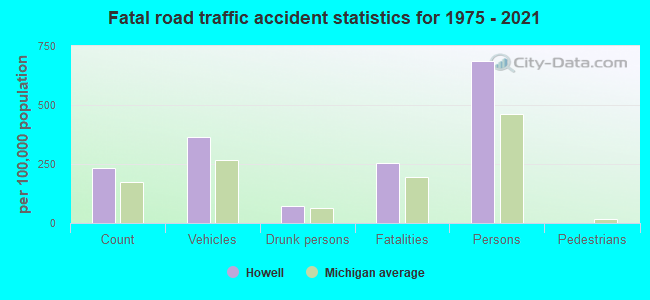
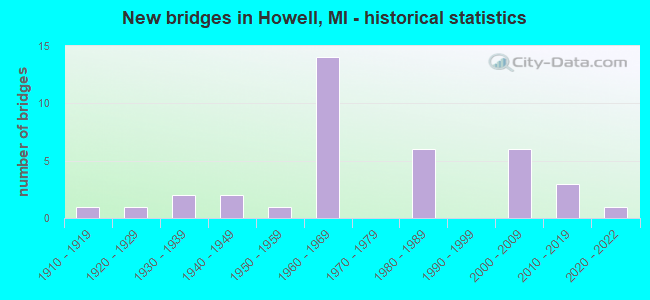
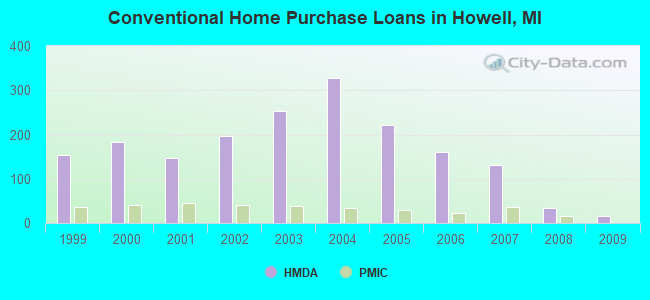
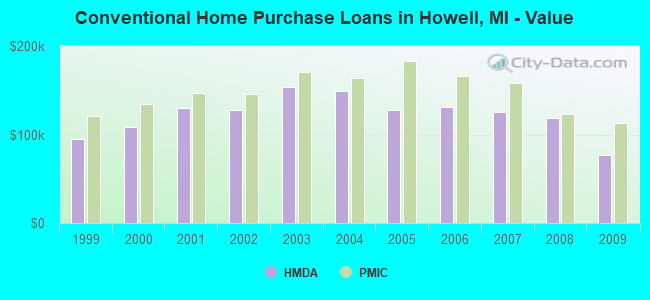
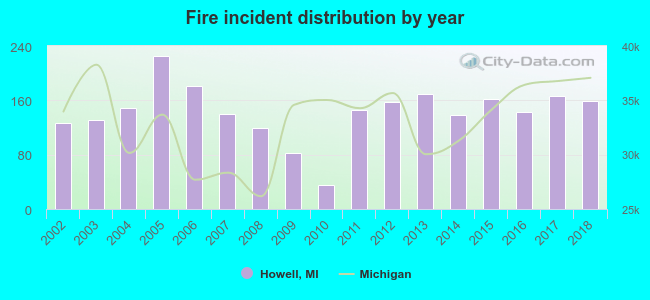 According to the data from the years 2002 - 2018 the average number of fires per year is 143. The highest number of fire incidents - 225 took place in 2005, and the least - 35 in 2010. The data has a rising trend.
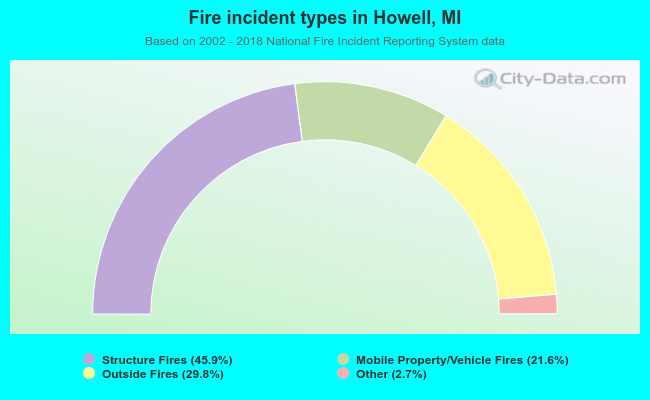 When looking into fire subcategories, the most incidents belonged to: Structure Fires (45.9%), and Outside Fires (29.8%).