Lake Station, Indiana
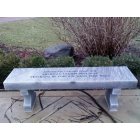
Lake Station: John Masson's Benefit...City Complex not yet finished...American Legion
Lake Station: American Legion post 100 American Legion Post 454 Veterans Of Foreign Wars Post 9323...also at Veterans Memorial Park
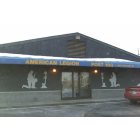
Lake Station: American Legion Post 100 on corner of Central and Grand Blvd.

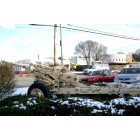
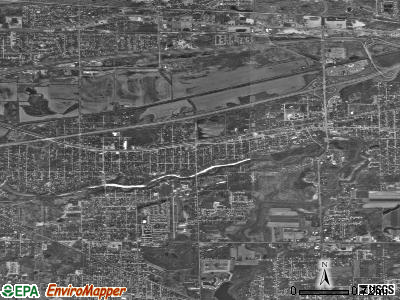
Lake Station: Lake Station Water Way

Lake Station: lake station's community welcome sign
- add
your
Submit your own pictures of this city and show them to the world
- OSM Map
- General Map
- Google Map
- MSN Map
Population change since 2000: -6.1%
 |
| Males: 6,425 | |
| Females: 6,671 |
| Median resident age: | 32.7 years |
| Indiana median age: | 38.2 years |
Zip codes: 46405.
| Lake Station: | $53,354 |
| IN: | $66,785 |
Estimated per capita income in 2022: $23,824 (it was $15,319 in 2000)
Lake Station city income, earnings, and wages data
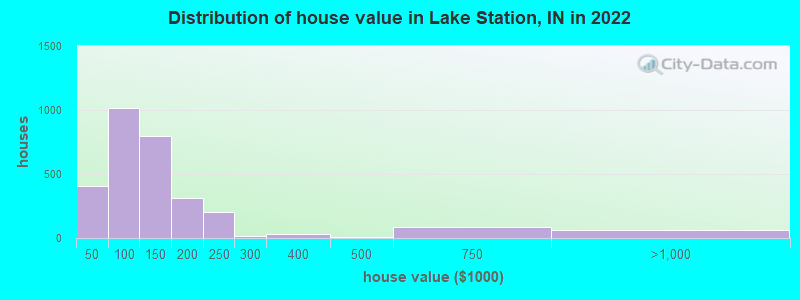
Estimated median house or condo value in 2022: $119,122 (it was $68,000 in 2000)
| Lake Station: | $119,122 |
| IN: | $208,700 |
Mean prices in 2022: all housing units: $140,001; detached houses: $146,138; townhouses or other attached units: $145,809; in 2-unit structures: $253,686; mobile homes: $13,842
Median gross rent in 2022: $1,109.
(13.3% for White Non-Hispanic residents, 24.4% for Black residents, 25.0% for Hispanic or Latino residents, 6.2% for American Indian residents, 12.6% for other race residents, 32.8% for two or more races residents)
Detailed information about poverty and poor residents in Lake Station, IN
Compare current foreclosures in Lake Station, IN:
| Photo | Address | Area | Beds / Baths | Price | Details |
|---|---|---|---|---|---|

|
#1
Saint Joseph Ct
Lake Station, IN 46405
|
780 sq. feet
|
1 baths 2 beds |
show details | |

|
#2
Vigo St
Lake Station, IN 46405
|
1,224 sq. feet
|
1 baths 3 beds |
show details | |

|
#3
Dearborn St
Lake Station, IN 46405
|
912 sq. feet
|
1 baths 3 beds |
show details | |

|
#4
Floyd St
Lake Station, IN 46405
|
1,068 sq. feet
|
2 baths 6 beds |
show details | |

|
#5
Newton St
Lake Station, IN 46405
|
772 sq. feet
|
1 baths 2 beds |
show details | |

|
#6
E 20th Pl
Lake Station, IN 46405
|
1,040 sq. feet
|
1 baths 2 beds |
show details | |

|
#7
Oregon St
Lake Station, IN 46405
|
1,186 sq. feet
|
1 baths 2 beds |
show details | |

|
#8
E 22nd Ave
Lake Station, IN 46405
|
1,169 sq. feet
|
1 baths 3 beds |
show details | |

|
#9
Vermillion St
Lake Station, IN 46405
|
1,750 sq. feet
|
1 baths 3 beds |
show details | |

|
#10
Morgan St
Lake Station, IN 46405
|
1,488 sq. feet
|
1 baths 2 beds |
show details |
| Photo | Address | Area | Beds / Baths | Price | Details |
|---|---|---|---|---|---|

|
#11
Vermillion St
Lake Station, IN 46405
|
1,073 sq. feet
|
1 baths 3 beds |
show details | |

|
#12
Vanderburg St
Lake Station, IN 46405
|
1,328 sq. feet
|
1 baths 3 beds |
show details | |

|
#13
Cosner Ave
Lake Station, IN 46405
|
1,421 sq. feet
|
1 baths 3 beds |
show details | |

|
#14
Liverpool Rd
Lake Station, IN 46405
|
1,860 sq. feet
|
1 baths 3 beds |
show details | |

|
#15
Union St
Lake Station, IN 46405
|
2,330 sq. feet
|
2 baths 3 beds |
show details | |

|
#16
Old Hobart Rd
Lake Station, IN 46405
|
1,976 sq. feet
|
1 baths 3 beds |
show details | |

|
#17
Clay St
Lake Station, IN 46405
|
2,376 sq. feet
|
1 baths 3 beds |
show details | |

|
#18
E 28th Ave
Lake Station, IN 46405
|
1,536 sq. feet
|
1 baths 3 beds |
show details | |

|
#19
Cass St
Lake Station, IN 46405
|
660 sq. feet
|
1 baths 2 beds |
show details | |

|
#20
Clay St
Lake Station, IN 46405
|
2,785 sq. feet
|
2 baths 3 beds |
show details |
| Photo | Address | Area | Beds / Baths | Price | Details |
|---|---|---|---|---|---|

|
#21
Ripley St
Lake Station, IN 46405
|
1,040 sq. feet
|
1 baths 3 beds |
show details | |

|
#22
E 35th Pl
Lake Station, IN 46405
|
2,030 sq. feet
|
2 baths 3 beds |
show details | |

|
#23
Howard St
Lake Station, IN 46405
|
2,688 sq. feet
|
2 baths 3 beds |
show details | |

|
#24
Marquette Rd
Lake Station, IN 46405
|
2,150 sq. feet
|
2 baths 3 beds |
show details | |

|
#25
Deer Run Ct
Lake Station, IN 46405
|
2,148 sq. feet
|
2 baths 3 beds |
show details | |

|
#26
Decatur St
Lake Station, IN 46405
|
2,920 sq. feet
|
1 baths 2 beds |
show details | |

|
#27
Wayne St
Lake Station, IN 46405
|
1,264 sq. feet
|
1 baths 3 beds |
show details | |

|
#28
Wayne St
Lake Station, IN 46405
|
2,181 sq. feet
|
1 baths 3 beds |
show details | |

|
#29
Central Ave
Lake Station, IN 46405
|
1,608 sq. feet
|
1 baths 3 beds |
show details | |

|
#30
Liverpool Rd
Lake Station, IN 46405
|
1,561 sq. feet
|
1 baths 3 beds |
show details |
| Photo | Address | Area | Beds / Baths | Price | Details |
|---|---|---|---|---|---|

|
#31
Central Ave
Lake Station, IN 46405
|
816 sq. feet
|
1 baths 3 beds |
show details | |

|
#32
E 21st Ave
Lake Station, IN 46405
|
1,040 sq. feet
|
1 baths 3 beds |
show details | |

|
#33
Warren St
Lake Station, IN 46405
|
1,040 sq. feet
|
1 baths 3 beds |
show details | |

|
#34
Fayette St
Lake Station, IN 46405
|
2,076 sq. feet
|
1 baths 3 beds |
show details | |

|
#35
E 26th Ave
Lake Station, IN 46405
|
2,016 sq. feet
|
1 baths 3 beds |
show details | |

|
#36
California St
Lake Station, IN 46405
|
920 sq. feet
|
1 baths 2 beds |
show details | |

|
#37
New Hampshire St
Lake Station, IN 46405
|
1,092 sq. feet
|
1 baths - beds |
show details | |

|
#38
Morgan St
Lake Station, IN 46405
|
- sq. feet
|
- baths - beds |
show details | |

|
#39
Vigo St
Lake Station, IN 46405
|
- sq. feet
|
- baths - beds |
show details | |

|
#40
Henry St
Lake Station, IN 46405
|
- sq. feet
|
- baths - beds |
show details |
| Photo | Address | Area | Beds / Baths | Price | Details |
|---|---|---|---|---|---|

|
#41
Central Ave
Lake Station, IN 46405
|
- sq. feet
|
- baths - beds |
show details | |

|
#42
E 35th Ave
Lake Station, IN 46405
|
- sq. feet
|
- baths - beds |
show details | |

|
#43
E 10th Ave
Lake Station, IN 46405
|
- sq. feet
|
- baths - beds |
show details | |

|
#44
Union St
Lake Station, IN 46405
|
- sq. feet
|
- baths - beds |
show details | |

|
#45
S Marion Pl
Lake Station, IN 46405
|
- sq. feet
|
- baths - beds |
show details | |

|
#46
E 35th Ave
Lake Station, IN 46405
|
- sq. feet
|
- baths - beds |
show details | |

|
#47
Iowa St
Lake Station, IN 46405
|
- sq. feet
|
- baths - beds |
show details | |

|
#48
S Knox St
Lake Station, IN 46405
|
- sq. feet
|
- baths - beds |
show details | |

|
#49
Old Hobart Rd
Lake Station, IN 46405
|
- sq. feet
|
- baths - beds |
show details | |

|
Check over 1 million property listings on Foreclosure.com!
|
browse all offers | |||


- 7,99759.7%White alone
- 4,27131.9%Hispanic
- 4743.5%Two or more races
- 4363.3%Black alone
- 2181.6%Asian alone
- 160.1%American Indian alone
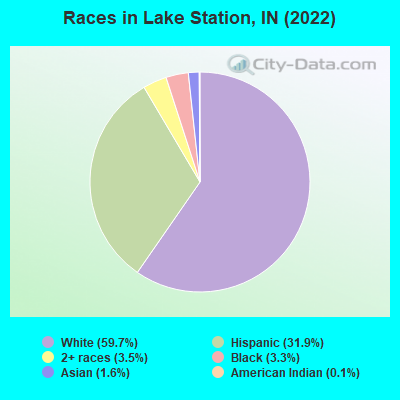
Races in Lake Station detailed stats: ancestries, foreign born residents, place of birth
According to our research of Indiana and other state lists, there were 2 registered sex offenders living in Lake Station, Indiana as of April 27, 2024.
The ratio of all residents to sex offenders in Lake Station is 6,052 to 1.
The ratio of registered sex offenders to all residents in this city is much lower than the state average.
Type |
2010 |
2011 |
2012 |
2013 |
2014 |
2015 |
2016 |
2017 |
2018 |
2019 |
|---|---|---|---|---|---|---|---|---|---|---|
| Murders (per 100,000) | 1 (8.0) | 0 (0.0) | 1 (7.9) | 0 (0.0) | 0 (0.0) | 2 (16.6) | 1 (8.4) | 2 (16.9) | 0 (0.0) | 0 (0.0) |
| Rapes (per 100,000) | 5 (39.8) | 9 (71.2) | 5 (39.7) | 6 (48.6) | 3 (24.7) | 4 (33.1) | 8 (66.9) | 1 (8.4) | 3 (25.3) | 1 (8.5) |
| Robberies (per 100,000) | 8 (63.6) | 5 (39.6) | 8 (63.5) | 9 (73.0) | 9 (74.0) | 11 (91.1) | 14 (117.1) | 6 (50.6) | 11 (92.6) | 1 (8.5) |
| Assaults (per 100,000) | 13 (103.4) | 21 (166.2) | 12 (95.2) | 35 (283.7) | 10 (82.2) | 6 (49.7) | 12 (100.4) | 6 (50.6) | 17 (143.1) | 2 (17.0) |
| Burglaries (per 100,000) | 85 (676.1) | 107 (846.8) | 101 (801.7) | 103 (835.0) | 74 (608.1) | 56 (463.6) | 37 (309.5) | 60 (506.2) | 35 (294.6) | 3 (25.5) |
| Thefts (per 100,000) | 428 (3,404) | 392 (3,102) | 406 (3,222) | 417 (3,381) | 491 (4,035) | 456 (3,775) | 393 (3,287) | 246 (2,076) | 253 (2,130) | 12 (101.8) |
| Auto thefts (per 100,000) | 28 (222.7) | 37 (292.8) | 42 (333.4) | 61 (494.5) | 51 (419.1) | 57 (471.9) | 45 (376.4) | 26 (219.4) | 33 (277.8) | 1 (8.5) |
| Arson (per 100,000) | 4 (31.8) | 13 (102.9) | 14 (111.1) | 0 (0.0) | 3 (24.7) | 0 (0.0) | 0 (0.0) | 5 (42.2) | 4 (33.7) | 0 (0.0) |
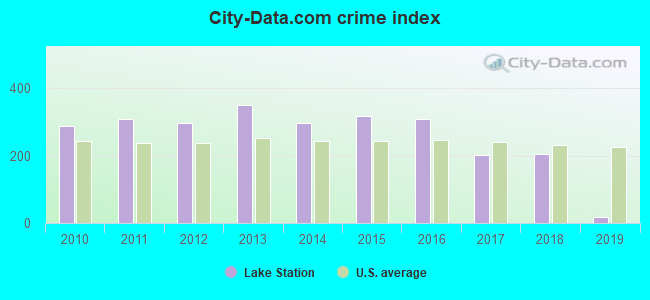
| City-Data.com crime index | 288.8 | 308.9 | 297.4 | 350.8 | 295.8 | 318.0 | 308.7 | 201.8 | 204.6 | 19.3 |
The City-Data.com crime index weighs serious crimes and violent crimes more heavily. Higher means more crime, U.S. average is 246.1. It adjusts for the number of visitors and daily workers commuting into cities.
Crime rate in Lake Station detailed stats: murders, rapes, robberies, assaults, burglaries, thefts, arson
Full-time law enforcement employees in 2018, including police officers: 23 (23 officers - 22 male; 1 female).
| Officers per 1,000 residents here: | 1.94 |
| Indiana average: | 2.08 |
 Recent articles from our blog. Our writers, many of them Ph.D. graduates or candidates, create easy-to-read articles on a wide variety of topics.


Latest news from Lake Station, IN collected exclusively by city-data.com from local newspapers, TV, and radio stations
Ancestries: American (10.4%), Irish (8.0%), German (7.2%), English (3.3%), European (2.6%), Italian (2.6%).
Current Local Time: CST time zone
Elevation: 614 feet
Land area: 8.30 square miles.
Population density: 1,578 people per square mile (low).
1,102 residents are foreign born (5.4% Latin America, 1.5% Asia).
| This city: | 8.2% |
| Indiana: | 5.6% |
Median real estate property taxes paid for housing units with mortgages in 2022: $1,442 (1.1%)
Median real estate property taxes paid for housing units with no mortgage in 2022: $1,226 (1.2%)
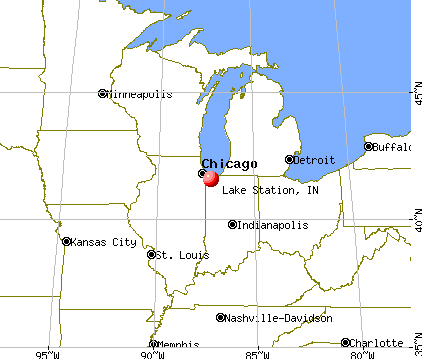
Nearest city with pop. 50,000+: Gary, IN  (4.5 miles , pop. 102,746).
Nearest city with pop. 200,000+: Chicago, IL (28.6 miles , pop. 2,896,016).
Nearest cities:
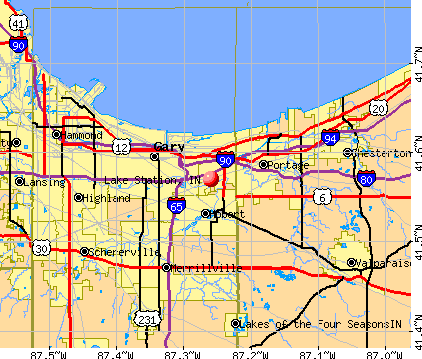
), ), )Latitude: 41.57 N, Longitude: 87.26 W
Daytime population change due to commuting: -2,700 (-20.1%)
Workers who live and work in this city: 780 (15.3%)
Area code: 219
Lake Station, Indiana accommodation & food services, waste management - Economy and Business Data
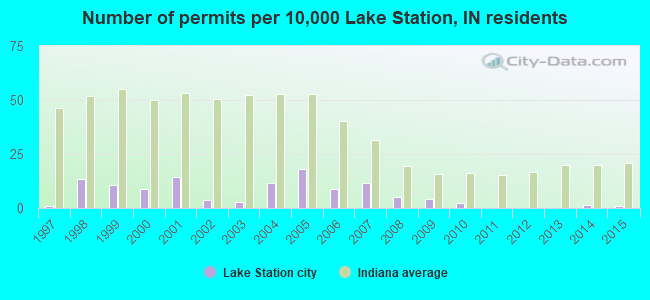
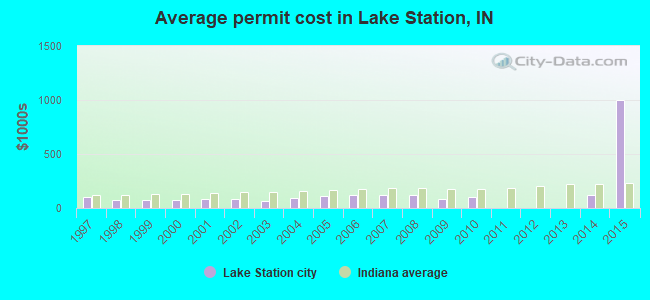
Single-family new house construction building permits:
- 2015: 1 building, cost: $1,000,000
- 2014: 2 buildings, average cost: $120,000
- 2010: 3 buildings, average cost: $97,800
- 2009: 6 buildings, average cost: $83,700
- 2008: 7 buildings, average cost: $120,900
- 2007: 16 buildings, average cost: $122,800
- 2006: 12 buildings, average cost: $121,900
- 2005: 25 buildings, average cost: $112,700
- 2004: 16 buildings, average cost: $90,900
- 2003: 4 buildings, average cost: $67,600
- 2002: 5 buildings, average cost: $86,000
- 2001: 20 buildings, average cost: $84,700
- 2000: 12 buildings, average cost: $73,400
- 1999: 15 buildings, average cost: $72,000
- 1998: 19 buildings, average cost: $73,900
- 1997: 1 building, cost: $100,000
| Here: | 4.7% |
| Indiana: | 2.8% |
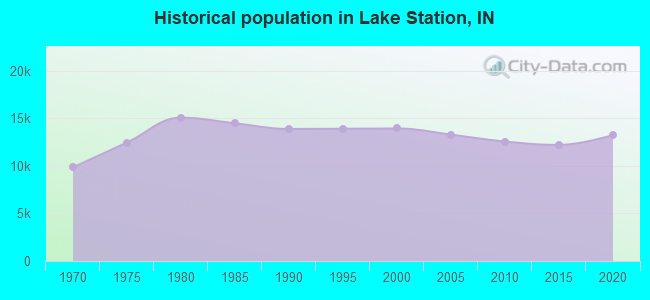
Population change in the 1990s: +33 (+0.2%).
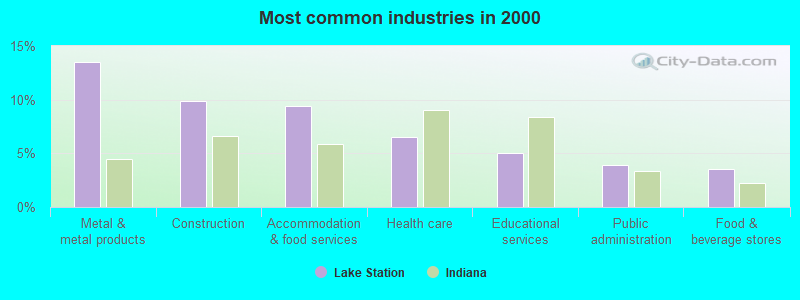
- Metal & metal products (13.5%)
- Construction (9.9%)
- Accommodation & food services (9.4%)
- Health care (6.5%)
- Educational services (5.0%)
- Public administration (3.9%)
- Food & beverage stores (3.6%)
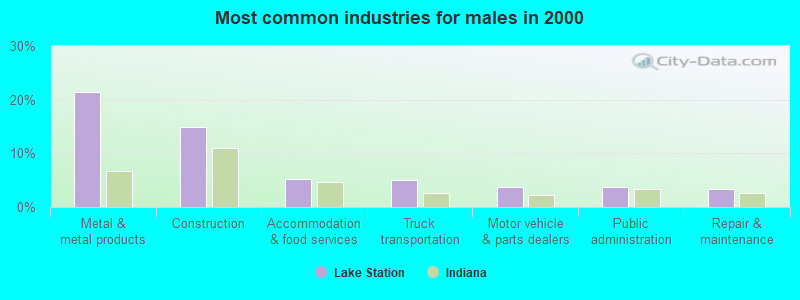
- Metal & metal products (21.5%)
- Construction (15.0%)
- Accommodation & food services (5.3%)
- Truck transportation (5.0%)
- Motor vehicle & parts dealers (3.7%)
- Public administration (3.7%)
- Repair & maintenance (3.3%)

- Accommodation & food services (15.2%)
- Health care (12.8%)
- Educational services (9.2%)
- Food & beverage stores (5.2%)
- Personal & laundry services (4.3%)
- Public administration (4.2%)
- Department & other general merchandise stores (3.8%)
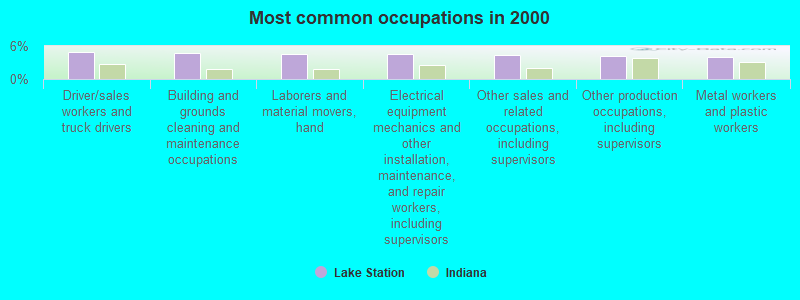
- Driver/sales workers and truck drivers (4.9%)
- Building and grounds cleaning and maintenance occupations (4.7%)
- Laborers and material movers, hand (4.5%)
- Electrical equipment mechanics and other installation, maintenance, and repair workers, including supervisors (4.5%)
- Other sales and related occupations, including supervisors (4.4%)
- Other production occupations, including supervisors (4.2%)
- Metal workers and plastic workers (3.9%)
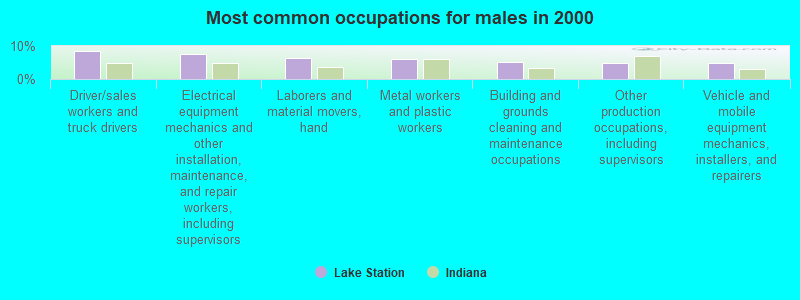
- Driver/sales workers and truck drivers (8.4%)
- Electrical equipment mechanics and other installation, maintenance, and repair workers, including supervisors (7.6%)
- Laborers and material movers, hand (6.4%)
- Metal workers and plastic workers (6.1%)
- Building and grounds cleaning and maintenance occupations (5.0%)
- Other production occupations, including supervisors (4.8%)
- Vehicle and mobile equipment mechanics, installers, and repairers (4.8%)

- Cashiers (7.4%)
- Secretaries and administrative assistants (6.1%)
- Other sales and related occupations, including supervisors (5.7%)
- Cooks and food preparation workers (5.1%)
- Other office and administrative support workers, including supervisors (4.7%)
- Building and grounds cleaning and maintenance occupations (4.3%)
- Material recording, scheduling, dispatching, and distributing workers (4.1%)
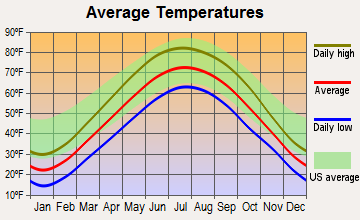
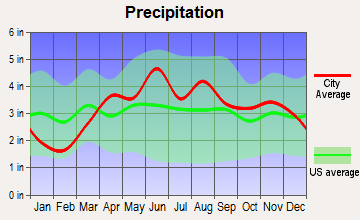
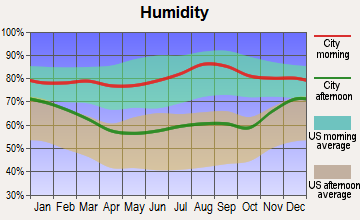
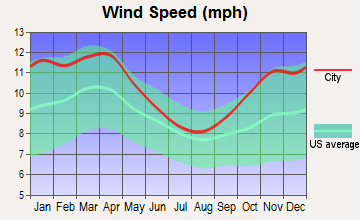
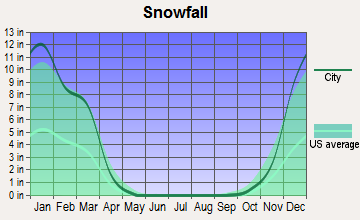
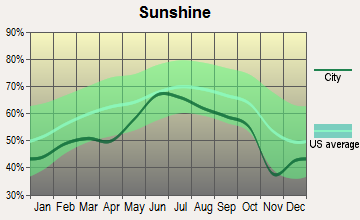
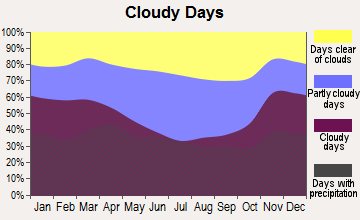
Average climate in Lake Station, Indiana
Based on data reported by over 4,000 weather stations
|
|

(lower is better)
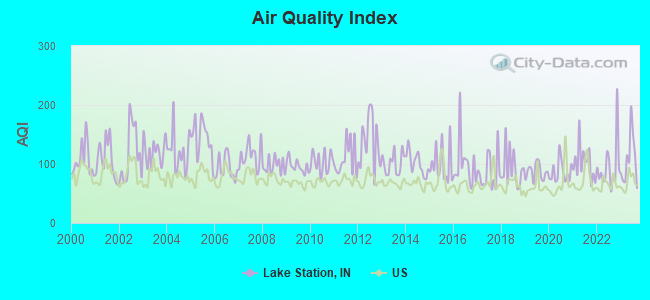
Air Quality Index (AQI) level in 2023 was 107. This is significantly worse than average.
| City: | 107 |
| U.S.: | 73 |
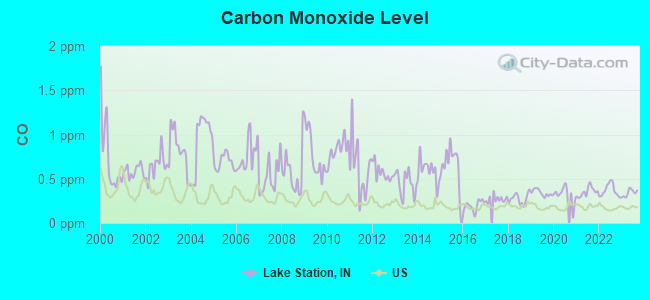
Carbon Monoxide (CO) [ppm] level in 2023 was 0.339. This is worse than average. Closest monitor was 4.2 miles away from the city center.
| City: | 0.339 |
| U.S.: | 0.251 |
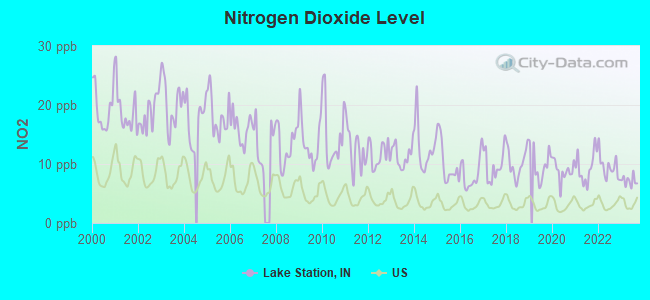
Nitrogen Dioxide (NO2) [ppb] level in 2023 was 7.13. This is worse than average. Closest monitor was 2.8 miles away from the city center.
| City: | 7.13 |
| U.S.: | 5.11 |
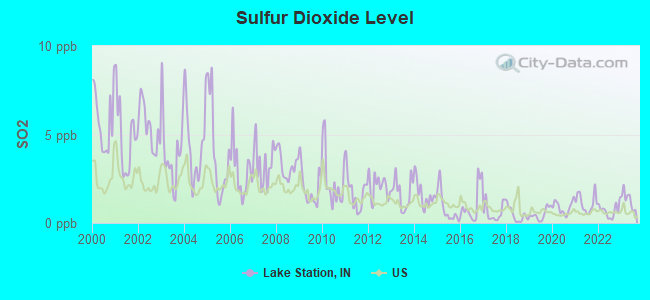
Sulfur Dioxide (SO2) [ppb] level in 2023 was 1.31. This is about average. Closest monitor was 2.8 miles away from the city center.
| City: | 1.31 |
| U.S.: | 1.51 |
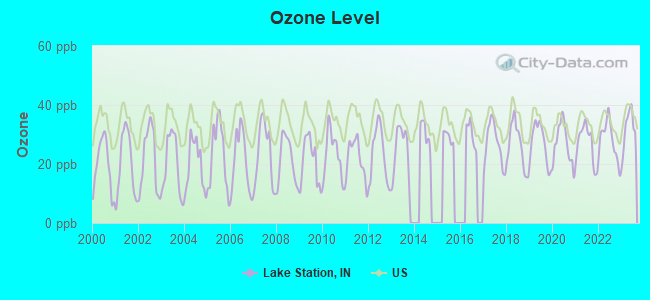
Ozone [ppb] level in 2023 was 31.9. This is about average. Closest monitor was 3.5 miles away from the city center.
| City: | 31.9 |
| U.S.: | 33.3 |
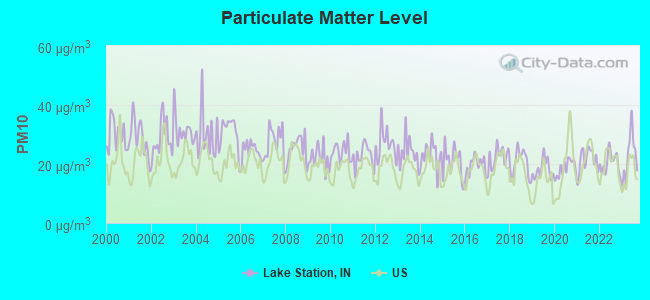
Particulate Matter (PM10) [µg/m3] level in 2023 was 22.6. This is about average. Closest monitor was 3.5 miles away from the city center.
| City: | 22.6 |
| U.S.: | 19.2 |
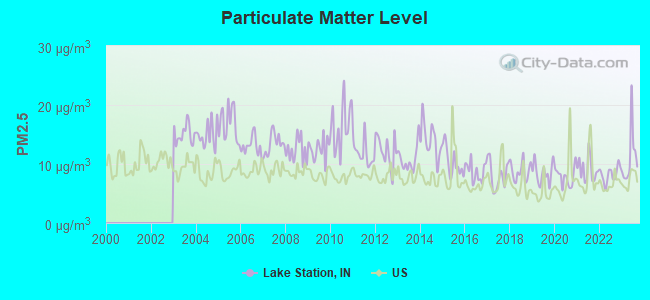
Particulate Matter (PM2.5) [µg/m3] level in 2023 was 11.0. This is worse than average. Closest monitor was 3.5 miles away from the city center.
| City: | 11.0 |
| U.S.: | 8.1 |
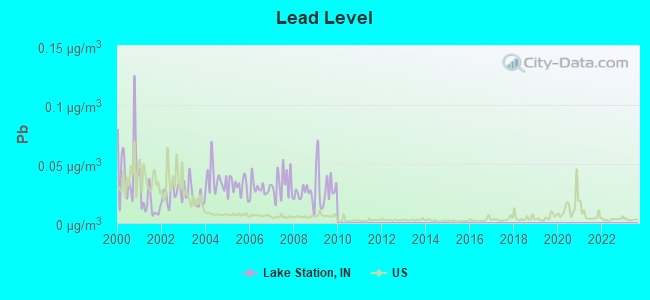
Lead (Pb) [µg/m3] level in 2009 was 0.0317. This is significantly worse than average. Closest monitor was 2.8 miles away from the city center.
| City: | 0.0317 |
| U.S.: | 0.0093 |
Tornado activity:
Lake Station-area historical tornado activity is slightly below Indiana state average. It is 60% greater than the overall U.S. average.
On 4/21/1967, a category F4 (max. wind speeds 207-260 mph) tornado 18.6 miles away from the Lake Station city center killed 33 people and injured 500 people and caused between $5,000,000 and $50,000,000 in damages.
On 10/24/1967, a category F3 (max. wind speeds 158-206 mph) tornado 2.5 miles away from the city center caused between $5000 and $50,000 in damages.
Earthquake activity:
Lake Station-area historical earthquake activity is significantly above Indiana state average. It is 35% greater than the overall U.S. average.On 4/18/2008 at 09:36:59, a magnitude 5.4 (5.1 MB, 4.8 MS, 5.4 MW, 5.2 MW, Class: Moderate, Intensity: VI - VII) earthquake occurred 218.2 miles away from Lake Station center
On 6/10/1987 at 23:48:54, a magnitude 5.1 (4.9 MB, 4.4 MS, 4.6 MS, 5.1 LG) earthquake occurred 193.0 miles away from Lake Station center
On 4/18/2008 at 09:36:59, a magnitude 5.2 (5.2 MW, Depth: 8.9 mi) earthquake occurred 218.2 miles away from Lake Station center
On 6/28/2004 at 06:10:52, a magnitude 4.2 (4.2 MW, Depth: 6.2 mi, Class: Light, Intensity: IV - V) earthquake occurred 85.3 miles away from Lake Station center
On 6/18/2002 at 17:37:15, a magnitude 5.0 (4.3 MB, 4.6 MW, 5.0 LG) earthquake occurred 249.4 miles away from Lake Station center
On 4/18/2008 at 15:14:16, a magnitude 4.8 (4.5 MB, 4.8 MW, 4.6 MW) earthquake occurred 216.2 miles away from the city center
Magnitude types: regional Lg-wave magnitude (LG), body-wave magnitude (MB), surface-wave magnitude (MS), moment magnitude (MW)
Natural disasters:
The number of natural disasters in Lake County (19) is greater than the US average (15).Major Disasters (Presidential) Declared: 12
Emergencies Declared: 5
Causes of natural disasters: Floods: 11, Storms: 10, Winter Storms: 5, Tornadoes: 3, Snowstorms: 2, Hurricane: 1, Snow: 1, Other: 1 (Note: some incidents may be assigned to more than one category).

Hospitals and medical centers near Lake Station:
- HEALTHMASTERS INC (Home Health Center, about 2 miles away; HOBART, IN)
- C AND A HOME HEALTH CARE INC (Home Health Center, about 3 miles away; GARY, IN)
- MILLER'S MERRY MANOR (Nursing Home, about 3 miles away; HOBART, IN)
- ARC BRIDGES INC (Hospital, about 3 miles away; GARY, IN)
- ARC BRIDGES, INC (Hospital, about 3 miles away; GARY, IN)
- ARC BRIDGES, INC (Hospital, about 4 miles away; HOBART, IN)
- ARC BRIDGES, INC (Hospital, about 4 miles away; GARY, IN)
Amtrak stations near Lake Station:
- 15 miles: DYER (SHEFFIELD RD.) . Services: enclosed waiting area, public payphones, free short-term parking, free long-term parking.
- 16 miles: HAMMOND-WHITING (HAMMOND, 1135 CALUMET AVE.) . Services: ticket office, partially wheelchair accessible, enclosed waiting area, public restrooms, public payphones, free short-term parking, free long-term parking, call for taxi service.
Colleges/universities with over 2000 students nearest to Lake Station:
- Indiana University-Northwest (about 5 miles; Gary, IN; Full-time enrollment: 4,390)
- Purdue University-Calumet Campus (about 12 miles; Hammond, IN; FT enrollment: 7,343)
- Valparaiso University (about 14 miles; Valparaiso, IN; FT enrollment: 3,542)
- South Suburban College (about 19 miles; South Holland, IL; FT enrollment: 3,972)
- Purdue University-North Central Campus (about 19 miles; Westville, IN; FT enrollment: 3,682)
- City Colleges of Chicago-Olive-Harvey College (about 20 miles; Chicago, IL; FT enrollment: 4,110)
- Prairie State College (about 20 miles; Chicago Heights, IL; FT enrollment: 4,050)
Public elementary/middle school in Lake Station:
- WOLF LAKE ELEMENTARY SCHOOL (Students: 288, Location: 1283 S MAIN ST, Grades: KG-5)
Points of interest:
Notable locations in Lake Station: Hobart Sky Ranch (A), Lake Station Fire Department Station 2 (B), Lake Station Fire Department Station 1 (C). Display/hide their locations on the map
Shopping Center: Central Shopping Center (1). Display/hide its location on the map
Churches in Lake Station include: Trinity United Methodist Church (A), Kingdom Hall of Jehovahs Witness Church (B), Calvary Baptist Church (C), Community Presbyterian Church (D), Faith Assembly of God Church (E), First Christian Church (F), Lake Station Church of Christ (G), Redeemer Lutheran Church (H), Twentyninth Avenue Baptist Church (I). Display/hide their locations on the map
Cemetery: Saint Francis Xavier Cemetery (1). Display/hide its location on the map
Lake: Grand Boulevard Lake (A). Display/hide its location on the map
Parks in Lake Station include: Riverview Park (1), Mock Park (2), Miller Park (3), Bicentennial Park (4), Deep River Outdoor Recreation Center (5), Columbus Park (6), Johnson Park (7), Four Winds Park (8). Display/hide their locations on the map
Drinking water stations with addresses in Lake Station and their reported violations in the past:
LAKE STATION WATER DEPARTMENT (Population served: 12,572, Purch surface water):Past monitoring violations:
- One regular monitoring violation
| This city: | 2.7 people |
| Indiana: | 2.5 people |
| This city: | 67.0% |
| Whole state: | 66.9% |
| This city: | 10.2% |
| Whole state: | 6.9% |
Likely homosexual households (counted as self-reported same-sex unmarried-partner households)
- Lesbian couples: 0.6% of all households
- Gay men: 0.2% of all households
101 people in nursing homes in 2000
Banks with branches in Lake Station (2011 data):
- JPMorgan Chase Bank, National Association: Lake Station Branch at 3115 Central Avenue, branch established on 1962/11/12. Info updated 2011/11/10: Bank assets: $1,811,678.0 mil, Deposits: $1,190,738.0 mil, headquarters in Columbus, OH, positive income, International Specialization, 5577 total offices, Holding Company: Jpmorgan Chase & Co.
For population 15 years and over in Lake Station:
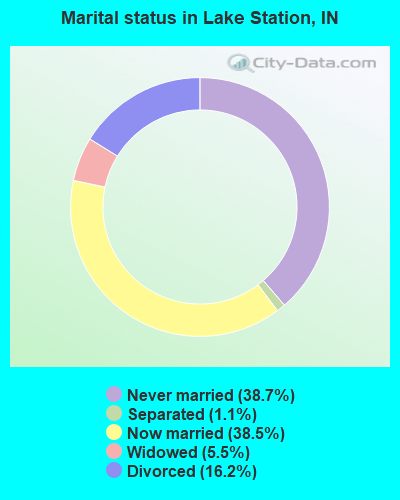
- Never married: 38.7%
- Now married: 38.5%
- Separated: 1.1%
- Widowed: 5.5%
- Divorced: 16.2%
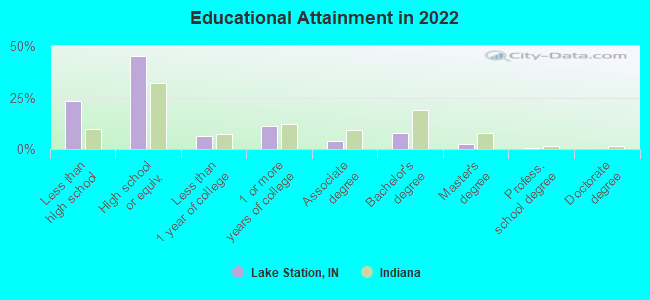
For population 25 years and over in Lake Station:
- High school or higher: 78.1%
- Bachelor's degree or higher: 9.2%
- Graduate or professional degree: 2.8%
- Unemployed: 8.8%
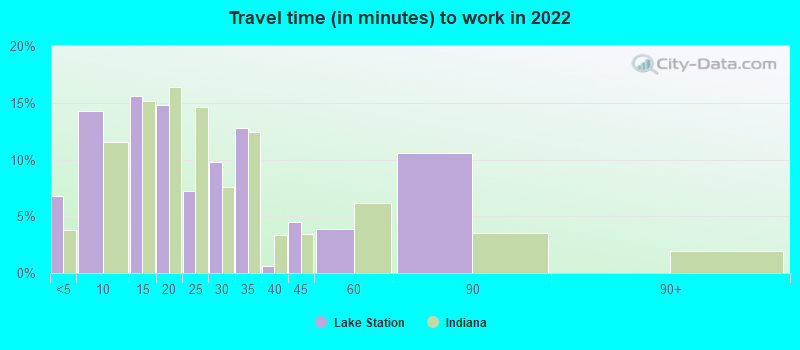
- Mean travel time to work (commute): 23.7 minutes
| Here: | 11.8 |
| Indiana average: | 11.3 |

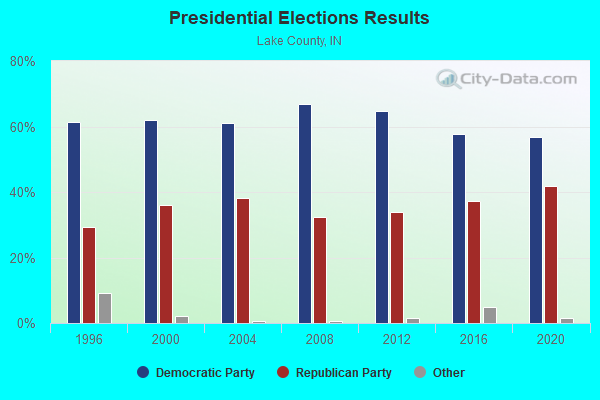
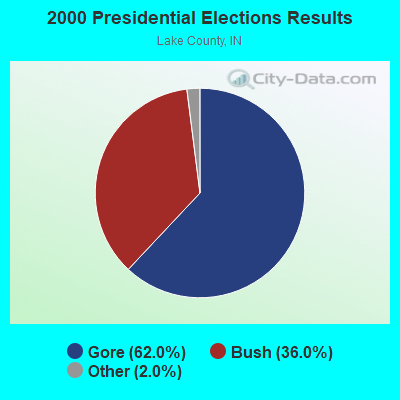

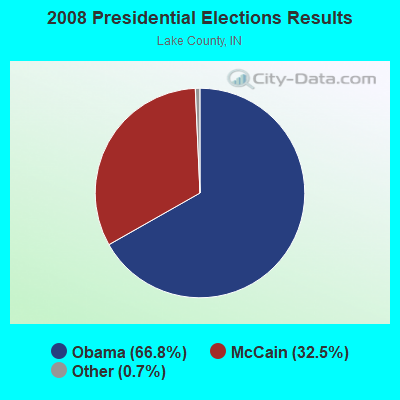
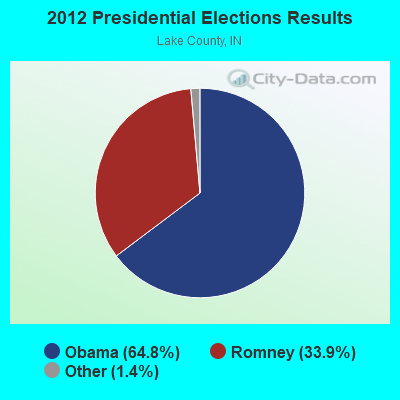


Graphs represent county-level data. Detailed 2008 Election Results
Religion statistics for Lake Station, IN (based on Lake County data)
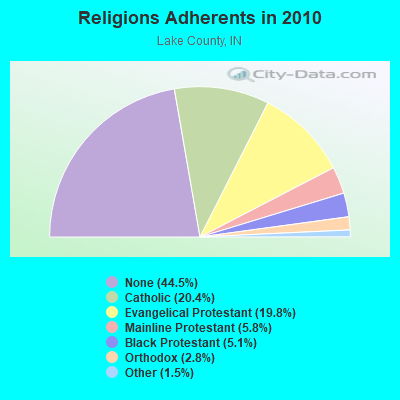
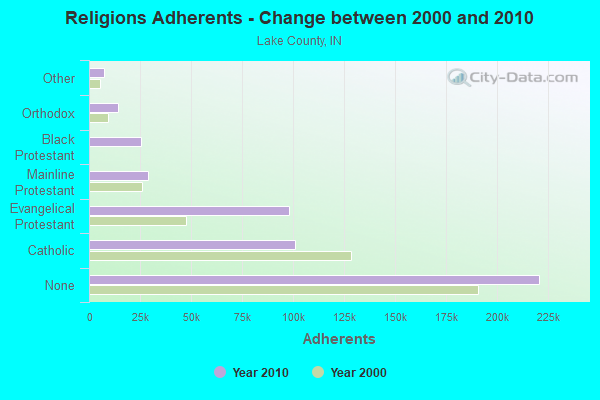
| Religion | Adherents | Congregations |
|---|---|---|
| Catholic | 101,096 | 58 |
| Evangelical Protestant | 98,213 | 266 |
| Mainline Protestant | 28,943 | 78 |
| Black Protestant | 25,459 | 74 |
| Orthodox | 13,990 | 14 |
| Other | 7,460 | 29 |
| None | 220,844 | - |
Food Environment Statistics:
| Lake County: | 1.67 / 10,000 pop. |
| Indiana: | 1.73 / 10,000 pop. |
| This county: | 0.08 / 10,000 pop. |
| State: | 0.21 / 10,000 pop. |
| Here: | 0.61 / 10,000 pop. |
| Indiana: | 0.50 / 10,000 pop. |
| This county: | 3.56 / 10,000 pop. |
| State: | 3.57 / 10,000 pop. |
| This county: | 5.86 / 10,000 pop. |
| Indiana: | 6.78 / 10,000 pop. |
| Here: | 10.8% |
| Indiana: | 9.2% |
| This county: | 32.3% |
| Indiana: | 29.0% |
| Here: | 11.7% |
| Indiana: | 14.3% |
Health and Nutrition:
| Lake Station: | 47.3% |
| State: | 49.3% |
| This city: | 44.0% |
| Indiana: | 46.2% |
| This city: | 28.9 |
| State: | 28.7 |
| Lake Station: | 22.1% |
| Indiana: | 21.3% |
| Lake Station: | 11.2% |
| State: | 10.6% |
| This city: | 6.8 |
| State: | 6.8 |
| Here: | 33.7% |
| State: | 33.9% |
| This city: | 54.5% |
| Indiana: | 56.1% |
| Lake Station: | 78.9% |
| Indiana: | 78.7% |
More about Health and Nutrition of Lake Station, IN Residents
| Local government employment and payroll (March 2022) | |||||
| Function | Full-time employees | Monthly full-time payroll | Average yearly full-time wage | Part-time employees | Monthly part-time payroll |
|---|---|---|---|---|---|
| Police Protection - Officers | 29 | $66,020 | $27,319 | 0 | $0 |
| Sewerage | 9 | $31,122 | $41,496 | 0 | $0 |
| Solid Waste Management | 7 | $28,890 | $49,526 | 0 | $0 |
| Streets and Highways | 6 | $21,780 | $43,560 | 0 | $0 |
| Other Government Administration | 5 | $18,981 | $45,554 | 2 | $998 |
| Financial Administration | 5 | $16,561 | $39,746 | 1 | $1,231 |
| Fire - Other | 4 | $18,691 | $56,073 | 8 | $12,269 |
| Police - Other | 3 | $6,674 | $26,696 | 2 | $613 |
| Parks and Recreation | 2 | $7,602 | $45,612 | 1 | $166 |
| Judicial and Legal | 1 | $2,885 | $34,620 | 1 | $1,986 |
| Firefighters | 0 | $0 | 3 | $1,474 | |
| Totals for Government | 71 | $219,204 | $37,049 | 18 | $18,738 |
Lake Station government finances - Expenditure in 2018 (per resident):
- Construction - Regular Highways: $42,000 ($3.21)
General - Other: $13,000 ($0.99)
- Current Operations - Sewerage: $3,697,000 ($282.30)
Police Protection: $2,160,000 ($164.94)
Regular Highways: $1,059,000 ($80.86)
Water Utilities: $878,000 ($67.04)
Solid Waste Management: $405,000 ($30.93)
Central Staff Services: $307,000 ($23.44)
Local Fire Protection: $231,000 ($17.64)
Financial Administration: $136,000 ($10.38)
Judicial and Legal Services: $115,000 ($8.78)
Parks and Recreation: $84,000 ($6.41)
General Public Buildings: $69,000 ($5.27)
General - Other: $61,000 ($4.66)
Protective Inspection and Regulation - Other: $20,000 ($1.53)
Health - Other: $2,000 ($0.15)
- General - Interest on Debt: $170,000 ($12.98)
- Other Capital Outlay - Sewerage: $193,000 ($14.74)
Solid Waste Management: $140,000 ($10.69)
Police Protection: $105,000 ($8.02)
Regular Highways: $81,000 ($6.19)
General - Other: $19,000 ($1.45)
- Total Salaries and Wages: $3,213,000 ($245.34)
- Water Utilities - Interest on Debt: $735,000 ($56.12)
Lake Station government finances - Revenue in 2018 (per resident):
- Charges - Sewerage: $4,853,000 ($370.57)
Solid Waste Management: $762,000 ($58.19)
Parks and Recreation: $308,000 ($23.52)
Other: $36,000 ($2.75)
- Local Intergovernmental - Highways: $191,000 ($14.58)
Other: $5,000 ($0.38)
- Miscellaneous - Rents: $81,000 ($6.19)
General Revenue - Other: $33,000 ($2.52)
Donations From Private Sources: $12,000 ($0.92)
- Revenue - Water Utilities: $2,898,000 ($221.29)
- State Intergovernmental - Highways: $511,000 ($39.02)
Other: $258,000 ($19.70)
General Local Government Support: $93,000 ($7.10)
- Tax - Property: $1,289,000 ($98.43)
Other License: $149,000 ($11.38)
Public Utilities Sales: $127,000 ($9.70)
Occupation and Business License - Other: $51,000 ($3.89)
Lake Station government finances - Debt in 2018 (per resident):
- Long Term Debt - Beginning Outstanding - Unspecified Public Purpose: $22,623,000 ($1727.47)
Outstanding Unspecified Public Purpose: $11,429,000 ($872.71)
Retired Unspecified Public Purpose: $11,194,000 ($854.76)
- Short Term Debt Outstanding - Beginning: $1,825,000 ($139.36)
Lake Station government finances - Cash and Securities in 2018 (per resident):
- Bond Funds - Cash and Securities: $221,000 ($16.88)
- Other Funds - Cash and Securities: $2,397,000 ($183.03)
- Sinking Funds - Cash and Securities: $728,000 ($55.59)
5.29% of this county's 2021 resident taxpayers lived in other counties in 2020 ($54,961 average adjusted gross income)
| Here: | 5.29% |
| Indiana average: | 6.66% |
0.01% of residents moved from foreign countries ($91 average AGI)
Lake County: 0.01% Indiana average: 0.00%
Top counties from which taxpayers relocated into this county between 2020 and 2021:
| from Cook County, IL | |
| from Porter County, IN | |
| from Will County, IL |
| Businesses in Lake Station, IN | ||||
| Name | Count | Name | Count | |
|---|---|---|---|---|
| Ace Hardware | 1 | McDonald's | 1 | |
| Burger King | 1 | Papa John's Pizza | 1 | |
| Cricket Wireless | 1 | Subway | 2 | |
| Dairy Queen | 1 | U-Haul | 2 | |
| Dennys | 1 | UPS | 3 | |
| FedEx | 2 | Walgreens | 1 | |
| H&R Block | 1 | Wendy's | 1 | |
| Long John Silver's | 1 | |||
Strongest AM radio stations in Lake Station:
- WNDZ (750 AM; daytime; 5 kW; PORTAGE, IN; Owner: ENTRAVISION HOLDINGS, LLC)
- WIND (560 AM; 5 kW; CHICAGO, IL; Owner: TICHENOR LICENSE CORPORATION ("TLC"))
- WLTH (1370 AM; 1 kW; GARY, IN; Owner: WLTH RADIO, INC.)
- WLS (890 AM; 50 kW; CHICAGO, IL; Owner: WLS, INC.)
- WVIV (1200 AM; 20 kW; CHICAGO, IL; Owner: WLXX-AM LICENSE CORP.)
- WYLL (1160 AM; 50 kW; CHICAGO, IL; Owner: SCA LICENSE CORPORATION)
- WSCR (670 AM; 50 kW; CHICAGO, IL; Owner: INFINITY BROADCASTING OPERATIONS, INC.)
- WMVP (1000 AM; 50 kW; CHICAGO, IL; Owner: ABC, INC.)
- WGN (720 AM; 50 kW; CHICAGO, IL; Owner: WGN CONTINENTAL BROADCASTING CO.)
- WBBM (780 AM; 50 kW; CHICAGO, IL; Owner: INFINITY BROADCASTING OPERATIONS, INC.)
- WNTD (950 AM; 5 kW; CHICAGO, IL; Owner: RADIO UNICA OF CHICAGO LICENSE CORP.)
- WWCA (1270 AM; 1 kW; GARY, IN; Owner: METRO COMMUNICATIONS, INC.)
- WIMS (1420 AM; 5 kW; MICHIGAN CITY, IN; Owner: ST. GEORGE BROADCASTING, LLC, ROBERT J. MACCINI, RECEIVER)
Strongest FM radio stations in Lake Station:
- WCKG (105.9 FM; ELMWOOD PARK, IL; Owner: INFINITY HOLDINGS CORPORATION OF ORLANDO)
- WLIT-FM (93.9 FM; CHICAGO, IL; Owner: AMFM RADIO LICENSES, L.L.C.)
- WJMK (104.3 FM; CHICAGO, IL; Owner: INFINITY BROADCASTING CORP. OF ILLINOIS)
- WNUA (95.5 FM; CHICAGO, IL; Owner: AMFM RADIO LICENSES, L.L.C.)
- WTMX (101.9 FM; SKOKIE, IL; Owner: BONNEVILLE HOLDING COMPANY)
- WBBM-FM (96.3 FM; CHICAGO, IL; Owner: INFINITY BROADCASTING OPERATIONS, INC.)
- WKSC-FM (103.5 FM; CHICAGO, IL; Owner: AMFM RADIO LICENSES, L.L.C.)
- WFMT (98.7 FM; CHICAGO, IL; Owner: WINDOW TO THE WORLD COMMUNICATIONS)
- WZZN (94.7 FM; CHICAGO, IL; Owner: ABC CHICAGO FM RADIO,INC.)
- WGCI-FM (107.5 FM; CHICAGO, IL; Owner: AMFM RADIO LICENSES, L.L.C.)
- WLJE (105.5 FM; VALPARAISO, IN; Owner: PORTER COUNTY BROADCASTING CORP.)
- WBEZ (91.5 FM; CHICAGO, IL; Owner: THE WBEZ ALLIANCE, INC.)
- WKQX (101.1 FM; CHICAGO, IL; Owner: EMMIS RADIO LICENSE CORPORATION)
- WLUP-FM (97.9 FM; CHICAGO, IL; Owner: BONNEVILLE HOLDING COMPANY)
- WNND (100.3 FM; CHICAGO, IL; Owner: BONNEVILLE HOLDING COMPANY)
- WOJO (105.1 FM; EVANSTON, IL; Owner: TICHENOR LICENSE CORPORATION ("TLC"))
- WUSN (99.5 FM; CHICAGO, IL; Owner: INFINITY BROADCASTING CORPORATION OF CHICAGO)
- WVAZ (102.7 FM; OAK PARK, IL; Owner: AMFM RADIO LICENSES, L.L.C.)
- WDRV (97.1 FM; CHICAGO, IL; Owner: BONNEVILLE HOLDING COMPANY)
- WXRT-FM (93.1 FM; CHICAGO, IL; Owner: INFINITY BROADCASTING OPERATIONS, INC.)
TV broadcast stations around Lake Station:
- WYIN (Channel 56; GARY, IN; Owner: NORTHWEST INDIANA PUBLIC BROADCASTING, INC.)
- WLS-TV (Channel 7; CHICAGO, IL; Owner: WLS TELEVISION, INC.)
- WMAQ-TV (Channel 5; CHICAGO, IL; Owner: NBC SUBSIDIARY (WMAQ-TV), INC.)
- WTTW (Channel 11; CHICAGO, IL; Owner: WINDOW TO THE WORLD COMMUNICATIONS, INC.)
- WGN-TV (Channel 9; CHICAGO, IL; Owner: WGN CONTINENTAL BROADCASTING COMPANY)
- WGBO-TV (Channel 66; JOLIET, IL; Owner: WGBO LICENSE PARTNERSHIP, G.P.)
- WBBM-TV (Channel 2; CHICAGO, IL; Owner: CBS BROADCASTING INC.)
- W18AT (Channel 18; GARY, IN; Owner: LESEA BROADCASTING CORPORATION)
- WPWR-TV (Channel 50; GARY, IN; Owner: FOX TELEVISION STATIONS, INC.)
- WXFT (Channel 60; AURORA, IL; Owner: TELEFUTURA CHICAGO LLC)
- WCPX (Channel 38; CHICAGO, IL; Owner: PAXSON CHICAGO LICENSE, INC.)
- WCIU-TV (Channel 26; CHICAGO, IL; Owner: WCIU-TV LIMITED PARTNERSHIP)
- WFLD (Channel 32; CHICAGO, IL; Owner: FOX TELEVISION STATIONS, INC.)
- W68DO (Channel 68; PALATINE, IL; Owner: TRINITY BROADCASTING NETWORK)
- WFBT-CA (Channel 23; CHICAGO, IL; Owner: CHANNEL 23 LIMITED PARTNERSHIP)
- WSNS-TV (Channel 44; CHICAGO, IL; Owner: TELEMUNDO OF CHICAGO, INC.)
- WJYS (Channel 62; HAMMOND, IN; Owner: JOVON BROADCASTING CORPORATION)
- WOCH-LP (Channel 28; CHICAGO, IL; Owner: KM LPTV OF CHICAGO-28, L.L.C.)
- WYCC (Channel 20; CHICAGO, IL; Owner: COLLEGE DIST. #508, COUNTY OF COOK)
- W24AW (Channel 24; VALPARAISO, IN; Owner: LESEA BROADCASTING CORPORATION)
- W54BK (Channel 54; CHESTERTON, IN; Owner: LESEA BROADCASTING CORPORATION)
- WOCK-CA (Channel 13; CHICAGO, IL; Owner: KM LPTV OF CHICAGO-13, L.L.C.)
- W13BQ (Channel 13; PORTAGE, IN; Owner: STUDIO 5, INC.)
- W04CQ (Channel 4; CHESTERTON, IN; Owner: AQUA-LAND COMMUNICATIONS, INC.)
- W34CK (Channel 34; ARLINGTON HEIGHTS, IL; Owner: FIRST UNITED, INC.)
- National Bridge Inventory (NBI) Statistics
- 17Number of bridges
- 213ft / 65.2mTotal length
- $137,000Total costs
- 296,373Total average daily traffic
- 70,098Total average daily truck traffic
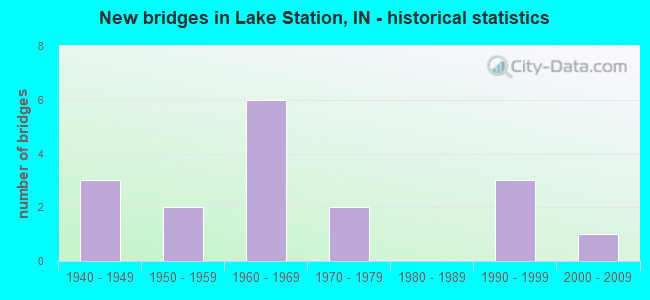
- New bridges - historical statistics
- 31940-1949
- 21950-1959
- 61960-1969
- 21970-1979
- 31990-1999
- 12000-2009
FCC Registered Antenna Towers:
58 (See the full list of FCC Registered Antenna Towers in Lake Station)FCC Registered Private Land Mobile Towers:
1- 1101 Tippecanoe (Lat: 41.593083 Lon: -87.237806), Type: Pipe, Structure height: 6 m, Call Sign: WQXB936,
Assigned Frequencies: 915.700 MHz, 915.700 MHz, Grant Date: 01/26/2016, Expiration Date: 01/26/2026, Certifier: David Sparrow, Registrant: Davis Wright Tremaine, LLP, 1919 Pennsylvania Avenue, N.W., Suite 800, Washington, DC 20006, Phone: (202) 973-4210, Fax: (202) 973-4410, Email:
FCC Registered Broadcast Land Mobile Towers:
5- 3629 Central Ave (Lat: 41.585861 Lon: -87.245028), Call Sign: KSD468, Licensee ID: L00066329,
Assigned Frequencies: 154.430 MHz, 154.280 MHz, Grant Date: 09/08/1998, Expiration Date: 10/03/2003, Cancellation Date: 01/21/2003, Registrant: City Of Lake Station, 3629 Central Ave, Lake Station, IN 46405
- 275 29th Ave (Lat: 41.541694 Lon: -87.290028), Call Sign: WRI231, Licensee ID: L00044387,
Assigned Frequencies: 155.865 MHz, Grant Date: 06/15/1999, Expiration Date: 08/24/2004, Cancellation Date: 06/10/2004, Registrant: Hobart, Township Of, 275 29th Ave, Lake Station, IN 46405, Phone: (219) 374-7764
- Lake Station Water Dept 3619 Central Ave (Lat: 41.574194 Lon: -87.241972), Call Sign: WYQ908,
Assigned Frequencies: 154.965 MHz, Grant Date: 03/25/2014, Expiration Date: 02/24/2024, Registrant: Federal Licensing Inc, 1588 Fairfield Road, Gettysburg, PA 17325, Phone: (717) 334-9262, Fax: (717) 334-6440
- Lat: 41.576639 Lon: -87.244167, Call Sign: WQAG774, Licensee ID: L00023848,
Assigned Frequencies: 72.2600 MHz, 72.1800 MHz, 72.1000 MHz, Grant Date: 02/28/2014, Expiration Date: 05/27/2024, Certifier: Dan Dehaven, Registrant: Lake Station Community Schools
- Lat: 41.570861 Lon: -87.270861, Call Sign: WQAP794,
Assigned Frequencies: 72.5200 MHz, Grant Date: 05/07/2014, Expiration Date: 07/15/2024, Certifier: Guy L Estes, Registrant: Sun Engineering Inc., 950 Marquette Rd, Lake Station In, IN 46405, Phone: (219) 962-1191, Fax: (219) 962-5880, Email:
FCC Registered Microwave Towers:
12 (See the full list of FCC Registered Microwave Towers in this town)FCC Registered Amateur Radio Licenses:
24 (See the full list of FCC Registered Amateur Radio Licenses in Lake Station)FAA Registered Aircraft:
3- Aircraft: CESSNA 414 (Category: Land, Engines: 2, Seats: 7, Weight: Up to 12,499 Pounds, Speed: 198 mph), Engine: CONT MOTOR TSIO-520 SER (300 HP) (Reciprocating)
N-Number: 42SG, N42SG, N-42SG, Serial Number: 4140927, Airworthiness Date: 04/05/1997, Certificate Issue Date: 07/23/2020
Registrant (Corporation): Cn Holdings Inc, Po Box 5148, Lake Station, IN 46405 - Aircraft: HOWARD AIRCRAFT DGA-15P (Category: Land, Seats: 5, Weight: Up to 12,499 Pounds, Speed: 150 mph), Engine: P&W R-985 SERIES (450 HP) (Reciprocating)
N-Number: 79530, N79530, N-79530, Serial Number: 871, Year manufactured: 1943, Airworthiness Date: 07/12/1956, Certificate Issue Date: 06/04/2013
Registrant (Co-Owned): Larry V Larmon, 2199 Wayne St, Lake Station, IN 46405, Other Owners: Larry E Larmon
Deregistered: Cancel Date: 10/05/2019 - Aircraft: BARBER JOHN J RAF 2000 - GTX SE (Category: Land, Seats: 2, Weight: Up to 12,499 Pounds), Engine: SUBARU ALL MDLS A/B (400 HP) (Reciprocating)
N-Number: 4377F, N4377F, N-4377F, Serial Number: H2-96-7-253, Year manufactured: 1996, Airworthiness Date: 07/10/1999, Certificate Issue Date: 07/14/1998
Registrant (Individual): John J Barber, 2229 E 27th Ave, Lake Station, IN 46405
Deregistered: Cancel Date: 06/14/2017
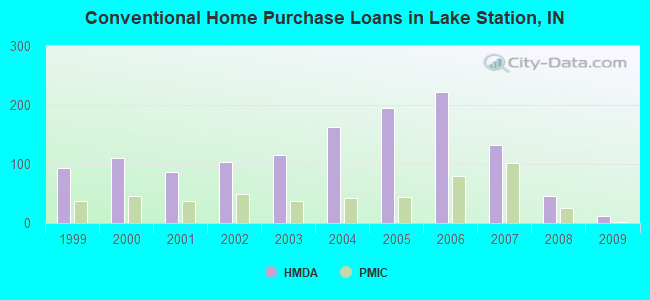
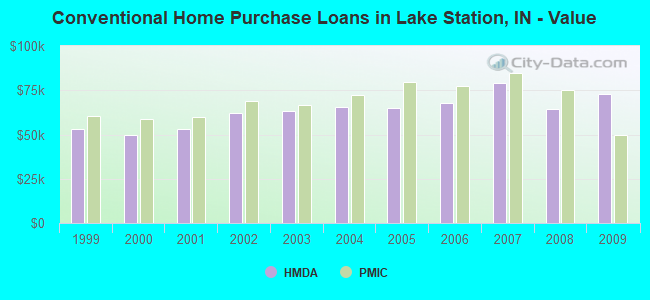
| Home Mortgage Disclosure Act Aggregated Statistics For Year 2009 (Based on 1 full and 5 partial tracts) | ||||||||||||
| A) FHA, FSA/RHS & VA Home Purchase Loans | B) Conventional Home Purchase Loans | C) Refinancings | D) Home Improvement Loans | F) Non-occupant Loans on < 5 Family Dwellings (A B C & D) | G) Loans On Manufactured Home Dwelling (A B C & D) | |||||||
|---|---|---|---|---|---|---|---|---|---|---|---|---|
| Number | Average Value | Number | Average Value | Number | Average Value | Number | Average Value | Number | Average Value | Number | Average Value | |
| LOANS ORIGINATED | 50 | $79,609 | 12 | $72,725 | 111 | $84,544 | 7 | $29,056 | 7 | $52,054 | 2 | $86,610 |
| APPLICATIONS APPROVED, NOT ACCEPTED | 6 | $68,583 | 1 | $43,550 | 15 | $83,185 | 3 | $21,333 | 3 | $71,197 | 0 | $0 |
| APPLICATIONS DENIED | 21 | $71,869 | 7 | $35,740 | 99 | $79,372 | 13 | $42,783 | 9 | $52,666 | 5 | $45,070 |
| APPLICATIONS WITHDRAWN | 8 | $58,374 | 2 | $45,385 | 36 | $99,312 | 3 | $58,830 | 3 | $38,880 | 1 | $55,120 |
| FILES CLOSED FOR INCOMPLETENESS | 2 | $88,460 | 0 | $0 | 10 | $86,015 | 0 | $0 | 1 | $49,660 | 0 | $0 |
Detailed HMDA statistics for the following Tracts: 0416.00 , 0417.00, 0418.00
| Private Mortgage Insurance Companies Aggregated Statistics For Year 2009 (Based on 5 partial tracts) | ||||
| A) Conventional Home Purchase Loans | B) Refinancings | |||
|---|---|---|---|---|
| Number | Average Value | Number | Average Value | |
| LOANS ORIGINATED | 1 | $49,680 | 3 | $92,267 |
| APPLICATIONS APPROVED, NOT ACCEPTED | 1 | $75,540 | 2 | $82,770 |
| APPLICATIONS DENIED | 1 | $37,430 | 0 | $0 |
| APPLICATIONS WITHDRAWN | 0 | $0 | 0 | $0 |
| FILES CLOSED FOR INCOMPLETENESS | 0 | $0 | 0 | $0 |
Detailed PMIC statistics for the following Tracts: 0416.00 , 0417.00, 0418.00
2003 - 2018 National Fire Incident Reporting System (NFIRS) incidents
- Fire incident types reported to NFIRS in Lake Station, IN
- 41039.4%Outside Fires
- 27326.2%Structure Fires
- 26025.0%Mobile Property/Vehicle Fires
- 979.3%Other
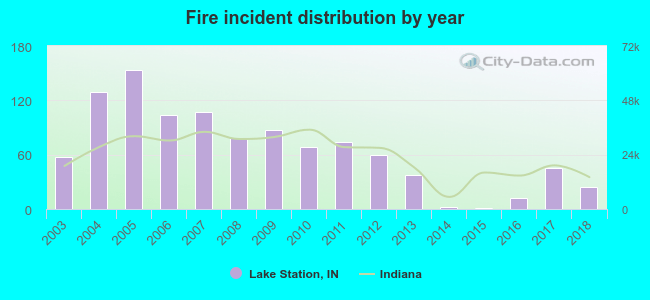 Based on the data from the years 2003 - 2018 the average number of fires per year is 65. The highest number of fire incidents - 153 took place in 2005, and the least - 1 in 2015. The data has a decreasing trend.
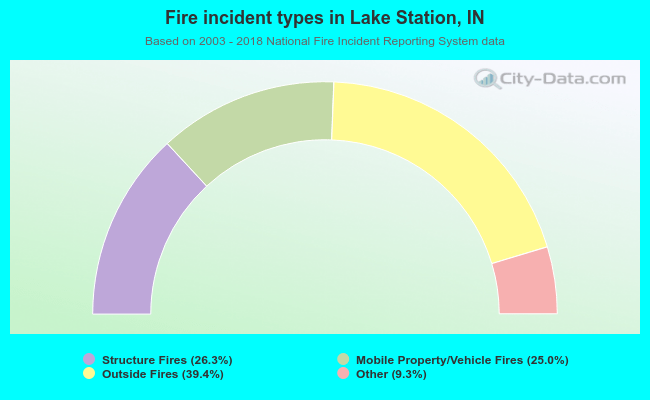 When looking into fire subcategories, the most incidents belonged to: Outside Fires (39.4%), and Structure Fires (26.2%).
| Most common first names in Lake Station, IN among deceased individuals | ||
| Name | Count | Lived (average) |
|---|---|---|
| John | 138 | 73.1 years |
| Mary | 105 | 75.3 years |
| William | 69 | 68.0 years |
| Joseph | 62 | 70.3 years |
| James | 61 | 65.3 years |
| George | 56 | 74.6 years |
| Charles | 49 | 72.3 years |
| Helen | 48 | 77.0 years |
| Robert | 46 | 66.9 years |
| Frank | 39 | 72.7 years |
| Most common last names in Lake Station, IN among deceased individuals | ||
| Last name | Count | Lived (average) |
|---|---|---|
| Smith | 30 | 72.1 years |
| Johnson | 17 | 70.3 years |
| Davis | 16 | 66.4 years |
| Martin | 15 | 62.2 years |
| Williams | 15 | 67.8 years |
| Jones | 14 | 77.5 years |
| Miller | 14 | 70.8 years |
| Brown | 13 | 63.5 years |
| Wilson | 12 | 66.5 years |
| Anderson | 9 | 79.8 years |
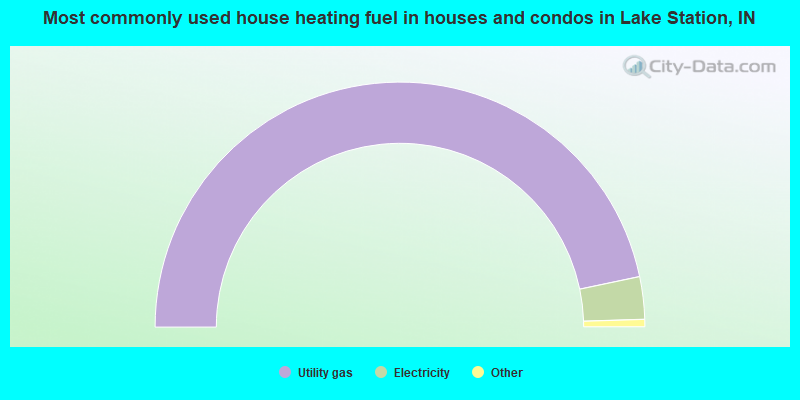
- 93.4%Utility gas
- 5.6%Electricity
- 0.8%Bottled, tank, or LP gas
- 0.2%Wood
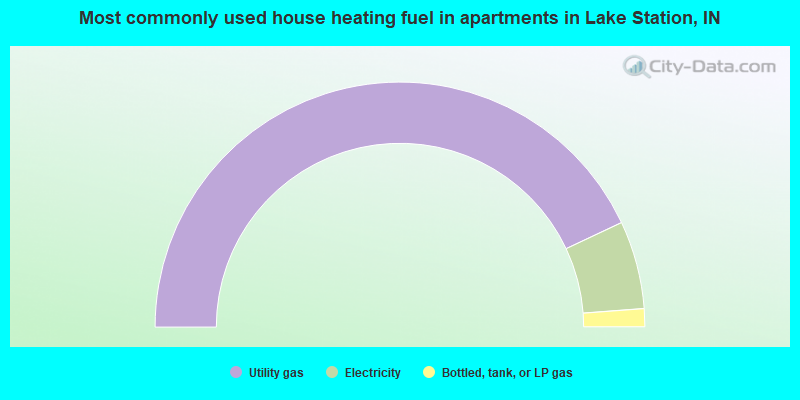
- 86.0%Utility gas
- 11.6%Electricity
- 2.4%Bottled, tank, or LP gas
Lake Station compared to Indiana state average:
- Median house value below state average.
- Black race population percentage significantly below state average.
- Hispanic race population percentage significantly above state average.
- Median age below state average.
- Length of stay since moving in significantly above state average.
- Percentage of population with a bachelor's degree or higher below state average.
Lake Station on our top lists:
- #29 on the list of "Top 101 cities with the highest number of arson incidents per 100,000 residents, excludes tourist destinations and others with a lot of outsiders visiting based on city industries data (population 5,000+)"
- #76 on the list of "Top 101 cities with the least people having Master's or Doctorate degrees (population 5,000+)"
- #2 on the list of "Top 101 counties with the highest carbon monoxide air pollution readings in 2012 (ppm)"
- #5 on the list of "Top 101 counties with the lowest percentage of residents that visited a dentist within the past year"
- #6 on the list of "Top 101 counties with the lowest percentage of residents relocating from foreign countries between 2010 and 2011"
- #8 on the list of "Top 101 counties with the highest average weight of females"
- #13 on the list of "Top 101 counties with the most Orthodox adherents (pop. 50,000+)"

|
Total of 3 patent applications in 2008-2024.