Hobart, Indiana Submit your own pictures of this city and show them to the world
OSM Map
General Map
Google Map
MSN Map
OSM Map
General Map
Google Map
MSN Map
OSM Map
General Map
Google Map
MSN Map
OSM Map
General Map
Google Map
MSN Map
Please wait while loading the map...
Population in 2022: 29,458 (94% urban, 6% rural). Population change since 2000: +16.1%Males: 14,205 Females: 15,253
March 2022 cost of living index in Hobart: 95.6 (near average, U.S. average is 100) Percentage of residents living in poverty in 2022: 14.0%for White Non-Hispanic residents , 37.1% for Black residents , 10.3% for Hispanic or Latino residents , 56.0% for American Indian residents , 13.3% for other race residents , 13.9% for two or more races residents )
Profiles of local businesses
Business Search - 14 Million verified businesses
Data:
Median household income ($)
Median household income (% change since 2000)
Household income diversity
Ratio of average income to average house value (%)
Ratio of average income to average rent
Median household income ($) - White
Median household income ($) - Black or African American
Median household income ($) - Asian
Median household income ($) - Hispanic or Latino
Median household income ($) - American Indian and Alaska Native
Median household income ($) - Multirace
Median household income ($) - Other Race
Median household income for houses/condos with a mortgage ($)
Median household income for apartments without a mortgage ($)
Races - White alone (%)
Races - White alone (% change since 2000)
Races - Black alone (%)
Races - Black alone (% change since 2000)
Races - American Indian alone (%)
Races - American Indian alone (% change since 2000)
Races - Asian alone (%)
Races - Asian alone (% change since 2000)
Races - Hispanic (%)
Races - Hispanic (% change since 2000)
Races - Native Hawaiian and Other Pacific Islander alone (%)
Races - Native Hawaiian and Other Pacific Islander alone (% change since 2000)
Races - Two or more races (%)
Races - Two or more races (% change since 2000)
Races - Other race alone (%)
Races - Other race alone (% change since 2000)
Racial diversity
Unemployment (%)
Unemployment (% change since 2000)
Unemployment (%) - White
Unemployment (%) - Black or African American
Unemployment (%) - Asian
Unemployment (%) - Hispanic or Latino
Unemployment (%) - American Indian and Alaska Native
Unemployment (%) - Multirace
Unemployment (%) - Other Race
Population density (people per square mile)
Population - Males (%)
Population - Females (%)
Population - Males (%) - White
Population - Males (%) - Black or African American
Population - Males (%) - Asian
Population - Males (%) - Hispanic or Latino
Population - Males (%) - American Indian and Alaska Native
Population - Males (%) - Multirace
Population - Males (%) - Other Race
Population - Females (%) - White
Population - Females (%) - Black or African American
Population - Females (%) - Asian
Population - Females (%) - Hispanic or Latino
Population - Females (%) - American Indian and Alaska Native
Population - Females (%) - Multirace
Population - Females (%) - Other Race
Coronavirus confirmed cases (Apr 27, 2024)
Deaths caused by coronavirus (Apr 27, 2024)
Coronavirus confirmed cases (per 100k population) (Apr 27, 2024)
Deaths caused by coronavirus (per 100k population) (Apr 27, 2024)
Daily increase in number of cases (Apr 27, 2024)
Weekly increase in number of cases (Apr 27, 2024)
Cases doubled (in days) (Apr 27, 2024)
Hospitalized patients (Apr 18, 2022)
Negative test results (Apr 18, 2022)
Total test results (Apr 18, 2022)
COVID Vaccine doses distributed (per 100k population) (Sep 19, 2023)
COVID Vaccine doses administered (per 100k population) (Sep 19, 2023)
COVID Vaccine doses distributed (Sep 19, 2023)
COVID Vaccine doses administered (Sep 19, 2023)
Likely homosexual households (%)
Likely homosexual households (% change since 2000)
Likely homosexual households - Lesbian couples (%)
Likely homosexual households - Lesbian couples (% change since 2000)
Likely homosexual households - Gay men (%)
Likely homosexual households - Gay men (% change since 2000)
Cost of living index
Median gross rent ($)
Median contract rent ($)
Median monthly housing costs ($)
Median house or condo value ($)
Median house or condo value ($ change since 2000)
Mean house or condo value by units in structure - 1, detached ($)
Mean house or condo value by units in structure - 1, attached ($)
Mean house or condo value by units in structure - 2 ($)
Mean house or condo value by units in structure by units in structure - 3 or 4 ($)
Mean house or condo value by units in structure - 5 or more ($)
Mean house or condo value by units in structure - Boat, RV, van, etc. ($)
Mean house or condo value by units in structure - Mobile home ($)
Median house or condo value ($) - White
Median house or condo value ($) - Black or African American
Median house or condo value ($) - Asian
Median house or condo value ($) - Hispanic or Latino
Median house or condo value ($) - American Indian and Alaska Native
Median house or condo value ($) - Multirace
Median house or condo value ($) - Other Race
Median resident age
Resident age diversity
Median resident age - Males
Median resident age - Females
Median resident age - White
Median resident age - Black or African American
Median resident age - Asian
Median resident age - Hispanic or Latino
Median resident age - American Indian and Alaska Native
Median resident age - Multirace
Median resident age - Other Race
Median resident age - Males - White
Median resident age - Males - Black or African American
Median resident age - Males - Asian
Median resident age - Males - Hispanic or Latino
Median resident age - Males - American Indian and Alaska Native
Median resident age - Males - Multirace
Median resident age - Males - Other Race
Median resident age - Females - White
Median resident age - Females - Black or African American
Median resident age - Females - Asian
Median resident age - Females - Hispanic or Latino
Median resident age - Females - American Indian and Alaska Native
Median resident age - Females - Multirace
Median resident age - Females - Other Race
Commute - mean travel time to work (minutes)
Travel time to work - Less than 5 minutes (%)
Travel time to work - Less than 5 minutes (% change since 2000)
Travel time to work - 5 to 9 minutes (%)
Travel time to work - 5 to 9 minutes (% change since 2000)
Travel time to work - 10 to 19 minutes (%)
Travel time to work - 10 to 19 minutes (% change since 2000)
Travel time to work - 20 to 29 minutes (%)
Travel time to work - 20 to 29 minutes (% change since 2000)
Travel time to work - 30 to 39 minutes (%)
Travel time to work - 30 to 39 minutes (% change since 2000)
Travel time to work - 40 to 59 minutes (%)
Travel time to work - 40 to 59 minutes (% change since 2000)
Travel time to work - 60 to 89 minutes (%)
Travel time to work - 60 to 89 minutes (% change since 2000)
Travel time to work - 90 or more minutes (%)
Travel time to work - 90 or more minutes (% change since 2000)
Marital status - Never married (%)
Marital status - Now married (%)
Marital status - Separated (%)
Marital status - Widowed (%)
Marital status - Divorced (%)
Median family income ($)
Median family income (% change since 2000)
Median non-family income ($)
Median non-family income (% change since 2000)
Median per capita income ($)
Median per capita income (% change since 2000)
Median family income ($) - White
Median family income ($) - Black or African American
Median family income ($) - Asian
Median family income ($) - Hispanic or Latino
Median family income ($) - American Indian and Alaska Native
Median family income ($) - Multirace
Median family income ($) - Other Race
Median year house/condo built
Median year apartment built
Year house built - Built 2005 or later (%)
Year house built - Built 2000 to 2004 (%)
Year house built - Built 1990 to 1999 (%)
Year house built - Built 1980 to 1989 (%)
Year house built - Built 1970 to 1979 (%)
Year house built - Built 1960 to 1969 (%)
Year house built - Built 1950 to 1959 (%)
Year house built - Built 1940 to 1949 (%)
Year house built - Built 1939 or earlier (%)
Average household size
Household density (households per square mile)
Average household size - White
Average household size - Black or African American
Average household size - Asian
Average household size - Hispanic or Latino
Average household size - American Indian and Alaska Native
Average household size - Multirace
Average household size - Other Race
Occupied housing units (%)
Vacant housing units (%)
Owner occupied housing units (%)
Renter occupied housing units (%)
Vacancy status - For rent (%)
Vacancy status - For sale only (%)
Vacancy status - Rented or sold, not occupied (%)
Vacancy status - For seasonal, recreational, or occasional use (%)
Vacancy status - For migrant workers (%)
Vacancy status - Other vacant (%)
Residents with income below the poverty level (%)
Residents with income below 50% of the poverty level (%)
Children below poverty level (%)
Poor families by family type - Married-couple family (%)
Poor families by family type - Male, no wife present (%)
Poor families by family type - Female, no husband present (%)
Poverty status for native-born residents (%)
Poverty status for foreign-born residents (%)
Poverty among high school graduates not in families (%)
Poverty among people who did not graduate high school not in families (%)
Residents with income below the poverty level (%) - White
Residents with income below the poverty level (%) - Black or African American
Residents with income below the poverty level (%) - Asian
Residents with income below the poverty level (%) - Hispanic or Latino
Residents with income below the poverty level (%) - American Indian and Alaska Native
Residents with income below the poverty level (%) - Multirace
Residents with income below the poverty level (%) - Other Race
Air pollution - Air Quality Index (AQI)
Air pollution - CO
Air pollution - NO2
Air pollution - SO2
Air pollution - Ozone
Air pollution - PM10
Air pollution - PM25
Air pollution - Pb
Crime - Murders per 100,000 population
Crime - Rapes per 100,000 population
Crime - Robberies per 100,000 population
Crime - Assaults per 100,000 population
Crime - Burglaries per 100,000 population
Crime - Thefts per 100,000 population
Crime - Auto thefts per 100,000 population
Crime - Arson per 100,000 population
Crime - City-data.com crime index
Crime - Violent crime index
Crime - Property crime index
Crime - Murders per 100,000 population (5 year average)
Crime - Rapes per 100,000 population (5 year average)
Crime - Robberies per 100,000 population (5 year average)
Crime - Assaults per 100,000 population (5 year average)
Crime - Burglaries per 100,000 population (5 year average)
Crime - Thefts per 100,000 population (5 year average)
Crime - Auto thefts per 100,000 population (5 year average)
Crime - Arson per 100,000 population (5 year average)
Crime - City-data.com crime index (5 year average)
Crime - Violent crime index (5 year average)
Crime - Property crime index (5 year average)
1996 Presidential Elections Results (%) - Democratic Party (Clinton)
1996 Presidential Elections Results (%) - Republican Party (Dole)
1996 Presidential Elections Results (%) - Other
2000 Presidential Elections Results (%) - Democratic Party (Gore)
2000 Presidential Elections Results (%) - Republican Party (Bush)
2000 Presidential Elections Results (%) - Other
2004 Presidential Elections Results (%) - Democratic Party (Kerry)
2004 Presidential Elections Results (%) - Republican Party (Bush)
2004 Presidential Elections Results (%) - Other
2008 Presidential Elections Results (%) - Democratic Party (Obama)
2008 Presidential Elections Results (%) - Republican Party (McCain)
2008 Presidential Elections Results (%) - Other
2012 Presidential Elections Results (%) - Democratic Party (Obama)
2012 Presidential Elections Results (%) - Republican Party (Romney)
2012 Presidential Elections Results (%) - Other
2016 Presidential Elections Results (%) - Democratic Party (Clinton)
2016 Presidential Elections Results (%) - Republican Party (Trump)
2016 Presidential Elections Results (%) - Other
2020 Presidential Elections Results (%) - Democratic Party (Biden)
2020 Presidential Elections Results (%) - Republican Party (Trump)
2020 Presidential Elections Results (%) - Other
Ancestries Reported - Arab (%)
Ancestries Reported - Czech (%)
Ancestries Reported - Danish (%)
Ancestries Reported - Dutch (%)
Ancestries Reported - English (%)
Ancestries Reported - French (%)
Ancestries Reported - French Canadian (%)
Ancestries Reported - German (%)
Ancestries Reported - Greek (%)
Ancestries Reported - Hungarian (%)
Ancestries Reported - Irish (%)
Ancestries Reported - Italian (%)
Ancestries Reported - Lithuanian (%)
Ancestries Reported - Norwegian (%)
Ancestries Reported - Polish (%)
Ancestries Reported - Portuguese (%)
Ancestries Reported - Russian (%)
Ancestries Reported - Scotch-Irish (%)
Ancestries Reported - Scottish (%)
Ancestries Reported - Slovak (%)
Ancestries Reported - Subsaharan African (%)
Ancestries Reported - Swedish (%)
Ancestries Reported - Swiss (%)
Ancestries Reported - Ukrainian (%)
Ancestries Reported - United States (%)
Ancestries Reported - Welsh (%)
Ancestries Reported - West Indian (%)
Ancestries Reported - Other (%)
Educational Attainment - No schooling completed (%)
Educational Attainment - Less than high school (%)
Educational Attainment - High school or equivalent (%)
Educational Attainment - Less than 1 year of college (%)
Educational Attainment - 1 or more years of college (%)
Educational Attainment - Associate degree (%)
Educational Attainment - Bachelor's degree (%)
Educational Attainment - Master's degree (%)
Educational Attainment - Professional school degree (%)
Educational Attainment - Doctorate degree (%)
School Enrollment - Nursery, preschool (%)
School Enrollment - Kindergarten (%)
School Enrollment - Grade 1 to 4 (%)
School Enrollment - Grade 5 to 8 (%)
School Enrollment - Grade 9 to 12 (%)
School Enrollment - College undergrad (%)
School Enrollment - Graduate or professional (%)
School Enrollment - Not enrolled in school (%)
School enrollment - Public schools (%)
School enrollment - Private schools (%)
School enrollment - Not enrolled (%)
Median number of rooms in houses and condos
Median number of rooms in apartments
Housing units lacking complete plumbing facilities (%)
Housing units lacking complete kitchen facilities (%)
Density of houses
Urban houses (%)
Rural houses (%)
Households with people 60 years and over (%)
Households with people 65 years and over (%)
Households with people 75 years and over (%)
Households with one or more nonrelatives (%)
Households with no nonrelatives (%)
Population in households (%)
Family households (%)
Nonfamily households (%)
Population in families (%)
Family households with own children (%)
Median number of bedrooms in owner occupied houses
Mean number of bedrooms in owner occupied houses
Median number of bedrooms in renter occupied houses
Mean number of bedrooms in renter occupied houses
Median number of vehichles in owner occupied houses
Mean number of vehichles in owner occupied houses
Median number of vehichles in renter occupied houses
Mean number of vehichles in renter occupied houses
Mortgage status - with mortgage (%)
Mortgage status - with second mortgage (%)
Mortgage status - with home equity loan (%)
Mortgage status - with both second mortgage and home equity loan (%)
Mortgage status - without a mortgage (%)
Average family size
Average family size - White
Average family size - Black or African American
Average family size - Asian
Average family size - Hispanic or Latino
Average family size - American Indian and Alaska Native
Average family size - Multirace
Average family size - Other Race
Geographical mobility - Same house 1 year ago (%)
Geographical mobility - Moved within same county (%)
Geographical mobility - Moved from different county within same state (%)
Geographical mobility - Moved from different state (%)
Geographical mobility - Moved from abroad (%)
Place of birth - Born in state of residence (%)
Place of birth - Born in other state (%)
Place of birth - Native, outside of US (%)
Place of birth - Foreign born (%)
Housing units in structures - 1, detached (%)
Housing units in structures - 1, attached (%)
Housing units in structures - 2 (%)
Housing units in structures - 3 or 4 (%)
Housing units in structures - 5 to 9 (%)
Housing units in structures - 10 to 19 (%)
Housing units in structures - 20 to 49 (%)
Housing units in structures - 50 or more (%)
Housing units in structures - Mobile home (%)
Housing units in structures - Boat, RV, van, etc. (%)
House/condo owner moved in on average (years ago)
Renter moved in on average (years ago)
Year householder moved into unit - Moved in 1999 to March 2000 (%)
Year householder moved into unit - Moved in 1995 to 1998 (%)
Year householder moved into unit - Moved in 1990 to 1994 (%)
Year householder moved into unit - Moved in 1980 to 1989 (%)
Year householder moved into unit - Moved in 1970 to 1979 (%)
Year householder moved into unit - Moved in 1969 or earlier (%)
Means of transportation to work - Drove car alone (%)
Means of transportation to work - Carpooled (%)
Means of transportation to work - Public transportation (%)
Means of transportation to work - Bus or trolley bus (%)
Means of transportation to work - Streetcar or trolley car (%)
Means of transportation to work - Subway or elevated (%)
Means of transportation to work - Railroad (%)
Means of transportation to work - Ferryboat (%)
Means of transportation to work - Taxicab (%)
Means of transportation to work - Motorcycle (%)
Means of transportation to work - Bicycle (%)
Means of transportation to work - Walked (%)
Means of transportation to work - Other means (%)
Working at home (%)
Industry diversity
Most Common Industries - Agriculture, forestry, fishing and hunting, and mining (%)
Most Common Industries - Agriculture, forestry, fishing and hunting (%)
Most Common Industries - Mining, quarrying, and oil and gas extraction (%)
Most Common Industries - Construction (%)
Most Common Industries - Manufacturing (%)
Most Common Industries - Wholesale trade (%)
Most Common Industries - Retail trade (%)
Most Common Industries - Transportation and warehousing, and utilities (%)
Most Common Industries - Transportation and warehousing (%)
Most Common Industries - Utilities (%)
Most Common Industries - Information (%)
Most Common Industries - Finance and insurance, and real estate and rental and leasing (%)
Most Common Industries - Finance and insurance (%)
Most Common Industries - Real estate and rental and leasing (%)
Most Common Industries - Professional, scientific, and management, and administrative and waste management services (%)
Most Common Industries - Professional, scientific, and technical services (%)
Most Common Industries - Management of companies and enterprises (%)
Most Common Industries - Administrative and support and waste management services (%)
Most Common Industries - Educational services, and health care and social assistance (%)
Most Common Industries - Educational services (%)
Most Common Industries - Health care and social assistance (%)
Most Common Industries - Arts, entertainment, and recreation, and accommodation and food services (%)
Most Common Industries - Arts, entertainment, and recreation (%)
Most Common Industries - Accommodation and food services (%)
Most Common Industries - Other services, except public administration (%)
Most Common Industries - Public administration (%)
Occupation diversity
Most Common Occupations - Management, business, science, and arts occupations (%)
Most Common Occupations - Management, business, and financial occupations (%)
Most Common Occupations - Management occupations (%)
Most Common Occupations - Business and financial operations occupations (%)
Most Common Occupations - Computer, engineering, and science occupations (%)
Most Common Occupations - Computer and mathematical occupations (%)
Most Common Occupations - Architecture and engineering occupations (%)
Most Common Occupations - Life, physical, and social science occupations (%)
Most Common Occupations - Education, legal, community service, arts, and media occupations (%)
Most Common Occupations - Community and social service occupations (%)
Most Common Occupations - Legal occupations (%)
Most Common Occupations - Education, training, and library occupations (%)
Most Common Occupations - Arts, design, entertainment, sports, and media occupations (%)
Most Common Occupations - Healthcare practitioners and technical occupations (%)
Most Common Occupations - Health diagnosing and treating practitioners and other technical occupations (%)
Most Common Occupations - Health technologists and technicians (%)
Most Common Occupations - Service occupations (%)
Most Common Occupations - Healthcare support occupations (%)
Most Common Occupations - Protective service occupations (%)
Most Common Occupations - Fire fighting and prevention, and other protective service workers including supervisors (%)
Most Common Occupations - Law enforcement workers including supervisors (%)
Most Common Occupations - Food preparation and serving related occupations (%)
Most Common Occupations - Building and grounds cleaning and maintenance occupations (%)
Most Common Occupations - Personal care and service occupations (%)
Most Common Occupations - Sales and office occupations (%)
Most Common Occupations - Sales and related occupations (%)
Most Common Occupations - Office and administrative support occupations (%)
Most Common Occupations - Natural resources, construction, and maintenance occupations (%)
Most Common Occupations - Farming, fishing, and forestry occupations (%)
Most Common Occupations - Construction and extraction occupations (%)
Most Common Occupations - Installation, maintenance, and repair occupations (%)
Most Common Occupations - Production, transportation, and material moving occupations (%)
Most Common Occupations - Production occupations (%)
Most Common Occupations - Transportation occupations (%)
Most Common Occupations - Material moving occupations (%)
People in Group quarters - Institutionalized population (%)
People in Group quarters - Correctional institutions (%)
People in Group quarters - Federal prisons and detention centers (%)
People in Group quarters - Halfway houses (%)
People in Group quarters - Local jails and other confinement facilities (including police lockups) (%)
People in Group quarters - Military disciplinary barracks (%)
People in Group quarters - State prisons (%)
People in Group quarters - Other types of correctional institutions (%)
People in Group quarters - Nursing homes (%)
People in Group quarters - Hospitals/wards, hospices, and schools for the handicapped (%)
People in Group quarters - Hospitals/wards and hospices for chronically ill (%)
People in Group quarters - Hospices or homes for chronically ill (%)
People in Group quarters - Military hospitals or wards for chronically ill (%)
People in Group quarters - Other hospitals or wards for chronically ill (%)
People in Group quarters - Hospitals or wards for drug/alcohol abuse (%)
People in Group quarters - Mental (Psychiatric) hospitals or wards (%)
People in Group quarters - Schools, hospitals, or wards for the mentally retarded (%)
People in Group quarters - Schools, hospitals, or wards for the physically handicapped (%)
People in Group quarters - Institutions for the deaf (%)
People in Group quarters - Institutions for the blind (%)
People in Group quarters - Orthopedic wards and institutions for the physically handicapped (%)
People in Group quarters - Wards in general hospitals for patients who have no usual home elsewhere (%)
People in Group quarters - Wards in military hospitals for patients who have no usual home elsewhere (%)
People in Group quarters - Juvenile institutions (%)
People in Group quarters - Long-term care (%)
People in Group quarters - Homes for abused, dependent, and neglected children (%)
People in Group quarters - Residential treatment centers for emotionally disturbed children (%)
People in Group quarters - Training schools for juvenile delinquents (%)
People in Group quarters - Short-term care, detention or diagnostic centers for delinquent children (%)
People in Group quarters - Type of juvenile institution unknown (%)
People in Group quarters - Noninstitutionalized population (%)
People in Group quarters - College dormitories (includes college quarters off campus) (%)
People in Group quarters - Military quarters (%)
People in Group quarters - On base (%)
People in Group quarters - Barracks, unaccompanied personnel housing (UPH), (Enlisted/Officer), ;and similar group living quarters for military personnel (%)
People in Group quarters - Transient quarters for temporary residents (%)
People in Group quarters - Military ships (%)
People in Group quarters - Group homes (%)
People in Group quarters - Homes or halfway houses for drug/alcohol abuse (%)
People in Group quarters - Homes for the mentally ill (%)
People in Group quarters - Homes for the mentally retarded (%)
People in Group quarters - Homes for the physically handicapped (%)
People in Group quarters - Other group homes (%)
People in Group quarters - Religious group quarters (%)
People in Group quarters - Dormitories (%)
People in Group quarters - Agriculture workers' dormitories on farms (%)
People in Group quarters - Job Corps and vocational training facilities (%)
People in Group quarters - Other workers' dormitories (%)
People in Group quarters - Crews of maritime vessels (%)
People in Group quarters - Other nonhousehold living situations (%)
People in Group quarters - Other noninstitutional group quarters (%)
Residents speaking English at home (%)
Residents speaking English at home - Born in the United States (%)
Residents speaking English at home - Native, born elsewhere (%)
Residents speaking English at home - Foreign born (%)
Residents speaking Spanish at home (%)
Residents speaking Spanish at home - Born in the United States (%)
Residents speaking Spanish at home - Native, born elsewhere (%)
Residents speaking Spanish at home - Foreign born (%)
Residents speaking other language at home (%)
Residents speaking other language at home - Born in the United States (%)
Residents speaking other language at home - Native, born elsewhere (%)
Residents speaking other language at home - Foreign born (%)
Class of Workers - Employee of private company (%)
Class of Workers - Self-employed in own incorporated business (%)
Class of Workers - Private not-for-profit wage and salary workers (%)
Class of Workers - Local government workers (%)
Class of Workers - State government workers (%)
Class of Workers - Federal government workers (%)
Class of Workers - Self-employed workers in own not incorporated business and Unpaid family workers (%)
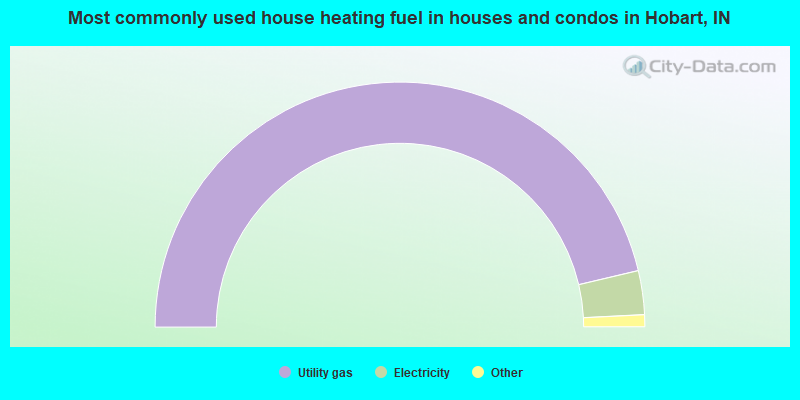
House heating fuel used in houses and condos - Utility gas (%)
House heating fuel used in houses and condos - Bottled, tank, or LP gas (%)
House heating fuel used in houses and condos - Electricity (%)
House heating fuel used in houses and condos - Fuel oil, kerosene, etc. (%)
House heating fuel used in houses and condos - Coal or coke (%)
House heating fuel used in houses and condos - Wood (%)
House heating fuel used in houses and condos - Solar energy (%)
House heating fuel used in houses and condos - Other fuel (%)
House heating fuel used in houses and condos - No fuel used (%)
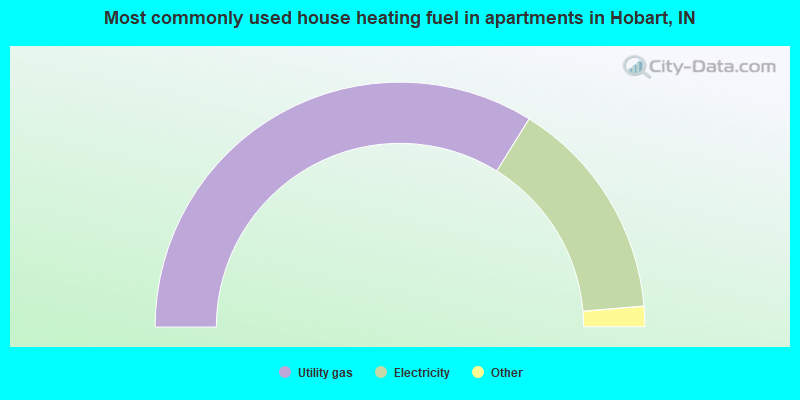
House heating fuel used in apartments - Utility gas (%)
House heating fuel used in apartments - Bottled, tank, or LP gas (%)
House heating fuel used in apartments - Electricity (%)
House heating fuel used in apartments - Fuel oil, kerosene, etc. (%)
House heating fuel used in apartments - Coal or coke (%)
House heating fuel used in apartments - Wood (%)
House heating fuel used in apartments - Solar energy (%)
House heating fuel used in apartments - Other fuel (%)
House heating fuel used in apartments - No fuel used (%)
Armed forces status - In Armed Forces (%)
Armed forces status - Civilian (%)
Armed forces status - Civilian - Veteran (%)
Armed forces status - Civilian - Nonveteran (%)
Fatal accidents locations in years 2005-2021
Fatal accidents locations in 2005
Fatal accidents locations in 2006
Fatal accidents locations in 2007
Fatal accidents locations in 2008
Fatal accidents locations in 2009
Fatal accidents locations in 2010
Fatal accidents locations in 2011
Fatal accidents locations in 2012
Fatal accidents locations in 2013
Fatal accidents locations in 2014
Fatal accidents locations in 2015
Fatal accidents locations in 2016
Fatal accidents locations in 2017
Fatal accidents locations in 2018
Fatal accidents locations in 2019
Fatal accidents locations in 2020
Fatal accidents locations in 2021
Alcohol use - People drinking some alcohol every month (%)
Alcohol use - People not drinking at all (%)
Alcohol use - Average days/month drinking alcohol
Alcohol use - Average drinks/week
Alcohol use - Average days/year people drink much
Audiometry - Average condition of hearing (%)
Audiometry - People that can hear a whisper from across a quiet room (%)
Audiometry - People that can hear normal voice from across a quiet room (%)
Audiometry - Ears ringing, roaring, buzzing (%)
Audiometry - Had a job exposure to loud noise (%)
Audiometry - Had off-work exposure to loud noise (%)
Blood Pressure & Cholesterol - Has high blood pressure (%)
Blood Pressure & Cholesterol - Checking blood pressure at home (%)
Blood Pressure & Cholesterol - Frequently checking blood cholesterol (%)
Blood Pressure & Cholesterol - Has high cholesterol level (%)
Consumer Behavior - Money monthly spent on food at supermarket/grocery store
Consumer Behavior - Money monthly spent on food at other stores
Consumer Behavior - Money monthly spent on eating out
Consumer Behavior - Money monthly spent on carryout/delivered foods
Consumer Behavior - Income spent on food at supermarket/grocery store (%)
Consumer Behavior - Income spent on food at other stores (%)
Consumer Behavior - Income spent on eating out (%)
Consumer Behavior - Income spent on carryout/delivered foods (%)
Current Health Status - General health condition (%)
Current Health Status - Blood donors (%)
Current Health Status - Has blood ever tested for HIV virus (%)
Current Health Status - Left-handed people (%)
Dermatology - People using sunscreen (%)
Diabetes - Diabetics (%)
Diabetes - Had a blood test for high blood sugar (%)
Diabetes - People taking insulin (%)
Diet Behavior & Nutrition - Diet health (%)
Diet Behavior & Nutrition - Milk product consumption (# of products/month)
Diet Behavior & Nutrition - Meals not home prepared (#/week)
Diet Behavior & Nutrition - Meals from fast food or pizza place (#/week)
Diet Behavior & Nutrition - Ready-to-eat foods (#/month)
Diet Behavior & Nutrition - Frozen meals/pizza (#/month)
Drug Use - People that ever used marijuana or hashish (%)
Drug Use - Ever used hard drugs (%)
Drug Use - Ever used any form of cocaine (%)
Drug Use - Ever used heroin (%)
Drug Use - Ever used methamphetamine (%)
Health Insurance - People covered by health insurance (%)
Kidney Conditions-Urology - Avg. # of times urinating at night
Medical Conditions - People with asthma (%)
Medical Conditions - People with anemia (%)
Medical Conditions - People with psoriasis (%)
Medical Conditions - People with overweight (%)
Medical Conditions - Elderly people having difficulties in thinking or remembering (%)
Medical Conditions - People who ever received blood transfusion (%)
Medical Conditions - People having trouble seeing even with glass/contacts (%)
Medical Conditions - People with arthritis (%)
Medical Conditions - People with gout (%)
Medical Conditions - People with congestive heart failure (%)
Medical Conditions - People with coronary heart disease (%)
Medical Conditions - People with angina pectoris (%)
Medical Conditions - People who ever had heart attack (%)
Medical Conditions - People who ever had stroke (%)
Medical Conditions - People with emphysema (%)
Medical Conditions - People with thyroid problem (%)
Medical Conditions - People with chronic bronchitis (%)
Medical Conditions - People with any liver condition (%)
Medical Conditions - People who ever had cancer or malignancy (%)
Mental Health - People who have little interest in doing things (%)
Mental Health - People feeling down, depressed, or hopeless (%)
Mental Health - People who have trouble sleeping or sleeping too much (%)
Mental Health - People feeling tired or having little energy (%)
Mental Health - People with poor appetite or overeating (%)
Mental Health - People feeling bad about themself (%)
Mental Health - People who have trouble concentrating on things (%)
Mental Health - People moving or speaking slowly or too fast (%)
Mental Health - People having thoughts they would be better off dead (%)
Oral Health - Average years since last visit a dentist
Oral Health - People embarrassed because of mouth (%)
Oral Health - People with gum disease (%)
Oral Health - General health of teeth and gums (%)
Oral Health - Average days a week using dental floss/device
Oral Health - Average days a week using mouthwash for dental problem
Oral Health - Average number of teeth
Pesticide Use - Households using pesticides to control insects (%)
Pesticide Use - Households using pesticides to kill weeds (%)
Physical Activity - People doing vigorous-intensity work activities (%)
Physical Activity - People doing moderate-intensity work activities (%)
Physical Activity - People walking or bicycling (%)
Physical Activity - People doing vigorous-intensity recreational activities (%)
Physical Activity - People doing moderate-intensity recreational activities (%)
Physical Activity - Average hours a day doing sedentary activities
Physical Activity - Average hours a day watching TV or videos
Physical Activity - Average hours a day using computer
Physical Functioning - People having limitations keeping them from working (%)
Physical Functioning - People limited in amount of work they can do (%)
Physical Functioning - People that need special equipment to walk (%)
Physical Functioning - People experiencing confusion/memory problems (%)
Physical Functioning - People requiring special healthcare equipment (%)
Prescription Medications - Average number of prescription medicines taking
Preventive Aspirin Use - Adults 40+ taking low-dose aspirin (%)
Reproductive Health - Vaginal deliveries (%)
Reproductive Health - Cesarean deliveries (%)
Reproductive Health - Deliveries resulted in a live birth (%)
Reproductive Health - Pregnancies resulted in a delivery (%)
Reproductive Health - Women breastfeeding newborns (%)
Reproductive Health - Women that had a hysterectomy (%)
Reproductive Health - Women that had both ovaries removed (%)
Reproductive Health - Women that have ever taken birth control pills (%)
Reproductive Health - Women taking birth control pills (%)
Reproductive Health - Women that have ever used Depo-Provera or injectables (%)
Reproductive Health - Women that have ever used female hormones (%)
Sexual Behavior - People 18+ that ever had sex (vaginal, anal, or oral) (%)
Sexual Behavior - Males 18+ that ever had vaginal sex with a woman (%)
Sexual Behavior - Males 18+ that ever performed oral sex on a woman (%)
Sexual Behavior - Males 18+ that ever had anal sex with a woman (%)
Sexual Behavior - Males 18+ that ever had any sex with a man (%)
Sexual Behavior - Females 18+ that ever had vaginal sex with a man (%)
Sexual Behavior - Females 18+ that ever performed oral sex on a man (%)
Sexual Behavior - Females 18+ that ever had anal sex with a man (%)
Sexual Behavior - Females 18+ that ever had any kind of sex with a woman (%)
Sexual Behavior - Average age people first had sex
Sexual Behavior - Average number of female sex partners in lifetime (males 18+)
Sexual Behavior - Average number of female vaginal sex partners in lifetime (males 18+)
Sexual Behavior - Average age people first performed oral sex on a woman (18+)
Sexual Behavior - Average number of woman performed oral sex on in lifetime (18+)
Sexual Behavior - Average number of male sex partners in lifetime (males 18+)
Sexual Behavior - Average number of male anal sex partners in lifetime (males 18+)
Sexual Behavior - Average age people first performed oral sex on a man (18+)
Sexual Behavior - Average number of male oral sex partners in lifetime (18+)
Sexual Behavior - People using protection when performing oral sex (%)
Sexual Behavior - Average number of times people have vaginal or anal sex a year
Sexual Behavior - People having sex without condom (%)
Sexual Behavior - Average number of male sex partners in lifetime (females 18+)
Sexual Behavior - Average number of male vaginal sex partners in lifetime (females 18+)
Sexual Behavior - Average number of female sex partners in lifetime (females 18+)
Sexual Behavior - Circumcised males 18+ (%)
Sleep Disorders - Average hours sleeping at night
Sleep Disorders - People that has trouble sleeping (%)
Smoking-Cigarette Use - People smoking cigarettes (%)
Taste & Smell - People 40+ having problems with smell (%)
Taste & Smell - People 40+ having problems with taste (%)
Taste & Smell - People 40+ that ever had wisdom teeth removed (%)
Taste & Smell - People 40+ that ever had tonsils teeth removed (%)
Taste & Smell - People 40+ that ever had a loss of consciousness because of a head injury (%)
Taste & Smell - People 40+ that ever had a broken nose or other serious injury to face or skull (%)
Taste & Smell - People 40+ that ever had two or more sinus infections (%)
Weight - Average height (inches)
Weight - Average weight (pounds)
Weight - Average BMI
Weight - People that are obese (%)
Weight - People that ever were obese (%)
Weight - People trying to lose weight (%)
Officers per 1,000 residents here:
2.38Indiana average:
2.16
Latest news from Hobart, IN collected exclusively by city-data.com from local newspapers, TV, and radio stations
Ancestries: German (9.7%), Irish (8.5%), English (7.9%), Polish (7.2%), American (4.9%), Italian (2.5%).
Current Local Time:
Land area: 26.2 square miles.
Population density: 1,124 people per square mile (low).
1,437 residents are foreign born (1.6% Europe , 1.3% Asia , 1.1% Latin America ).
This city:
4.8%Indiana:
5.6%
Median real estate property taxes paid for housing units with mortgages in 2022: $2,233 (0.9%)Median real estate property taxes paid for housing units with no mortgage in 2022: $2,136 (1.1%)
Nearest city with pop. 50,000+: Gary, IN
Nearest city with pop. 200,000+: Chicago, IL
Nearest cities:
Latitude: 41.53 N, Longitude: 87.27 W
Daytime population change due to commuting: +1,910 (+6.4%)Workers who live and work in this city: 4,372 (30.9%)
Single-family new house construction building permits:
2022: 28 buildings , average cost: $321,9002021: 43 buildings , average cost: $317,3002020: 34 buildings , average cost: $283,2002019: 16 buildings , average cost: $277,8002018: 23 buildings , average cost: $245,9002017: 24 buildings , average cost: $245,0002016: 66 buildings , average cost: $156,4002015: 32 buildings , average cost: $241,9002014: 18 buildings , average cost: $219,1002013: 20 buildings , average cost: $219,1002012: 14 buildings , average cost: $237,1002011: 6 buildings , average cost: $246,7002010: 13 buildings , average cost: $209,9002009: 14 buildings , average cost: $211,4002008: 8 buildings , average cost: $255,2002007: 79 buildings , average cost: $191,6002006: 74 buildings , average cost: $179,4002005: 142 buildings , average cost: $162,0002004: 161 buildings , average cost: $137,5002003: 216 buildings , average cost: $124,1002002: 177 buildings , average cost: $124,2002001: 203 buildings , average cost: $122,8002000: 161 buildings , average cost: $129,6001999: 173 buildings , average cost: $123,2001998: 155 buildings , average cost: $124,0001997: 155 buildings , average cost: $116,600Unemployment in December 2023:
Population change in the 1990s: +643 (+2.6%).
Most common occupations in Hobart, IN (%)
Both Males Females
Electrical equipment mechanics and other installation, maintenance, and repair workers, including supervisors (5.4%)
Other production occupations, including supervisors (4.5%)
Retail sales workers, except cashiers (3.8%)
Secretaries and administrative assistants (3.7%)
Other sales and related occupations, including supervisors (3.6%)
Material recording, scheduling, dispatching, and distributing workers (3.4%)
Metal workers and plastic workers (3.1%)
Electrical equipment mechanics and other installation, maintenance, and repair workers, including supervisors (9.5%)
Other production occupations, including supervisors (6.1%)
Metal workers and plastic workers (5.3%)
Construction traders workers except carpenters, electricians, painters, plumbers, and construction laborers (5.2%)
Laborers and material movers, hand (3.9%)
Material recording, scheduling, dispatching, and distributing workers (3.7%)
Driver/sales workers and truck drivers (3.7%)
Secretaries and administrative assistants (8.1%)
Information and record clerks, except customer service representatives (5.1%)
Retail sales workers, except cashiers (5.0%)
Preschool, kindergarten, elementary, and middle school teachers (4.8%)
Cashiers (4.7%)
Other office and administrative support workers, including supervisors (4.5%)
Other sales and related occupations, including supervisors (4.5%)
Tornado activity:
Hobart-area historical tornado activity is slightly below Indiana state average. It is 62% greater than the overall U.S. average.
On 4/21/1967, a category F4 (max. wind speeds 207-260 mph) tornado 20.2 miles away from the Hobart city center killed 33 people and injured 500 people and caused between $5,000,000 and $50,000,000 in damages.
On 8/28/1990, a category F5 (max. wind speeds 261-318 mph) tornado 43.1 miles away from the city center killed 29 people and injured 350 people and caused between $50,000 and $500,000 in damages.
Earthquake activity:
Hobart-area historical earthquake activity is significantly above Indiana state average. It is 36% greater than the overall U.S. average. On 4/18/2008 at 09:36:59, a magnitude 5.4 (5.1 MB, 4.8 MS, 5.4 MW, 5.2 MW, Class: Moderate, Intensity: VI - VII) earthquake occurred 215.3 miles away from Hobart center On 6/10/1987 at 23:48:54, a magnitude 5.1 (4.9 MB, 4.4 MS, 4.6 MS, 5.1 LG) earthquake occurred 190.1 miles away from the city center On 4/18/2008 at 09:36:59, a magnitude 5.2 (5.2 MW, Depth: 8.9 mi) earthquake occurred 215.4 miles away from Hobart center On 6/28/2004 at 06:10:52, a magnitude 4.2 (4.2 MW, Depth: 6.2 mi, Class: Light, Intensity: IV - V) earthquake occurred 84.7 miles away from Hobart center On 6/18/2002 at 17:37:15, a magnitude 5.0 (4.3 MB, 4.6 MW, 5.0 LG) earthquake occurred 246.5 miles away from the city center On 4/18/2008 at 15:14:16, a magnitude 4.8 (4.5 MB, 4.8 MW, 4.6 MW) earthquake occurred 213.4 miles away from the city center Magnitude types: regional Lg-wave magnitude (LG), body-wave magnitude (MB), surface-wave magnitude (MS), moment magnitude (MW) Natural disasters: The number of natural disasters in Lake County (19) is greater than the US average (15).Major Disasters (Presidential) Declared: 12Emergencies Declared: 5Floods: 11, Storms: 10, Winter Storms: 5, Tornadoes: 3, Snowstorms: 2, Hurricane: 1, Snow: 1, Other: 1 (Note: some incidents may be assigned to more than one category). Hospitals in Hobart: ARC BRIDGES INC (4378 FOURTEENTH LANE) ARC BRIDGES, INC (3583 RANDOLPH ST) ARC BRIDGES, INC (420 CRESTWOOD) REM-INDIANA INC (3142 62ND PL E) ST MARY MEDICAL CENTER INC (Voluntary non-profit - Private, 1500 S LAKE PARK AVE) Nursing Homes in Hobart: MILLER'S MERRY MANOR (2901 W 37TH AVE) SEBO'S NURSING AND REHABILITATION CENTER (4410 W 49TH AVE) ST MARY MEDICAL CENTER TRANSIT CR UNIT (1500 S LAKE PARK AVE) Dialysis Facilities in Hobart: FMC - HOBART (1330 S. WISCONSIN STREET) Home Health Centers in Hobart: HEALTHMASTERS INC (7779 E RIDGE RD STE A) HOME HEALTH OF ST MARY MEDICAL CENTER (1439 S LAKE PARK AVE) Amtrak stations near Hobart: 14 miles: DYER (SHEFFIELD RD.) Services: enclosed waiting area, public payphones, free short-term parking, free long-term parking.
17 miles: HAMMOND-WHITING (HAMMOND, 1135 CALUMET AVE.) Services: ticket office, partially wheelchair accessible, enclosed waiting area, public restrooms, public payphones, free short-term parking, free long-term parking, call for taxi service.
College/University in Hobart: College of Court Reporting Inc Full-time enrollment: 221; Location: 111 W 10th St Ste 111; Private, for-profit; Website: www.ccr.edu)
Colleges/universities with over 2000 students nearest to Hobart:
Indiana University-Northwest (about 5 miles; Gary, IN ; Full-time enrollment: 4,390)
Purdue University-Calumet Campus (about 12 miles; Hammond, IN ; FT enrollment: 7,343)
Valparaiso University (about 13 miles; Valparaiso, IN ; FT enrollment: 3,542)
South Suburban College (about 19 miles; South Holland, IL ; FT enrollment: 3,972)
Prairie State College (about 20 miles; Chicago Heights, IL ; FT enrollment: 4,050)
Purdue University-North Central Campus (about 20 miles; Westville, IN ; FT enrollment: 3,682)
City Colleges of Chicago-Olive-Harvey College (about 21 miles; Chicago, IL ; FT enrollment: 4,110)
Public high schools in Hobart:
Public elementary/middle schools in Hobart: HOBART MIDDLE SCHOOL Students: 869, Location: 36 E 8TH ST, Grades: 6-8)JOAN MARTIN ELEMENTARY SCHOOL Students: 758, Location: 301 E 10TH ST, Grades: KG-6)JOHN I MEISTER ELEMENTARY SCHOOL Students: 293, Location: 3300 JAY ST, Grades: KG-6)RIDGE VIEW ELEMENTARY SCHOOL Students: 263, Location: 3333 W OLD RIDGE RD, Grades: 1-5)LIBERTY ELEMENTARY SCHOOL Location: 130 N LIBERTY ST, Grades: KG-5)
RIVER FOREST INTERMEDIATE Location: 3350 INDIANA ST, Grades: 5-6)
Private elementary/middle schools in Hobart:
See full list of schools located in Hobart
Notable locations in Hobart: (A) , Supervisors Country Club (B) , Cressmoor Country Club (C) , Hobart Carnegie Library (D) , Hobart Branch Lake County Public Library (E) , Hobart Fire Department Station 4 (F) , Hobart Fire Department Station 2 (G) , Hobart Fire Department Station 3 (H) , Hobart Fire Department Station 1 (I) . Display/hide their locations on the map
Shopping Center: (1) . Display/hide its location on the map
Churches in Hobart include: (A) , Trinity Lutheran Church (B) , New Hope Missionary Baptist Church (C) , New Hope Church of God (D) , Hillcrest Baptist Church (E) , Hobart Assembly of God Church (F) , Christ Community Church (G) , Deep River Church of Christ (H) , Primera Iglesia Christian (I) . Display/hide their locations on the map
Cemeteries: (1) , Crown Hill Cemetery (2) , Evergreen Memorial Park (3) , Chester Cemetery (4) . Display/hide their locations on the map
Lakes and reservoirs: (A) , Mac Joy Lake (B) , Lake George (C) . Display/hide their locations on the map
Streams, rivers, and creeks: (A) , Sprout Ditch (B) , Frog Creek (C) , Duck Creek (D) . Display/hide their locations on the map
Parks in Hobart include: (1) , Brookview Park (2) , Glenwood Park (3) , Robinson Park (4) , Lakeview Park (5) , Hillman Park (6) , Pennsy Park (7) . Display/hide their locations on the map
Tourist attractions: (1) , City Clerk (Recreation Areas; 45 East Cleveland) (2) . Display/hide their approximate locations on the map
Hotels: (1) , Dollar Inn (1855 Mississippi Street) (2) , Lees Inn & Suites Merrillville (6201 Opportunity Ln) (3) . Display/hide their approximate locations on the map
Court: (1) . Display/hide its approximate location on the map
Birthplace of: Craig Osika - 2005 NFL player (Cleveland Browns, born : Dec 4, 1979), Darren Elkins - Martial artist, Larry Bigbie - 2005 Major League Baseball player (Colorado Rockies, born : Nov 4, 1977), Tim Gill - Computer businessman.
Lake County has a predicted average indoor radon screening level between 2 and 4 pCi/L (pico curies per liter) - Moderate Potential Drinking water stations with addresses in Hobart and their reported violations in the past:
NEW CHICAGO WATER WORKS (Population served: 6,600, Purch surface water):
Past monitoring violations:
Follow-up Or Routine LCR Tap M/R - In OCT-01-2011, Contaminant: Lead and Copper Rule. Follow-up actions: St Public Notif requested (DEC-08-2011), St Violation/Reminder Notice (DEC-08-2011), St Compliance achieved (JUN-15-2012), St Public Notif received (JUN-11-2013)
Failure Submit IDSE/Subpart V Plan Rpt - In JAN-02-2009, Contaminant: DBP STAGE 2. Follow-up actions: Fed FAO issued (MAR-18-2009), Fed Compliance achieved (AUG-26-2009)
Follow-up Or Routine LCR Tap M/R - In OCT-10-2008, Contaminant: Lead and Copper Rule. Follow-up actions: St Public Notif requested (NOV-10-2008), St Violation/Reminder Notice (NOV-10-2008), St Public Notif received (NOV-19-2008), St Compliance achieved (NOV-03-2009)
Monitoring, Routine (IDSE) - Between OCT-2007 and SEP-2008, Contaminant: TTHM. Follow-up actions: Fed FAO issued (MAR-18-2009), Fed Compliance achieved (AUG-26-2009)
Monitoring, Routine (IDSE) - Between OCT-2007 and SEP-2008, Contaminant: Total Haloacetic Acids (HAA5). Follow-up actions: Fed FAO issued (MAR-18-2009), Fed Compliance achieved (AUG-26-2009)
Population served: 29, Groundwater):
Past monitoring violations:
3 routine major monitoring violations
One regular monitoring violation
Average household size: This city:
2.5 peopleIndiana:
2.5 people
Percentage of family households: This city:
65.8%Whole state:
66.9%
Percentage of households with unmarried partners: This city:
7.1%Whole state:
6.9%
Likely homosexual households (counted as self-reported same-sex unmarried-partner households)
Lesbian couples: 0.4% of all households Gay men: 0.2% of all households
People in group quarters in Hobart in 2010:
118 people in residential treatment centers for adults
22 people in group homes intended for adults
3 people in workers' group living quarters and job corps centers
People in group quarters in Hobart in 2000:
211 people in nursing homes
20 people in other group homes
15 people in agriculture workers' dormitories on farms
2 people in homes for the mentally retarded
Banks with branches in Hobart (2011 data):
Centier Bank: 81st Street Hobart Branch, Hobart Supermarket Branch, Hobart Downtown Branch, 37th Avenue Supermarket Branch. Info updated 2011/02/16: Bank assets: $2,123.9 mil, Deposits: $1,840.9 mil, headquarters in Whiting, IN, positive income , Commercial Lending Specialization, 47 total offices , Holding Company: First Bancshares, Inc.
First Midwest Bank: Hobart North Branch at 999 Old Ridge Road, branch established on 2001/09/18. Info updated 2011/12/22: Bank assets: $7,848.0 mil, Deposits: $6,529.2 mil, headquarters in Itasca, IL, positive income , Commercial Lending Specialization, 100 total offices , Holding Company: First Midwest Bancorp, Inc.
JPMorgan Chase Bank, National Association: Hobart Branch at 66 Main Street, branch established on 1945/06/30. Info updated 2011/11/10: Bank assets: $1,811,678.0 mil, Deposits: $1,190,738.0 mil, headquarters in Columbus, OH, positive income , International Specialization, 5577 total offices , Holding Company: Jpmorgan Chase & Co.
MainSource Bank: Mainsource Bank Hobart Branch at 555 East Third Street, branch established on 2007/05/04. Info updated 2009/12/09: Bank assets: $2,729.1 mil, Deposits: $2,167.0 mil, headquarters in Greensburg, IN, positive income , 86 total offices , Holding Company: Mainsource Financial Group, Inc.
Fifth Third Bank: Hobart Branch at 701 West Old Ridge Road, branch established on 1934/07/01. Info updated 2009/10/05: Bank assets: $114,540.4 mil, Deposits: $89,689.1 mil, headquarters in Cincinnati, OH, positive income , Commercial Lending Specialization, 1378 total offices , Holding Company: Fifth Third Bancorp
Peoples Bank SB: 1501 Lake Park Avenue Branch at 1501 Lake Park Avenue, branch established on 2000/11/10. Info updated 2006/11/03: Bank assets: $652.4 mil, Deposits: $528.1 mil, headquarters in Munster, IN, positive income , Commercial Lending Specialization, 12 total offices , Holding Company: Northwest Indiana Bancorp
For population 15 years and over in Hobart:
Never married: 31.5%Now married: 48.0%Separated: 1.8%Widowed: 6.1%Divorced: 12.7% For population 25 years and over in Hobart:
High school or higher: 93.9%Bachelor's degree or higher: 23.2%Graduate or professional degree: 5.6%Unemployed: 5.1%Mean travel time to work (commute): 25.0 minutes
Education Gini index (Inequality in education) Here:
9.3Indiana average:
11.3
Religion statistics for Hobart, IN (based on Lake County data)
Religion Adherents Congregations Catholic 101,096 58 Evangelical Protestant 98,213 266 Mainline Protestant 28,943 78 Black Protestant 25,459 74 Orthodox 13,990 14 Other 7,460 29 None 220,844 -
Source: Clifford Grammich, Kirk Hadaway, Richard Houseal, Dale E.Jones, Alexei Krindatch, Richie Stanley and Richard H.Taylor. 2012. 2010 U.S.Religion Census: Religious Congregations & Membership Study. Association of Statisticians of American Religious Bodies. Jones, Dale E., et al. 2002. Congregations and Membership in the United States 2000. Nashville, TN: Glenmary Research Center. Graphs represent county-level data
Food Environment Statistics: Number of grocery stores : 82Here :
1.67 / 10,000 pop.Indiana :
1.73 / 10,000 pop.
Number of supercenters and club stores : 4This county :
0.08 / 10,000 pop.State :
0.21 / 10,000 pop.
Number of convenience stores (no gas) : 30Here :
0.61 / 10,000 pop.State :
0.50 / 10,000 pop.
Number of convenience stores (with gas) : 175Here :
3.56 / 10,000 pop.Indiana :
3.57 / 10,000 pop.
Number of full-service restaurants : 288This county :
5.86 / 10,000 pop.State :
6.78 / 10,000 pop.
Adult diabetes rate : Lake County :
10.8%Indiana :
9.2%
Adult obesity rate : Lake County :
32.3%Indiana :
29.0%
Low-income preschool obesity rate : Lake County :
11.7%Indiana :
14.3%
Health and Nutrition: Healthy diet rate : Hobart:
50.8%Indiana:
49.3%
Average overall health of teeth and gums : This city:
48.7%Indiana:
46.2%
Average BMI : This city:
28.7Indiana:
28.7
People feeling badly about themselves : Hobart:
21.0%Indiana:
21.3%
People not drinking alcohol at all : Average hours sleeping at night : Overweight people : Hobart:
34.7%Indiana:
33.9%
General health condition : Average condition of hearing : Hobart:
78.7%Indiana:
78.7%
More about Health and Nutrition of Hobart, IN Residents
Local government employment and payroll (March 2022)
Function
Full-time employees
Monthly full-time payroll
Average yearly full-time wage
Part-time employees
Monthly part-time payroll
Police Protection - Officers
60 $386,141 $77,228 0 $0 Firefighters
57 $326,776 $68,795 0 $0 Solid Waste Management
22 $99,031 $54,017 0 $0 Sewerage
17 $98,430 $69,480 0 $0 Streets and Highways
15 $72,995 $58,396 1 $1,730 Other and Unallocable
11 $47,158 $51,445 10 $10,539 Police - Other
10 $36,878 $44,254 20 $18,203 Parks and Recreation
10 $43,467 $52,160 10 $5,844 Housing and Community Development (Local)
8 $45,245 $67,868 7 $4,708 Other Government Administration
8 $22,003 $33,005 1 $2,974 Financial Administration
6 $29,688 $59,376 0 $0 Judicial and Legal
6 $25,311 $50,622 3 $2,851 Fire - Other
1 $3,971 $47,652 2 $4,452 Correction
1 $4,480 $53,760 1 $1,066
Totals for Government
232 $1,241,574 $64,219 55 $52,367
Hobart government finances - Expenditure in 2021 (per resident):
Construction - General - Other: $1,620,000 ($54.99)
Sewerage: $1,354,000 ($45.96)Regular Highways: $109,000 ($3.70)General Public Buildings: $5,000 ($0.17)Current Operations - Regular Highways: $11,995,000 ($407.19)
Sewerage: $9,110,000 ($309.25)General - Other: $8,593,000 ($291.70)Police Protection: $6,397,000 ($217.16)Local Fire Protection: $5,012,000 ($170.14)Solid Waste Management: $1,146,000 ($38.90)Judicial and Legal Services: $1,007,000 ($34.18)General Public Buildings: $853,000 ($28.96)Parks and Recreation: $728,000 ($24.71)Central Staff Services: $497,000 ($16.87)Financial Administration: $278,000 ($9.44)Corrections - Other: $32,000 ($1.09)Miscellaneous Commercial Activities - Other: $9,000 ($0.31)General - Interest on Debt: $990,000 ($33.61)
Other Capital Outlay - Regular Highways: $679,000 ($23.05)
Police Protection: $191,000 ($6.48)General - Other: $190,000 ($6.45)Parks and Recreation: $156,000 ($5.30)Local Fire Protection: $49,000 ($1.66)Sewerage: $2,000 ($0.07)Corrections - Other: $2,000 ($0.07)General Public Building: $1,000 ($0.03)Judicial and Legal Services: $1,000 ($0.03)
Hobart government finances - Revenue in 2021 (per resident):
Charges - Sewerage: $17,409,000 ($590.98)
Solid Waste Management: $2,230,000 ($75.70)Other: $2,024,000 ($68.71)Parks and Recreation: $72,000 ($2.44)Local Intergovernmental - Highways: $563,000 ($19.11)
Miscellaneous - Donations From Private Sources: $2,372,000 ($80.52)
General Revenue - Other: $2,323,000 ($78.86)Sale of Property: $183,000 ($6.21)Rents: $105,000 ($3.56)Interest Earnings: $84,000 ($2.85)Fines and Forfeits: $36,000 ($1.22)State Intergovernmental - Other: $5,023,000 ($170.51)
Highways: $2,409,000 ($81.78)General Local Government Support: $586,000 ($19.89)Tax - Property: $16,288,000 ($552.92)
Other License: $658,000 ($22.34)Public Utilities Sales: $399,000 ($13.54)Occupation and Business License - Other: $46,000 ($1.56)Other Selective Sales: $5,000 ($0.17)
Hobart government finances - Debt in 2021 (per resident):
Long Term Debt - Beginning Outstanding - Unspecified Public Purpose: $28,529,000 ($968.46)
Outstanding Unspecified Public Purpose: $28,529,000 ($968.46)
Hobart government finances - Cash and Securities in 2021 (per resident):
Bond Funds - Cash and Securities: $11,267,000 ($382.48)
Other Funds - Cash and Securities: $14,432,000 ($489.92)
Sinking Funds - Cash and Securities: $2,311,000 ($78.45)
5.29% of this county's 2021 resident taxpayers lived in other counties in 2020 ($54,961 average adjusted gross income )
Here:
5.29%Indiana average:
6.66%
0.01% of residents moved from foreign countries ($91 average AGI )Lake County:
0.01%Indiana average:
0.00%
Top counties from which taxpayers relocated into this county between 2020 and 2021:
Businesses in Hobart, IN
Name Count Name Count
Advance Auto Parts 1 Long John Silver's 1 Arby's 2 McDonald's 3 AutoZone 1 Men's Wearhouse 1 Baskin-Robbins 1 Pac Sun 1 Burger King 1 Payless 1 Burlington Coat Factory 1 Penske 1 CVS 1 Pizza Hut 1 Comfort Inn 1 RadioShack 1 Cricket Wireless 2 Sprint Nextel 1 Dairy Queen 1 Subway 3 Dunkin Donuts 1 T-Mobile 1 Fashion Bug 1 Taco Bell 2 FedEx 1 True Value 1 Ford 1 U-Haul 2 GNC 1 UPS 6 H&R Block 1 Walgreens 2 Jimmy John's 1 Wendy's 1 KFC 3 White Castle 1 Little Caesars Pizza 1 YMCA 1
Strongest AM radio stations in Hobart:
WNDZ (750 AM; daytime; 5 kW; PORTAGE, IN; Owner: ENTRAVISION HOLDINGS, LLC)
WIND (560 AM; 5 kW; CHICAGO, IL; Owner: TICHENOR LICENSE CORPORATION ("TLC"))
WLS (890 AM; 50 kW; CHICAGO, IL; Owner: WLS, INC.)
WLTH (1370 AM; 1 kW; GARY, IN; Owner: WLTH RADIO, INC.)
WVIV (1200 AM; 20 kW; CHICAGO, IL; Owner: WLXX-AM LICENSE CORP.)
WYLL (1160 AM; 50 kW; CHICAGO, IL; Owner: SCA LICENSE CORPORATION)
WSCR (670 AM; 50 kW; CHICAGO, IL; Owner: INFINITY BROADCASTING OPERATIONS, INC.)
WMVP (1000 AM; 50 kW; CHICAGO, IL; Owner: ABC, INC.)
WWCA (1270 AM; 1 kW; GARY, IN; Owner: METRO COMMUNICATIONS, INC.)
WGN (720 AM; 50 kW; CHICAGO, IL; Owner: WGN CONTINENTAL BROADCASTING CO.)
WBBM (780 AM; 50 kW; CHICAGO, IL; Owner: INFINITY BROADCASTING OPERATIONS, INC.)
WNTD (950 AM; 5 kW; CHICAGO, IL; Owner: RADIO UNICA OF CHICAGO LICENSE CORP.)
WTMJ (620 AM; 50 kW; MILWAUKEE, WI; Owner: JOURNAL BROADCAST CORPORATION)
Strongest FM radio stations in Hobart:
WLJE (105.5 FM; VALPARAISO, IN; Owner: PORTER COUNTY BROADCASTING CORP.)
WCKG (105.9 FM; ELMWOOD PARK, IL; Owner: INFINITY HOLDINGS CORPORATION OF ORLANDO)
WLIT-FM (93.9 FM; CHICAGO, IL; Owner: AMFM RADIO LICENSES, L.L.C.)
WJMK (104.3 FM; CHICAGO, IL; Owner: INFINITY BROADCASTING CORP. OF ILLINOIS)
WNUA (95.5 FM; CHICAGO, IL; Owner: AMFM RADIO LICENSES, L.L.C.)
WTMX (101.9 FM; SKOKIE, IL; Owner: BONNEVILLE HOLDING COMPANY)
WBBM-FM (96.3 FM; CHICAGO, IL; Owner: INFINITY BROADCASTING OPERATIONS, INC.)
WKSC-FM (103.5 FM; CHICAGO, IL; Owner: AMFM RADIO LICENSES, L.L.C.)
WFMT (98.7 FM; CHICAGO, IL; Owner: WINDOW TO THE WORLD COMMUNICATIONS)
WZZN (94.7 FM; CHICAGO, IL; Owner: ABC CHICAGO FM RADIO,INC.)
WGCI-FM (107.5 FM; CHICAGO, IL; Owner: AMFM RADIO LICENSES, L.L.C.)
WZVN (107.1 FM; LOWELL, IN; Owner: M & M BROADCASTING, INC.)
WBEZ (91.5 FM; CHICAGO, IL; Owner: THE WBEZ ALLIANCE, INC.)
WKQX (101.1 FM; CHICAGO, IL; Owner: EMMIS RADIO LICENSE CORPORATION)
WLUP-FM (97.9 FM; CHICAGO, IL; Owner: BONNEVILLE HOLDING COMPANY)
WNND (100.3 FM; CHICAGO, IL; Owner: BONNEVILLE HOLDING COMPANY)
WOJO (105.1 FM; EVANSTON, IL; Owner: TICHENOR LICENSE CORPORATION ("TLC"))
WUSN (99.5 FM; CHICAGO, IL; Owner: INFINITY BROADCASTING CORPORATION OF CHICAGO)
WVAZ (102.7 FM; OAK PARK, IL; Owner: AMFM RADIO LICENSES, L.L.C.)
WDRV (97.1 FM; CHICAGO, IL; Owner: BONNEVILLE HOLDING COMPANY)
TV broadcast stations around Hobart:
WYIN (Channel 56; GARY, IN; Owner: NORTHWEST INDIANA PUBLIC BROADCASTING, INC.)
WLS-TV (Channel 7; CHICAGO, IL; Owner: WLS TELEVISION, INC.)
WMAQ-TV (Channel 5; CHICAGO, IL; Owner: NBC SUBSIDIARY (WMAQ-TV), INC.)
WTTW (Channel 11; CHICAGO, IL; Owner: WINDOW TO THE WORLD COMMUNICATIONS, INC.)
WGN-TV (Channel 9; CHICAGO, IL; Owner: WGN CONTINENTAL BROADCASTING COMPANY)
WGBO-TV (Channel 66; JOLIET, IL; Owner: WGBO LICENSE PARTNERSHIP, G.P.)
WBBM-TV (Channel 2; CHICAGO, IL; Owner: CBS BROADCASTING INC.)
WPWR-TV (Channel 50; GARY, IN; Owner: FOX TELEVISION STATIONS, INC.)
WXFT (Channel 60; AURORA, IL; Owner: TELEFUTURA CHICAGO LLC)
WCPX (Channel 38; CHICAGO, IL; Owner: PAXSON CHICAGO LICENSE, INC.)
WCIU-TV (Channel 26; CHICAGO, IL; Owner: WCIU-TV LIMITED PARTNERSHIP)
WFLD (Channel 32; CHICAGO, IL; Owner: FOX TELEVISION STATIONS, INC.)
W68DO (Channel 68; PALATINE, IL; Owner: TRINITY BROADCASTING NETWORK)
WFBT-CA (Channel 23; CHICAGO, IL; Owner: CHANNEL 23 LIMITED PARTNERSHIP)
WSNS-TV (Channel 44; CHICAGO, IL; Owner: TELEMUNDO OF CHICAGO, INC.)
WJYS (Channel 62; HAMMOND, IN; Owner: JOVON BROADCASTING CORPORATION)
W18AT (Channel 18; GARY, IN; Owner: LESEA BROADCASTING CORPORATION)
W24AW (Channel 24; VALPARAISO, IN; Owner: LESEA BROADCASTING CORPORATION)
W54BK (Channel 54; CHESTERTON, IN; Owner: LESEA BROADCASTING CORPORATION)
WOCH-LP (Channel 28; CHICAGO, IL; Owner: KM LPTV OF CHICAGO-28, L.L.C.)
WYCC (Channel 20; CHICAGO, IL; Owner: COLLEGE DIST. #508, COUNTY OF COOK)
WOCK-CA (Channel 13; CHICAGO, IL; Owner: KM LPTV OF CHICAGO-13, L.L.C.)
W04CQ (Channel 4; CHESTERTON, IN; Owner: AQUA-LAND COMMUNICATIONS, INC.)
W34CK (Channel 34; ARLINGTON HEIGHTS, IL; Owner: FIRST UNITED, INC.)
W13BQ (Channel 13; PORTAGE, IN; Owner: STUDIO 5, INC.)
National Bridge Inventory (NBI) Statistics 18 Number of bridges167ft / 51.0m Total length $2,796,000 Total costs159,712 Total average daily traffic10,795 Total average daily truck traffic214,201 Total future (year 2028) average daily traffic
New bridges - historical statistics
1 1930-1939 3 1960-1969 1 1970-1979 2 1980-1989 5 1990-1999 3 2000-2009 2 2010-2019 1 2020-2022
See full National Bridge Inventory statistics for Hobart, IN
Home Mortgage Disclosure Act Aggregated Statistics For Year 2009(Based on 4 full and 2 partial tracts) A) FHA, FSA/RHS & VA B) Conventional C) Refinancings D) Home Improvement Loans E) Loans on Dwellings For 5+ Families F) Non-occupant Loans on G) Loans On Manufactured Number Average Value Number Average Value Number Average Value Number Average Value Number Average Value Number Average Value Number Average Value
LOANS ORIGINATED 190 $120,324 89 $106,343 670 $121,131 35 $41,207 5 $576,000 28 $87,460 2 $125,330 APPLICATIONS APPROVED, NOT ACCEPTED 7 $106,703 14 $76,679 59 $121,198 7 $29,663 0 $0 5 $72,218 1 $19,700 APPLICATIONS DENIED 29 $130,729 10 $93,330 280 $133,666 25 $47,396 1 $265,000 9 $76,720 3 $99,637 APPLICATIONS WITHDRAWN 10 $123,799 8 $105,709 153 $135,714 7 $44,653 0 $0 3 $120,383 1 $125,940 FILES CLOSED FOR INCOMPLETENESS 1 $131,070 4 $95,600 51 $144,297 3 $70,167 0 $0 3 $75,333 1 $120,000
Aggregated Statistics For Year 2008(Based on 4 full and 2 partial tracts) A) FHA, FSA/RHS & VA B) Conventional C) Refinancings D) Home Improvement Loans E) Loans on Dwellings For 5+ Families F) Non-occupant Loans on G) Loans On Manufactured Number Average Value Number Average Value Number Average Value Number Average Value Number Average Value Number Average Value Number Average Value
LOANS ORIGINATED 204 $127,989 146 $114,735 452 $119,344 50 $53,001 2 $192,500 45 $93,593 6 $101,528 APPLICATIONS APPROVED, NOT ACCEPTED 8 $140,678 12 $114,729 60 $118,126 8 $26,356 0 $0 4 $107,230 1 $37,250 APPLICATIONS DENIED 30 $129,402 37 $115,286 307 $131,772 81 $43,561 0 $0 13 $104,261 11 $44,339 APPLICATIONS WITHDRAWN 14 $130,864 14 $107,026 112 $136,654 7 $87,621 0 $0 9 $103,406 0 $0 FILES CLOSED FOR INCOMPLETENESS 4 $159,480 6 $84,688 24 $113,281 4 $68,912 0 $0 3 $85,850 0 $0
Aggregated Statistics For Year 2007(Based on 4 full and 2 partial tracts) A) FHA, FSA/RHS & VA B) Conventional C) Refinancings D) Home Improvement Loans E) Loans on Dwellings For 5+ Families F) Non-occupant Loans on G) Loans On Manufactured Number Average Value Number Average Value Number Average Value Number Average Value Number Average Value Number Average Value Number Average Value
LOANS ORIGINATED 105 $126,920 450 $110,816 477 $109,993 88 $51,388 4 $2,578,692 71 $90,820 7 $64,023 APPLICATIONS APPROVED, NOT ACCEPTED 2 $193,420 62 $105,589 82 $116,749 13 $30,271 0 $0 13 $70,659 2 $88,605 APPLICATIONS DENIED 23 $121,432 105 $112,767 375 $114,819 90 $39,695 1 $1,970 37 $88,067 8 $48,808 APPLICATIONS WITHDRAWN 4 $120,090 51 $101,708 140 $124,144 10 $94,927 0 $0 15 $88,781 1 $100,000 FILES CLOSED FOR INCOMPLETENESS 1 $74,110 6 $106,582 36 $113,506 3 $90,700 0 $0 1 $116,000 0 $0
Aggregated Statistics For Year 2006(Based on 4 full and 2 partial tracts) A) FHA, FSA/RHS & VA B) Conventional C) Refinancings D) Home Improvement Loans E) Loans on Dwellings For 5+ Families F) Non-occupant Loans on G) Loans On Manufactured Number Average Value Number Average Value Number Average Value Number Average Value Number Average Value Number Average Value Number Average Value
LOANS ORIGINATED 106 $127,573 669 $98,917 481 $107,891 79 $50,448 2 $6,748,785 97 $79,434 9 $96,347 APPLICATIONS APPROVED, NOT ACCEPTED 4 $113,040 67 $103,253 109 $109,400 15 $43,748 0 $0 15 $73,402 1 $13,010 APPLICATIONS DENIED 12 $164,802 131 $93,748 460 $109,257 77 $46,978 0 $0 39 $90,614 6 $25,302 APPLICATIONS WITHDRAWN 7 $107,214 63 $101,645 272 $116,684 7 $48,071 0 $0 13 $79,292 1 $103,430 FILES CLOSED FOR INCOMPLETENESS 1 $122,000 13 $115,168 71 $121,379 2 $112,495 0 $0 2 $85,500 0 $0
Aggregated Statistics For Year 2005(Based on 4 full and 2 partial tracts) A) FHA, FSA/RHS & VA B) Conventional C) Refinancings D) Home Improvement Loans E) Loans on Dwellings For 5+ Families F) Non-occupant Loans on G) Loans On Manufactured Number Average Value Number Average Value Number Average Value Number Average Value Number Average Value Number Average Value Number Average Value
LOANS ORIGINATED 115 $118,881 602 $98,325 608 $94,062 73 $38,050 1 $672,760 95 $86,147 5 $69,552 APPLICATIONS APPROVED, NOT ACCEPTED 6 $126,795 51 $102,200 95 $108,197 10 $45,816 0 $0 11 $93,497 1 $36,000 APPLICATIONS DENIED 14 $139,336 158 $92,253 517 $105,060 91 $34,151 0 $0 31 $84,091 6 $53,613 APPLICATIONS WITHDRAWN 12 $110,675 84 $89,737 322 $111,324 34 $90,921 0 $0 25 $84,784 3 $38,143 FILES CLOSED FOR INCOMPLETENESS 2 $93,795 31 $81,762 65 $110,654 5 $56,688 0 $0 4 $90,855 0 $0
Aggregated Statistics For Year 2004(Based on 4 full and 2 partial tracts) A) FHA, FSA/RHS & VA B) Conventional C) Refinancings D) Home Improvement Loans E) Loans on Dwellings For 5+ Families F) Non-occupant Loans on G) Loans On Manufactured Number Average Value Number Average Value Number Average Value Number Average Value Number Average Value Number Average Value Number Average Value
LOANS ORIGINATED 159 $112,396 485 $107,105 592 $96,136 89 $33,343 2 $500,335 57 $72,935 3 $111,120 APPLICATIONS APPROVED, NOT ACCEPTED 5 $162,638 65 $99,687 118 $94,265 13 $23,698 0 $0 7 $74,486 2 $69,180 APPLICATIONS DENIED 9 $114,902 86 $102,313 399 $98,797 104 $25,525 0 $0 34 $90,003 8 $59,851 APPLICATIONS WITHDRAWN 8 $99,898 58 $99,795 260 $102,634 20 $46,660 1 $98,000 12 $60,238 2 $158,380 FILES CLOSED FOR INCOMPLETENESS 3 $106,970 25 $99,875 104 $105,027 9 $39,124 0 $0 10 $77,728 0 $0
Aggregated Statistics For Year 2003(Based on 4 full and 2 partial tracts) A) FHA, FSA/RHS & VA B) Conventional C) Refinancings D) Home Improvement Loans E) Loans on Dwellings For 5+ Families F) Non-occupant Loans on Number Average Value Number Average Value Number Average Value Number Average Value Number Average Value Number Average Value
LOANS ORIGINATED 164 $108,687 428 $105,642 1,309 $91,421 80 $42,148 1 $4,629,020 86 $78,712 APPLICATIONS APPROVED, NOT ACCEPTED 8 $112,665 32 $102,265 156 $92,677 9 $27,140 1 $775,000 10 $54,140 APPLICATIONS DENIED 11 $110,697 60 $104,252 490 $87,376 63 $15,937 0 $0 28 $64,923 APPLICATIONS WITHDRAWN 7 $86,926 38 $103,091 348 $94,204 10 $42,732 0 $0 17 $85,884 FILES CLOSED FOR INCOMPLETENESS 3 $92,287 6 $128,017 48 $90,348 6 $41,715 0 $0 3 $66,313
Aggregated Statistics For Year 2002(Based on 4 full and 2 partial tracts) A) FHA, FSA/RHS & VA B) Conventional C) Refinancings D) Home Improvement Loans E) Loans on Dwellings For 5+ Families F) Non-occupant Loans on Number Average Value Number Average Value Number Average Value Number Average Value Number Average Value Number Average Value
LOANS ORIGINATED 164 $98,283 387 $97,613 934 $89,666 64 $20,382 1 $360,000 68 $63,581 APPLICATIONS APPROVED, NOT ACCEPTED 5 $80,360 30 $86,775 130 $91,814 12 $18,155 0 $0 5 $53,186 APPLICATIONS DENIED 11 $90,047 70 $53,340 361 $84,067 65 $19,520 0 $0 7 $82,729 APPLICATIONS WITHDRAWN 20 $86,518 42 $99,676 237 $94,579 13 $23,168 0 $0 8 $68,336 FILES CLOSED FOR INCOMPLETENESS 1 $94,890 7 $88,219 58 $90,513 2 $50,000 0 $0 7 $78,754
Aggregated Statistics For Year 2001(Based on 4 full and 2 partial tracts) A) FHA, FSA/RHS & VA B) Conventional C) Refinancings D) Home Improvement Loans E) Loans on Dwellings For 5+ Families F) Non-occupant Loans on Number Average Value Number Average Value Number Average Value Number Average Value Number Average Value Number Average Value
LOANS ORIGINATED 152 $93,763 356 $97,216 803 $80,855 90 $16,978 2 $126,150 63 $57,112 APPLICATIONS APPROVED, NOT ACCEPTED 6 $92,250 23 $91,603 149 $74,687 14 $17,024 0 $0 9 $73,623 APPLICATIONS DENIED 12 $101,642 71 $66,096 419 $73,951 80 $33,436 0 $0 10 $44,853 APPLICATIONS WITHDRAWN 15 $96,465 30 $87,937 243 $81,896 13 $25,970 0 $0 5 $76,674 FILES CLOSED FOR INCOMPLETENESS 3 $127,370 4 $100,870 62 $90,330 3 $34,000 0 $0 2 $44,000
Aggregated Statistics For Year 2000(Based on 4 full and 2 partial tracts) A) FHA, FSA/RHS & VA B) Conventional C) Refinancings D) Home Improvement Loans E) Loans on Dwellings For 5+ Families F) Non-occupant Loans on Number Average Value Number Average Value Number Average Value Number Average Value Number Average Value Number Average Value
LOANS ORIGINATED 162 $91,438 292 $91,377 329 $59,113 95 $18,331 1 $342,680 46 $59,237 APPLICATIONS APPROVED, NOT ACCEPTED 7 $103,897 23 $106,555 103 $63,890 27 $33,581 0 $0 4 $54,032 APPLICATIONS DENIED 17 $84,525 93 $55,485 237 $64,035 83 $20,195 0 $0 19 $28,811 APPLICATIONS WITHDRAWN 11 $90,623 30 $88,086 104 $69,433 13 $49,232 0 $0 2 $72,195 FILES CLOSED FOR INCOMPLETENESS 1 $91,610 10 $71,959 20 $59,675 0 $0 0 $0 2 $59,155
Aggregated Statistics For Year 1999(Based on 4 full and 2 partial tracts) A) FHA, FSA/RHS & VA B) Conventional C) Refinancings D) Home Improvement Loans E) Loans on Dwellings For 5+ Families F) Non-occupant Loans on Number Average Value Number Average Value Number Average Value Number Average Value Number Average Value Number Average Value
LOANS ORIGINATED 155 $88,468 331 $86,956 537 $64,264 139 $15,028 2 $139,440 53 $64,200 APPLICATIONS APPROVED, NOT ACCEPTED 1 $78,400 32 $83,382 129 $60,455 23 $20,365 0 $0 9 $48,042 APPLICATIONS DENIED 19 $86,812 79 $55,080 228 $63,309 84 $13,242 0 $0 13 $31,362 APPLICATIONS WITHDRAWN 13 $97,126 36 $92,178 179 $71,208 35 $48,782 0 $0 8 $72,994 FILES CLOSED FOR INCOMPLETENESS 5 $71,700 4 $158,840 28 $76,664 0 $0 0 $0 4 $57,730
Detailed HMDA statistics for the following Tracts:
0418.00
, 0419.00 , 0420.00 , 0421.00 , 0422.00 , 0423.00
Private Mortgage Insurance Companies Aggregated Statistics For Year 2009(Based on 4 full and 2 partial tracts) A) Conventional B) Refinancings Number Average Value Number Average Value
LOANS ORIGINATED 18 $123,268 29 $144,079 APPLICATIONS APPROVED, NOT ACCEPTED 9 $107,700 4 $113,295 APPLICATIONS DENIED 2 $190,305 3 $142,000 APPLICATIONS WITHDRAWN 3 $185,000 2 $125,000 FILES CLOSED FOR INCOMPLETENESS 0 $0 0 $0
Aggregated Statistics For Year 2008(Based on 4 full and 2 partial tracts) A) Conventional B) Refinancings C) Non-occupant Loans on Number Average Value Number Average Value Number Average Value
LOANS ORIGINATED 83 $128,577 50 $142,252 10 $85,501 APPLICATIONS APPROVED, NOT ACCEPTED 25 $135,078 35 $146,989 2 $100,485 APPLICATIONS DENIED 11 $119,070 7 $135,400 8 $108,085 APPLICATIONS WITHDRAWN 9 $128,546 4 $134,730 0 $0 FILES CLOSED FOR INCOMPLETENESS 4 $112,320 1 $163,050 2 $105,860
Aggregated Statistics For Year 2007(Based on 4 full and 2 partial tracts) A) Conventional B) Refinancings C) Non-occupant Loans on D) Loans On Manufactured Number Average Value Number Average Value Number Average Value Number Average Value
LOANS ORIGINATED 255 $123,410 81 $132,027 16 $88,889 2 $117,025 APPLICATIONS APPROVED, NOT ACCEPTED 21 $127,574 17 $127,020 2 $85,945 1 $102,000 APPLICATIONS DENIED 4 $137,688 3 $165,260 0 $0 0 $0 APPLICATIONS WITHDRAWN 9 $135,108 5 $161,284 0 $0 0 $0 FILES CLOSED FOR INCOMPLETENESS 0 $0 0 $0 0 $0 0 $0
Aggregated Statistics For Year 2006(Based on 4 full and 2 partial tracts) A) Conventional B) Refinancings C) Non-occupant Loans on Number Average Value Number Average Value Number Average Value
LOANS ORIGINATED 170 $123,155 48 $137,126 11 $75,594 APPLICATIONS APPROVED, NOT ACCEPTED 14 $147,326 17 $134,165 1 $137,390 APPLICATIONS DENIED 0 $0 1 $127,990 0 $0 APPLICATIONS WITHDRAWN 3 $109,380 2 $90,165 2 $77,360 FILES CLOSED FOR INCOMPLETENESS 0 $0 0 $0 0 $0
Aggregated Statistics For Year 2005(Based on 4 full and 2 partial tracts) A) Conventional B) Refinancings C) Non-occupant Loans on D) Loans On Manufactured Number Average Value Number Average Value Number Average Value Number Average Value
LOANS ORIGINATED 127 $125,924 65 $120,346 14 $94,395 1 $81,000 APPLICATIONS APPROVED, NOT ACCEPTED 20 $137,184 13 $131,268 2 $88,545 1 $113,060 APPLICATIONS DENIED 4 $90,140 3 $117,333 1 $68,000 0 $0 APPLICATIONS WITHDRAWN 4 $119,500 3 $124,203 1 $68,000 0 $0 FILES CLOSED FOR INCOMPLETENESS 0 $0 2 $150,520 0 $0 0 $0
Aggregated Statistics For Year 2004(Based on 4 full and 2 partial tracts) A) Conventional B) Refinancings C) Non-occupant Loans on Number Average Value Number Average Value Number Average Value
LOANS ORIGINATED 163 $121,661 73 $115,196 17 $89,155 APPLICATIONS APPROVED, NOT ACCEPTED 16 $160,192 19 $130,408 0 $0 APPLICATIONS DENIED 3 $205,803 0 $0 0 $0 APPLICATIONS WITHDRAWN 5 $128,770 6 $127,605 0 $0 FILES CLOSED FOR INCOMPLETENESS 0 $0 0 $0 0 $0
Aggregated Statistics For Year 2003(Based on 4 full and 2 partial tracts) A) Conventional B) Refinancings C) Non-occupant Loans on Number Average Value Number Average Value Number Average Value
LOANS ORIGINATED 183 $120,900 204 $111,616 18 $76,626 APPLICATIONS APPROVED, NOT ACCEPTED 18 $129,524 45 $117,055 2 $55,500 APPLICATIONS DENIED 0 $0 8 $106,531 0 $0 APPLICATIONS WITHDRAWN 4 $77,675 7 $114,444 0 $0 FILES CLOSED FOR INCOMPLETENESS 0 $0 1 $61,000 1 $61,000
Aggregated Statistics For Year 2002(Based on 4 full and 2 partial tracts) A) Conventional B) Refinancings C) Non-occupant Loans on Number Average Value Number Average Value Number Average Value
LOANS ORIGINATED 185 $112,628 166 $114,114 14 $65,128 APPLICATIONS APPROVED, NOT ACCEPTED 20 $102,186 37 $118,568 5 $67,126 APPLICATIONS DENIED 6 $121,793 3 $108,000 1 $74,000 APPLICATIONS WITHDRAWN 7 $83,770 11 $112,323 2 $68,000 FILES CLOSED FOR INCOMPLETENESS 1 $168,440 1 $93,000 0 $0
Aggregated Statistics For Year 2001(Based on 4 full and 2 partial tracts) A) Conventional B) Refinancings C) Non-occupant Loans on Number Average Value Number Average Value Number Average Value
LOANS ORIGINATED 162 $106,921 103 $106,154 22 $75,030 APPLICATIONS APPROVED, NOT ACCEPTED 11 $91,098 18 $113,829 3 $53,000 APPLICATIONS DENIED 2 $111,015 1 $209,380 0 $0 APPLICATIONS WITHDRAWN 3 $93,080 1 $112,000 0 $0 FILES CLOSED FOR INCOMPLETENESS 0 $0 0 $0 0 $0
Aggregated Statistics For Year 2000(Based on 4 full and 2 partial tracts) A) Conventional B) Refinancings C) Non-occupant Loans on Number Average Value Number Average Value Number Average Value
LOANS ORIGINATED 150 $99,519 15 $87,487 12 $52,222 APPLICATIONS APPROVED, NOT ACCEPTED 20 $101,554 12 $105,923 0 $0 APPLICATIONS DENIED 5 $98,236 1 $140,000 1 $97,370 APPLICATIONS WITHDRAWN 3 $125,857 0 $0 1 $86,000 FILES CLOSED FOR INCOMPLETENESS 1 $140,000 0 $0 0 $0
Aggregated Statistics For Year 1999(Based on 4 full and 2 partial tracts) A) Conventional B) Refinancings C) Non-occupant Loans on Number Average Value Number Average Value Number Average Value
LOANS ORIGINATED 134 $96,605 54 $89,991 4 $68,682 APPLICATIONS APPROVED, NOT ACCEPTED 7 $102,177 14 $101,054 0 $0 APPLICATIONS DENIED 4 $147,422 3 $83,677 0 $0 APPLICATIONS WITHDRAWN 3 $89,750 3 $71,753 0 $0 FILES CLOSED FOR INCOMPLETENESS 1 $88,910 2 $92,495 0 $0
Detailed PMIC statistics for the following Tracts:
0418.00
, 0419.00 , 0420.00 , 0421.00 , 0422.00 , 0423.00 Hobart compared to Indiana state average:
Unemployed percentage below state average. Hispanic race population percentage above state average. Length of stay since moving in significantly above state average.
Top Patent Applicants
Jonathon Marlow (16)
David Postma (3)
Solomon E. Brown (2)
Arnold S. Eroles (2)
Duane David Vanwitzenberg (1)
Jon Neil Ensign (1)
Megan Jones (1)
Floral Ann Roullett (1)
Christopher J. Barbauld (1)
Lyle Edward Hansel (1)
Total of 43 patent applications in 2008-2024.


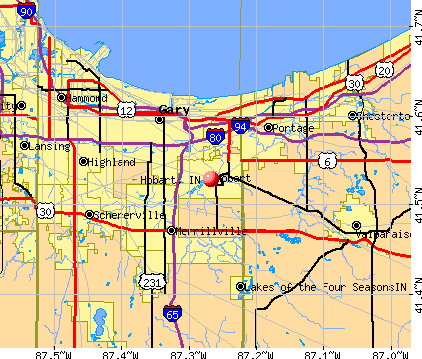


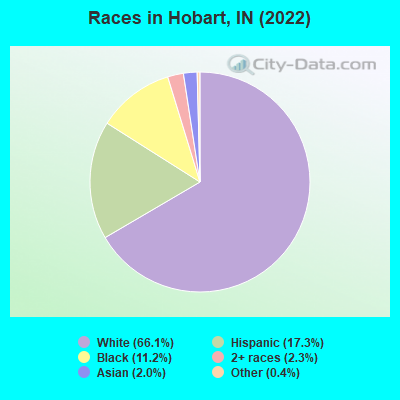
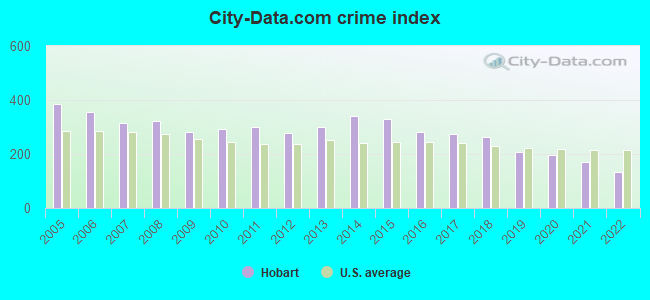
 Recent articles from our blog. Our writers, many of them Ph.D. graduates or candidates, create easy-to-read articles on a wide variety of topics.

 (5.4 miles
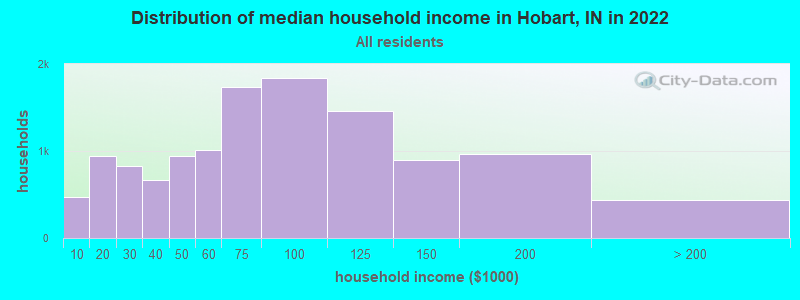
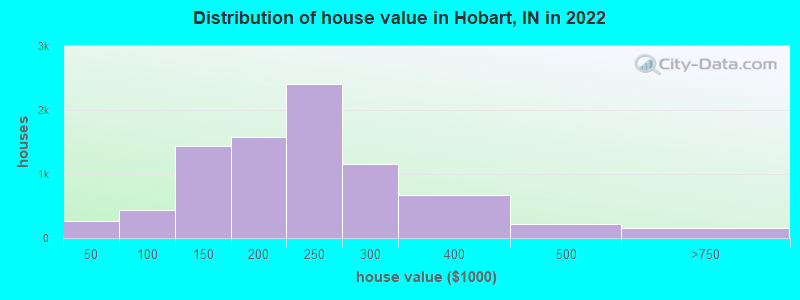

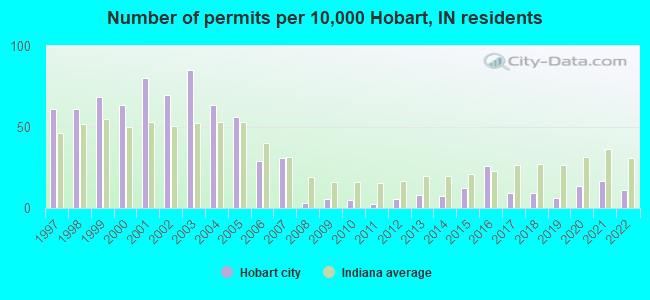
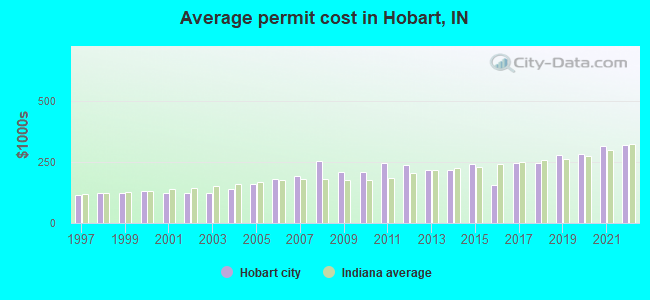
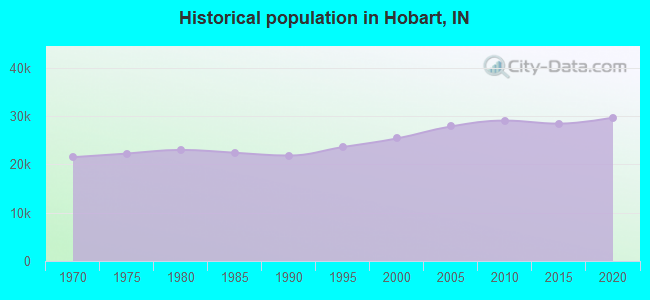
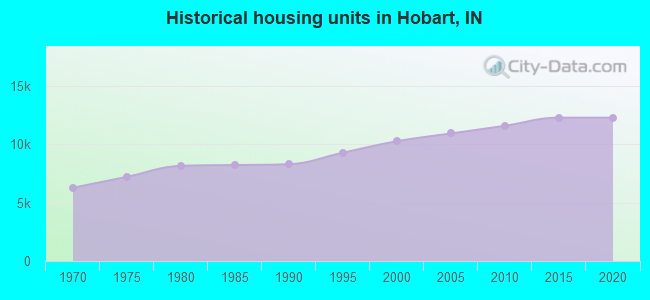
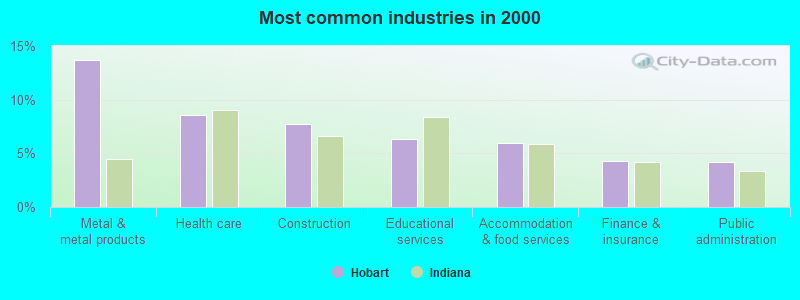
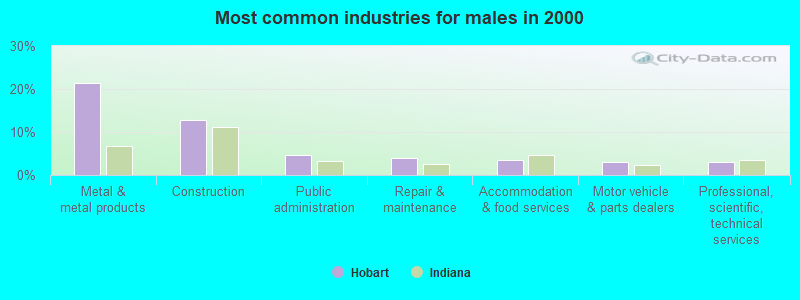
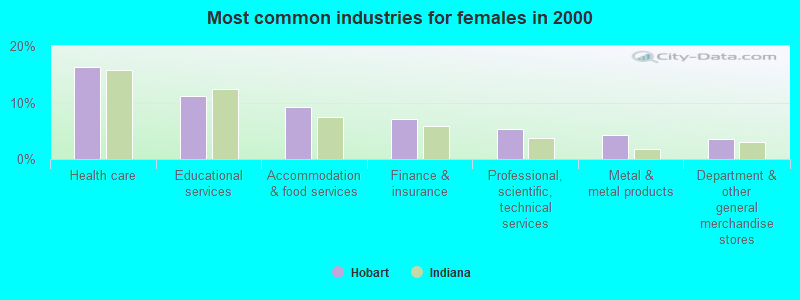
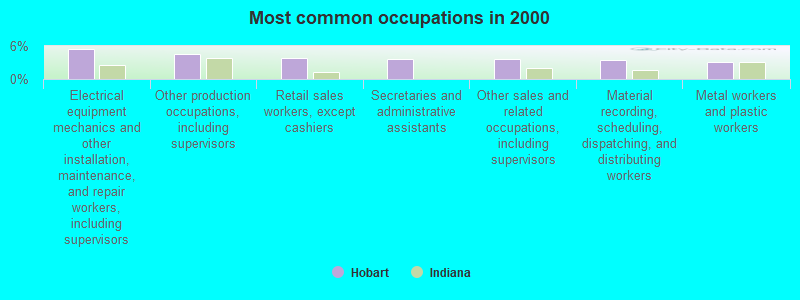
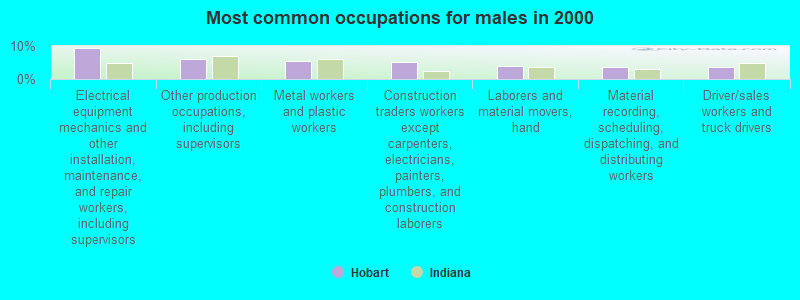
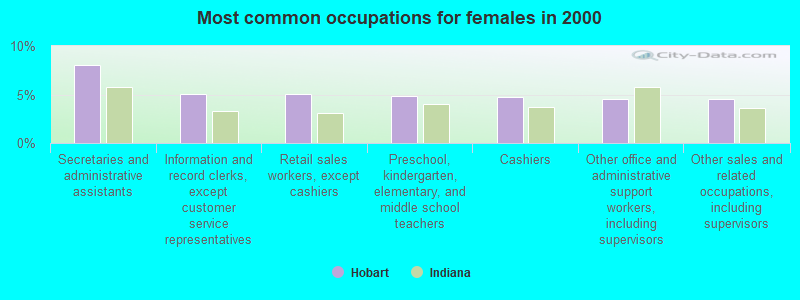
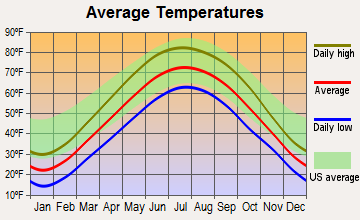
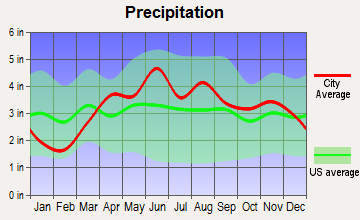
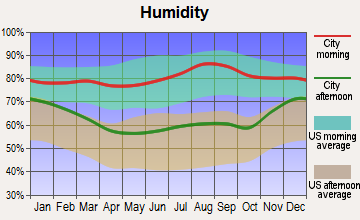
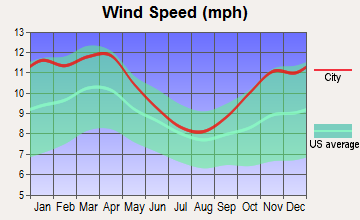
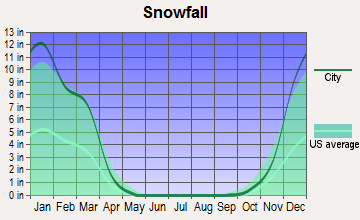
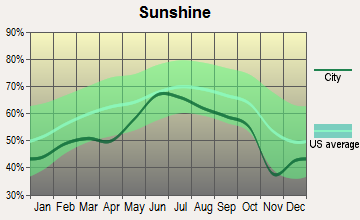
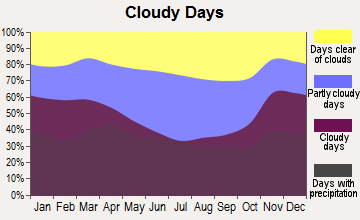
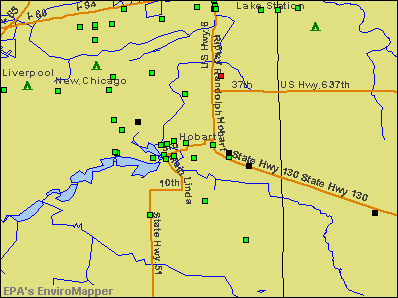

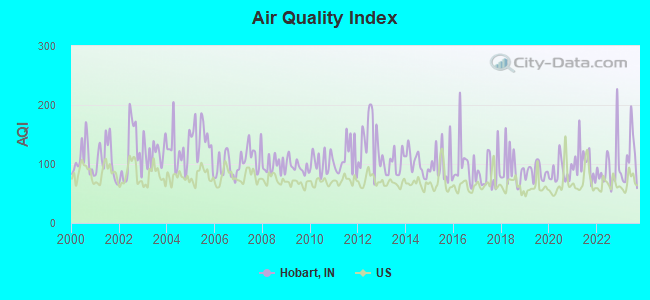
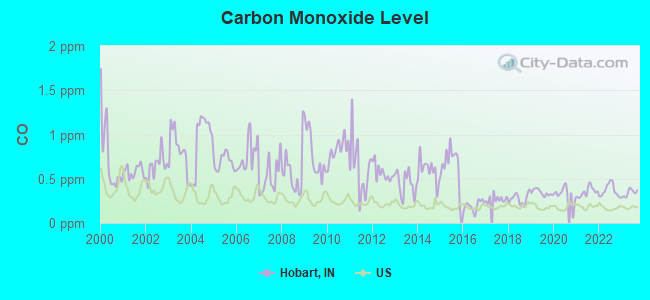
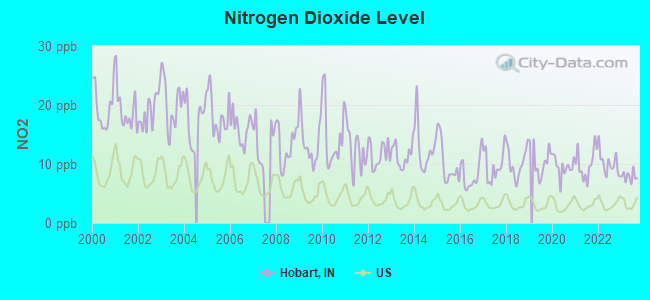
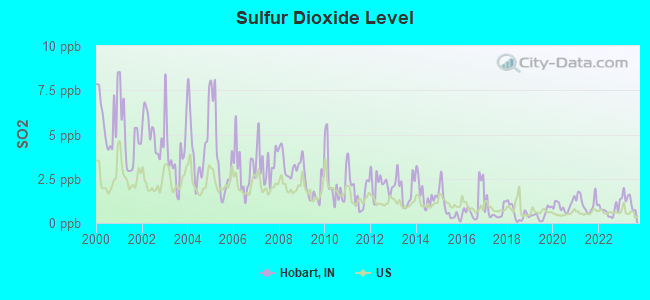
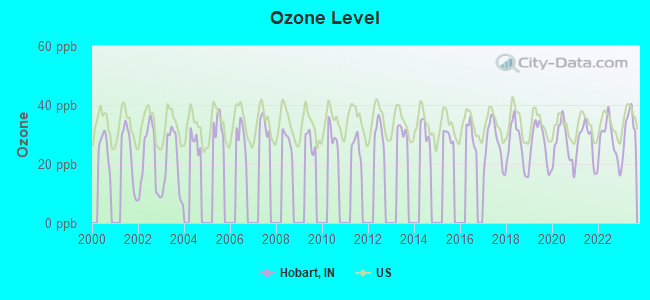
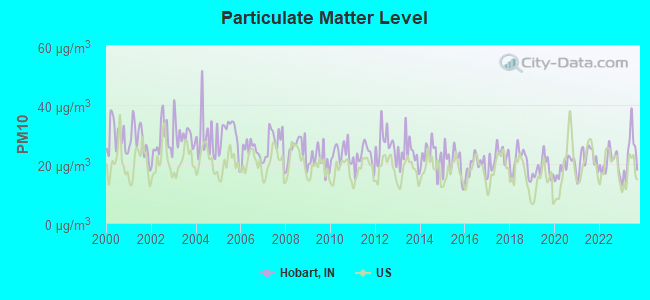
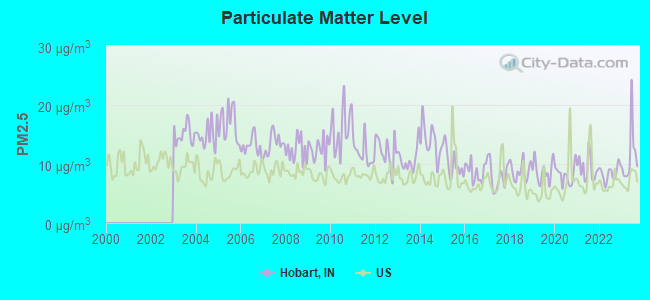
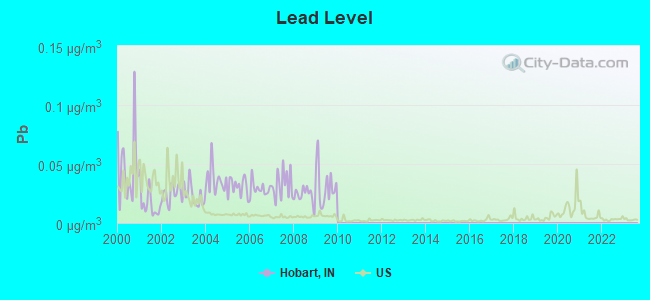

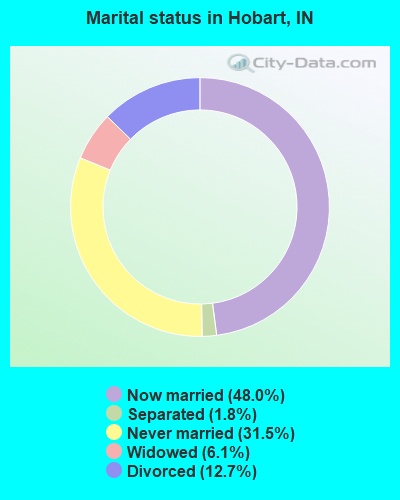
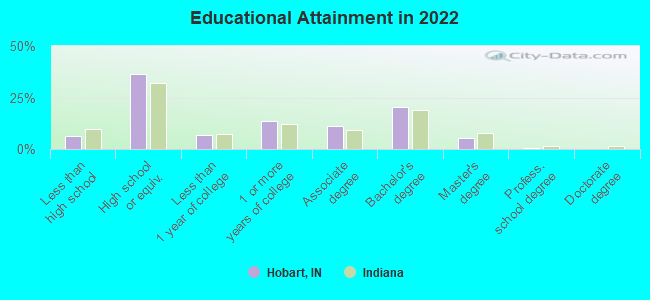
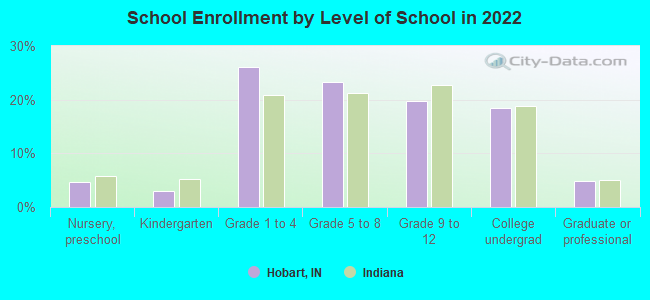
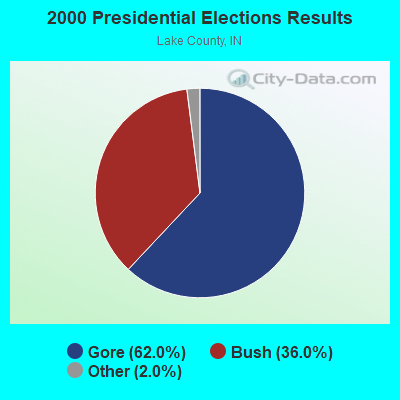
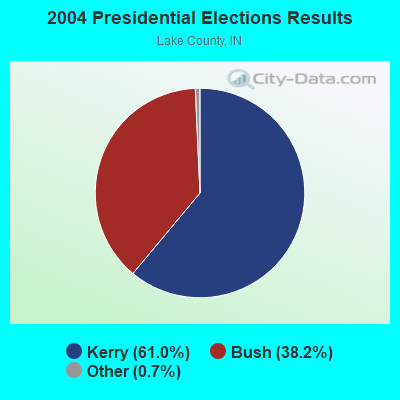
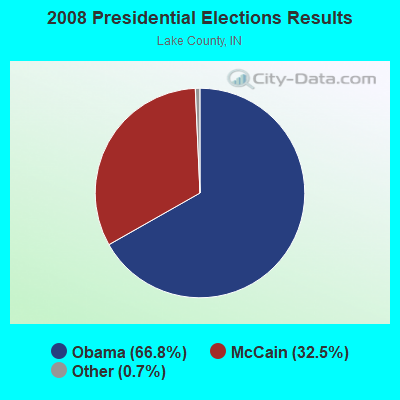
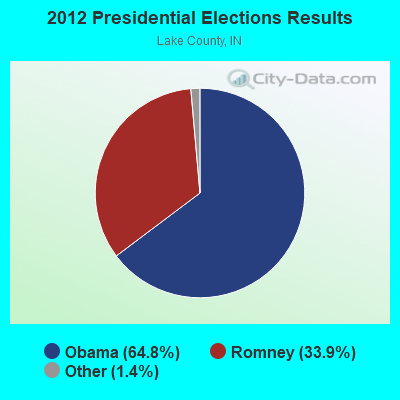
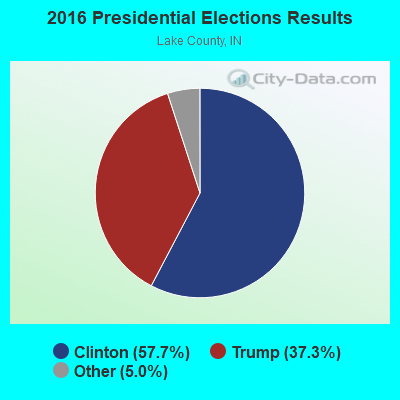
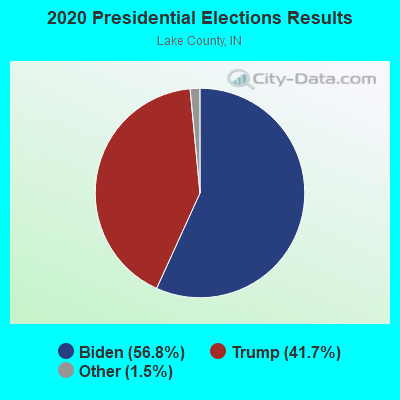
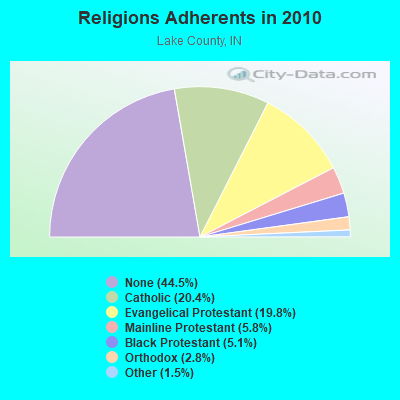
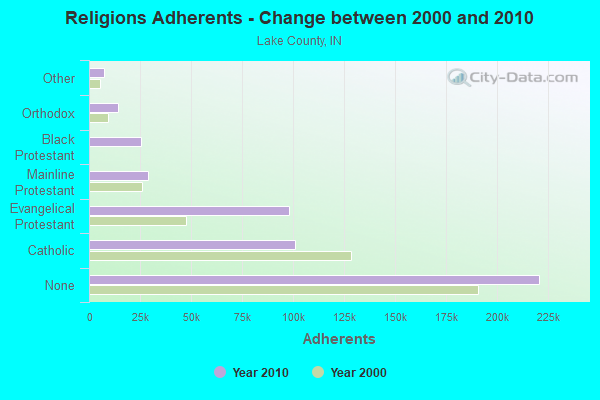
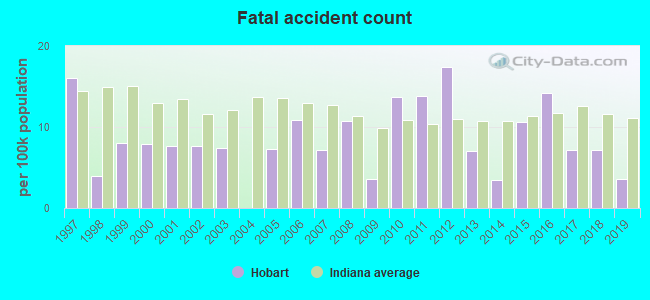
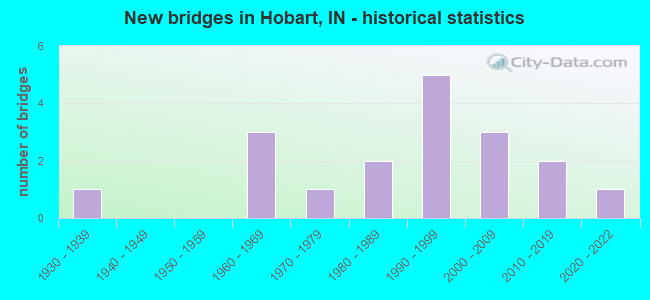
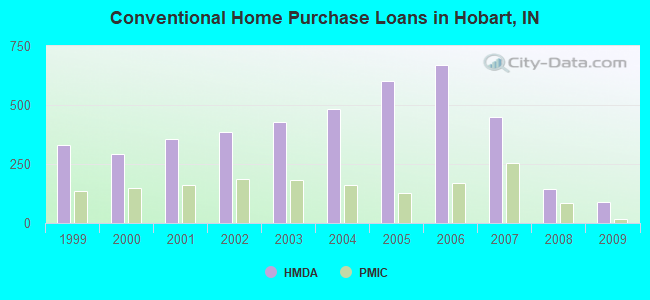
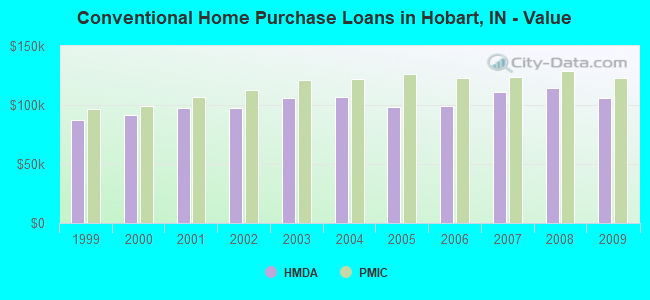
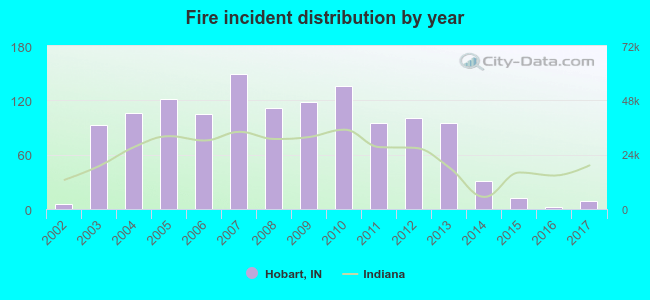 Based on the data from the years 2002 - 2017 the average number of fires per year is 81. The highest number of reported fire incidents - 149 took place in 2007, and the least - 2 in 2016. The data has an increasing trend.
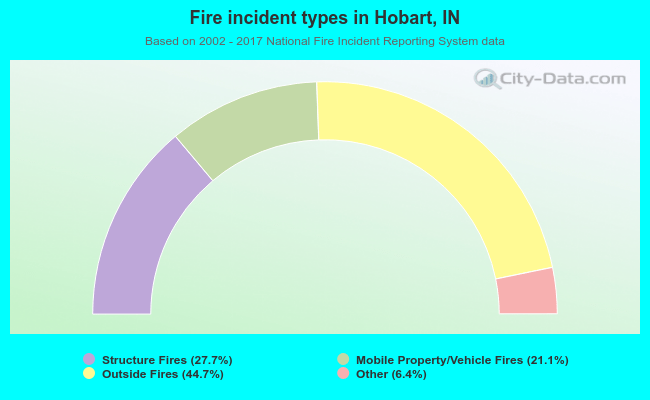 When looking into fire subcategories, the most incidents belonged to: Outside Fires (44.7%), and Structure Fires (27.7%).