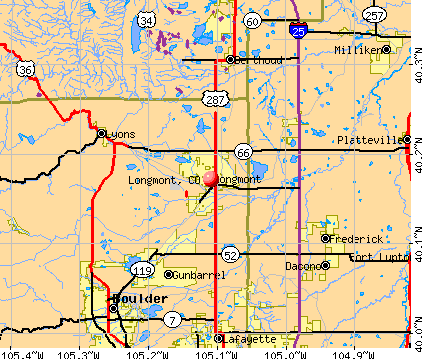
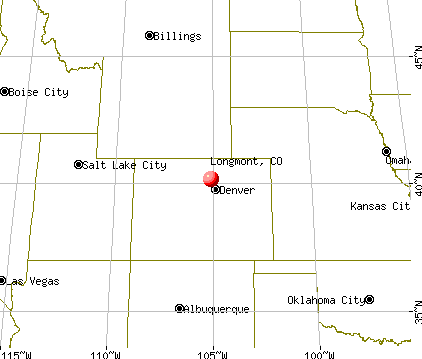
Longmont, Colorado
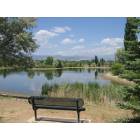
Longmont: Golden Ponds
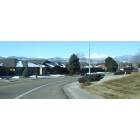
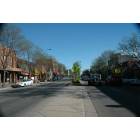
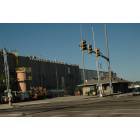
Longmont: Looking west from Mountain View Avenue
Longmont: Looking West Down Mountain View on a Clear Sunny Day in 2004

Longmont
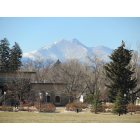
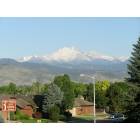
Longmont: View of Longs Peak from Roosevelt Park in downtown Longmont
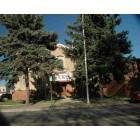
Longmont: Elks Lodge
Longmont: Main Street
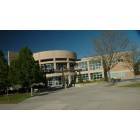
Longmont: Library
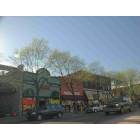
Longmont: Downtown Block

Longmont: Main Street
Longmont: Depot
- see
15
more - add
your
Submit your own pictures of this city and show them to the world
- OSM Map
- General Map
- Google Map
- MSN Map
Population change since 2000: +38.8%
| Males: 48,598 | |
| Females: 50,089 |
| Median resident age: | 41.3 years |
| Colorado median age: | 37.7 years |
Zip codes: 80501.
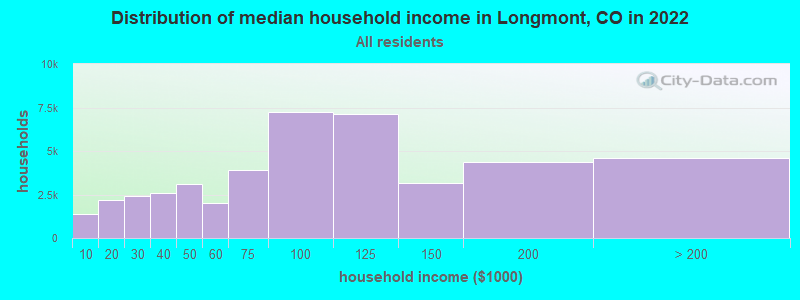
| Longmont: | $89,010 |
| CO: | $89,302 |
Estimated per capita income in 2022: $49,340 (it was $23,409 in 2000)
Longmont city income, earnings, and wages data
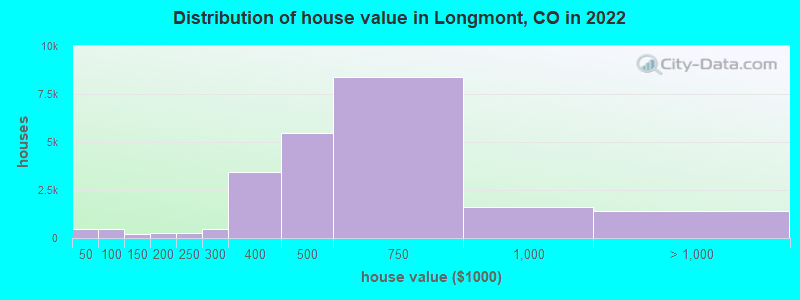
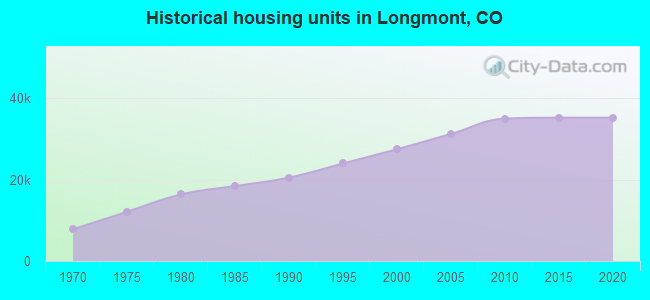
Estimated median house or condo value in 2022: $529,900 (it was $173,800 in 2000)
| Longmont: | $529,900 |
| CO: | $531,100 |
Mean prices in 2022: all housing units: $618,822; detached houses: $666,741; townhouses or other attached units: $436,269; in 2-unit structures: $191,305; in 3-to-4-unit structures: $480,759; in 5-or-more-unit structures: $330,250; mobile homes: $240,726
Median gross rent in 2022: $1,753.
(8.4% for White Non-Hispanic residents, 20.1% for Black residents, 9.0% for Hispanic or Latino residents, 6.2% for American Indian residents, 11.4% for other race residents, 9.2% for two or more races residents)
Detailed information about poverty and poor residents in Longmont, CO


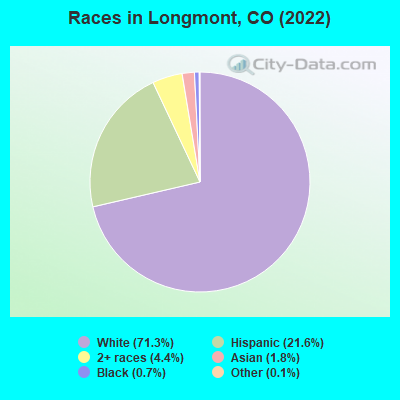
- 71,81171.3%White alone
- 21,70721.6%Hispanic
- 4,4464.4%Two or more races
- 1,7951.8%Asian alone
- 6980.7%Black alone
- 1280.1%Other race alone
- 710.07%American Indian alone
According to our research of Colorado and other state lists, there were 214 registered sex offenders living in Longmont, Colorado as of April 27, 2024.
The ratio of all residents to sex offenders in Longmont is 435 to 1.
The ratio of registered sex offenders to all residents in this city is near the state average.
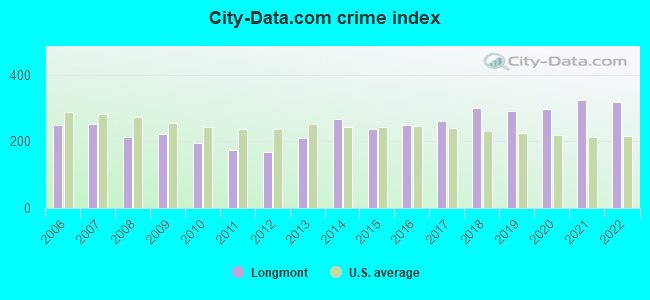
The City-Data.com crime index weighs serious crimes and violent crimes more heavily. Higher means more crime, U.S. average is 246.1. It adjusts for the number of visitors and daily workers commuting into cities.
- means the value is smaller than the state average.- means the value is about the same as the state average.
- means the value is bigger than the state average.
- means the value is much bigger than the state average.
Crime rate in Longmont detailed stats: murders, rapes, robberies, assaults, burglaries, thefts, arson
Full-time law enforcement employees in 2021, including police officers: 220 (149 officers - 120 male; 29 female).
| Officers per 1,000 residents here: | 1.49 |
| Colorado average: | 2.14 |
 Recent articles from our blog. Our writers, many of them Ph.D. graduates or candidates, create easy-to-read articles on a wide variety of topics.

 | Young Professional Moving to the Area-Boulder vs. Louisville vs. Longmont? (2 replies) |
| How Similar is Longmont to Boulder? (15 replies) |
| Commuting to Longmont - where to live? (21 replies) |
| Longmont from Colorado Springs (5 replies) |
| Commute from Longmont to Boulder (5 replies) |
| Louisville/Longmont-area impressions of Fort Collins (15 replies) |
Latest news from Longmont, CO collected exclusively by city-data.com from local newspapers, TV, and radio stations
Ancestries: German (12.0%), English (10.1%), Irish (6.9%), American (6.1%), European (4.8%), Italian (2.6%).
Current Local Time: MST time zone
Incorporated on 11/15/1885
Elevation: 4942 feet
Land area: 21.8 square miles.
Population density: 4,528 people per square mile (average).
9,756 residents are foreign born (5.4% Latin America, 2.0% Asia, 1.7% Europe).
| This city: | 10.0% |
| Colorado: | 9.5% |
Median real estate property taxes paid for housing units with mortgages in 2022: $2,697 (0.5%)
Median real estate property taxes paid for housing units with no mortgage in 2022: $2,656 (0.5%)
Nearest city with pop. 200,000+: West Adams, CO (21.4 miles  , pop. 259,628).
Nearest city with pop. 1,000,000+: Phoenix, AZ (599.4 miles , pop. 1,321,045).
Nearest cities:
)Latitude: 40.17 N, Longitude: 105.11 W
Daytime population change due to commuting: -6,584 (-6.5%)
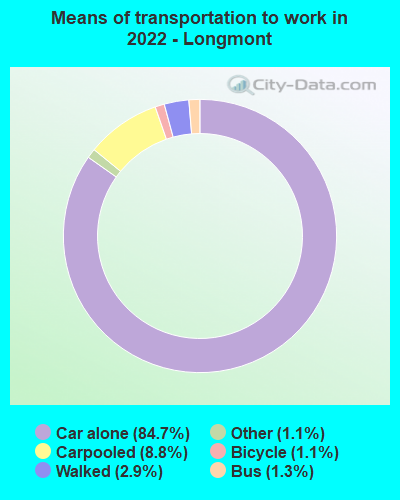
Workers who live and work in this city: 33,655 (59.4%)
Area codes: 303, 720
Longmont, Colorado accommodation & food services, waste management - Economy and Business Data
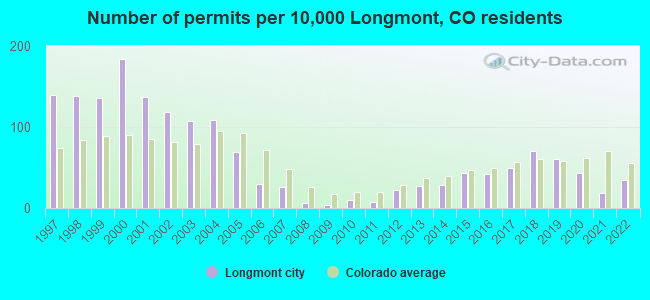
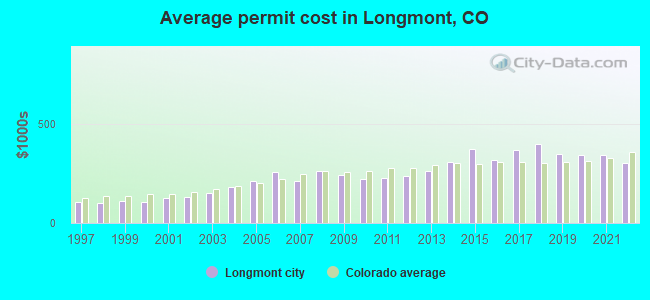
Single-family new house construction building permits:
- 2022: 252 buildings, average cost: $302,400
- 2021: 133 buildings, average cost: $342,000
- 2020: 309 buildings, average cost: $341,100
- 2019: 427 buildings, average cost: $348,400
- 2018: 499 buildings, average cost: $397,700
- 2017: 358 buildings, average cost: $367,600
- 2016: 302 buildings, average cost: $319,300
- 2015: 307 buildings, average cost: $371,000
- 2014: 209 buildings, average cost: $308,500
- 2013: 191 buildings, average cost: $259,800
- 2012: 154 buildings, average cost: $237,600
- 2011: 56 buildings, average cost: $229,400
- 2010: 71 buildings, average cost: $223,100
- 2009: 26 buildings, average cost: $240,100
- 2008: 42 buildings, average cost: $260,400
- 2007: 182 buildings, average cost: $212,900
- 2006: 211 buildings, average cost: $258,700
- 2005: 492 buildings, average cost: $214,000
- 2004: 774 buildings, average cost: $183,200
- 2003: 771 buildings, average cost: $153,200
- 2002: 848 buildings, average cost: $133,300
- 2001: 977 buildings, average cost: $126,600
- 2000: 1310 buildings, average cost: $108,300
- 1999: 970 buildings, average cost: $113,300
- 1998: 984 buildings, average cost: $102,500
- 1997: 986 buildings, average cost: $104,000
| Here: | 3.2% |
| Colorado: | 3.2% |
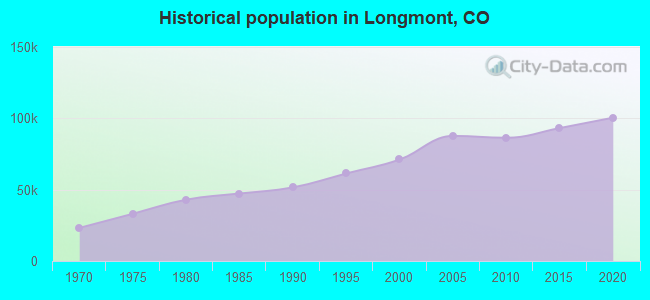
Population change in the 1990s: +18,696 (+35.7%).
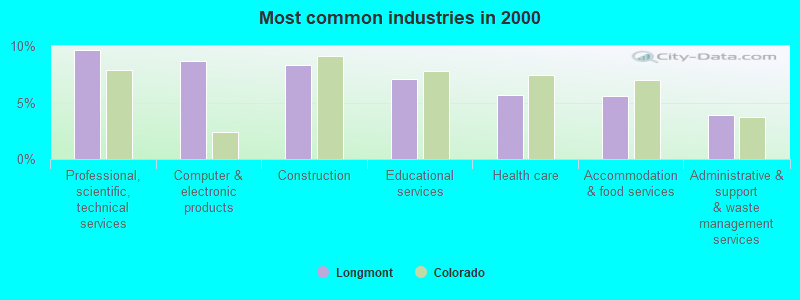
- Professional, scientific, technical services (9.6%)
- Computer & electronic products (8.7%)
- Construction (8.4%)
- Educational services (7.1%)
- Health care (5.7%)
- Accommodation & food services (5.6%)
- Administrative & support & waste management services (3.9%)
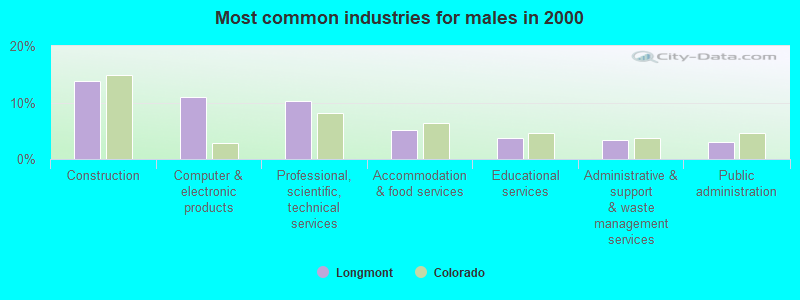
- Construction (13.8%)
- Computer & electronic products (11.0%)
- Professional, scientific, technical services (10.3%)
- Accommodation & food services (5.1%)
- Educational services (3.8%)
- Administrative & support & waste management services (3.4%)
- Public administration (3.0%)
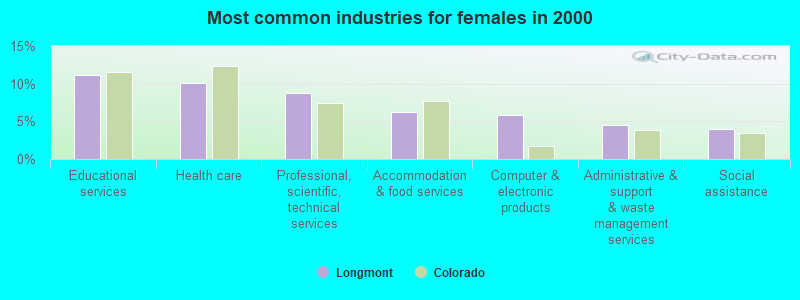
- Educational services (11.1%)
- Health care (10.0%)
- Professional, scientific, technical services (8.8%)
- Accommodation & food services (6.3%)
- Computer & electronic products (5.8%)
- Administrative & support & waste management services (4.5%)
- Social assistance (4.0%)
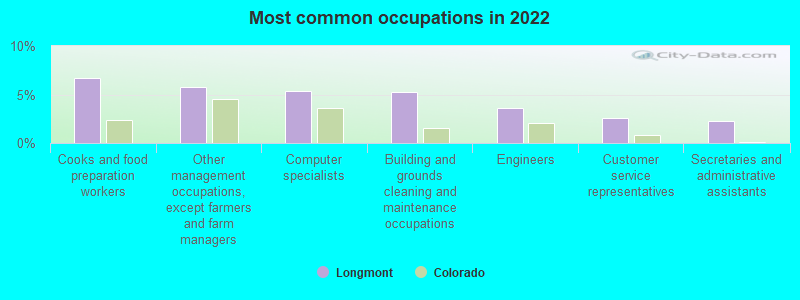
- Cooks and food preparation workers (6.8%)
- Other management occupations, except farmers and farm managers (5.7%)
- Computer specialists (5.4%)
- Building and grounds cleaning and maintenance occupations (5.3%)
- Engineers (3.6%)
- Customer service representatives (2.6%)
- Secretaries and administrative assistants (2.2%)
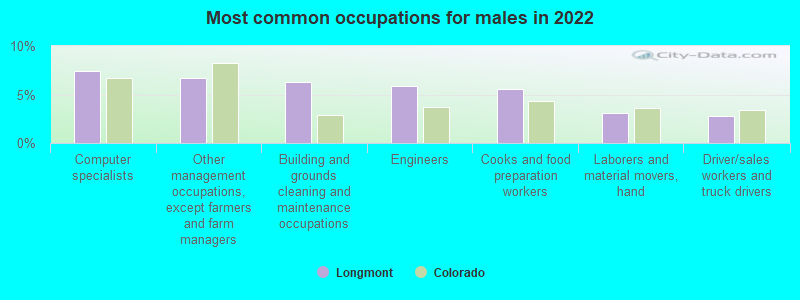
- Computer specialists (7.4%)
- Other management occupations, except farmers and farm managers (6.7%)
- Building and grounds cleaning and maintenance occupations (6.3%)
- Engineers (5.9%)
- Cooks and food preparation workers (5.6%)
- Laborers and material movers, hand (3.1%)
- Driver/sales workers and truck drivers (2.7%)
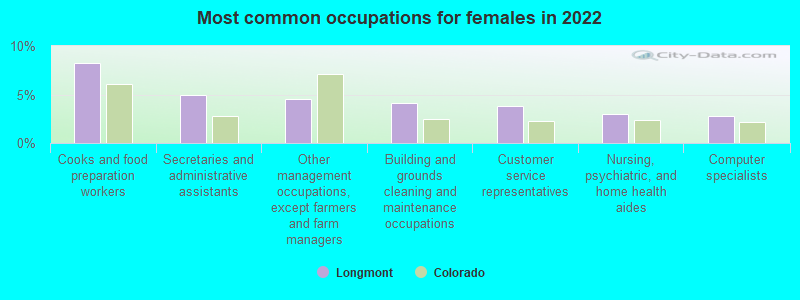
- Cooks and food preparation workers (8.2%)
- Secretaries and administrative assistants (4.9%)
- Other management occupations, except farmers and farm managers (4.5%)
- Building and grounds cleaning and maintenance occupations (4.1%)
- Customer service representatives (3.8%)
- Nursing, psychiatric, and home health aides (3.0%)
- Computer specialists (2.8%)
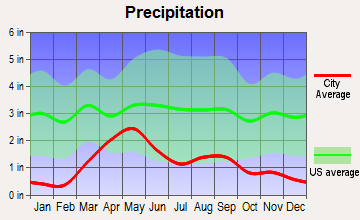
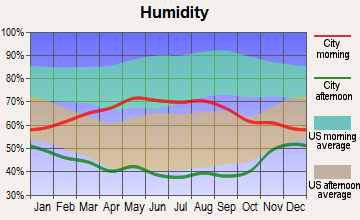
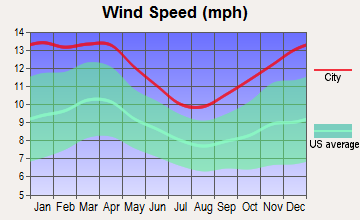
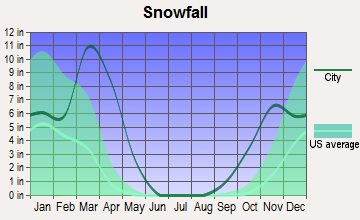
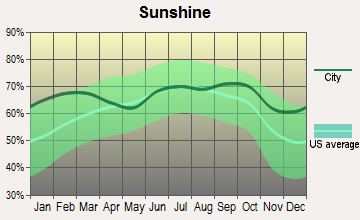
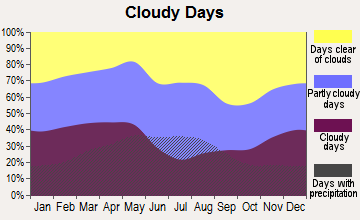
Average climate in Longmont, Colorado
Based on data reported by over 4,000 weather stations

|
|

(lower is better)
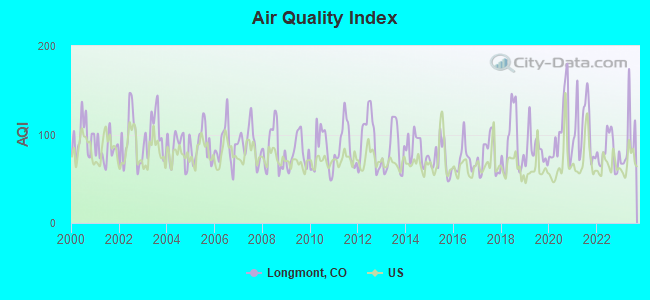
Air Quality Index (AQI) level in 2023 was 92.2. This is worse than average.
| City: | 92.2 |
| U.S.: | 72.6 |
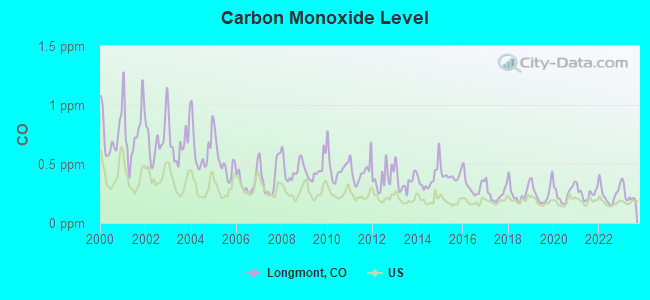
Carbon Monoxide (CO) [ppm] level in 2023 was 0.239. This is about average. Closest monitor was 0.5 miles away from the city center.
| City: | 0.239 |
| U.S.: | 0.251 |
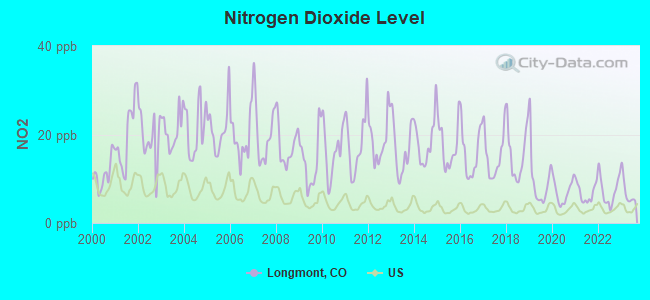
Nitrogen Dioxide (NO2) [ppb] level in 2023 was 6.99. This is worse than average. Closest monitor was 18.4 miles away from the city center.
| City: | 6.99 |
| U.S.: | 5.11 |
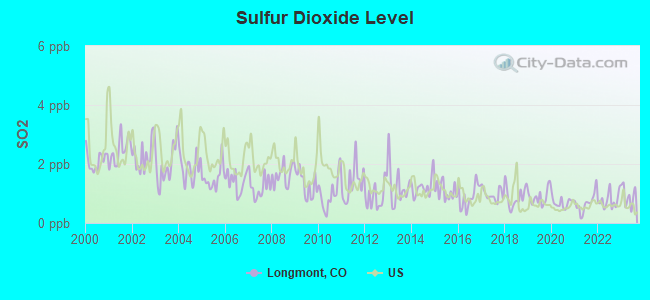
Sulfur Dioxide (SO2) [ppb] level in 2023 was 0.925. This is significantly better than average. Closest monitor was 24.2 miles away from the city center.
| City: | 0.925 |
| U.S.: | 1.515 |
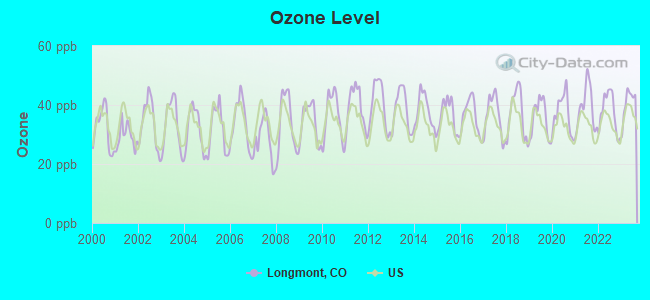
Ozone [ppb] level in 2023 was 40.6. This is worse than average. Closest monitor was 2.6 miles away from the city center.
| City: | 40.6 |
| U.S.: | 33.3 |
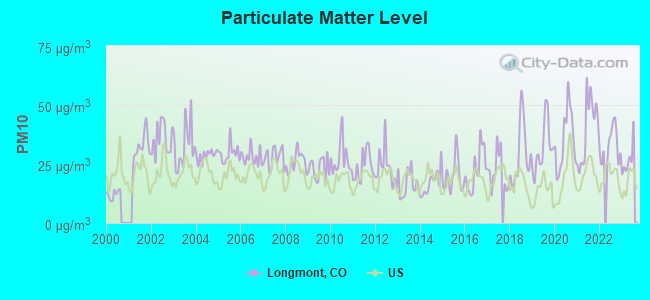
Particulate Matter (PM10) [µg/m3] level in 2023 was 26.8. This is worse than average. Closest monitor was 0.7 miles away from the city center.
| City: | 26.8 |
| U.S.: | 19.2 |
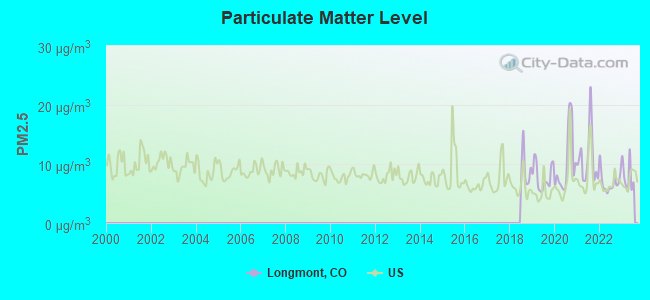
Particulate Matter (PM2.5) [µg/m3] level in 2023 was 7.98. This is about average. Closest monitor was 0.7 miles away from the city center.
| City: | 7.98 |
| U.S.: | 8.11 |
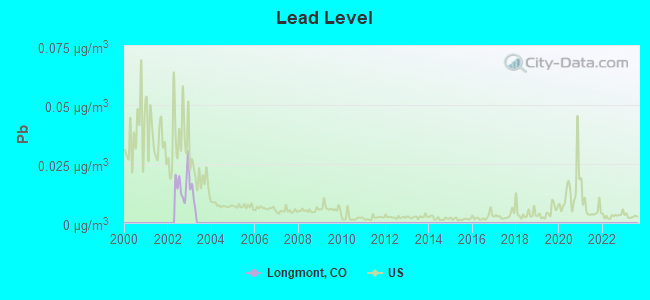
Lead (Pb) [µg/m3] level in 2002 was 0.0169. This is significantly worse than average. Closest monitor was 0.6 miles away from the city center.
| City: | 0.0169 |
| U.S.: | 0.0093 |
Tornado activity:
Longmont-area historical tornado activity is above Colorado state average. It is 16% greater than the overall U.S. average.
On 5/22/2008, a category F3 (max. wind speeds 158-206 mph) tornado 19.4 miles away from the Longmont city center killed one person and injured 78 people and caused $147 million in damages.
On 5/15/1952, a category F3 tornado 30.5 miles away from the city center injured 5 people and caused between $5000 and $50,000 in damages.
Earthquake activity:
Longmont-area historical earthquake activity is significantly above Colorado state average. It is 658% greater than the overall U.S. average.On 8/18/1959 at 06:37:13, a magnitude 7.7 (7.7 UK, Class: Major, Intensity: VIII - XII) earthquake occurred 415.4 miles away from Longmont center, causing $26,000,000 total damage
On 10/18/1984 at 15:30:23, a magnitude 5.5 (5.4 MB, 5.1 MS, 5.5 ML, Class: Moderate, Intensity: VI - VII) earthquake occurred 155.6 miles away from the city center
On 10/28/1983 at 14:06:06, a magnitude 7.3 (6.2 MB, 7.3 MS, 7.0 MW) earthquake occurred 521.0 miles away from the city center, causing 2 deaths (2 shaking deaths) and 3 injuries, causing $15,000,000 total damage
On 8/23/2011 at 05:46:18, a magnitude 5.3 (5.3 MW, Depth: 2.5 mi) earthquake occurred 216.1 miles away from the city center
On 3/28/1975 at 02:31:05, a magnitude 6.2 (6.1 MB, 6.0 MS, 6.2 ML, Class: Strong, Intensity: VII - IX) earthquake occurred 404.4 miles away from Longmont center
On 2/3/1995 at 15:26:10, a magnitude 5.3 (5.3 MB, 4.6 MS, Depth: 0.6 mi) earthquake occurred 254.9 miles away from Longmont center
Magnitude types: body-wave magnitude (MB), local magnitude (ML), surface-wave magnitude (MS), moment magnitude (MW)
Natural disasters:
The number of natural disasters in Boulder County (14) is near the US average (15).Major Disasters (Presidential) Declared: 5
Emergencies Declared: 4
Causes of natural disasters: Fires: 5, Floods: 5, Storms: 4, Landslides: 3, Mudslides: 3, Snows: 2, Heavy Rain: 1, Hurricane: 1, Snowstorm: 1, Tornado: 1, Other: 1 (Note: some incidents may be assigned to more than one category).
Main business address for: APPLIED FILMS CORP (SEMICONDUCTORS & RELATED DEVICES).
Hospitals and medical centers in Longmont:
- LONGMONT UNITED HOSPITAL (Voluntary non-profit - Other, provides emergency services, 1950 MOUNTAIN VIEW AVENUE)
- APPLEWOOD LIVING CENTER (1800 STROH PLACE)
- LIFE CARE CENTER OF LONGMONT (2451 PRATT STREET)
- PEAKS CARE CENTER THE (1440 COFFMAN STREET)
- KIDNEY CENTER OF LONGMONT (ARA) (1960 KEN PRATT BLVD STE A)
- KIDNEY CENTER ON MAIN (ARA) (2144 MAIN ST STE 2)
- LONGMONT DIALYSIS (DVA) (1715 IRON HORSE DR STE 170)
- GOOD SAMARITAN SOCIETY-COLORADO HOME CARE (425 S BOWEN STREET #6)
- PROFESSIONAL HOME HEALTH CARE INC (1629 HARVARD STREET)
Airports and heliports located in Longmont:
- Vance Brand Airport (LMO) (Runways: 1, Itinerant Ops: 29,980, Local Ops: 70,000, Military Ops: 10)
- Ashlawn Airport (CO23) (Runways: 1)
- Denver Artcc Heliport (CO99)
- Longmont United Hospital Heliport (0CO0)
- Murphy Heliport (1CD0)
College/University in Longmont:
Colleges/universities with over 2000 students nearest to Longmont:
- University of Colorado Boulder (about 15 miles; Boulder, CO; Full-time enrollment: 28,328)
- Front Range Community College (about 20 miles; Westminster, CO; FT enrollment: 14,756)
- Aims Community College (about 25 miles; Greeley, CO; FT enrollment: 3,598)
- Regis University (about 27 miles; Denver, CO; FT enrollment: 6,975)
- University of Northern Colorado (about 27 miles; Greeley, CO; FT enrollment: 11,469)
- Colorado State University-Fort Collins (about 28 miles; Fort Collins, CO; FT enrollment: 25,099)
- Colorado School of Mines (about 30 miles; Golden, CO; FT enrollment: 5,507)
Public high schools in Longmont:
- SKYLINE HIGH SCHOOL (Students: 1,444, Location: 600 EAST MOUNTAIN VIEW, Grades: 9-12)
- LONGMONT HIGH SCHOOL (Students: 1,321, Location: 1040 SUNSET STREET, Grades: 9-12)
- SILVER CREEK HIGH SCHOOL (Students: 1,032, Location: 4901 NELSON ROAD, Grades: 9-12)
- TWIN PEAKS CHARTER ACADEMY (Students: 569, Location: 340 SOUTH SUNSET STREET, Grades: KG-12, Charter school)
- OLDE COLUMBINE HIGH SCHOOL (Students: 108, Location: 1200 SOUTH SUNSET, Grades: 9-12)
- MEAD HIGH SCHOOL (Location: 12750 COUNTY ROAD #7, Grades: 9-12)
- ST. VRAIN GLOBAL ONLINE ACADEMY (Location: 1200 SOUTH SUNSET STREET, Grades: 9-12)
Private high schools in Longmont:
- LONGMONT CHRISTIAN SCHOOL (Students: 266, Location: 550 COFFMAN ST, Grades: PK-12)
- FAITH BAPTIST SCHOOL (Students: 131, Location: 833 15TH AVE, Grades: PK-12)
- DESIDERATA SCHOOL (Students: 25, Location: 333 1ST AVE #3, Grades: 3-12)
- MESSIAHVILLE BAPTIST ACADEMY (Students: 20, Location: 1146 KIMBARK ST, Grades: PK-12)
Biggest public elementary/middle schools in Longmont:
- ALTONA MIDDLE SCHOOL (Students: 676, Location: 4600 CLOVER BASIN DRIVE, Grades: 6-8)
- FALL RIVER ELEMENTARY SCHOOL (Students: 636, Location: 1400 DEERWOOD DRIVE, Grades: PK-5)
- SUNSET MIDDLE SCHOOL (Students: 607, Location: 1300 S. SUNSET, Grades: 6-8)
- TRAIL RIDGE MIDDLE SCHOOL (Students: 601, Location: 1000 BUTTON ROCK DRIVE, Grades: 6-8)
- EAGLE CREST ELEMENTARY SCHOOL (Students: 583, Location: 4444 CLOVER BASIN DRIVE, Grades: PK-5)
- WESTVIEW MIDDLE SCHOOL (Students: 581, Location: 1651 AIRPORT ROAD, Grades: 6-8)
- LONGS PEAK MIDDLE SCHOOL (Students: 496, Location: 1500 14TH AVENUE, Grades: 5-8)
- BURLINGTON ELEMENTARY SCHOOL (Students: 494, Location: 1051 S. PRATT PARKWAY, Grades: PK-5)
- ALPINE ELEMENTARY SCHOOL (Students: 493, Location: 2005 ALPINE STREET, Grades: PK-5)
- LONGMONT ESTATES ELEMENTARY SCHOOL (Students: 487, Location: 1601 NORTHWESTERN ROAD, Grades: PK-5)
Private elementary/middle schools in Longmont:
- ST JOHN THE BAPTIST CATHOLIC SCHOOL (Students: 365, Location: 350 EMERY ST, Grades: PK-8)
- MOUNTAIN PEAK PRIVATE SCHOOL (Students: 72, Location: 1833 SUNSET PL STES E AND F, Grades: PK-6)
- MESSIAH LUTHERAN SCHOOL (Students: 53, Location: 1335 FRANCIS ST, Grades: PK-5)
- OUR SAVIORS LUTHERAN SCHOOL (Students: 10, Location: 1219 17TH AVE, Grades: PK-1)
Library in Longmont:
User-submitted facts and corrections:
- Front Range Community College has a campus in Longmont
- Birthplace of Greg Biekert, former NFL linebacker who played with the Oakland Raiders and Minnesota Vikings.
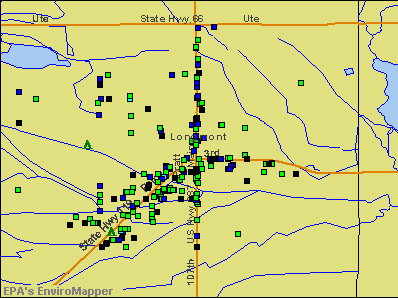
Points of interest:
Notable locations in Longmont: Midwest Childrens Home (A), Sunset Park and Golf Course (B), Longmont Fire Department Station 1 (C), Longmont Museum and Culture Center (D), Longmont Public Library (E), Safety and Justice Center (F), Longmont Police Department Headquarters (G), Boulder County Court Building (H), Longmont Fire Department Headquarters (I), Longmont Fire Department Station 6 (J), Longmont Fire Department Station 5 (K), Longmont Fire Department Station 4 (L), Longmont Fire Department Station 2 (M). Display/hide their locations on the map
Shopping Centers: Yeager Garden Acres Shopping Center (1), Western Meadows Shopping Center (2), Twin Peaks Mall (3), Saint Vrain Plaza Shopping Center (4), Southmoor Plaza Shopping Center (5), Montview Shopping Center (6), Francis Street Shopping Center (7), First American Plaza Shopping Center (8), Centennial Square Shopping Center (9). Display/hide their locations on the map
Churches in Longmont include: Longmont Church of the Nazarene (A), Spirit of Peace Catholicf Church (B), Westview Presbyterian Church (C), Central Presbyterian Church (D), Saint John the Baptist Catholic Church (E), Longmont Buddist Temple (F). Display/hide their locations on the map
Cemeteries: Mountain View Cemetery (1), Burlington Cemetery (2). Display/hide their locations on the map
Reservoir: Longmont Reservoir (A). Display/hide its location on the map
Creeks: Silver Creek (A), Dry Creek (B). Display/hide their locations on the map
Parks in Longmont include: Lanyon Park (1), Loomiller Park (2), Roosevelt Park (3), Collyer Park (4). Display/hide their locations on the map
Tourist attractions: Dougherty Antique Collection (Museums; 8306 North 107th Street) (1), Longmont Museum & Cultural Center (400 Quail Road) (2), Saint Vrain Historical Society (Historical Places & Services; 470 Main Street) (3), Cruises Inc (Cultural Attractions- Events- & Facilities; 12121 Sugar Mill Road) (4), Greenwood Wildlife Rehabilitation Sanctuary (Recreation Areas; 5761 Ute Highway) (5), Cyberstation (Amusement & Theme Parks; Twin Peaks Mall Unit UNIT) (6). Display/hide their approximate locations on the map
Hotels: Briarwood Inn Motel (1228 Main Street) (1), Dicken's House Bed & Breakfst (136 South Main Street) (2), Comfort Inn (10811 I-25 Access Rd.) (3), Hawthorne Suites (2000 Sunset Way) (4), Countrywood Inn & RV Park (1550 Main Street) (5), Comfort Inn Longmont (10811 I-25 Access Road) (6), Best Western Firestone Inn (11228 Business Park Circle) (7), Hampton Inn Longmont (850 South Main Street) (8), First Interstate Inn (Del Camino Centre) (9). Display/hide their approximate locations on the map
Courts: Colorado State Government - Courts-20th Judicial District- Clerk Of The C (1035 Kimbark Street) (1), Longmont Municipal Court (225 Kimbark Street) (2), Municipal Court (3 Emery Way) (3). Display/hide their approximate locations on the map
Birthplace of: Kristen Schaal - Film actor, David Pauley - Professional baseball player, Donald D. Pucket - Army Air Forces Medal of Honor recipient, Fred Stone - Film actor, Vance Brand - astronaut, Andy Osborn - College basketball player (Colorado Buffaloes), Bert C. Edmonds - Navy sailor and naval aviator, Cody Horning - College basketball player (Pepperdine Waves), Ed Werder - Sports announcer, Eric Coyle - Football player.
Drinking water stations with addresses in Longmont and their reported violations in the past:
LONGMONT CITY OF (Address: C/O WATER PLANTS , Population served: 85,000, Surface water):Past monitoring violations:LONGS PEAK WD (Population served: 2,700, Surface water):
- 31 regular monitoring violations
Past health violations:ROCK CREEK FARM WS (Population served: 77, Groundwater):
- MCL, Average - Between OCT-2005 and DEC-2005, Contaminant: Total Haloacetic Acids (HAA5). Follow-up actions: St Violation/Reminder Notice (JAN-29-2006), St Public Notif requested (JAN-29-2006), St Public Notif received (FEB-16-2006), St Compliance achieved (JAN-03-2007)
Past monitoring violations:POPE WATER SERVICES (Population served: 56, Purch surface water):
- 2 routine major monitoring violations
Past monitoring violations:ROOM 119 NIGHT CLUB (Population served: 52, Groundwater):
- One routine major monitoring violation
- 2 minor monitoring violations
Past monitoring violations:
- 3 routine major monitoring violations
- 4 regular monitoring violations
| This city: | 2.6 people |
| Colorado: | 2.5 people |
| This city: | 66.4% |
| Whole state: | 63.9% |
| This city: | 6.3% |
| Whole state: | 6.5% |
Likely homosexual households (counted as self-reported same-sex unmarried-partner households)
- Lesbian couples: 0.5% of all households
- Gay men: 0.2% of all households
People in group quarters in Longmont in 2010:
- 482 people in nursing facilities/skilled-nursing facilities
- 80 people in other noninstitutional facilities
- 46 people in workers' group living quarters and job corps centers
- 16 people in residential treatment centers for juveniles (non-correctional)
- 15 people in emergency and transitional shelters (with sleeping facilities) for people experiencing homelessness
People in group quarters in Longmont in 2000:
- 414 people in nursing homes
- 121 people in other noninstitutional group quarters
- 40 people in college dormitories (includes college quarters off campus)
- 13 people in homes or halfway houses for drug/alcohol abuse
- 10 people in homes for the physically handicapped
- 6 people in hospitals/wards and hospices for chronically ill
- 6 people in hospices or homes for chronically ill
- 5 people in homes for the mentally ill
- 4 people in other nonhousehold living situations
- 2 people in homes for the mentally retarded
Banks with most branches in Longmont (2011 data):
- Guaranty Bank and Trust Company: Twin Peaks Branch, Longmont Branch, Longmont Del Camino Branch, Fox Creek Branch. Info updated 2010/12/21: Bank assets: $1,687.8 mil, Deposits: $1,331.8 mil, headquarters in Denver, CO, positive income, Commercial Lending Specialization, 34 total offices, Holding Company: Guaranty Bancorp
- U.S. Bank National Association: Longmont Safeway Branch, Longmont Branch, Longmont 9th Street Drive Up Branch, Nelson And Hover King Soopers Branch. Info updated 2012/01/30: Bank assets: $330,470.8 mil, Deposits: $236,091.5 mil, headquarters in Cincinnati, OH, positive income, 3121 total offices, Holding Company: U.S. Bancorp
- Wells Fargo Bank, National Association: Longmont South Branch, Ken Pratt & Parkway Branch, Longmont Branch, Longmont Fox Creek. Info updated 2011/04/05: Bank assets: $1,161,490.0 mil, Deposits: $905,653.0 mil, headquarters in Sioux Falls, SD, positive income, 6395 total offices, Holding Company: Wells Fargo & Company
- JPMorgan Chase Bank, National Association: North Longmont Banking Center Branch, Main And 119 Branch, Longmont Branch. Info updated 2011/11/10: Bank assets: $1,811,678.0 mil, Deposits: $1,190,738.0 mil, headquarters in Columbus, OH, positive income, International Specialization, 5577 total offices, Holding Company: Jpmorgan Chase & Co.
- Mile High Banks: South Longmont Branch at 601 South Main Street, branch established on 2001/06/18; at 1726 Hover Street, branch established on 1919/01/01. Info updated 2008/09/11: Bank assets: $957.1 mil, Deposits: $929.1 mil, local headquarters, negative income in the last year, Commercial Lending Specialization, 16 total offices, Holding Company: Big Sandy Holding Company
- Bank of the West: Longmont - Hover Branch at 1610 Hover Street, branch established on 1983/02/16; Longmont at 700 5th Avenue, branch established on 1931/01/01. Info updated 2009/11/16: Bank assets: $62,408.3 mil, Deposits: $43,995.2 mil, headquarters in San Francisco, CA, positive income, 647 total offices, Holding Company: Bnp Paribas
- Great Western Bank: Longmont - Harvest Junction Branch at 25 Ken Pratt Boulevard, branch established on 2000/07/01; Longmont - Main St Branch at 2100 Main Street, branch established on 1999/03/17. Info updated 2010/06/08: Bank assets: $8,458.0 mil, Deposits: $6,362.5 mil, headquarters in Watertown, SD, positive income, Commercial Lending Specialization, 187 total offices, Holding Company: National Australia Bank Limited
- FirstBank: Twin Peaks Branch at 1270 South Hover Road, branch established on 1994/05/16; 17th And Main Branch at 1707 North Main Street, branch established on 1908/08/15. Info updated 2011/12/05: Bank assets: $11,597.1 mil, Deposits: $10,530.4 mil, headquarters in Lakewood, CO, positive income, Mortgage Lending Specialization, 130 total offices, Holding Company: Firstbank Holding Company
- The Rawlins National Bank: Rawlins National Bank - Longmont Bra at 2001 North Main Street, branch established on 2008/06/09. Info updated 2006/11/03: Bank assets: $149.7 mil, Deposits: $130.8 mil, headquarters in Rawlins, WY, positive income, Commercial Lending Specialization, 5 total offices, Holding Company: Carbon County Holding Company
- 9 other banks with 9 local branches
For population 15 years and over in Longmont:
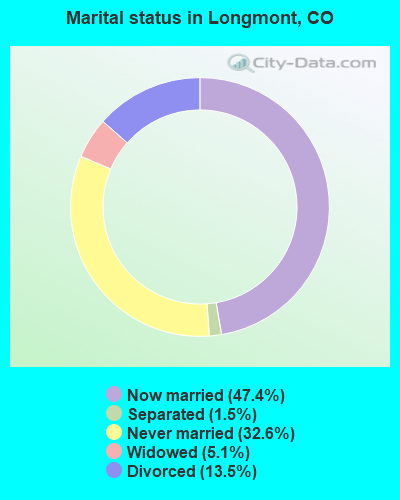
- Never married: 32.6%
- Now married: 47.4%
- Separated: 1.5%
- Widowed: 5.1%
- Divorced: 13.5%
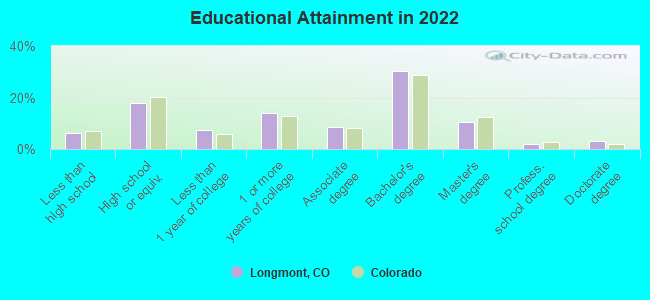
For population 25 years and over in Longmont:
- High school or higher: 93.7%
- Bachelor's degree or higher: 45.8%
- Graduate or professional degree: 15.6%
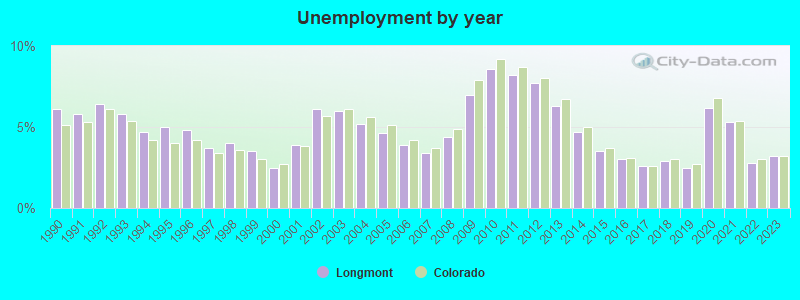
- Unemployed: 2.5%
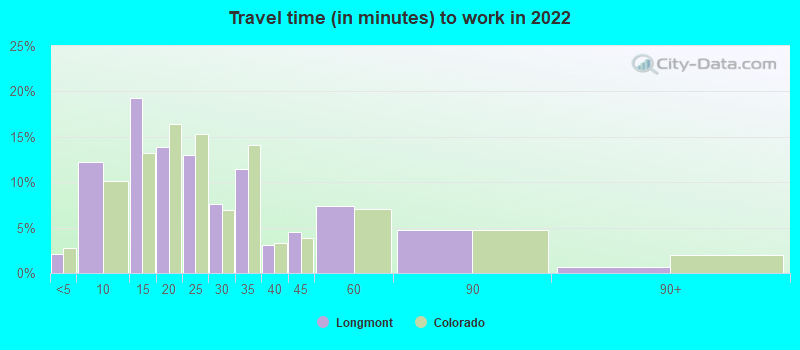
- Mean travel time to work (commute): 18.7 minutes
| Here: | 11.4 |
| Colorado average: | 11.1 |
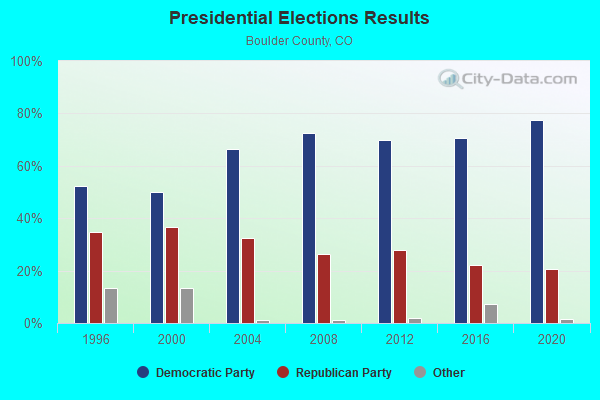
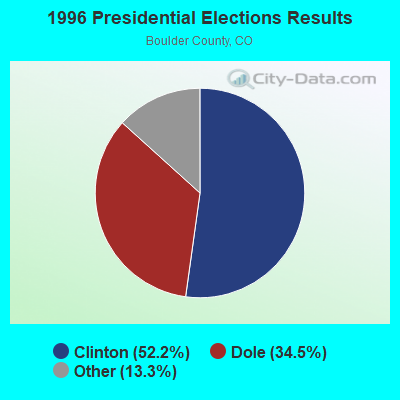

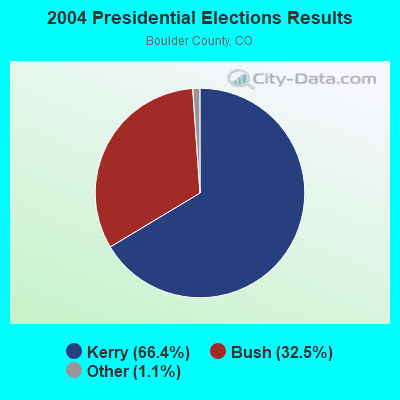
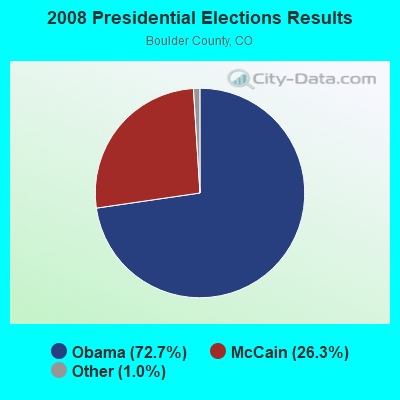
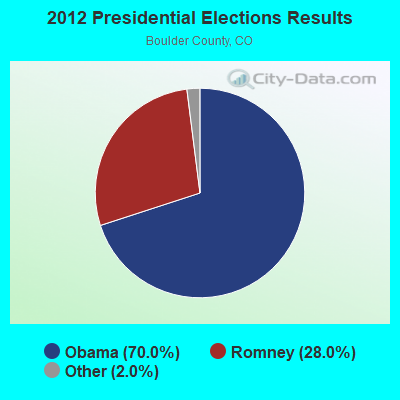
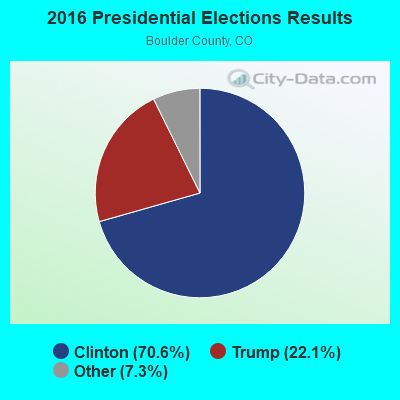
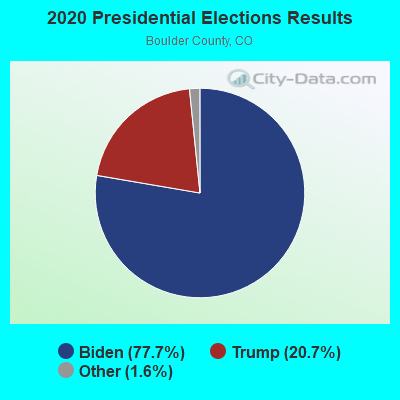
Graphs represent county-level data. Detailed 2008 Election Results
Neighborhoods in Longmont:
(Longmont, Colorado Neighborhood Map)- Alpenglow Acres neighborhood
- Anhawa Manor neighborhood
- August Highland neighborhood
- Blue Sky neighborhood
- Boulder Hills neighborhood
- Boulder Tech Center neighborhood
- Brigadoon Glen neighborhood
- Brittany Place neighborhood
- Centrebridge neighborhood
- Chance Acres neighborhood
- Circle C Ranch neighborhood
- Cottonwood Hills neighborhood
- Cottonwood Park neighborhood
- Coughlin Meadows neighborhood
- Country Creek neighborhood
- Coyote Ridge neighborhood
- Crystal Views neighborhood
- Dannybrook Farm neighborhood
- Deer Run neighborhood
- Fairways Living neighborhood
- First Linda Vista Estates neighborhood
- Fox Haven neighborhood
- Gaynor Lake neighborhood
- Gunbarrel Estates neighborhood
- Hardt Estates neighborhood
- Harsch Heights neighborhood
- Haystack Mountain Ranch neighborhood
- Heather Hills neighborhood
- Hillcrest Heights neighborhood
- Hillside Estates neighborhood
- Hygiene Heights neighborhood
- Johnson Farm neighborhood
- Ken Dale neighborhood
- King neighborhood
- Lagerman Reservoir neighborhood
- Lake Valley Estates neighborhood
- Legend Ridge Filing neighborhood
- Longview Ranchettes neighborhood
- Mccall Lake neighborhood
- Meadow Mountain neighborhood
- Meadowdale neighborhood
- Monarch Grove neighborhood
- Monarch Park neighborhood
- Monarch Ponds neighborhood
- Morton Heights neighborhood
- Niwot Estates neighborhood
- Niwot Meadow neighborhood
- Niwot Meadow Farm neighborhood
- North Rim neighborhood
- Northwest Acres neighborhood
- Oriole Estates neighborhood
- Overbrook neighborhood
- Peppertree Estates neighborhood
- Ranch at Clover Basin neighborhood
- Range View neighborhood
- Redrock neighborhood
- Ryan Estates neighborhood
- Sage Valley neighborhood
- Saint Vrain Meadows neighborhood
- Smith Meadow Lane neighborhood
- Somerset Estates neighborhood
- Spring Lake Heights neighborhood
- Spring Tree neighborhood
- Springhill neighborhood
- Suburbia Acres neighborhood
- Sunny Acres neighborhood
- The Cove neighborhood
- Triple Crown Meadows neighborhood
- Walker Acres neighborhood
- Waterford neighborhood
- Waterford Park neighborhood
- Whittington Estates neighborhood
- Willis Heights neighborhood
- Willowdale Place Condos neighborhood
- Winterview neighborhood
- Woodland Village neighborhood
Religion statistics for Longmont, CO (based on Boulder County data)
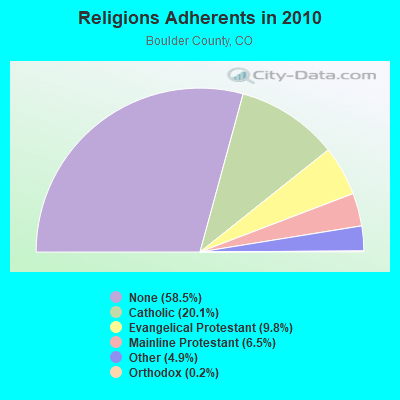
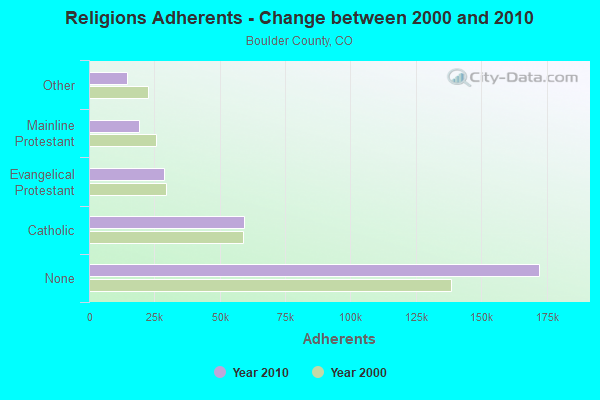
| Religion | Adherents | Congregations |
|---|---|---|
| Catholic | 59,240 | 11 |
| Evangelical Protestant | 28,825 | 101 |
| Mainline Protestant | 19,126 | 43 |
| Other | 14,359 | 74 |
| Orthodox | 718 | 4 |
| None | 172,299 | - |
Food Environment Statistics:
| Boulder County: | 1.56 / 10,000 pop. |
| State: | 1.50 / 10,000 pop. |
| This county: | 0.10 / 10,000 pop. |
| Colorado: | 0.15 / 10,000 pop. |
| Boulder County: | 0.38 / 10,000 pop. |
| Colorado: | 0.45 / 10,000 pop. |
| This county: | 2.35 / 10,000 pop. |
| State: | 3.13 / 10,000 pop. |
| Boulder County: | 9.94 / 10,000 pop. |
| State: | 8.99 / 10,000 pop. |
| Here: | 3.6% |
| Colorado: | 5.3% |
| This county: | 12.5% |
| Colorado: | 18.4% |
| This county: | 12.4% |
| Colorado: | 9.6% |
Health and Nutrition:
| This city: | 48.3% |
| Colorado: | 49.4% |
| Here: | 46.4% |
| Colorado: | 47.8% |
| Here: | 28.3 |
| Colorado: | 28.5 |
| This city: | 21.5% |
| Colorado: | 20.7% |
| This city: | 9.2% |
| State: | 9.7% |
| Longmont: | 6.8 |
| Colorado: | 6.8 |
| This city: | 32.9% |
| State: | 33.3% |
| Longmont: | 56.3% |
| Colorado: | 57.3% |
| This city: | 79.8% |
| Colorado: | 80.2% |
More about Health and Nutrition of Longmont, CO Residents
| Local government employment and payroll (March 2022) | |||||
| Function | Full-time employees | Monthly full-time payroll | Average yearly full-time wage | Part-time employees | Monthly part-time payroll |
|---|---|---|---|---|---|
| Police Protection - Officers | 168 | $1,552,696 | $110,907 | 0 | $0 |
| Firefighters | 98 | $883,642 | $108,201 | 0 | $0 |
| Water Supply | 82 | $542,240 | $79,352 | 2 | $5,833 |
| Parks and Recreation | 79 | $441,883 | $67,121 | 220 | $121,646 |
| Financial Administration | 77 | $487,680 | $76,002 | 2 | $3,688 |
| Electric Power | 74 | $600,759 | $97,420 | 3 | $6,515 |
| Police - Other | 69 | $424,482 | $73,823 | 41 | $22,439 |
| Other and Unallocable | 67 | $366,109 | $65,572 | 0 | $0 |
| Local Libraries | 56 | $366,229 | $78,478 | 27 | $18,677 |
| Solid Waste Management | 41 | $272,464 | $79,746 | 1 | $3,350 |
| Streets and Highways | 38 | $272,452 | $86,037 | 0 | $0 |
| Other Government Administration | 38 | $327,717 | $103,490 | 10 | $11,473 |
| Welfare | 29 | $182,760 | $75,625 | 14 | $15,129 |
| Sewerage | 24 | $123,840 | $61,920 | 0 | $0 |
| Judicial and Legal | 13 | $116,688 | $107,712 | 0 | $0 |
| Health | 6 | $50,518 | $101,036 | 0 | $0 |
| Correction | 5 | $32,820 | $78,768 | 0 | $0 |
| Fire - Other | 3 | $23,887 | $95,548 | 0 | $0 |
| Natural Resources | 1 | $5,638 | $67,656 | 1 | $2,801 |
| Airports | 1 | $11,074 | $132,888 | 0 | $0 |
| Housing and Community Development (Local) | 1 | $13,156 | $157,872 | 1 | $2,057 |
| Totals for Government | 970 | $7,098,734 | $87,819 | 322 | $213,608 |
Longmont government finances - Expenditure in 2021 (per resident):
- Construction - Electric Utilities: $19,045,000 ($192.98)
Sewerage: $17,173,000 ($174.01)
Regular Highways: $15,931,000 ($161.43)
Parks and Recreation: $10,499,000 ($106.39)
Natural Resources - Other: $8,981,000 ($91.00)
Water Utilities: $6,228,000 ($63.11)
General - Other: $4,357,000 ($44.15)
Solid Waste Management: $1,748,000 ($17.71)
Police Protection: $631,000 ($6.39)
Local Fire Protection: $390,000 ($3.95)
Housing and Community Development: $268,000 ($2.72)
Air Transportation: $76,000 ($0.77)
- Current Operations - Electric Utilities: $69,140,000 ($700.60)
General - Other: $28,742,000 ($291.24)
Parks and Recreation: $20,880,000 ($211.58)
Police Protection: $20,600,000 ($208.74)
Local Fire Protection: $16,890,000 ($171.15)
Regular Highways: $14,363,000 ($145.54)
Central Staff Services: $12,667,000 ($128.36)
Water Utilities: $11,559,000 ($117.13)
Sewerage: $11,156,000 ($113.04)
Housing and Community Development: $9,011,000 ($91.31)
Solid Waste Management: $7,671,000 ($77.73)
Financial Administration: $7,061,000 ($71.55)
Natural Resources - Other: $4,498,000 ($45.58)
Libraries: $4,478,000 ($45.38)
General Public Buildings: $4,052,000 ($41.06)
Protective Inspection and Regulation - Other: $1,980,000 ($20.06)
Public Welfare - Other: $1,481,000 ($15.01)
Judicial and Legal Services: $662,000 ($6.71)
Corrections - Other: $483,000 ($4.89)
Air Transportation: $456,000 ($4.62)
Parking Facilities: $210,000 ($2.13)
- Electric Utilities - Interest on Debt: $1,339,000 ($13.57)
- General - Interest on Debt: $4,758,000 ($48.21)
- Intergovernmental to Local - Other - Housing and Community Development: $60,000 ($0.61)
Other - General - Other: $10,000 ($0.10)
- Other Capital Outlay - Water Utilities: $3,312,000 ($33.56)
Parks and Recreation: $1,624,000 ($16.46)
Electric Utilities: $1,114,000 ($11.29)
Police Protection: $1,084,000 ($10.98)
Regular Highways: $873,000 ($8.85)
General - Other: $658,000 ($6.67)
Financial Administration: $557,000 ($5.64)
Local Fire Protection: $538,000 ($5.45)
Sewerage: $440,000 ($4.46)
Solid Waste Management: $371,000 ($3.76)
Natural Resources - Other: $215,000 ($2.18)
General Public Building: $142,000 ($1.44)
Protective Inspection and Regulation - Other: $62,000 ($0.63)
Libraries: $20,000 ($0.20)
Central Staff Services: $5,000 ($0.05)
Air Transportation: $2,000 ($0.02)
- Total Salaries and Wages: $76,857,000 ($778.80)
- Water Utilities - Interest on Debt: $316,000 ($3.20)
Longmont government finances - Revenue in 2021 (per resident):
- Charges - Sewerage: $13,563,000 ($137.43)
Parks and Recreation: $7,184,000 ($72.80)
Solid Waste Management: $6,395,000 ($64.80)
Other: $2,651,000 ($26.86)
Air Transportation: $418,000 ($4.24)
Parking Facilities: $74,000 ($0.75)
Housing and Community Development: $30,000 ($0.30)
Regular Highways: $19,000 ($0.19)
- Federal Intergovernmental - Natural Resources: $8,560,000 ($86.74)
Housing and Community Development: $4,377,000 ($44.35)
Highways: $1,796,000 ($18.20)
Other: $186,000 ($1.88)
Air Transportation: $35,000 ($0.35)
- Local Intergovernmental - Other: $763,000 ($7.73)
Highways: $317,000 ($3.21)
Housing and Community Development: $120,000 ($1.22)
- Miscellaneous - Special Assessments: $17,228,000 ($174.57)
General Revenue - Other: $4,957,000 ($50.23)
Sale of Property: $1,960,000 ($19.86)
Interest Earnings: $1,656,000 ($16.78)
Fines and Forfeits: $1,578,000 ($15.99)
Donations From Private Sources: $956,000 ($9.69)
Rents: $634,000 ($6.42)
Royalties: $70,000 ($0.71)
- Revenue - Electric Utilities: $74,499,000 ($754.90)
Water Utilities: $17,608,000 ($178.42)
- State Intergovernmental - Highways: $4,883,000 ($49.48)
Other: $2,515,000 ($25.48)
General Local Government Support: $175,000 ($1.77)
Water Utilities: $30,000 ($0.30)
Education: $25,000 ($0.25)
- Tax - General Sales and Gross Receipts: $82,117,000 ($832.10)
Property: $22,835,000 ($231.39)
Public Utilities Sales: $11,027,000 ($111.74)
Other License: $2,716,000 ($27.52)
Other Selective Sales: $517,000 ($5.24)
Tobacco Products Sales: $223,000 ($2.26)
Occupation and Business License - Other: $217,000 ($2.20)
Alcoholic Beverage License: $46,000 ($0.47)
Longmont government finances - Debt in 2021 (per resident):
- Long Term Debt - Beginning Outstanding - Unspecified Public Purpose: $170,228,000 ($1724.93)
Outstanding Unspecified Public Purpose: $163,241,000 ($1654.13)
Retired Unspecified Public Purpose: $6,987,000 ($70.80)
Longmont government finances - Cash and Securities in 2021 (per resident):
- Bond Funds - Cash and Securities: $116,095,000 ($1176.40)
- Other Funds - Cash and Securities: $314,020,000 ($3181.98)
- Sinking Funds - Cash and Securities: $11,939,000 ($120.98)
| Businesses in Longmont, CO | ||||
| Name | Count | Name | Count | |
|---|---|---|---|---|
| 7-Eleven | 5 | Lowe's | 1 | |
| AT&T | 5 | Marriott | 3 | |
| Ace Hardware | 1 | Marshalls | 1 | |
| Advance Auto Parts | 2 | MasterBrand Cabinets | 5 | |
| Applebee's | 1 | Maurices | 1 | |
| Arby's | 2 | Mazda | 1 | |
| AutoZone | 1 | McDonald's | 4 | |
| Baskin-Robbins | 1 | New Balance | 3 | |
| Bath & Body Works | 1 | Nike | 16 | |
| Bed Bath & Beyond | 1 | Nissan | 1 | |
| Big O Tires | 1 | Office Depot | 1 | |
| Blockbuster | 1 | OfficeMax | 1 | |
| Buffalo Wild Wings | 1 | Outback | 1 | |
| Burger King | 2 | Outback Steakhouse | 1 | |
| Carl\s Jr. | 2 | Panda Express | 2 | |
| Chevrolet | 1 | Panera Bread | 1 | |
| Chick-Fil-A | 1 | Papa John's Pizza | 1 | |
| Chipotle | 2 | Payless | 1 | |
| Circle K | 2 | PetSmart | 1 | |
| Cold Stone Creamery | 2 | Pizza Hut | 2 | |
| Cricket Wireless | 4 | Qdoba Mexican Grill | 1 | |
| Curves | 1 | Quality | 1 | |
| DHL | 1 | RadioShack | 2 | |
| Dairy Queen | 3 | Red Lobster | 1 | |
| Days Inn | 1 | Red Robin | 1 | |
| Discount Tire | 1 | SAS Shoes | 1 | |
| Domino's Pizza | 1 | SONIC Drive-In | 1 | |
| Famous Footwear | 1 | Safeway | 2 | |
| FedEx | 14 | Sears | 2 | |
| Firestone Complete Auto Care | 1 | Sprint Nextel | 1 | |
| Foot Locker | 1 | Staples | 1 | |
| Ford | 1 | Starbucks | 10 | |
| GNC | 2 | Subaru | 1 | |
| GameStop | 1 | Subway | 7 | |
| Gymboree | 1 | Super 8 | 2 | |
| H&R Block | 4 | T-Mobile | 2 | |
| Hilton | 1 | T.G.I. Driday's | 1 | |
| Hobby Lobby | 1 | Taco Bell | 3 | |
| Holiday Inn | 1 | Target | 1 | |
| Home Depot | 1 | U-Haul | 2 | |
| Honda | 1 | UPS | 15 | |
| IHOP | 1 | Vans | 2 | |
| JCPenney | 1 | Verizon Wireless | 2 | |
| Jack In The Box | 1 | Victoria's Secret | 1 | |
| Jimmy John's | 2 | Village Inn | 1 | |
| Jones New York | 1 | Vons | 3 | |
| KFC | 1 | Waffle House | 1 | |
| Kohl's | 1 | Walgreens | 4 | |
| Kroger | 4 | Walmart | 2 | |
| LensCrafters | 1 | Wendy's | 3 | |
| Little Caesars Pizza | 2 | YMCA | 1 | |
Strongest AM radio stations in Longmont:
- KLMO (1060 AM; 30 kW; LONGMONT, CO; Owner: PILGRIM COMMUNICATIONS, INC.)
- KKZN (760 AM; 50 kW; THORNTON, CO; Owner: JACOR BROADCASTING OF COLORADO, INC.)
- KLTT (670 AM; 50 kW; COMMERCE CITY, CO; Owner: KLZ RADIO, INC.)
- KMXA (1090 AM; 50 kW; AURORA, CO; Owner: ENTRAVISION HOLDINGS, LLC)
- KOA (850 AM; 50 kW; DENVER, CO; Owner: JACOR BROADCASTING OF COLORADO, INC.)
- KVCU (1190 AM; 7 kW; BOULDER, CO; Owner: THE UNIVERSITY OF CO FOUNDATION, INC.)
- KHNC (1360 AM; 10 kW; JOHNSTOWN, CO; Owner: DONALD A. AND SHARON E. WIEDEMAN)
- KHOW (630 AM; 5 kW; DENVER, CO; Owner: CITICASTERS LICENSES, L.P.)
- KNUS (710 AM; 5 kW; DENVER, CO; Owner: SALEM MEDIA OF COLORADO, INC.)
- KLZ (560 AM; 5 kW; DENVER, CO; Owner: KLZ RADIO, INC.)
- KRKS (990 AM; 10 kW; DENVER, CO; Owner: SALEM MEDIA OF COLORADO, INC.)
- KPOF (910 AM; 5 kW; DENVER, CO; Owner: PILLAR OF FIRE)
- KKFN (950 AM; 5 kW; DENVER, CO; Owner: JEFFERSON-PILOT COMMUNICATIONS COMPANY OF COLORADO)
Strongest FM radio stations in Longmont:
- KJCD (104.3 FM; LONGMONT, CO; Owner: JEFFERSON-PILOT COMMUNICATIONS COMPANY OF COLORADO)
- KRKS-FM (94.7 FM; LAFAYETTE, CO; Owner: SALEM MEDIA OF COLORADO, INC)
- KDJM (92.5 FM; BROOMFIELD, CO; Owner: INFINITY RADIO OPERATIONS INC.)
- KTCL (93.3 FM; FORT COLLINS, CO; Owner: JACOR BROADCASTING OF COLORADO, INC.)
- KBCO-FM (97.3 FM; BOULDER, CO; Owner: CITICASTERS LICENSES, L.P.)
- KCDC (90.7 FM; LONGMONT, CO; Owner: ST. VRAIN VALLEY SCHOOL DISTRICT)
- K251AB (98.1 FM; LONGMONT, CO; Owner: JEFFERSON-PILOT COMMUNICATIONS COMPANY OF COLORADO)
- KBPI (106.7 FM; DENVER, CO; Owner: JACOR BROADCASTING OF COLORADO, INC.)
- KALC (105.9 FM; DENVER, CO; Owner: ENTERCOM DENVER LICENSE, LLC)
- KFMD (95.7 FM; DENVER, CO; Owner: CITICASTERS LICENSES, L.P.)
- KOSI (101.1 FM; DENVER, CO; Owner: ENTERCOM DENVER LICENSE, LLC)
- KQMT (99.5 FM; DENVER, CO; Owner: ENTERCOM DENVER LICENSE, LLC)
- KRFX (103.5 FM; DENVER, CO; Owner: JACOR BROADCASTING OF COLORADO, INC.)
- KXDC (102.1 FM; ESTES PARK, CO; Owner: HIGH PEAK BROADCASTING, L.L.C.)
- KYGO-FM (98.5 FM; DENVER, CO; Owner: JEFFERSON-PILOT COMMUNICATIONS COMPANY OF COLORADO)
- KXPK (96.5 FM; EVERGREEN, CO; Owner: ENTRAVISION HOLDINGS, LLC)
- KUAD-FM (99.1 FM; WINDSOR, CO; Owner: REGENT BROADCASTING OF FT. COLLINS, INC.)
- K206DB (89.1 FM; FORT COLLINS, ETC., CO; Owner: BOULDER COMMUNITY B/CAST ASSOC., INC)
- KUVO (89.3 FM; DENVER, CO; Owner: DENVER EDUCATIONAL BROADCASTING)
- KQKS (107.5 FM; LAKEWOOD, CO; Owner: JEFFERSON-PILOT COMMUNICATIONS COMPANY OF COLORADO)
TV broadcast stations around Longmont:
- KDEN (Channel 25; LONGMONT, CO; Owner: LONGMONT CHANNEL 25, INC.)
- KMGH-TV (Channel 7; DENVER, CO; Owner: MCGRAW-HILL BROADCASTING COMPANY, INC.)
- KUSA-TV (Channel 9; DENVER, CO; Owner: MULTIMEDIA HOLDINGS CORPORATION)
- KTVD (Channel 20; DENVER, CO; Owner: TWENVER BROADCAST, INC.)
- KCNC-TV (Channel 4; DENVER, CO; Owner: CBS TELEVISION STATIONS INC.)
- KRMA-TV (Channel 6; DENVER, CO; Owner: ROCKY MOUNTAIN PUBLIC BROADCASTING NETWORK, INC.)
- K47IH (Channel 47; BOULDER, CO; Owner: CHANNEL 20 TV COMPANY)
- K63AB (Channel 63; ESTES PARK, CO; Owner: SYNCOM MEDIA GROUP, INC.)
- K48FW (Channel 48; DENVER, CO; Owner: TRINITY BROADCASTING NETWORK)
- KFCT (Channel 22; FORT COLLINS, CO; Owner: FOX TELEVISION STATIONS, INC.)
- K57AA (Channel 57; ESTES PARK, CO; Owner: SYNCOM MEDIA GROUP, INC.)
- K44CT (Channel 44; BOULDER, CO; Owner: ROCKY MOUNTAIN PUBLIC BROADCASTING NETWORK, INC.)
- K48CG (Channel 48; LOVELAND, CO; Owner: TRINITY BROADCASTING NETWORK)
- K17CF (Channel 17; BOULDER, CO; Owner: FULL GOSPEL OUTREACH, INC.)
- K54DK (Channel 54; BOULDER, CO; Owner: FOX TELEVISION STATIONS, INC.)
Medal of Honor Recipients
Medal of Honor Recipient born in Longmont: Donald D. Pucket.
- National Bridge Inventory (NBI) Statistics
- 68Number of bridges
- 627ft / 191mTotal length
- $2,076,000Total costs
- 710,940Total average daily traffic
- 49,805Total average daily truck traffic
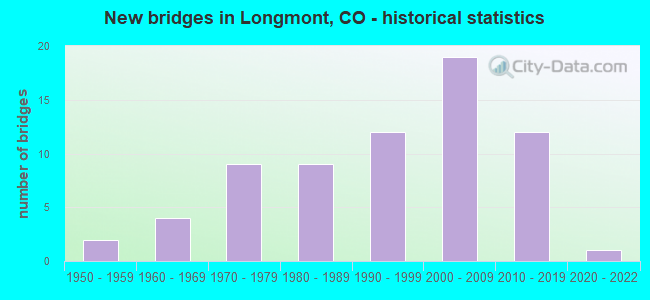
- New bridges - historical statistics
- 21950-1959
- 41960-1969
- 91970-1979
- 91980-1989
- 121990-1999
- 192000-2009
- 122010-2019
- 12020-2022
FCC Registered Antenna Towers: 115 (See the full list of FCC Registered Antenna Towers)
FCC Registered Commercial Land Mobile Towers: 1 (See the full list of FCC Registered Commercial Land Mobile Towers in Longmont, CO)
FCC Registered Private Land Mobile Towers: 4 (See the full list of FCC Registered Private Land Mobile Towers)
FCC Registered Broadcast Land Mobile Towers: 56 (See the full list of FCC Registered Broadcast Land Mobile Towers)
FCC Registered Microwave Towers: 92 (See the full list of FCC Registered Microwave Towers in this town)
FCC Registered Paging Towers: 6 (See the full list of FCC Registered Paging Towers)
FCC Registered Maritime Coast & Aviation Ground Towers: 4 (See the full list of FCC Registered Maritime Coast & Aviation Ground Towers)
FCC Registered Amateur Radio Licenses: 1,044 (See the full list of FCC Registered Amateur Radio Licenses in Longmont)
FAA Registered Aircraft Manufacturers and Dealers: 21 (See the full list of FAA Registered Manufacturers and Dealers in Longmont)
FAA Registered Aircraft: 229 (See the full list of FAA Registered Aircraft)
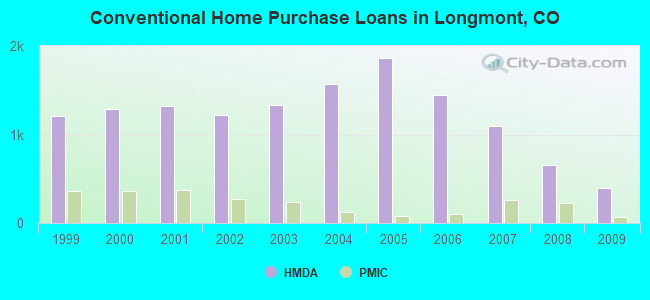
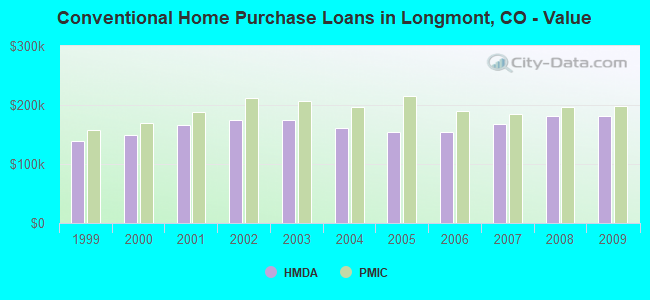
| Home Mortgage Disclosure Act Aggregated Statistics For Year 2009 (Based on 8 full and 6 partial tracts) | ||||||||||||||
| A) FHA, FSA/RHS & VA Home Purchase Loans | B) Conventional Home Purchase Loans | C) Refinancings | D) Home Improvement Loans | E) Loans on Dwellings For 5+ Families | F) Non-occupant Loans on < 5 Family Dwellings (A B C & D) | G) Loans On Manufactured Home Dwelling (A B C & D) | ||||||||
|---|---|---|---|---|---|---|---|---|---|---|---|---|---|---|
| Number | Average Value | Number | Average Value | Number | Average Value | Number | Average Value | Number | Average Value | Number | Average Value | Number | Average Value | |
| LOANS ORIGINATED | 401 | $191,202 | 392 | $180,826 | 1,918 | $193,001 | 53 | $85,733 | 3 | $1,186,410 | 162 | $146,239 | 1 | $15,000 |
| APPLICATIONS APPROVED, NOT ACCEPTED | 25 | $191,038 | 26 | $168,454 | 156 | $189,787 | 12 | $53,719 | 1 | $611,740 | 11 | $108,022 | 0 | $0 |
| APPLICATIONS DENIED | 46 | $181,753 | 67 | $135,646 | 401 | $208,375 | 46 | $43,063 | 2 | $76,665 | 40 | $111,331 | 28 | $54,428 |
| APPLICATIONS WITHDRAWN | 45 | $174,957 | 51 | $202,646 | 404 | $195,911 | 11 | $60,385 | 0 | $0 | 36 | $140,887 | 0 | $0 |
| FILES CLOSED FOR INCOMPLETENESS | 7 | $179,630 | 4 | $142,518 | 109 | $204,281 | 1 | $128,500 | 0 | $0 | 8 | $151,616 | 0 | $0 |
Detailed mortgage data for all 14 tracts in Longmont, CO
| Private Mortgage Insurance Companies Aggregated Statistics For Year 2009 (Based on 8 full and 6 partial tracts) | ||||||
| A) Conventional Home Purchase Loans | B) Refinancings | C) Non-occupant Loans on < 5 Family Dwellings (A & B) | ||||
|---|---|---|---|---|---|---|
| Number | Average Value | Number | Average Value | Number | Average Value | |
| LOANS ORIGINATED | 64 | $198,317 | 86 | $216,033 | 2 | $158,330 |
| APPLICATIONS APPROVED, NOT ACCEPTED | 18 | $212,285 | 19 | $235,364 | 2 | $145,355 |
| APPLICATIONS DENIED | 7 | $228,436 | 14 | $206,258 | 0 | $0 |
| APPLICATIONS WITHDRAWN | 1 | $218,970 | 5 | $232,562 | 0 | $0 |
| FILES CLOSED FOR INCOMPLETENESS | 3 | $180,187 | 4 | $217,378 | 2 | $148,000 |
2004 - 2018 National Fire Incident Reporting System (NFIRS) incidents
- Fire incident types reported to NFIRS in Longmont, CO
- 1,45945.8%Outside Fires
- 91728.8%Structure Fires
- 45114.2%Other
- 35911.3%Mobile Property/Vehicle Fires
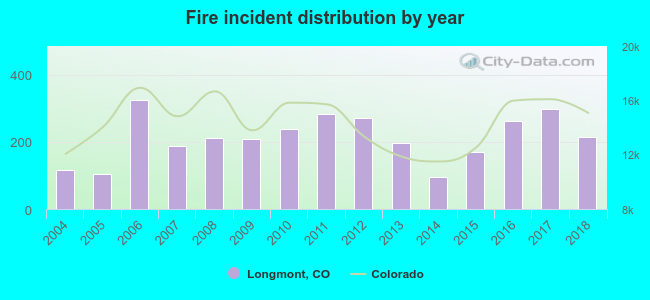 Based on the data from the years 2004 - 2018 the average number of fires per year is 212. The highest number of fires - 324 took place in 2006, and the least - 96 in 2014. The data has an increasing trend.
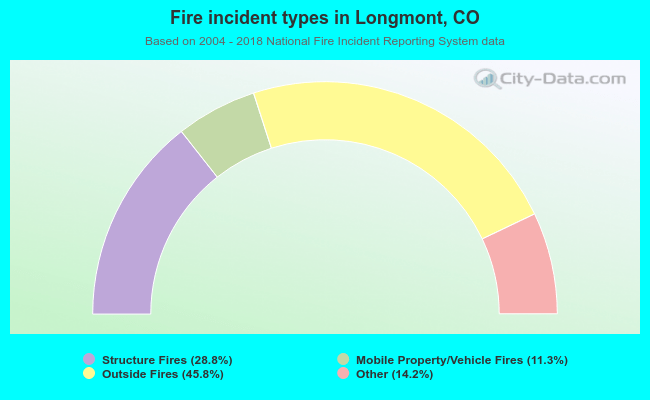 When looking into fire subcategories, the most incidents belonged to: Outside Fires (45.8%), and Structure Fires (28.8%).
Fire-safe hotels and motels in Longmont, Colorado:
- Best Western Plus Plaza Hotel, 1900 Ken Pratt Blvd, Longmont, Colorado 80501 , Phone: (303) 776-2000, Fax: (303) 678-7631
- Comfort Inn Longmont, 10811 W I-75 Frontage Rd, Longmont, Colorado 80504 , Phone: (303) 684-6779, Fax: (303) 684-6779
- Hampton Inn, 850 S Main, Longmont, Colorado 80501 , Phone: (303) 772-2554, Fax: (303) 772-2698
- Springhill Suites Boulder Longmont, 1470 Dry Creek Dr, Longmont, Colorado 80503 , Phone: (303) 682-2894, Fax: (303) 682-2897
- Longmont Lodging Group, LLC Dba Holiday Inn Express Hotel And Suites, 1355 Dry Creek Dr, Longmont, Colorado 80501 , Phone: (303) 684-0404
- Best Western Firestone Inn & Suites, 11228 Business Park Cir, Longmont, Colorado 80504 , Phone: (720) 494-1925, Fax: (720) 494-7355
- Days Inn, 3820 Hwy 119, Longmont, Colorado 80504 , Phone: (303) 651-6999
- Candlewood Suites, 1340 Dry Creek Dr, Longmont, Colorado 80503 , Phone: (605) 225-1712
- 5 other hotels and motels
| Most common first names in Longmont, CO among deceased individuals | ||
| Name | Count | Lived (average) |
|---|---|---|
| Mary | 295 | 80.3 years |
| John | 268 | 76.8 years |
| William | 261 | 75.2 years |
| Robert | 252 | 71.8 years |
| James | 185 | 70.9 years |
| Helen | 162 | 81.4 years |
| Charles | 157 | 76.1 years |
| George | 146 | 78.2 years |
| Dorothy | 140 | 79.3 years |
| Margaret | 137 | 81.2 years |
| Most common last names in Longmont, CO among deceased individuals | ||
| Last name | Count | Lived (average) |
|---|---|---|
| Smith | 128 | 76.7 years |
| Johnson | 115 | 78.3 years |
| Jones | 73 | 79.6 years |
| Anderson | 71 | 75.6 years |
| Miller | 71 | 74.9 years |
| Nelson | 60 | 79.2 years |
| Brown | 59 | 78.5 years |
| Davis | 54 | 79.1 years |
| Martinez | 42 | 70.1 years |
| Williams | 38 | 81.8 years |
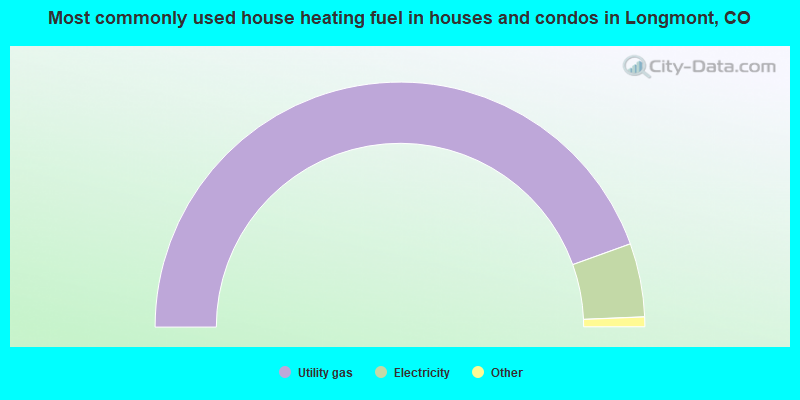
- 89.0%Utility gas
- 9.7%Electricity
- 0.8%Bottled, tank, or LP gas
- 0.3%Wood
- 0.2%Solar energy
- 0.1%Other fuel
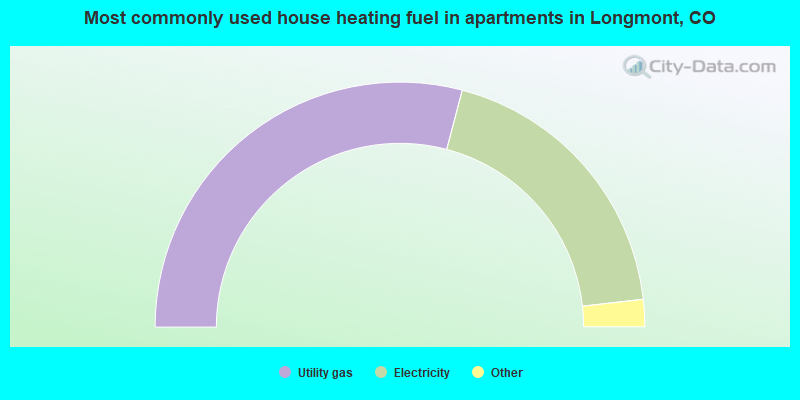
- 58.2%Utility gas
- 38.2%Electricity
- 1.5%Bottled, tank, or LP gas
- 1.1%Other fuel
- 0.7%No fuel used
- 0.1%Coal or coke
- 0.1%Wood
Longmont compared to Colorado state average:
- Unemployed percentage significantly below state average.
- Black race population percentage significantly below state average.
Longmont on our top lists:
- #7 on the list of "Top 101 cities with the largest racial income disparity between any two races with at least 200 householders"
- #15 on the list of "Top 101 cities with largest percentage of females in industries: management of companies and enterprises (population 50,000+)"
- #20 on the list of "Top 101 cities with the largest differences between daily high and daily low temperatures (population 50,000+)"
- #22 on the list of "Top 100 highest located cities (pop. 50,000+)"
- #25 on the list of "Top 101 cities with the smallest sunshine amount differences during a year (population 50,000+)"
- #28 on the list of "Top 101 cities with the highest number of arson incidents per 100,000 residents, excludes tourist destinations and others with a lot of outsiders visiting based on city industries data (population 50,000+)"
- #28 on the list of "Top 101 cities with the highest average snowfall in a year (population 50,000+)"
- #38 on the list of "Top 101 cities with the highest average wind speeds (population 50,000+)"
- #41 on the list of "Top 101 cities with largest percentage of males in occupations: architecture and engineering occupations (population 50,000+)"
- #53 on the list of "Top 101 cities with the lowest maximum monthly morning or afternoon humidity (population 50,000+)"
- #60 on the list of "Top 101 cities with the lowest daily low temperatures (population 50,000+)"
- #61 on the list of "Top 101 cities with the lowest average humidity (population 50,000+)"
- #71 on the list of "Top 101 cities with largest percentage of females in industries: administrative and support and waste management services (population 50,000+)"
- #80 on the list of "Top 101 cities with largest percentage of females in occupations: management occupations (population 50,000+)"
- #80 on the list of "Top 101 cities with largest percentage of females in occupations: life, physical, and social science occupations (population 50,000+)"
- #82 on the list of "Top 101 cities with largest percentage of females in industries: manufacturing (population 50,000+)"
- #97 on the list of "Top 101 cities with largest percentage of females in occupations: construction laborers (population 50,000+)"
- #97 on the list of "Top 101 cities with largest percentage of females in industries: warehousing and storage (population 50,000+)"
- #98 on the list of "Top 101 cities with largest percentage of females in industries: petroleum and petroleum products merchant wholesalers (population 50,000+)"
- #98 on the list of "Top 101 cities with largest percentage of females in industries: music stores (population 50,000+)"
- #2 on the list of "Top 101 counties with the highest percentage of residents that exercised in the past month"
- #4 on the list of "Top 101 counties with the lowest average weight of females"
- #5 on the list of "Top 101 counties with the lowest number of infant deaths per 1000 residents 2007-2013 (pop. 50,000+)"
- #5 on the list of "Top 101 counties with the largest decrease in the number of infant deaths per 1000 residents 2000-2006 to 2007-2013 (pop. 50,000+)"
- #7 on the list of "Top 101 counties with the best general health status score of residents (1-5), 3 years of data"

|
|
Total of 4204 patent applications in 2008-2024.