Lynden, Washington Submit your own pictures of this city and show them to the world
OSM Map
General Map
Google Map
MSN Map
OSM Map
General Map
Google Map
MSN Map
OSM Map
General Map
Google Map
MSN Map
OSM Map
General Map
Google Map
MSN Map
Please wait while loading the map...
Population in 2022: 16,175 (98% urban, 2% rural). Population change since 2000: +79.3%Males: 8,049 Females: 8,126
March 2022 cost of living index in Lynden: 100.7 (near average, U.S. average is 100) Percentage of residents living in poverty in 2022: 7.1%for White Non-Hispanic residents , 11.6% for Hispanic or Latino residents , 13.3% for American Indian residents , 1.1% for other race residents , 7.5% for two or more races residents )
Profiles of local businesses
Business Search - 14 Million verified businesses
Data:
Median household income ($)
Median household income (% change since 2000)
Household income diversity
Ratio of average income to average house value (%)
Ratio of average income to average rent
Median household income ($) - White
Median household income ($) - Black or African American
Median household income ($) - Asian
Median household income ($) - Hispanic or Latino
Median household income ($) - American Indian and Alaska Native
Median household income ($) - Multirace
Median household income ($) - Other Race
Median household income for houses/condos with a mortgage ($)
Median household income for apartments without a mortgage ($)
Races - White alone (%)
Races - White alone (% change since 2000)
Races - Black alone (%)
Races - Black alone (% change since 2000)
Races - American Indian alone (%)
Races - American Indian alone (% change since 2000)
Races - Asian alone (%)
Races - Asian alone (% change since 2000)
Races - Hispanic (%)
Races - Hispanic (% change since 2000)
Races - Native Hawaiian and Other Pacific Islander alone (%)
Races - Native Hawaiian and Other Pacific Islander alone (% change since 2000)
Races - Two or more races (%)
Races - Two or more races (% change since 2000)
Races - Other race alone (%)
Races - Other race alone (% change since 2000)
Racial diversity
Unemployment (%)
Unemployment (% change since 2000)
Unemployment (%) - White
Unemployment (%) - Black or African American
Unemployment (%) - Asian
Unemployment (%) - Hispanic or Latino
Unemployment (%) - American Indian and Alaska Native
Unemployment (%) - Multirace
Unemployment (%) - Other Race
Population density (people per square mile)
Population - Males (%)
Population - Females (%)
Population - Males (%) - White
Population - Males (%) - Black or African American
Population - Males (%) - Asian
Population - Males (%) - Hispanic or Latino
Population - Males (%) - American Indian and Alaska Native
Population - Males (%) - Multirace
Population - Males (%) - Other Race
Population - Females (%) - White
Population - Females (%) - Black or African American
Population - Females (%) - Asian
Population - Females (%) - Hispanic or Latino
Population - Females (%) - American Indian and Alaska Native
Population - Females (%) - Multirace
Population - Females (%) - Other Race
Coronavirus confirmed cases (Apr 27, 2024)
Deaths caused by coronavirus (Apr 27, 2024)
Coronavirus confirmed cases (per 100k population) (Apr 27, 2024)
Deaths caused by coronavirus (per 100k population) (Apr 27, 2024)
Daily increase in number of cases (Apr 27, 2024)
Weekly increase in number of cases (Apr 27, 2024)
Cases doubled (in days) (Apr 27, 2024)
Hospitalized patients (Apr 18, 2022)
Negative test results (Apr 18, 2022)
Total test results (Apr 18, 2022)
COVID Vaccine doses distributed (per 100k population) (Sep 19, 2023)
COVID Vaccine doses administered (per 100k population) (Sep 19, 2023)
COVID Vaccine doses distributed (Sep 19, 2023)
COVID Vaccine doses administered (Sep 19, 2023)
Likely homosexual households (%)
Likely homosexual households (% change since 2000)
Likely homosexual households - Lesbian couples (%)
Likely homosexual households - Lesbian couples (% change since 2000)
Likely homosexual households - Gay men (%)
Likely homosexual households - Gay men (% change since 2000)
Cost of living index
Median gross rent ($)
Median contract rent ($)
Median monthly housing costs ($)
Median house or condo value ($)
Median house or condo value ($ change since 2000)
Mean house or condo value by units in structure - 1, detached ($)
Mean house or condo value by units in structure - 1, attached ($)
Mean house or condo value by units in structure - 2 ($)
Mean house or condo value by units in structure by units in structure - 3 or 4 ($)
Mean house or condo value by units in structure - 5 or more ($)
Mean house or condo value by units in structure - Boat, RV, van, etc. ($)
Mean house or condo value by units in structure - Mobile home ($)
Median house or condo value ($) - White
Median house or condo value ($) - Black or African American
Median house or condo value ($) - Asian
Median house or condo value ($) - Hispanic or Latino
Median house or condo value ($) - American Indian and Alaska Native
Median house or condo value ($) - Multirace
Median house or condo value ($) - Other Race
Median resident age
Resident age diversity
Median resident age - Males
Median resident age - Females
Median resident age - White
Median resident age - Black or African American
Median resident age - Asian
Median resident age - Hispanic or Latino
Median resident age - American Indian and Alaska Native
Median resident age - Multirace
Median resident age - Other Race
Median resident age - Males - White
Median resident age - Males - Black or African American
Median resident age - Males - Asian
Median resident age - Males - Hispanic or Latino
Median resident age - Males - American Indian and Alaska Native
Median resident age - Males - Multirace
Median resident age - Males - Other Race
Median resident age - Females - White
Median resident age - Females - Black or African American
Median resident age - Females - Asian
Median resident age - Females - Hispanic or Latino
Median resident age - Females - American Indian and Alaska Native
Median resident age - Females - Multirace
Median resident age - Females - Other Race
Commute - mean travel time to work (minutes)
Travel time to work - Less than 5 minutes (%)
Travel time to work - Less than 5 minutes (% change since 2000)
Travel time to work - 5 to 9 minutes (%)
Travel time to work - 5 to 9 minutes (% change since 2000)
Travel time to work - 10 to 19 minutes (%)
Travel time to work - 10 to 19 minutes (% change since 2000)
Travel time to work - 20 to 29 minutes (%)
Travel time to work - 20 to 29 minutes (% change since 2000)
Travel time to work - 30 to 39 minutes (%)
Travel time to work - 30 to 39 minutes (% change since 2000)
Travel time to work - 40 to 59 minutes (%)
Travel time to work - 40 to 59 minutes (% change since 2000)
Travel time to work - 60 to 89 minutes (%)
Travel time to work - 60 to 89 minutes (% change since 2000)
Travel time to work - 90 or more minutes (%)
Travel time to work - 90 or more minutes (% change since 2000)
Marital status - Never married (%)
Marital status - Now married (%)
Marital status - Separated (%)
Marital status - Widowed (%)
Marital status - Divorced (%)
Median family income ($)
Median family income (% change since 2000)
Median non-family income ($)
Median non-family income (% change since 2000)
Median per capita income ($)
Median per capita income (% change since 2000)
Median family income ($) - White
Median family income ($) - Black or African American
Median family income ($) - Asian
Median family income ($) - Hispanic or Latino
Median family income ($) - American Indian and Alaska Native
Median family income ($) - Multirace
Median family income ($) - Other Race
Median year house/condo built
Median year apartment built
Year house built - Built 2005 or later (%)
Year house built - Built 2000 to 2004 (%)
Year house built - Built 1990 to 1999 (%)
Year house built - Built 1980 to 1989 (%)
Year house built - Built 1970 to 1979 (%)
Year house built - Built 1960 to 1969 (%)
Year house built - Built 1950 to 1959 (%)
Year house built - Built 1940 to 1949 (%)
Year house built - Built 1939 or earlier (%)
Average household size
Household density (households per square mile)
Average household size - White
Average household size - Black or African American
Average household size - Asian
Average household size - Hispanic or Latino
Average household size - American Indian and Alaska Native
Average household size - Multirace
Average household size - Other Race
Occupied housing units (%)
Vacant housing units (%)
Owner occupied housing units (%)
Renter occupied housing units (%)
Vacancy status - For rent (%)
Vacancy status - For sale only (%)
Vacancy status - Rented or sold, not occupied (%)
Vacancy status - For seasonal, recreational, or occasional use (%)
Vacancy status - For migrant workers (%)
Vacancy status - Other vacant (%)
Residents with income below the poverty level (%)
Residents with income below 50% of the poverty level (%)
Children below poverty level (%)
Poor families by family type - Married-couple family (%)
Poor families by family type - Male, no wife present (%)
Poor families by family type - Female, no husband present (%)
Poverty status for native-born residents (%)
Poverty status for foreign-born residents (%)
Poverty among high school graduates not in families (%)
Poverty among people who did not graduate high school not in families (%)
Residents with income below the poverty level (%) - White
Residents with income below the poverty level (%) - Black or African American
Residents with income below the poverty level (%) - Asian
Residents with income below the poverty level (%) - Hispanic or Latino
Residents with income below the poverty level (%) - American Indian and Alaska Native
Residents with income below the poverty level (%) - Multirace
Residents with income below the poverty level (%) - Other Race
Air pollution - Air Quality Index (AQI)
Air pollution - CO
Air pollution - NO2
Air pollution - SO2
Air pollution - Ozone
Air pollution - PM10
Air pollution - PM25
Air pollution - Pb
Crime - Murders per 100,000 population
Crime - Rapes per 100,000 population
Crime - Robberies per 100,000 population
Crime - Assaults per 100,000 population
Crime - Burglaries per 100,000 population
Crime - Thefts per 100,000 population
Crime - Auto thefts per 100,000 population
Crime - Arson per 100,000 population
Crime - City-data.com crime index
Crime - Violent crime index
Crime - Property crime index
Crime - Murders per 100,000 population (5 year average)
Crime - Rapes per 100,000 population (5 year average)
Crime - Robberies per 100,000 population (5 year average)
Crime - Assaults per 100,000 population (5 year average)
Crime - Burglaries per 100,000 population (5 year average)
Crime - Thefts per 100,000 population (5 year average)
Crime - Auto thefts per 100,000 population (5 year average)
Crime - Arson per 100,000 population (5 year average)
Crime - City-data.com crime index (5 year average)
Crime - Violent crime index (5 year average)
Crime - Property crime index (5 year average)
1996 Presidential Elections Results (%) - Democratic Party (Clinton)
1996 Presidential Elections Results (%) - Republican Party (Dole)
1996 Presidential Elections Results (%) - Other
2000 Presidential Elections Results (%) - Democratic Party (Gore)
2000 Presidential Elections Results (%) - Republican Party (Bush)
2000 Presidential Elections Results (%) - Other
2004 Presidential Elections Results (%) - Democratic Party (Kerry)
2004 Presidential Elections Results (%) - Republican Party (Bush)
2004 Presidential Elections Results (%) - Other
2008 Presidential Elections Results (%) - Democratic Party (Obama)
2008 Presidential Elections Results (%) - Republican Party (McCain)
2008 Presidential Elections Results (%) - Other
2012 Presidential Elections Results (%) - Democratic Party (Obama)
2012 Presidential Elections Results (%) - Republican Party (Romney)
2012 Presidential Elections Results (%) - Other
2016 Presidential Elections Results (%) - Democratic Party (Clinton)
2016 Presidential Elections Results (%) - Republican Party (Trump)
2016 Presidential Elections Results (%) - Other
2020 Presidential Elections Results (%) - Democratic Party (Biden)
2020 Presidential Elections Results (%) - Republican Party (Trump)
2020 Presidential Elections Results (%) - Other
Ancestries Reported - Arab (%)
Ancestries Reported - Czech (%)
Ancestries Reported - Danish (%)
Ancestries Reported - Dutch (%)
Ancestries Reported - English (%)
Ancestries Reported - French (%)
Ancestries Reported - French Canadian (%)
Ancestries Reported - German (%)
Ancestries Reported - Greek (%)
Ancestries Reported - Hungarian (%)
Ancestries Reported - Irish (%)
Ancestries Reported - Italian (%)
Ancestries Reported - Lithuanian (%)
Ancestries Reported - Norwegian (%)
Ancestries Reported - Polish (%)
Ancestries Reported - Portuguese (%)
Ancestries Reported - Russian (%)
Ancestries Reported - Scotch-Irish (%)
Ancestries Reported - Scottish (%)
Ancestries Reported - Slovak (%)
Ancestries Reported - Subsaharan African (%)
Ancestries Reported - Swedish (%)
Ancestries Reported - Swiss (%)
Ancestries Reported - Ukrainian (%)
Ancestries Reported - United States (%)
Ancestries Reported - Welsh (%)
Ancestries Reported - West Indian (%)
Ancestries Reported - Other (%)
Educational Attainment - No schooling completed (%)
Educational Attainment - Less than high school (%)
Educational Attainment - High school or equivalent (%)
Educational Attainment - Less than 1 year of college (%)
Educational Attainment - 1 or more years of college (%)
Educational Attainment - Associate degree (%)
Educational Attainment - Bachelor's degree (%)
Educational Attainment - Master's degree (%)
Educational Attainment - Professional school degree (%)
Educational Attainment - Doctorate degree (%)
School Enrollment - Nursery, preschool (%)
School Enrollment - Kindergarten (%)
School Enrollment - Grade 1 to 4 (%)
School Enrollment - Grade 5 to 8 (%)
School Enrollment - Grade 9 to 12 (%)
School Enrollment - College undergrad (%)
School Enrollment - Graduate or professional (%)
School Enrollment - Not enrolled in school (%)
School enrollment - Public schools (%)
School enrollment - Private schools (%)
School enrollment - Not enrolled (%)
Median number of rooms in houses and condos
Median number of rooms in apartments
Housing units lacking complete plumbing facilities (%)
Housing units lacking complete kitchen facilities (%)
Density of houses
Urban houses (%)
Rural houses (%)
Households with people 60 years and over (%)
Households with people 65 years and over (%)
Households with people 75 years and over (%)
Households with one or more nonrelatives (%)
Households with no nonrelatives (%)
Population in households (%)
Family households (%)
Nonfamily households (%)
Population in families (%)
Family households with own children (%)
Median number of bedrooms in owner occupied houses
Mean number of bedrooms in owner occupied houses
Median number of bedrooms in renter occupied houses
Mean number of bedrooms in renter occupied houses
Median number of vehichles in owner occupied houses
Mean number of vehichles in owner occupied houses
Median number of vehichles in renter occupied houses
Mean number of vehichles in renter occupied houses
Mortgage status - with mortgage (%)
Mortgage status - with second mortgage (%)
Mortgage status - with home equity loan (%)
Mortgage status - with both second mortgage and home equity loan (%)
Mortgage status - without a mortgage (%)
Average family size
Average family size - White
Average family size - Black or African American
Average family size - Asian
Average family size - Hispanic or Latino
Average family size - American Indian and Alaska Native
Average family size - Multirace
Average family size - Other Race
Geographical mobility - Same house 1 year ago (%)
Geographical mobility - Moved within same county (%)
Geographical mobility - Moved from different county within same state (%)
Geographical mobility - Moved from different state (%)
Geographical mobility - Moved from abroad (%)
Place of birth - Born in state of residence (%)
Place of birth - Born in other state (%)
Place of birth - Native, outside of US (%)
Place of birth - Foreign born (%)
Housing units in structures - 1, detached (%)
Housing units in structures - 1, attached (%)
Housing units in structures - 2 (%)
Housing units in structures - 3 or 4 (%)
Housing units in structures - 5 to 9 (%)
Housing units in structures - 10 to 19 (%)
Housing units in structures - 20 to 49 (%)
Housing units in structures - 50 or more (%)
Housing units in structures - Mobile home (%)
Housing units in structures - Boat, RV, van, etc. (%)
House/condo owner moved in on average (years ago)
Renter moved in on average (years ago)
Year householder moved into unit - Moved in 1999 to March 2000 (%)
Year householder moved into unit - Moved in 1995 to 1998 (%)
Year householder moved into unit - Moved in 1990 to 1994 (%)
Year householder moved into unit - Moved in 1980 to 1989 (%)
Year householder moved into unit - Moved in 1970 to 1979 (%)
Year householder moved into unit - Moved in 1969 or earlier (%)
Means of transportation to work - Drove car alone (%)
Means of transportation to work - Carpooled (%)
Means of transportation to work - Public transportation (%)
Means of transportation to work - Bus or trolley bus (%)
Means of transportation to work - Streetcar or trolley car (%)
Means of transportation to work - Subway or elevated (%)
Means of transportation to work - Railroad (%)
Means of transportation to work - Ferryboat (%)
Means of transportation to work - Taxicab (%)
Means of transportation to work - Motorcycle (%)
Means of transportation to work - Bicycle (%)
Means of transportation to work - Walked (%)
Means of transportation to work - Other means (%)
Working at home (%)
Industry diversity
Most Common Industries - Agriculture, forestry, fishing and hunting, and mining (%)
Most Common Industries - Agriculture, forestry, fishing and hunting (%)
Most Common Industries - Mining, quarrying, and oil and gas extraction (%)
Most Common Industries - Construction (%)
Most Common Industries - Manufacturing (%)
Most Common Industries - Wholesale trade (%)
Most Common Industries - Retail trade (%)
Most Common Industries - Transportation and warehousing, and utilities (%)
Most Common Industries - Transportation and warehousing (%)
Most Common Industries - Utilities (%)
Most Common Industries - Information (%)
Most Common Industries - Finance and insurance, and real estate and rental and leasing (%)
Most Common Industries - Finance and insurance (%)
Most Common Industries - Real estate and rental and leasing (%)
Most Common Industries - Professional, scientific, and management, and administrative and waste management services (%)
Most Common Industries - Professional, scientific, and technical services (%)
Most Common Industries - Management of companies and enterprises (%)
Most Common Industries - Administrative and support and waste management services (%)
Most Common Industries - Educational services, and health care and social assistance (%)
Most Common Industries - Educational services (%)
Most Common Industries - Health care and social assistance (%)
Most Common Industries - Arts, entertainment, and recreation, and accommodation and food services (%)
Most Common Industries - Arts, entertainment, and recreation (%)
Most Common Industries - Accommodation and food services (%)
Most Common Industries - Other services, except public administration (%)
Most Common Industries - Public administration (%)
Occupation diversity
Most Common Occupations - Management, business, science, and arts occupations (%)
Most Common Occupations - Management, business, and financial occupations (%)
Most Common Occupations - Management occupations (%)
Most Common Occupations - Business and financial operations occupations (%)
Most Common Occupations - Computer, engineering, and science occupations (%)
Most Common Occupations - Computer and mathematical occupations (%)
Most Common Occupations - Architecture and engineering occupations (%)
Most Common Occupations - Life, physical, and social science occupations (%)
Most Common Occupations - Education, legal, community service, arts, and media occupations (%)
Most Common Occupations - Community and social service occupations (%)
Most Common Occupations - Legal occupations (%)
Most Common Occupations - Education, training, and library occupations (%)
Most Common Occupations - Arts, design, entertainment, sports, and media occupations (%)
Most Common Occupations - Healthcare practitioners and technical occupations (%)
Most Common Occupations - Health diagnosing and treating practitioners and other technical occupations (%)
Most Common Occupations - Health technologists and technicians (%)
Most Common Occupations - Service occupations (%)
Most Common Occupations - Healthcare support occupations (%)
Most Common Occupations - Protective service occupations (%)
Most Common Occupations - Fire fighting and prevention, and other protective service workers including supervisors (%)
Most Common Occupations - Law enforcement workers including supervisors (%)
Most Common Occupations - Food preparation and serving related occupations (%)
Most Common Occupations - Building and grounds cleaning and maintenance occupations (%)
Most Common Occupations - Personal care and service occupations (%)
Most Common Occupations - Sales and office occupations (%)
Most Common Occupations - Sales and related occupations (%)
Most Common Occupations - Office and administrative support occupations (%)
Most Common Occupations - Natural resources, construction, and maintenance occupations (%)
Most Common Occupations - Farming, fishing, and forestry occupations (%)
Most Common Occupations - Construction and extraction occupations (%)
Most Common Occupations - Installation, maintenance, and repair occupations (%)
Most Common Occupations - Production, transportation, and material moving occupations (%)
Most Common Occupations - Production occupations (%)
Most Common Occupations - Transportation occupations (%)
Most Common Occupations - Material moving occupations (%)
People in Group quarters - Institutionalized population (%)
People in Group quarters - Correctional institutions (%)
People in Group quarters - Federal prisons and detention centers (%)
People in Group quarters - Halfway houses (%)
People in Group quarters - Local jails and other confinement facilities (including police lockups) (%)
People in Group quarters - Military disciplinary barracks (%)
People in Group quarters - State prisons (%)
People in Group quarters - Other types of correctional institutions (%)
People in Group quarters - Nursing homes (%)
People in Group quarters - Hospitals/wards, hospices, and schools for the handicapped (%)
People in Group quarters - Hospitals/wards and hospices for chronically ill (%)
People in Group quarters - Hospices or homes for chronically ill (%)
People in Group quarters - Military hospitals or wards for chronically ill (%)
People in Group quarters - Other hospitals or wards for chronically ill (%)
People in Group quarters - Hospitals or wards for drug/alcohol abuse (%)
People in Group quarters - Mental (Psychiatric) hospitals or wards (%)
People in Group quarters - Schools, hospitals, or wards for the mentally retarded (%)
People in Group quarters - Schools, hospitals, or wards for the physically handicapped (%)
People in Group quarters - Institutions for the deaf (%)
People in Group quarters - Institutions for the blind (%)
People in Group quarters - Orthopedic wards and institutions for the physically handicapped (%)
People in Group quarters - Wards in general hospitals for patients who have no usual home elsewhere (%)
People in Group quarters - Wards in military hospitals for patients who have no usual home elsewhere (%)
People in Group quarters - Juvenile institutions (%)
People in Group quarters - Long-term care (%)
People in Group quarters - Homes for abused, dependent, and neglected children (%)
People in Group quarters - Residential treatment centers for emotionally disturbed children (%)
People in Group quarters - Training schools for juvenile delinquents (%)
People in Group quarters - Short-term care, detention or diagnostic centers for delinquent children (%)
People in Group quarters - Type of juvenile institution unknown (%)
People in Group quarters - Noninstitutionalized population (%)
People in Group quarters - College dormitories (includes college quarters off campus) (%)
People in Group quarters - Military quarters (%)
People in Group quarters - On base (%)
People in Group quarters - Barracks, unaccompanied personnel housing (UPH), (Enlisted/Officer), ;and similar group living quarters for military personnel (%)
People in Group quarters - Transient quarters for temporary residents (%)
People in Group quarters - Military ships (%)
People in Group quarters - Group homes (%)
People in Group quarters - Homes or halfway houses for drug/alcohol abuse (%)
People in Group quarters - Homes for the mentally ill (%)
People in Group quarters - Homes for the mentally retarded (%)
People in Group quarters - Homes for the physically handicapped (%)
People in Group quarters - Other group homes (%)
People in Group quarters - Religious group quarters (%)
People in Group quarters - Dormitories (%)
People in Group quarters - Agriculture workers' dormitories on farms (%)
People in Group quarters - Job Corps and vocational training facilities (%)
People in Group quarters - Other workers' dormitories (%)
People in Group quarters - Crews of maritime vessels (%)
People in Group quarters - Other nonhousehold living situations (%)
People in Group quarters - Other noninstitutional group quarters (%)
Residents speaking English at home (%)
Residents speaking English at home - Born in the United States (%)
Residents speaking English at home - Native, born elsewhere (%)
Residents speaking English at home - Foreign born (%)
Residents speaking Spanish at home (%)
Residents speaking Spanish at home - Born in the United States (%)
Residents speaking Spanish at home - Native, born elsewhere (%)
Residents speaking Spanish at home - Foreign born (%)
Residents speaking other language at home (%)
Residents speaking other language at home - Born in the United States (%)
Residents speaking other language at home - Native, born elsewhere (%)
Residents speaking other language at home - Foreign born (%)
Class of Workers - Employee of private company (%)
Class of Workers - Self-employed in own incorporated business (%)
Class of Workers - Private not-for-profit wage and salary workers (%)
Class of Workers - Local government workers (%)
Class of Workers - State government workers (%)
Class of Workers - Federal government workers (%)
Class of Workers - Self-employed workers in own not incorporated business and Unpaid family workers (%)
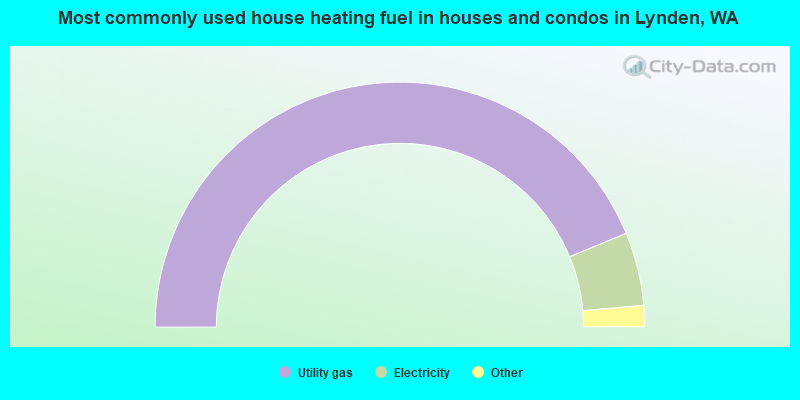
House heating fuel used in houses and condos - Utility gas (%)
House heating fuel used in houses and condos - Bottled, tank, or LP gas (%)
House heating fuel used in houses and condos - Electricity (%)
House heating fuel used in houses and condos - Fuel oil, kerosene, etc. (%)
House heating fuel used in houses and condos - Coal or coke (%)
House heating fuel used in houses and condos - Wood (%)
House heating fuel used in houses and condos - Solar energy (%)
House heating fuel used in houses and condos - Other fuel (%)
House heating fuel used in houses and condos - No fuel used (%)
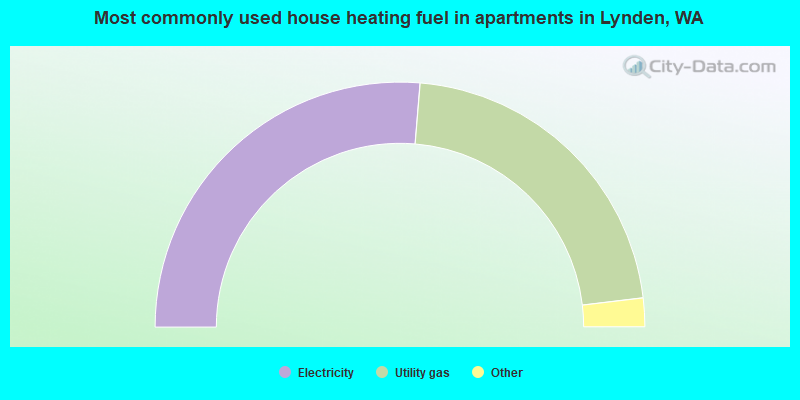
House heating fuel used in apartments - Utility gas (%)
House heating fuel used in apartments - Bottled, tank, or LP gas (%)
House heating fuel used in apartments - Electricity (%)
House heating fuel used in apartments - Fuel oil, kerosene, etc. (%)
House heating fuel used in apartments - Coal or coke (%)
House heating fuel used in apartments - Wood (%)
House heating fuel used in apartments - Solar energy (%)
House heating fuel used in apartments - Other fuel (%)
House heating fuel used in apartments - No fuel used (%)
Armed forces status - In Armed Forces (%)
Armed forces status - Civilian (%)
Armed forces status - Civilian - Veteran (%)
Armed forces status - Civilian - Nonveteran (%)
Fatal accidents locations in years 2005-2021
Fatal accidents locations in 2005
Fatal accidents locations in 2006
Fatal accidents locations in 2007
Fatal accidents locations in 2008
Fatal accidents locations in 2009
Fatal accidents locations in 2010
Fatal accidents locations in 2011
Fatal accidents locations in 2012
Fatal accidents locations in 2013
Fatal accidents locations in 2014
Fatal accidents locations in 2015
Fatal accidents locations in 2016
Fatal accidents locations in 2017
Fatal accidents locations in 2018
Fatal accidents locations in 2019
Fatal accidents locations in 2020
Fatal accidents locations in 2021
Alcohol use - People drinking some alcohol every month (%)
Alcohol use - People not drinking at all (%)
Alcohol use - Average days/month drinking alcohol
Alcohol use - Average drinks/week
Alcohol use - Average days/year people drink much
Audiometry - Average condition of hearing (%)
Audiometry - People that can hear a whisper from across a quiet room (%)
Audiometry - People that can hear normal voice from across a quiet room (%)
Audiometry - Ears ringing, roaring, buzzing (%)
Audiometry - Had a job exposure to loud noise (%)
Audiometry - Had off-work exposure to loud noise (%)
Blood Pressure & Cholesterol - Has high blood pressure (%)
Blood Pressure & Cholesterol - Checking blood pressure at home (%)
Blood Pressure & Cholesterol - Frequently checking blood cholesterol (%)
Blood Pressure & Cholesterol - Has high cholesterol level (%)
Consumer Behavior - Money monthly spent on food at supermarket/grocery store
Consumer Behavior - Money monthly spent on food at other stores
Consumer Behavior - Money monthly spent on eating out
Consumer Behavior - Money monthly spent on carryout/delivered foods
Consumer Behavior - Income spent on food at supermarket/grocery store (%)
Consumer Behavior - Income spent on food at other stores (%)
Consumer Behavior - Income spent on eating out (%)
Consumer Behavior - Income spent on carryout/delivered foods (%)
Current Health Status - General health condition (%)
Current Health Status - Blood donors (%)
Current Health Status - Has blood ever tested for HIV virus (%)
Current Health Status - Left-handed people (%)
Dermatology - People using sunscreen (%)
Diabetes - Diabetics (%)
Diabetes - Had a blood test for high blood sugar (%)
Diabetes - People taking insulin (%)
Diet Behavior & Nutrition - Diet health (%)
Diet Behavior & Nutrition - Milk product consumption (# of products/month)
Diet Behavior & Nutrition - Meals not home prepared (#/week)
Diet Behavior & Nutrition - Meals from fast food or pizza place (#/week)
Diet Behavior & Nutrition - Ready-to-eat foods (#/month)
Diet Behavior & Nutrition - Frozen meals/pizza (#/month)
Drug Use - People that ever used marijuana or hashish (%)
Drug Use - Ever used hard drugs (%)
Drug Use - Ever used any form of cocaine (%)
Drug Use - Ever used heroin (%)
Drug Use - Ever used methamphetamine (%)
Health Insurance - People covered by health insurance (%)
Kidney Conditions-Urology - Avg. # of times urinating at night
Medical Conditions - People with asthma (%)
Medical Conditions - People with anemia (%)
Medical Conditions - People with psoriasis (%)
Medical Conditions - People with overweight (%)
Medical Conditions - Elderly people having difficulties in thinking or remembering (%)
Medical Conditions - People who ever received blood transfusion (%)
Medical Conditions - People having trouble seeing even with glass/contacts (%)
Medical Conditions - People with arthritis (%)
Medical Conditions - People with gout (%)
Medical Conditions - People with congestive heart failure (%)
Medical Conditions - People with coronary heart disease (%)
Medical Conditions - People with angina pectoris (%)
Medical Conditions - People who ever had heart attack (%)
Medical Conditions - People who ever had stroke (%)
Medical Conditions - People with emphysema (%)
Medical Conditions - People with thyroid problem (%)
Medical Conditions - People with chronic bronchitis (%)
Medical Conditions - People with any liver condition (%)
Medical Conditions - People who ever had cancer or malignancy (%)
Mental Health - People who have little interest in doing things (%)
Mental Health - People feeling down, depressed, or hopeless (%)
Mental Health - People who have trouble sleeping or sleeping too much (%)
Mental Health - People feeling tired or having little energy (%)
Mental Health - People with poor appetite or overeating (%)
Mental Health - People feeling bad about themself (%)
Mental Health - People who have trouble concentrating on things (%)
Mental Health - People moving or speaking slowly or too fast (%)
Mental Health - People having thoughts they would be better off dead (%)
Oral Health - Average years since last visit a dentist
Oral Health - People embarrassed because of mouth (%)
Oral Health - People with gum disease (%)
Oral Health - General health of teeth and gums (%)
Oral Health - Average days a week using dental floss/device
Oral Health - Average days a week using mouthwash for dental problem
Oral Health - Average number of teeth
Pesticide Use - Households using pesticides to control insects (%)
Pesticide Use - Households using pesticides to kill weeds (%)
Physical Activity - People doing vigorous-intensity work activities (%)
Physical Activity - People doing moderate-intensity work activities (%)
Physical Activity - People walking or bicycling (%)
Physical Activity - People doing vigorous-intensity recreational activities (%)
Physical Activity - People doing moderate-intensity recreational activities (%)
Physical Activity - Average hours a day doing sedentary activities
Physical Activity - Average hours a day watching TV or videos
Physical Activity - Average hours a day using computer
Physical Functioning - People having limitations keeping them from working (%)
Physical Functioning - People limited in amount of work they can do (%)
Physical Functioning - People that need special equipment to walk (%)
Physical Functioning - People experiencing confusion/memory problems (%)
Physical Functioning - People requiring special healthcare equipment (%)
Prescription Medications - Average number of prescription medicines taking
Preventive Aspirin Use - Adults 40+ taking low-dose aspirin (%)
Reproductive Health - Vaginal deliveries (%)
Reproductive Health - Cesarean deliveries (%)
Reproductive Health - Deliveries resulted in a live birth (%)
Reproductive Health - Pregnancies resulted in a delivery (%)
Reproductive Health - Women breastfeeding newborns (%)
Reproductive Health - Women that had a hysterectomy (%)
Reproductive Health - Women that had both ovaries removed (%)
Reproductive Health - Women that have ever taken birth control pills (%)
Reproductive Health - Women taking birth control pills (%)
Reproductive Health - Women that have ever used Depo-Provera or injectables (%)
Reproductive Health - Women that have ever used female hormones (%)
Sexual Behavior - People 18+ that ever had sex (vaginal, anal, or oral) (%)
Sexual Behavior - Males 18+ that ever had vaginal sex with a woman (%)
Sexual Behavior - Males 18+ that ever performed oral sex on a woman (%)
Sexual Behavior - Males 18+ that ever had anal sex with a woman (%)
Sexual Behavior - Males 18+ that ever had any sex with a man (%)
Sexual Behavior - Females 18+ that ever had vaginal sex with a man (%)
Sexual Behavior - Females 18+ that ever performed oral sex on a man (%)
Sexual Behavior - Females 18+ that ever had anal sex with a man (%)
Sexual Behavior - Females 18+ that ever had any kind of sex with a woman (%)
Sexual Behavior - Average age people first had sex
Sexual Behavior - Average number of female sex partners in lifetime (males 18+)
Sexual Behavior - Average number of female vaginal sex partners in lifetime (males 18+)
Sexual Behavior - Average age people first performed oral sex on a woman (18+)
Sexual Behavior - Average number of woman performed oral sex on in lifetime (18+)
Sexual Behavior - Average number of male sex partners in lifetime (males 18+)
Sexual Behavior - Average number of male anal sex partners in lifetime (males 18+)
Sexual Behavior - Average age people first performed oral sex on a man (18+)
Sexual Behavior - Average number of male oral sex partners in lifetime (18+)
Sexual Behavior - People using protection when performing oral sex (%)
Sexual Behavior - Average number of times people have vaginal or anal sex a year
Sexual Behavior - People having sex without condom (%)
Sexual Behavior - Average number of male sex partners in lifetime (females 18+)
Sexual Behavior - Average number of male vaginal sex partners in lifetime (females 18+)
Sexual Behavior - Average number of female sex partners in lifetime (females 18+)
Sexual Behavior - Circumcised males 18+ (%)
Sleep Disorders - Average hours sleeping at night
Sleep Disorders - People that has trouble sleeping (%)
Smoking-Cigarette Use - People smoking cigarettes (%)
Taste & Smell - People 40+ having problems with smell (%)
Taste & Smell - People 40+ having problems with taste (%)
Taste & Smell - People 40+ that ever had wisdom teeth removed (%)
Taste & Smell - People 40+ that ever had tonsils teeth removed (%)
Taste & Smell - People 40+ that ever had a loss of consciousness because of a head injury (%)
Taste & Smell - People 40+ that ever had a broken nose or other serious injury to face or skull (%)
Taste & Smell - People 40+ that ever had two or more sinus infections (%)
Weight - Average height (inches)
Weight - Average weight (pounds)
Weight - Average BMI
Weight - People that are obese (%)
Weight - People that ever were obese (%)
Weight - People trying to lose weight (%)
According to our research of Washington and other state lists, there were 8 registered sex offenders living in Lynden, Washington as of April 27, 2024 . The ratio of all residents to sex offenders in Lynden is 1,706 to 1.The ratio of registered sex offenders to all residents in this city is lower than the state average.
Officers per 1,000 residents here:
1.08Washington average:
1.35
Latest news from Lynden, WA collected exclusively by city-data.com from local newspapers, TV, and radio stations
Ancestries: Dutch (25.4%), German (12.0%), American (6.8%), English (4.8%), Irish (4.4%), Norwegian (3.0%).
Current Local Time:
Land area: 4.08 square miles.
Population density: 3,961 people per square mile (average).
1,685 residents are foreign born (4.0% Latin America , 3.1% North America , 1.4% Asia ).
This city:
10.5%Washington:
14.9%
Median real estate property taxes paid for housing units with mortgages in 2022: $3,545 (0.6%)Median real estate property taxes paid for housing units with no mortgage in 2022: $3,741 (0.6%)
Nearest city with pop. 50,000+: Bellingham, WA
Nearest city with pop. 200,000+: Seattle, WA
Nearest city with pop. 1,000,000+: Los Angeles, CA
Nearest cities:
Latitude: 48.95 N, Longitude: 122.46 W
Daytime population change due to commuting: -545 (-3.4%)Workers who live and work in this city: 3,098 (39.8%)
Single-family new house construction building permits:
2022: 94 buildings , average cost: $385,4002021: 44 buildings , average cost: $416,7002020: 73 buildings , average cost: $300,5002019: 99 buildings , average cost: $288,0002018: 84 buildings , average cost: $258,7002017: 78 buildings , average cost: $257,0002016: 80 buildings , average cost: $237,0002015: 59 buildings , average cost: $245,5002014: 47 buildings , average cost: $226,6002013: 55 buildings , average cost: $221,4002012: 73 buildings , average cost: $232,0002011: 85 buildings , average cost: $212,2002010: 60 buildings , average cost: $176,8002009: 42 buildings , average cost: $193,4002008: 59 buildings , average cost: $168,9002007: 65 buildings , average cost: $202,8002006: 103 buildings , average cost: $200,6002005: 118 buildings , average cost: $206,0002004: 125 buildings , average cost: $162,8002003: 177 buildings , average cost: $154,8002002: 93 buildings , average cost: $158,8002001: 99 buildings , average cost: $130,6002000: 96 buildings , average cost: $124,6001999: 83 buildings , average cost: $113,9001998: 103 buildings , average cost: $114,6001997: 85 buildings , average cost: $108,400Unemployment in December 2023:
Population change in the 1990s: +3,041 (+50.9%).
Most common industries in Lynden, WA (%)
Both Males Females
Health care (10.8%)
Construction (10.1%)
Educational services (8.5%)
Religious, grantmaking, civic, professional, similar organizations (5.2%)
Accommodation & food services (5.0%)
Public administration (4.4%)
Agriculture, forestry, fishing & hunting (3.6%)
Construction (16.9%)
Public administration (5.6%)
Agriculture, forestry, fishing & hunting (5.0%)
Religious, grantmaking, civic, professional, similar organizations (4.7%)
Educational services (4.7%)
Truck transportation (4.5%)
Building material & garden equipment & supplies dealers (4.3%)
Health care (18.8%)
Educational services (13.0%)
Accommodation & food services (7.3%)
Religious, grantmaking, civic, professional, similar organizations (5.9%)
Finance & insurance (4.4%)
Administrative & support & waste management services (3.6%)
Food (3.1%)
Most common occupations in Lynden, WA (%)
Both Males Females
Preschool, kindergarten, elementary, and middle school teachers (4.5%)
Secretaries and administrative assistants (3.9%)
Other sales and related occupations, including supervisors (3.9%)
Other management occupations, except farmers and farm managers (3.8%)
Retail sales workers, except cashiers (3.7%)
Building and grounds cleaning and maintenance occupations (3.5%)
Driver/sales workers and truck drivers (3.3%)
Driver/sales workers and truck drivers (6.0%)
Other management occupations, except farmers and farm managers (5.6%)
Sales representatives, services, wholesale and manufacturing (4.9%)
Top executives (4.4%)
Religious workers (4.2%)
Building and grounds cleaning and maintenance occupations (3.8%)
Vehicle and mobile equipment mechanics, installers, and repairers (3.7%)
Preschool, kindergarten, elementary, and middle school teachers (8.2%)
Secretaries and administrative assistants (8.1%)
Other office and administrative support workers, including supervisors (5.5%)
Information and record clerks, except customer service representatives (5.3%)
Other sales and related occupations, including supervisors (4.6%)
Retail sales workers, except cashiers (4.4%)
Bookkeeping, accounting, and auditing clerks (3.8%)
Air pollution and air quality trends(lower is better)
AQI Ozone PM2.5
Earthquake activity:
Lynden-area historical earthquake activity is significantly above Washington state average. It is 932% greater than the overall U.S. average. On 4/13/1949 at 19:55:42, a magnitude 7.0 (7.0 UK, Class: Major, Intensity: VIII - XII) earthquake occurred 117.4 miles away from the city center, causing $80,000,000 total damage On 2/28/2001 at 18:54:32, a magnitude 6.8 (6.8 MD, Depth: 32.2 mi, Class: Strong, Intensity: VII - IX) earthquake occurred 125.0 miles away from the city center On 2/28/2001 at 18:54:32, a magnitude 6.8 (6.5 MB, 6.6 MS, 6.8 MW) earthquake occurred 128.5 miles away from Lynden center, causing $2,000,000,000 total damage and $305,000,000 insured lossesOn 4/29/1965 at 15:28:43, a magnitude 6.6 (6.6 UK) earthquake occurred 112.9 miles away from the city center, causing $28,000,000 total damage On 7/3/1999 at 01:43:54, a magnitude 5.8 (5.4 MB, 5.5 MS, 5.8 MW, 5.3 ME, Depth: 25.2 mi, Class: Moderate, Intensity: VI - VII) earthquake occurred 135.4 miles away from the city center On 5/3/1996 at 04:04:22, a magnitude 5.5 (5.2 MB, 5.3 MD, 5.5 ML, Depth: 2.5 mi) earthquake occurred 83.6 miles away from the city center Magnitude types: body-wave magnitude (MB), duration magnitude (MD), energy magnitude (ME), local magnitude (ML), surface-wave magnitude (MS), moment magnitude (MW) Natural disasters: The number of natural disasters in Whatcom County (21) is greater than the US average (15).Major Disasters (Presidential) Declared: 17Emergencies Declared: 1Floods: 13, Storms: 10, Mudslides: 7, Winter Storms: 5, Landslides: 4, Winds: 3, Snows: 2, Earthquake: 1, Fire: 1, Heavy Rain: 1, Hurricane: 1, Tornado: 1, Volcanic Eruption: 1, Other: 1 (Note: some incidents may be assigned to more than one category). Hospitals and medical centers in Lynden: CHRISTIAN HEALTH CARE CENTER (855 AARON DRIVE)
CHRISTIAN REST HOME (206 SOUTH BC AVE)
Other hospitals and medical centers near Lynden: PIONEER RIDGE HEALTH CARE (Nursing Home, about 10 miles away; FERNDALE, WA)
SUTTON GARDENS HEALTH CARE (Nursing Home, about 10 miles away; FERNDALE, WA)
NORTH CASCADES HEALTH AND REHABILITATION CENTER (Nursing Home, about 10 miles away; BELLINGHAM, WA)
WALGREENS INFUSION AND RESPIRATORY SERVICES (Home Health Center, about 11 miles away; BELLINGHAM, WA)
NOR BELL NURSING HOME (Nursing Home, about 12 miles away; BELLINGHAM, WA)
ALDERWOOD PARK CONV CTR LLC (Nursing Home, about 12 miles away; BELLINGHAM, WA)
MT BAKER KIDNEY CENTER (Dialysis Facility, about 12 miles away; BELLINGHAM, WA)
Airports located in Lynden: Amtrak station near Lynden: 16 miles: BELLINGHAM (401 HARRIS AVE.) Services: ticket office, partially wheelchair accessible, enclosed waiting area, public restrooms, public payphones, free short-term parking, free long-term parking, call for taxi service.
Colleges/universities with over 2000 students nearest to Lynden:
Whatcom Community College (about 11 miles; Bellingham, WA ; Full-time enrollment: 3,265)
Western Washington University (about 15 miles; Bellingham, WA ; FT enrollment: 13,875)
Skagit Valley College (about 36 miles; Mount Vernon, WA ; FT enrollment: 3,803)
Everett Community College (about 67 miles; Everett, WA ; FT enrollment: 5,818)
Peninsula College (about 74 miles; Port Angeles, WA ; FT enrollment: 2,012)
Edmonds Community College (about 79 miles; Lynnwood, WA ; FT enrollment: 7,271)
University of Washington-Bothell Campus (about 83 miles; Bothell, WA ; FT enrollment: 3,902)
Public high schools in Lynden:
Private high schools in Lynden: LYNDEN CHRISTIAN SCHOOL Students: 1,120, Location: 417 LYNCS DR, Grades: PK-12)
CORNERSTONE CHRISTIAN SCHOOL Students: 114, Location: 8872 NORTHWOOD RD, Grades: 1-12)
Public elementary/middle schools in Lynden:
Private elementary/middle schools in Lynden: EBENEZER CHRISTIAN SCHOOL Students: 112, Location: 9390 GUIDE MERIDIAN RD, Grades: PK-8)
COVENANT CHRISTIAN SCHOOL Students: 30, Location: 9088 NORTHWOOD RD, Grades: KG-8)
See full list of schools located in Lynden User-submitted facts and corrections:
Cornerstone Christian School (private)instituted 2001 8872 Northwood Rd. Lynden, Wa. 98264
Notable locations in Lynden: (A) , Lynden Station Park and Ride (B) , Homestead Farms Golf Resort (C) , Lynden Sewage Treatment Plant (D) , North Whatcom Fire and Rescue Station 71 Lynden (E) , Lynden Manor Assisted Living Residence (F) , Christian Health Care Center (G) , Meadow Greens Retirement Community (H) , Lynden Fire Department (I) , Lynden Pioneer Museum (J) , Lynden Library (K) . Display/hide their locations on the map
Shopping Center: (1) . Display/hide its location on the map
Churches in Lynden include: (A) , Protestant Reformed Church (B) , North County Christ the King Church (C) , Sonlight Community Christian Reformed Church (D) , First Reformed Church (E) , Church of the Nazarene (F) , Netherlands Reformed Church (G) , Bethel Christian Reformed Church (H) , Faith Reformed Church (I) . Display/hide their locations on the map
Cemeteries: (1) , Monumenta Cemetery (2) . Display/hide their locations on the map
Creek: (A) . Display/hide its location on the map
Tourist attraction:
Hotel:
Birthplace of: Harlan Kredit - Educator, Paul Hafford - College basketball player (Portland State Vikings), Yelkanum Seclamatan - Native leader.
Whatcom County has a predicted average indoor radon screening level less than 2 pCi/L (pico curies per liter) - Low Potential Drinking water stations with addresses in Lynden and their reported violations in the past:
DELTA WATER ASSOCIATION (Population served: 420, Groundwater):
Past health violations:
MCL, Single Sample - Between JAN-2014 and MAR-2014, Contaminant: Nitrate
MCL, Single Sample - Between OCT-2013 and DEC-2013, Contaminant: Nitrate
MCL, Single Sample - Between APR-2013 and JUN-2013, Contaminant: Nitrate. Follow-up actions: St Compliance achieved (JUL-01-2013)
MCL, Single Sample - Between JAN-2013 and MAR-2013, Contaminant: Nitrate. Follow-up actions: St Compliance achieved (JUL-01-2013)
MCL, Single Sample - Between JUL-2012 and SEP-2012, Contaminant: Nitrate. Follow-up actions: St Compliance achieved (OCT-01-2012)
MCL, Single Sample - Between JAN-2012 and MAR-2012, Contaminant: Nitrate. Follow-up actions: St Compliance achieved (APR-01-2012)
16 other older health violations
Past monitoring violations:
82 regular monitoring violations
Population served: 256, Groundwater):
Past monitoring violations:
One routine major monitoring violation
Population served: 250, Purch surface water):
Past monitoring violations:
One routine major monitoring violation
Population served: 110, Groundwater):
Past monitoring violations:
53 regular monitoring violations
Population served: 40, Groundwater):
Past monitoring violations:
Follow-up Or Routine LCR Tap M/R - In JAN-01-2006, Contaminant: Lead and Copper Rule. Follow-up actions: St Compliance achieved (DEC-31-2006)
5 routine major monitoring violations
2 regular monitoring violations
Population served: 40, Groundwater):
Past monitoring violations:
One routine major monitoring violation
Population served: 40, Groundwater):
Past health violations:
MCL, Single Sample - Between JAN-2013 and MAR-2013, Contaminant: Nitrate
MCL, Single Sample - Between JAN-2012 and DEC-2012, Contaminant: Nitrate
MCL, Single Sample - Between JAN-2011 and DEC-2011, Contaminant: Nitrate
MCL, Single Sample - Between JAN-2010 and DEC-2010, Contaminant: Nitrate
MCL, Single Sample - Between JAN-2009 and DEC-2009, Contaminant: Nitrate
MCL, Single Sample - Between JAN-2008 and DEC-2008, Contaminant: Nitrate
3 other older health violations
Past monitoring violations:
10 routine major monitoring violations
Average household size: This city:
2.6 peopleWashington:
2.5 people
Percentage of family households: This city:
70.7%Whole state:
64.4%
Percentage of households with unmarried partners: This city:
2.5%Whole state:
7.7%
Likely homosexual households (counted as self-reported same-sex unmarried-partner households)
Lesbian couples: 0.2% of all households Gay men: 0.1% of all households
People in group quarters in Lynden in 2010:
116 people in nursing facilities/skilled-nursing facilities
20 people in group homes intended for adults
19 people in emergency and transitional shelters (with sleeping facilities) for people experiencing homelessness
7 people in workers' group living quarters and job corps centers
people in other group homes in 2000people in other noninstitutional group quarters in 2000Banks with most branches in Lynden (2011 data):
Peoples Bank: Fairway Office, West Lynden Office, at 418 Grover Street. Info updated 2006/11/03: Bank assets: $1,224.9 mil, Deposits: $1,084.6 mil, local headquarters , positive income , Commercial Lending Specialization, 26 total offices , Holding Company: Peoples Bancorp
Wells Fargo Bank, National Association: Lynden Branch at 1780 Front Street, branch established on 1987/06/30. Info updated 2011/04/05: Bank assets: $1,161,490.0 mil, Deposits: $905,653.0 mil, headquarters in Sioux Falls, SD, positive income , 6395 total offices , Holding Company: Wells Fargo & Company
Union Bank, National Association: Lynden Branch at 8108 Guide Meridian Rd, branch established on 2005/05/02. Info updated 2011/09/01: Bank assets: $88,967.5 mil, Deposits: $65,286.4 mil, headquarters in San Francisco, CA, positive income , Commercial Lending Specialization, 403 total offices , Holding Company: Mitsubishi Ufj Financial Group, Inc.
Skagit State Bank: Birch Bay at 138 Birch Bay, branch established on 2003/08/04. Info updated 2006/10/18: Bank assets: $723.3 mil, Deposits: $620.5 mil, headquarters in Burlington, WA, positive income , Commercial Lending Specialization, 12 total offices , Holding Company: Skagit State Bancorp, Inc.
U.S. Bank National Association: Lynden Branch at 218 Front Street, branch established on 1979/12/10. Info updated 2012/01/30: Bank assets: $330,470.8 mil, Deposits: $236,091.5 mil, headquarters in Cincinnati, OH, positive income , 3121 total offices , Holding Company: U.S. Bancorp
Banner Bank: Lynden Branch at 1980 Kok Road, branch established on 1996/08/26. Info updated 2011/05/03: Bank assets: $4,048.2 mil, Deposits: $3,348.4 mil, headquarters in Walla Walla, WA, positive income , Commercial Lending Specialization, 87 total offices , Holding Company: Banner Corporation
Bank of the Pacific: Lynden at 1800 Front Street, branch established on 2002/12/16. Info updated 2006/11/03: Bank assets: $640.3 mil, Deposits: $548.4 mil, headquarters in Aberdeen, WA, positive income , Commercial Lending Specialization, 17 total offices , Holding Company: Pacific Financial Corporation
Sterling Savings Bank: Lynden Branch at 1794 Front Street, branch established on 1998/06/15. Info updated 2012/03/21: Bank assets: $9,207.8 mil, Deposits: $6,454.1 mil, headquarters in Spokane, WA, positive income , Commercial Lending Specialization, 192 total offices , Holding Company: Sterling Financial Corporation
Washington Federal: Lynden Branch at 300 Grover Street, branch established on 1979/11/09. Info updated 2011/12/19: Bank assets: $13,653.0 mil, Deposits: $8,905.8 mil, headquarters in Seattle, WA, positive income , Mortgage Lending Specialization, 174 total offices
For population 15 years and over in Lynden:
Never married: 23.8%Now married: 58.9%Separated: 0.5%Widowed: 7.1%Divorced: 9.7% For population 25 years and over in Lynden:
High school or higher: 93.9%Bachelor's degree or higher: 27.3%Graduate or professional degree: 8.7%Unemployed: 3.1%Mean travel time to work (commute): 19.0 minutes
Education Gini index (Inequality in education) Here:
9.8Washington average:
11.6
Religion statistics for Lynden, WA (based on Whatcom County data)
Religion Adherents Congregations Evangelical Protestant 25,842 105 Catholic 13,397 6 Mainline Protestant 9,859 39 Other 8,714 33 Orthodox 370 2 None 142,958 -
Source: Clifford Grammich, Kirk Hadaway, Richard Houseal, Dale E.Jones, Alexei Krindatch, Richie Stanley and Richard H.Taylor. 2012. 2010 U.S.Religion Census: Religious Congregations & Membership Study. Association of Statisticians of American Religious Bodies. Jones, Dale E., et al. 2002. Congregations and Membership in the United States 2000. Nashville, TN: Glenmary Research Center. Graphs represent county-level data
Food Environment Statistics: Number of grocery stores : 34This county :
1.77 / 10,000 pop.Washington :
2.06 / 10,000 pop.
Number of supercenters and club stores : 3Here :
0.16 / 10,000 pop.Washington :
0.19 / 10,000 pop.
Number of convenience stores (no gas) : 16Whatcom County :
0.83 / 10,000 pop.Washington :
1.18 / 10,000 pop.
Number of convenience stores (with gas) : 73Whatcom County :
3.80 / 10,000 pop.State :
2.67 / 10,000 pop.
Number of full-service restaurants : 184Whatcom County :
9.57 / 10,000 pop.Washington :
8.26 / 10,000 pop.
Adult diabetes rate : Whatcom County :
6.1%Washington :
7.7%
Adult obesity rate : This county :
23.1%Washington :
25.7%
Low-income preschool obesity rate : This county :
14.4%Washington :
13.9%
Health and Nutrition:
Average overall health of teeth and gums : Average BMI : This city:
28.4Washington:
28.4
People feeling badly about themselves : Here:
20.6%Washington:
20.9%
People not drinking alcohol at all : This city:
10.6%Washington:
10.5%
Average hours sleeping at night : General health condition : This city:
54.4%Washington:
56.8%
Average condition of hearing : Here:
76.7%Washington:
79.4%
More about Health and Nutrition of Lynden, WA Residents
Local government employment and payroll (March 2022)
Function
Full-time employees
Monthly full-time payroll
Average yearly full-time wage
Part-time employees
Monthly part-time payroll
Police Protection - Officers
15 $154,086 $123,269 0 $0 Firefighters
13 $134,292 $123,962 13 $8,800 Sewerage
12 $78,508 $78,508 0 $0 Water Supply
6 $43,639 $87,278 0 $0 Streets and Highways
6 $49,265 $98,530 0 $0 Parks and Recreation
6 $41,982 $83,964 0 $0 Other Government Administration
5 $62,420 $149,808 10 $33,872 Financial Administration
5 $37,718 $90,523 1 $3,472 Police - Other
4 $25,261 $75,783 0 $0 Housing and Community Development (Local)
2 $17,425 $104,550 0 $0 Judicial and Legal
2 $12,193 $73,158 1 $4,888 Other and Unallocable
1 $8,676 $104,112 0 $0 Fire - Other
1 $6,596 $79,152 0 $0
Totals for Government
78 $672,061 $103,394 25 $51,033
Lynden government finances - Expenditure in 2018 (per resident):
Construction - Regular Highways: $2,387,000 ($147.57)
Central Staff Services: $182,000 ($11.25)Parks and Recreation: $90,000 ($5.56)Current Operations - Sewerage: $2,945,000 ($182.07)
Police Protection: $2,420,000 ($149.61)Local Fire Protection: $2,184,000 ($135.02)Water Utilities: $2,049,000 ($126.68)Regular Highways: $1,182,000 ($73.08)Parks and Recreation: $965,000 ($59.66)Central Staff Services: $962,000 ($59.47)Financial Administration: $683,000 ($42.23)Judicial and Legal Services: $311,000 ($19.23)General - Other: $234,000 ($14.47)Housing and Community Development: $183,000 ($11.31)General Public Buildings: $177,000 ($10.94)Health - Other: $70,000 ($4.33)Air Transportation: $55,000 ($3.40)Libraries: $42,000 ($2.60)Solid Waste Management: $41,000 ($2.53)Public Welfare - Other: $20,000 ($1.24)Parking Facilities: $6,000 ($0.37)General - Interest on Debt: $530,000 ($32.77)
Intergovernmental to Local - Other - Local Fire Protection: $170,000 ($10.51)
Other - Correctional Institutions: $112,000 ($6.92)Other - General - Other: $86,000 ($5.32)Other - Financial Administration: $39,000 ($2.41)Other - Health - Other: $7,000 ($0.43)Other - Regular Highways: $6,000 ($0.37)Other - Housing and Community Development: $6,000 ($0.37)Other - Police Protection: $1,000 ($0.06)Other - Sewerage: $1,000 ($0.06)Other - Water Utilities: $1,000 ($0.06)Other Capital Outlay - Natural Resources - Other: $370,000 ($22.87)
Water Utilities: $355,000 ($21.95)Sewerage: $273,000 ($16.88)Police Protection: $105,000 ($6.49)General - Other: $85,000 ($5.26)Regular Highways: $82,000 ($5.07)Local Fire Protection: $43,000 ($2.66)Financial Administration: $11,000 ($0.68)Parks and Recreation: $5,000 ($0.31)Total Salaries and Wages: $6,177,000 ($381.89)
Water Utilities - Interest on Debt: $731,000 ($45.19)
Lynden government finances - Revenue in 2018 (per resident):
Charges - Sewerage: $4,694,000 ($290.20)
Other: $1,002,000 ($61.95)Regular Highways: $110,000 ($6.80)Local Intergovernmental - Other: $108,000 ($6.68)
Miscellaneous - Donations From Private Sources: $1,710,000 ($105.72)
Fines and Forfeits: $165,000 ($10.20)Sale of Property: $118,000 ($7.30)Special Assessments: $103,000 ($6.37)Rents: $101,000 ($6.24)General Revenue - Other: $73,000 ($4.51)Interest Earnings: $0 ($0.00)Revenue - Water Utilities: $4,465,000 ($276.04)
State Intergovernmental - Other: $760,000 ($46.99)
Highways: $676,000 ($41.79)General Local Government Support: $185,000 ($11.44)Health and Hospitals: $1,000 ($0.06)Tax - General Sales and Gross Receipts: $3,609,000 ($223.12)
Property: $3,274,000 ($202.41)Public Utilities Sales: $2,141,000 ($132.36)Documentary and Stock Transfer: $854,000 ($52.80)Other License: $545,000 ($33.69)Other Selective Sales: $81,000 ($5.01)Occupation and Business License - Other: $5,000 ($0.31)
Lynden government finances - Debt in 2018 (per resident):
Long Term Debt - Beginning Outstanding - Unspecified Public Purpose: $62,565,000 ($3868.01)
Outstanding Unspecified Public Purpose: $56,390,000 ($3486.24)Retired Unspecified Public Purpose: $15,396,000 ($951.84)Issue, Unspecified Public Purpose: $9,222,000 ($570.14)
Businesses in Lynden, WA
Name Count Name Count
Ace Hardware 1 McDonald's 1 Blockbuster 1 Nike 2 Burger King 1 RadioShack 1 Chevrolet 1 Rite Aid 1 Curves 1 Safeway 1 Dairy Queen 1 Sprint Nextel 1 FedEx 2 Starbucks 2 GNC 1 Subway 1 H&R Block 1 True Value 1 Jack In The Box 1 U-Haul 2 Little Caesars Pizza 1 UPS 4 MasterBrand Cabinets 2 Vons 1
Strongest AM radio stations in Lynden:
KRPI (1550 AM; 50 kW; FERNDALE, WA; Owner: BBC BROADCASTING, INC.)
KARI (550 AM; 25 kW; BLAINE, WA; Owner: WAY BROADCASTING, INC.)
KPUG (1170 AM; 10 kW; BELLINGHAM, WA; Owner: SAGA BROADCASTING, LLC)
KGMI (790 AM; 5 kW; BELLINGHAM, WA)
KAPS (660 AM; 10 kW; MOUNT VERNON, WA; Owner: VALLEY BROADCASTERS, INC.)
KBAI (930 AM; 1 kW; BELLINGHAM, WA; Owner: SAGA BROADCASTING, LLC)
KRKO (1380 AM; 50 kW; EVERETT, WA; Owner: S-R BROADCASTING, CO.)
KIXI (880 AM; 50 kW; MERCER ISLAND/SEATTL, WA; Owner: BELLEVUE RADIO, INC.)
KIRO (710 AM; 50 kW; SEATTLE, WA; Owner: ENTERCOM SEATTLE LICENSE, LLC)
KTTH (770 AM; 50 kW; SEATTLE, WA; Owner: ENTERCOM SEATTLE LICENSE, LLC)
KGNW (820 AM; 50 kW; BURIEN-SEATTLE, WA; Owner: INSPIRATION MEDIA, INC.)
KKOL (1300 AM; 50 kW; SEATTLE, WA; Owner: INSPIRATION MEDIA, INC.)
KOMO (1000 AM; 50 kW; SEATTLE, WA; Owner: FISHER BROADCASTING - SEATTLE RADIO, L.L.C.)
Strongest FM radio stations in Lynden:
K201FH (88.1 FM; BELLINGHAM, WA; Owner: CALVARY CHAPEL OF TWIN FALLS, INC.)
K210CN (89.9 FM; BELLINGHAM, WA; Owner: CALVARY CHAPEL OF TWIN FALLS, INC.)
KISM (92.9 FM; BELLINGHAM, WA; Owner: SAGA BROADCASTING, LLC)
KWPZ (106.5 FM; LYNDEN, WA; Owner: CRISTA MINISTRIES, INC.)
KAFE (104.3 FM; BELLINGHAM, WA; Owner: SAGA BROADCASTING, LLC)
KZAZ (91.7 FM; BELLINGHAM, WA; Owner: WASHINGTON STATE UNIVERSITY)
KUGS (89.3 FM; BELLINGHAM, WA; Owner: WESTERN WASHINGTON UNIVERSITY)
KSVR (91.7 FM; MOUNT VERNON, WA; Owner: BOARD OF TRUSTEES OF SKAGIT VALLEY COLLEGE)
K206CU (89.1 FM; MOUNT VERNON, WA; Owner: CALVARY CHAPEL OF TWIN FALLS, INC.)
TV broadcast stations around Lynden:
KBCB (Channel 24; BELLINGHAM, WA; Owner: WORLD TELEVISION OF WASHINGTON, LLC.)
K36BO (Channel 36; DEMING, WA; Owner: TV DISTRICT #1)
KVOS-TV (Channel 12; BELLINGHAM, WA; Owner: ACKERLEY MEDIA GROUP, INC.)
National Bridge Inventory (NBI) Statistics 37 Number of bridges479ft / 146m Total length $115,593,000 Total costs211,210 Total average daily traffic13,267 Total average daily truck traffic291,063 Total future (year 2038) average daily traffic
New bridges - historical statistics
3 1930-1939 4 1940-1949 9 1950-1959 1 1970-1979 1 1980-1989 4 1990-1999 11 2000-2009 4 2010-2019
See full National Bridge Inventory statistics for Lynden, WA
Home Mortgage Disclosure Act Aggregated Statistics For Year 2009(Based on 2 partial tracts) A) FHA, FSA/RHS & VA B) Conventional C) Refinancings D) Home Improvement Loans E) Loans on Dwellings For 5+ Families F) Non-occupant Loans on Number Average Value Number Average Value Number Average Value Number Average Value Number Average Value Number Average Value
LOANS ORIGINATED 24 $243,508 33 $240,596 209 $222,065 9 $179,507 1 $554,360 7 $213,413 APPLICATIONS APPROVED, NOT ACCEPTED 3 $201,680 3 $286,157 13 $222,635 1 $232,760 0 $0 0 $0 APPLICATIONS DENIED 3 $269,960 3 $257,397 41 $247,221 2 $152,015 0 $0 5 $184,358 APPLICATIONS WITHDRAWN 3 $297,473 8 $242,802 34 $228,913 1 $216,110 0 $0 2 $208,795 FILES CLOSED FOR INCOMPLETENESS 0 $0 2 $233,205 1 $273,520 1 $126,490 0 $0 1 $123,980
Aggregated Statistics For Year 2008(Based on 2 partial tracts) A) FHA, FSA/RHS & VA B) Conventional C) Refinancings D) Home Improvement Loans E) Loans on Dwellings For 5+ Families F) Non-occupant Loans on G) Loans On Manufactured Number Average Value Number Average Value Number Average Value Number Average Value Number Average Value Number Average Value Number Average Value
LOANS ORIGINATED 8 $227,789 51 $212,850 74 $251,289 8 $153,761 1 $342,030 18 $208,397 1 $160,910 APPLICATIONS APPROVED, NOT ACCEPTED 0 $0 5 $290,016 10 $223,092 0 $0 0 $0 0 $0 0 $0 APPLICATIONS DENIED 4 $272,905 5 $248,616 31 $217,146 1 $115,280 1 $3,642,440 5 $178,944 0 $0 APPLICATIONS WITHDRAWN 3 $259,920 7 $171,857 12 $228,935 1 $115,980 1 $977,240 2 $132,390 0 $0 FILES CLOSED FOR INCOMPLETENESS 0 $0 1 $117,170 4 $244,400 0 $0 0 $0 1 $207,890 0 $0
Aggregated Statistics For Year 2007(Based on 2 partial tracts) A) FHA, FSA/RHS & VA B) Conventional C) Refinancings D) Home Improvement Loans F) Non-occupant Loans on Number Average Value Number Average Value Number Average Value Number Average Value Number Average Value
LOANS ORIGINATED 3 $243,710 109 $195,080 75 $198,441 15 $163,831 24 $191,800 APPLICATIONS APPROVED, NOT ACCEPTED 0 $0 5 $173,266 11 $209,268 3 $95,710 4 $132,908 APPLICATIONS DENIED 0 $0 8 $257,424 33 $191,813 4 $57,480 10 $237,042 APPLICATIONS WITHDRAWN 0 $0 6 $197,493 21 $189,855 2 $218,855 4 $146,525 FILES CLOSED FOR INCOMPLETENESS 0 $0 3 $219,997 5 $187,816 0 $0 2 $168,350
Aggregated Statistics For Year 2006(Based on 2 partial tracts) A) FHA, FSA/RHS & VA B) Conventional C) Refinancings D) Home Improvement Loans F) Non-occupant Loans on G) Loans On Manufactured Number Average Value Number Average Value Number Average Value Number Average Value Number Average Value Number Average Value
LOANS ORIGINATED 3 $204,447 97 $193,404 72 $170,483 23 $84,957 24 $198,718 1 $103,680 APPLICATIONS APPROVED, NOT ACCEPTED 0 $0 10 $190,845 12 $228,234 2 $76,100 2 $273,185 0 $0 APPLICATIONS DENIED 0 $0 15 $186,999 31 $175,474 6 $117,447 5 $198,838 1 $39,980 APPLICATIONS WITHDRAWN 0 $0 12 $193,577 27 $183,314 1 $101,580 2 $284,365 0 $0 FILES CLOSED FOR INCOMPLETENESS 0 $0 1 $177,680 2 $305,030 2 $44,420 0 $0 0 $0
Aggregated Statistics For Year 2005(Based on 2 partial tracts) A) FHA, FSA/RHS & VA B) Conventional C) Refinancings D) Home Improvement Loans F) Non-occupant Loans on G) Loans On Manufactured Number Average Value Number Average Value Number Average Value Number Average Value Number Average Value Number Average Value
LOANS ORIGINATED 3 $208,940 158 $179,112 119 $176,715 18 $68,517 36 $178,487 2 $165,960 APPLICATIONS APPROVED, NOT ACCEPTED 0 $0 15 $140,995 8 $170,765 2 $82,315 3 $82,563 1 $41,750 APPLICATIONS DENIED 0 $0 18 $179,419 28 $188,456 7 $70,684 8 $138,001 1 $22,100 APPLICATIONS WITHDRAWN 0 $0 20 $211,372 28 $198,482 5 $91,032 1 $114,320 0 $0 FILES CLOSED FOR INCOMPLETENESS 0 $0 0 $0 7 $188,920 1 $42,640 1 $144,810 0 $0
Aggregated Statistics For Year 2004(Based on 2 partial tracts) A) FHA, FSA/RHS & VA B) Conventional C) Refinancings D) Home Improvement Loans F) Non-occupant Loans on G) Loans On Manufactured Number Average Value Number Average Value Number Average Value Number Average Value Number Average Value Number Average Value
LOANS ORIGINATED 3 $184,840 131 $150,639 113 $141,858 7 $54,936 28 $136,466 1 $166,970 APPLICATIONS APPROVED, NOT ACCEPTED 0 $0 7 $114,043 15 $160,977 0 $0 4 $116,632 0 $0 APPLICATIONS DENIED 1 $101,280 19 $128,213 24 $168,572 10 $37,721 5 $173,622 5 $73,070 APPLICATIONS WITHDRAWN 0 $0 12 $165,273 33 $164,208 0 $0 5 $163,342 1 $127,490 FILES CLOSED FOR INCOMPLETENESS 0 $0 0 $0 11 $165,148 1 $140,310 1 $151,030 0 $0
Aggregated Statistics For Year 2003(Based on 2 partial tracts) A) FHA, FSA/RHS & VA B) Conventional C) Refinancings D) Home Improvement Loans E) Loans on Dwellings For 5+ Families F) Non-occupant Loans on Number Average Value Number Average Value Number Average Value Number Average Value Number Average Value Number Average Value
LOANS ORIGINATED 18 $150,029 118 $135,793 256 $134,194 6 $30,912 1 $569,700 30 $119,537 APPLICATIONS APPROVED, NOT ACCEPTED 0 $0 6 $143,725 14 $163,839 1 $16,070 2 $447,310 4 $143,482 APPLICATIONS DENIED 0 $0 4 $99,058 40 $156,098 3 $14,413 0 $0 3 $108,257 APPLICATIONS WITHDRAWN 1 $173,220 10 $118,610 48 $141,619 0 $0 0 $0 3 $149,147 FILES CLOSED FOR INCOMPLETENESS 0 $0 2 $160,500 4 $127,582 1 $8,880 0 $0 0 $0
Aggregated Statistics For Year 1999(Based on 1 partial tract) A) FHA, FSA/RHS & VA B) Conventional C) Refinancings D) Home Improvement Loans F) Non-occupant Loans on Number Average Value Number Average Value Number Average Value Number Average Value Number Average Value
LOANS ORIGINATED 2 $132,995 20 $121,175 15 $112,695 3 $21,927 3 $94,160 APPLICATIONS APPROVED, NOT ACCEPTED 0 $0 1 $80,680 2 $95,330 1 $13,510 0 $0 APPLICATIONS DENIED 0 $0 3 $105,417 7 $110,289 2 $17,980 1 $67,180 APPLICATIONS WITHDRAWN 0 $0 1 $130,590 5 $97,996 1 $37,100 1 $52,530 FILES CLOSED FOR INCOMPLETENESS 0 $0 0 $0 1 $160,050 0 $0 0 $0
Detailed HMDA statistics for the following Tracts:
0103.02
, 0103.03
Private Mortgage Insurance Companies Aggregated Statistics For Year 2009(Based on 2 partial tracts) A) Conventional B) Refinancings Number Average Value Number Average Value
LOANS ORIGINATED 5 $260,286 8 $268,975 APPLICATIONS APPROVED, NOT ACCEPTED 3 $331,853 3 $259,710 APPLICATIONS DENIED 0 $0 4 $204,775 APPLICATIONS WITHDRAWN 0 $0 1 $231,870 FILES CLOSED FOR INCOMPLETENESS 0 $0 0 $0
Aggregated Statistics For Year 2008(Based on 2 partial tracts) A) Conventional B) Refinancings C) Non-occupant Loans on Number Average Value Number Average Value Number Average Value
LOANS ORIGINATED 11 $232,595 2 $323,610 2 $193,560 APPLICATIONS APPROVED, NOT ACCEPTED 0 $0 0 $0 0 $0 APPLICATIONS DENIED 1 $140,270 0 $0 1 $111,940 APPLICATIONS WITHDRAWN 0 $0 0 $0 0 $0 FILES CLOSED FOR INCOMPLETENESS 0 $0 0 $0 0 $0
Aggregated Statistics For Year 2007(Based on 2 partial tracts) A) Conventional B) Refinancings C) Non-occupant Loans on Number Average Value Number Average Value Number Average Value
LOANS ORIGINATED 19 $224,195 5 $369,102 1 $256,010 APPLICATIONS APPROVED, NOT ACCEPTED 0 $0 0 $0 0 $0 APPLICATIONS DENIED 0 $0 0 $0 0 $0 APPLICATIONS WITHDRAWN 1 $213,220 0 $0 1 $213,220 FILES CLOSED FOR INCOMPLETENESS 1 $263,380 0 $0 0 $0
Aggregated Statistics For Year 2006(Based on 2 partial tracts) A) Conventional B) Refinancings Number Average Value Number Average Value
LOANS ORIGINATED 4 $231,238 3 $344,750 APPLICATIONS APPROVED, NOT ACCEPTED 1 $240,290 1 $332,260 APPLICATIONS DENIED 1 $226,540 1 $320,710 APPLICATIONS WITHDRAWN 0 $0 1 $332,260 FILES CLOSED FOR INCOMPLETENESS 0 $0 0 $0
Aggregated Statistics For Year 2005(Based on 2 partial tracts) A) Conventional B) Refinancings C) Non-occupant Loans on Number Average Value Number Average Value Number Average Value
LOANS ORIGINATED 13 $201,149 4 $221,362 2 $274,960 APPLICATIONS APPROVED, NOT ACCEPTED 0 $0 0 $0 0 $0 APPLICATIONS DENIED 0 $0 0 $0 0 $0 APPLICATIONS WITHDRAWN 0 $0 0 $0 0 $0 FILES CLOSED FOR INCOMPLETENESS 0 $0 0 $0 0 $0
Aggregated Statistics For Year 2004(Based on 2 partial tracts) A) Conventional B) Refinancings C) Non-occupant Loans on D) Loans On Manufactured Number Average Value Number Average Value Number Average Value Number Average Value
LOANS ORIGINATED 21 $175,276 6 $235,292 3 $150,360 0 $0 APPLICATIONS APPROVED, NOT ACCEPTED 1 $134,690 3 $149,960 0 $0 1 $139,700 APPLICATIONS DENIED 0 $0 0 $0 0 $0 0 $0 APPLICATIONS WITHDRAWN 2 $132,815 0 $0 0 $0 0 $0 FILES CLOSED FOR INCOMPLETENESS 0 $0 0 $0 0 $0 0 $0
Aggregated Statistics For Year 2003(Based on 2 partial tracts) A) Conventional B) Refinancings C) Non-occupant Loans on Number Average Value Number Average Value Number Average Value
LOANS ORIGINATED 22 $157,560 18 $140,504 0 $0 APPLICATIONS APPROVED, NOT ACCEPTED 5 $135,228 2 $197,880 1 $84,400 APPLICATIONS DENIED 0 $0 0 $0 0 $0 APPLICATIONS WITHDRAWN 2 $144,810 0 $0 0 $0 FILES CLOSED FOR INCOMPLETENESS 0 $0 0 $0 0 $0
Aggregated Statistics For Year 1999(Based on 1 partial tract) A) Conventional B) Refinancings Number Average Value Number Average Value
LOANS ORIGINATED 5 $131,778 2 $120,895 APPLICATIONS APPROVED, NOT ACCEPTED 0 $0 0 $0 APPLICATIONS DENIED 0 $0 0 $0 APPLICATIONS WITHDRAWN 0 $0 0 $0 FILES CLOSED FOR INCOMPLETENESS 0 $0 0 $0
Detailed PMIC statistics for the following Tracts:
0103.02
, 0103.03 Fire-safe hotels and motels in Lynden, Washington:
Century House Bed & Breakfast, 401 S British Columbia Ave, Lynden, Washington 98264 Phone: (360) 354-2439
Homestead Farms Golf Resort & Convention Center, 115 E Homestead Blvd, Lynden, Washington 98264 Phone: (360) 354-1196, Fax: (360) 354-5614
All 2 fire-safe hotels and motels in Lynden, Washington
Most common first names in Lynden, WA among deceased individuals Name Count Lived (average)
John 122 79.2 years William 73 79.6 years Henry 47 80.8 years Robert 41 75.4 years Mary 40 83.3 years Alice 39 82.2 years Charles 34 81.8 years George 33 79.7 years Peter 32 79.2 years Gerrit 31 81.5 years
Most common last names in Lynden, WA among deceased individuals Last name Count Lived (average)
Smith 22 77.0 years Johnson 22 83.7 years Anderson 21 81.3 years Dejong 19 80.5 years Bajema 18 82.3 years Vandergriend 17 81.4 years Honcoop 17 75.6 years Stremler 16 77.1 years Bosman 15 78.5 years Devries 13 83.8 years
Lynden compared to Washington state average:
Unemployed percentage significantly below state average. Black race population percentage below state average. Hispanic race population percentage above state average. Median age above state average. House age below state average.
#25 on the list of "Top 101 cities with the most residents born in Netherlands (population 500+)"
#67 on the list of "Top 101 cities with the smallest percentage of likely homosexual households (counted as self-reported same-sex unmarried-partner households) (population 5,000+)"
#88 on the list of "Top 101 cities with the largest percentage of people in other group homes (population 1,000+)"
#84 (98264) on the list of "Top 101 zip codes with the largest percentage of Dutch first ancestries"
#7 on the list of "Top 101 counties with the lowest Ozone (1-hour) air pollution readings in 2012 (ppm)"
#8 on the list of "Top 101 counties with the lowest Particulate Matter (PM2.5 ) Annual air pollution readings in 2012 (µg/m3 )"
#42 on the list of "Top 101 counties with highest percentage of residents voting for 3rd party candidates in the 2012 Presidential Election (pop. 50,000+)"
Top Patent Applicants
David Dewaard (19)
Mary Macdonald (9)
Nathan J. Kaemingk (3)
David C. Dewaard (3)
Timothy Koetje (3)
Robert W. Duffy Cox (3)
Dave Dewaard (2)
Wiebe S. Vanderhoek (2)
Bryan J. Vanloo (2)
Steven M. Fleishman (2)
Total of 75 patent applications in 2008-2024.
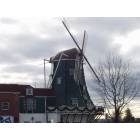
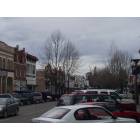
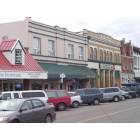
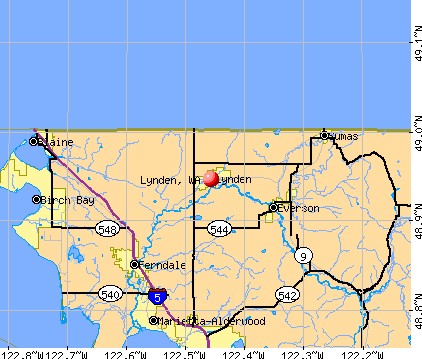


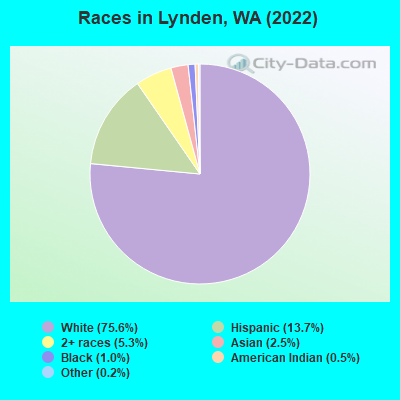
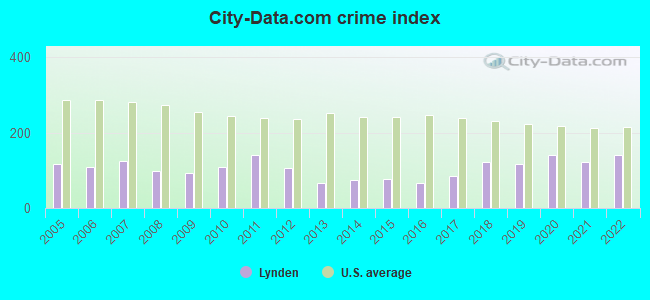
 Recent articles from our blog. Our writers, many of them Ph.D. graduates or candidates, create easy-to-read articles on a wide variety of topics.

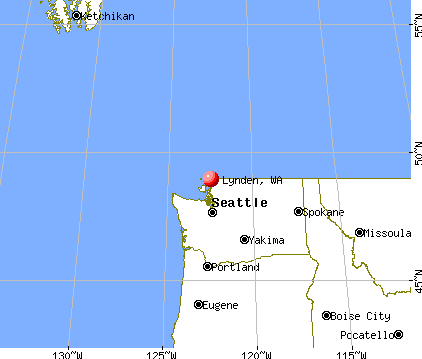
 (13.6 miles
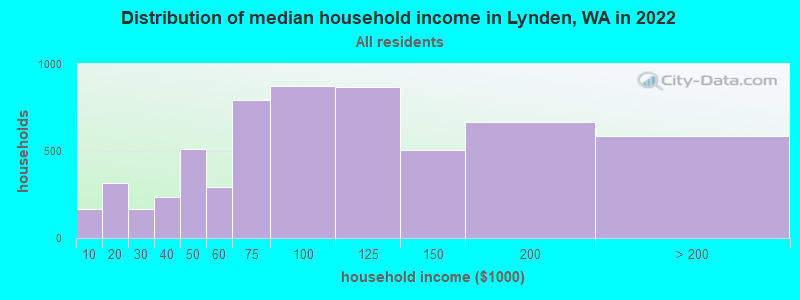
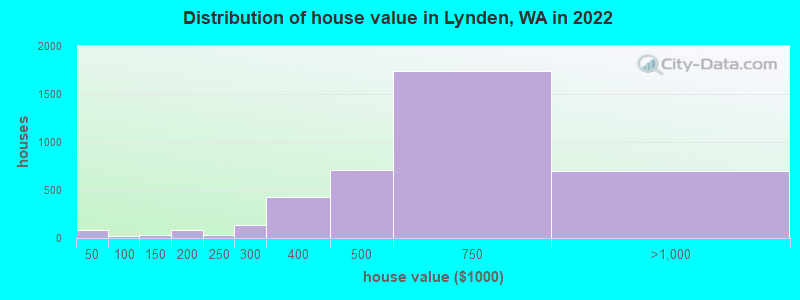
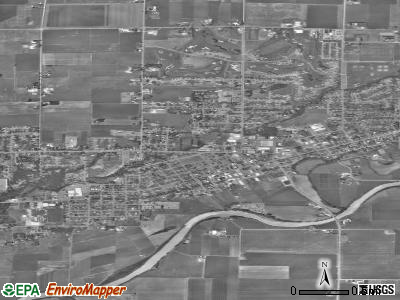
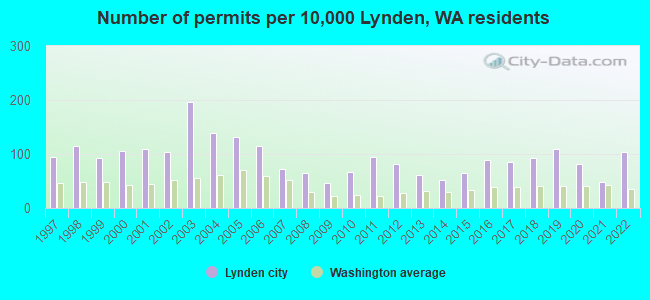
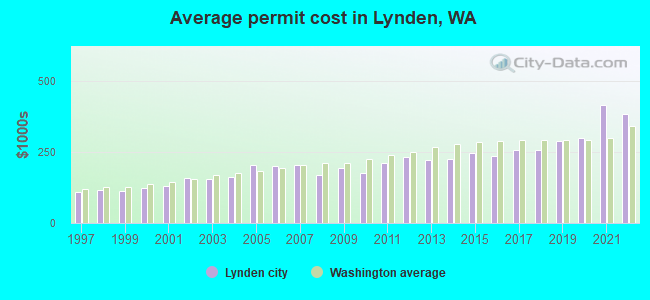
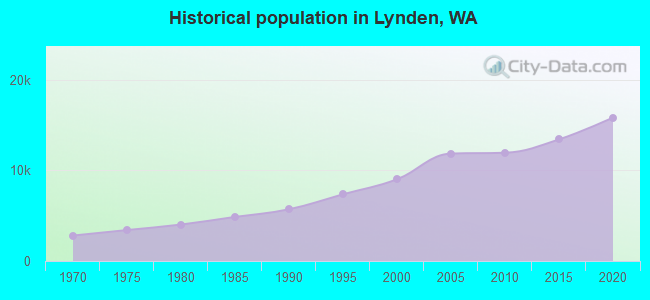
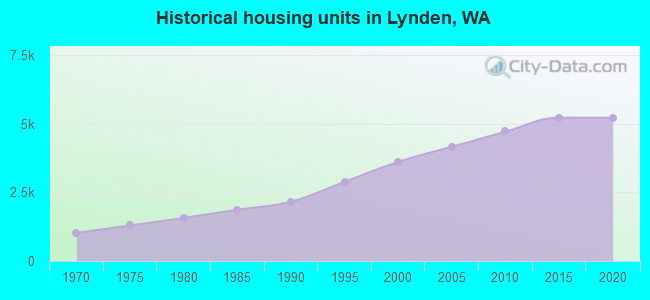
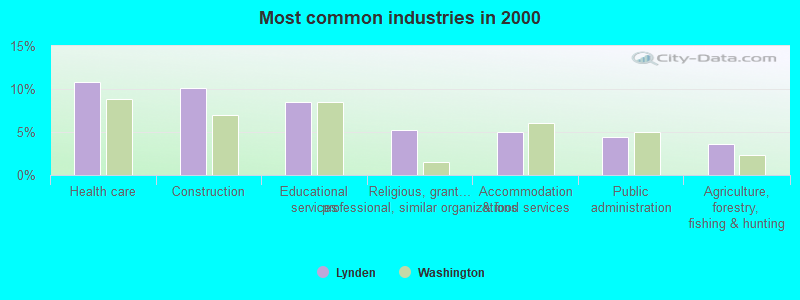
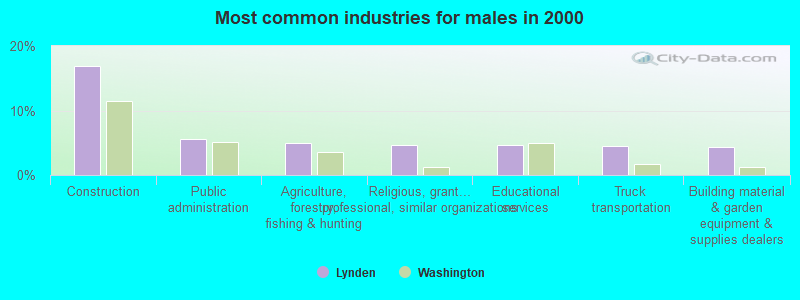
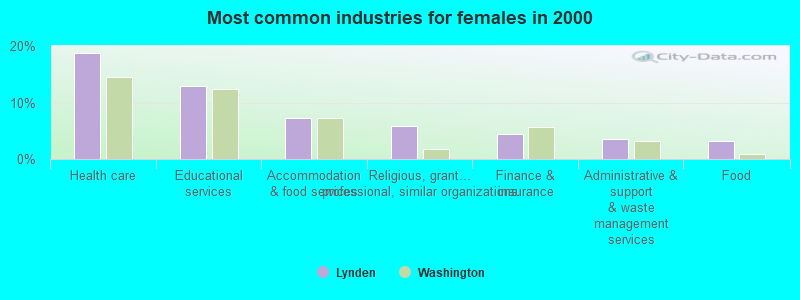
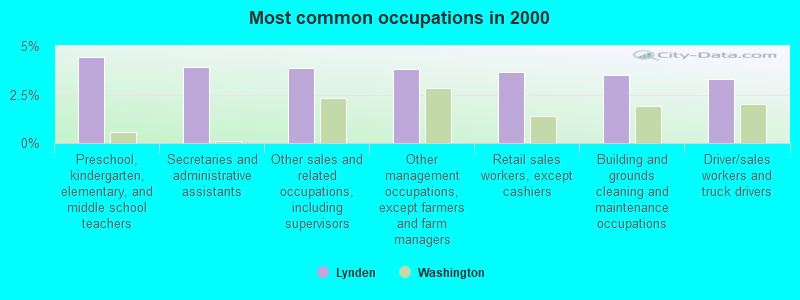
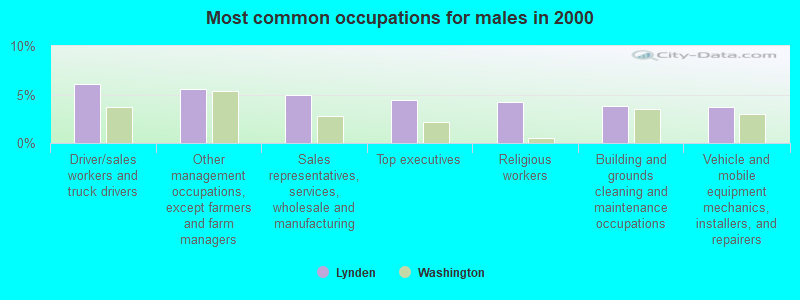
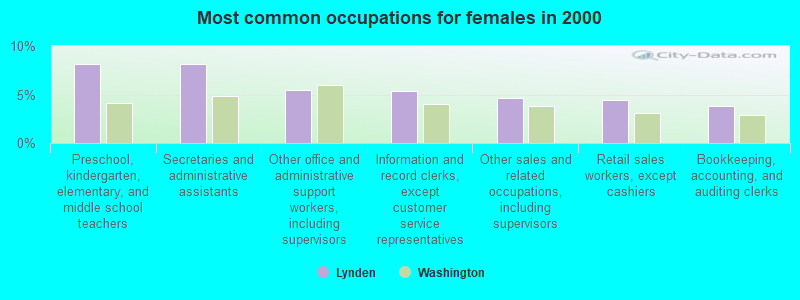
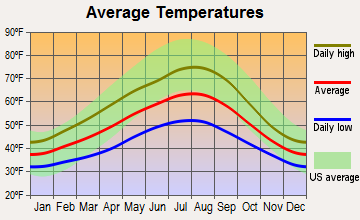
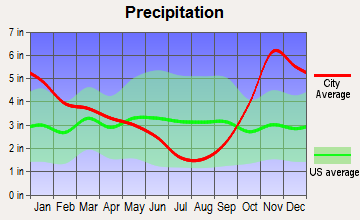
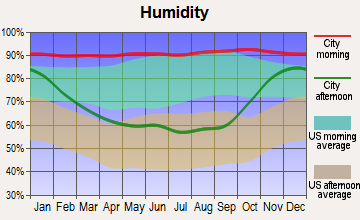
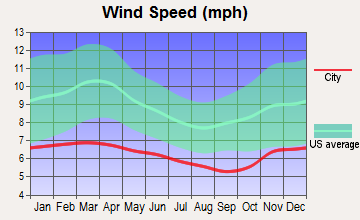
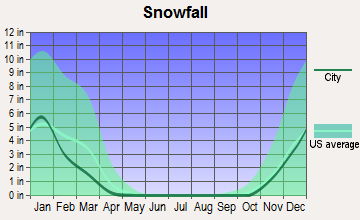
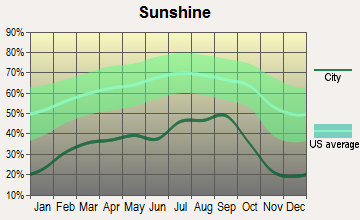
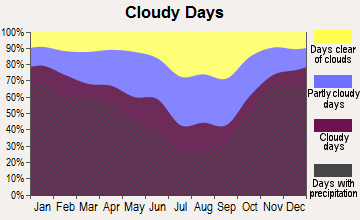
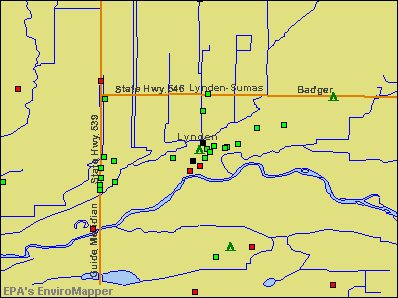

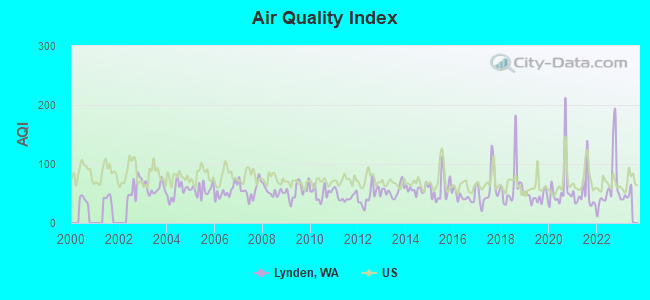
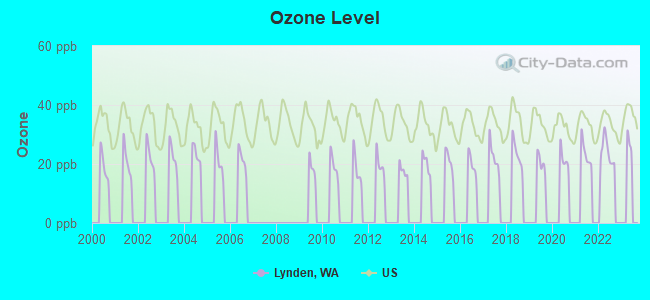

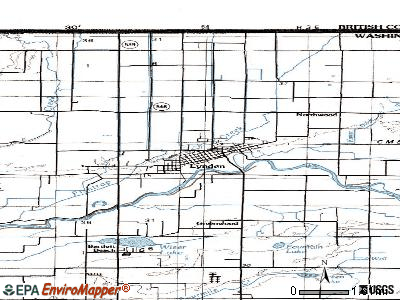
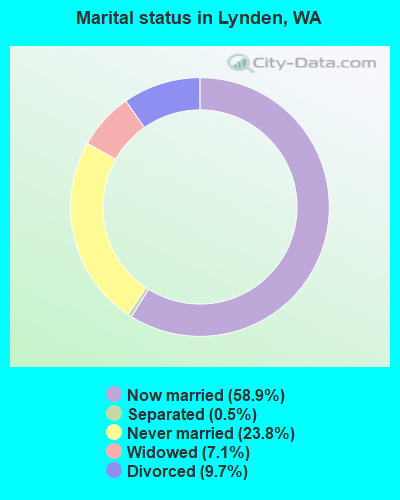
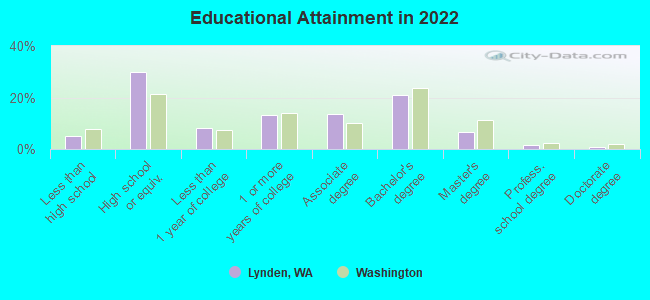
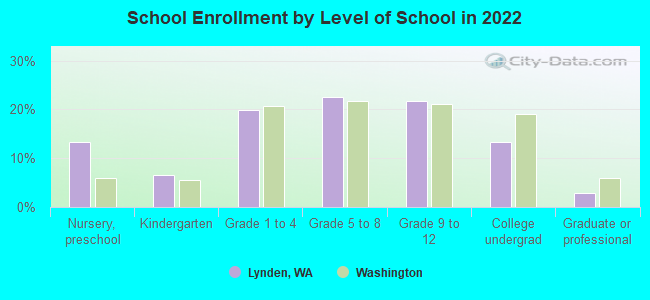
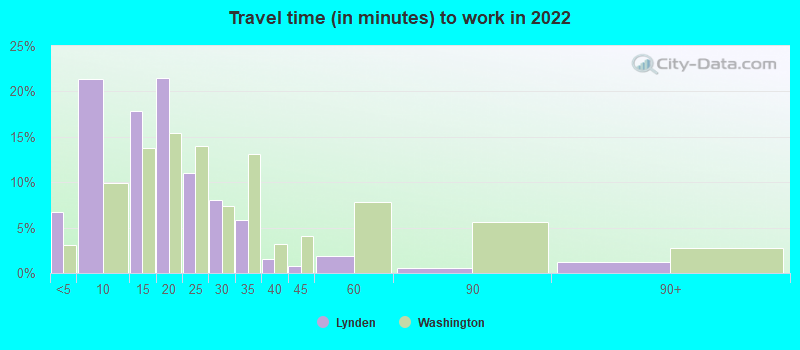
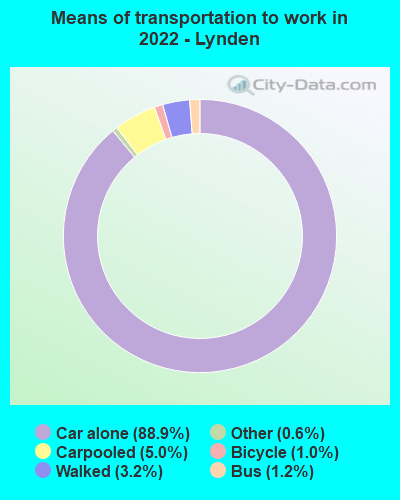
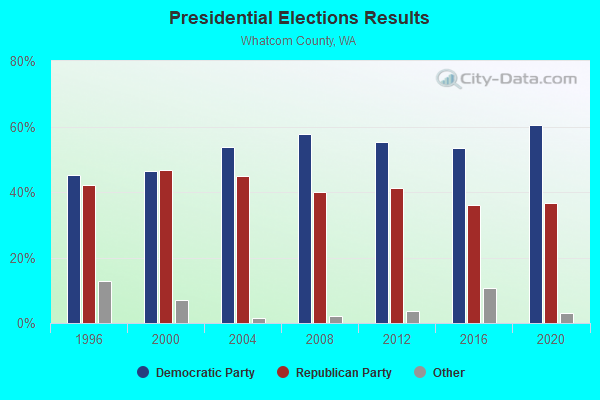

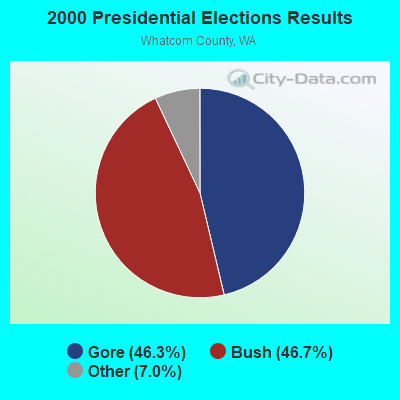

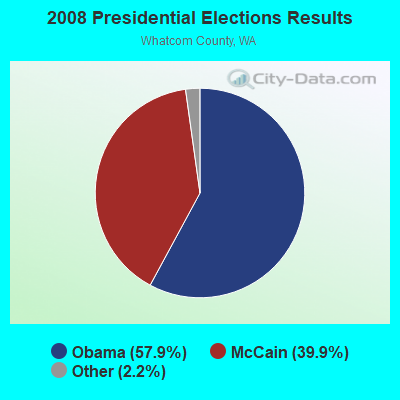
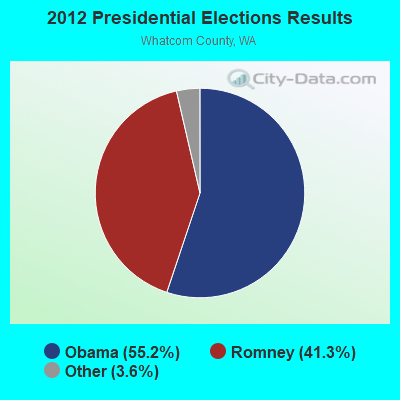
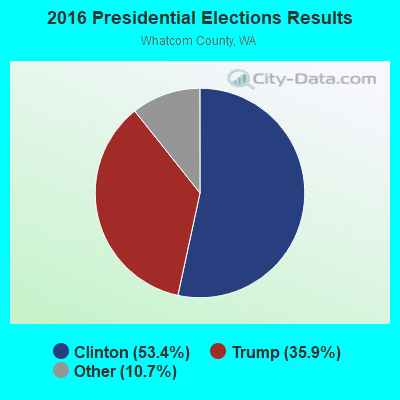
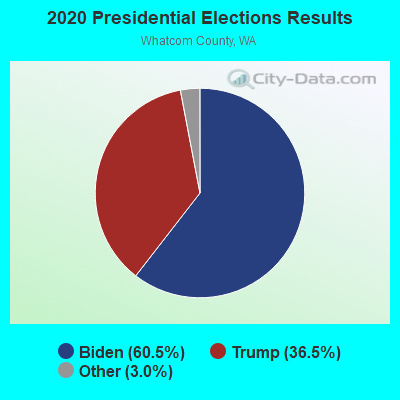
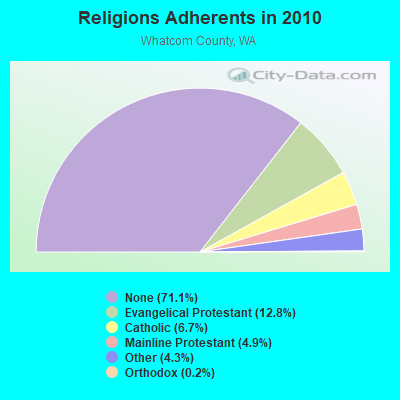
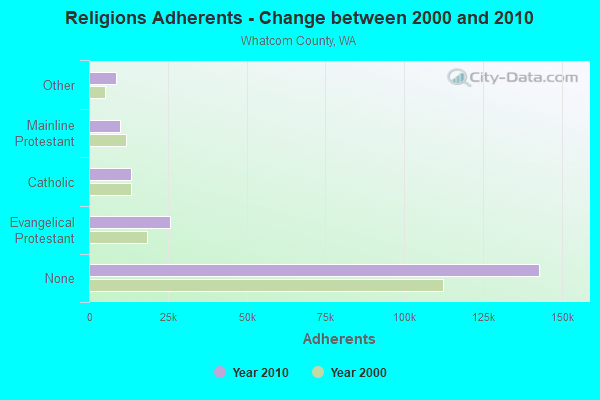
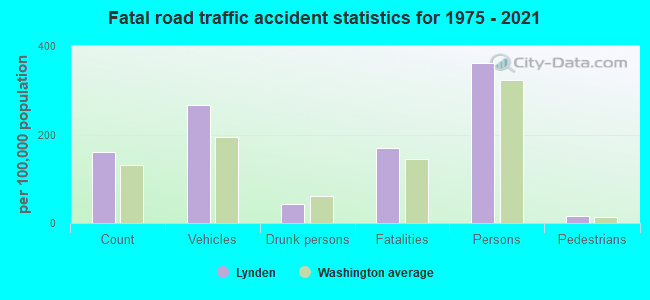
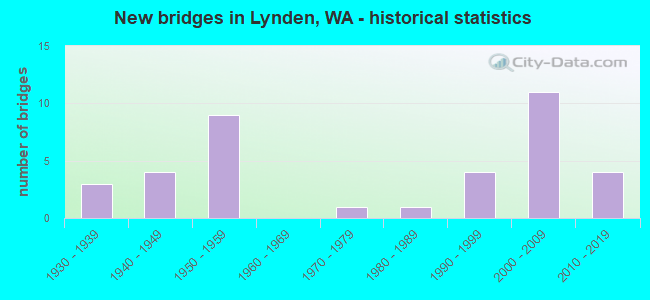
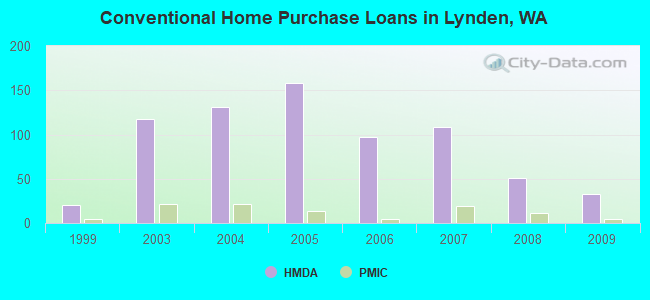
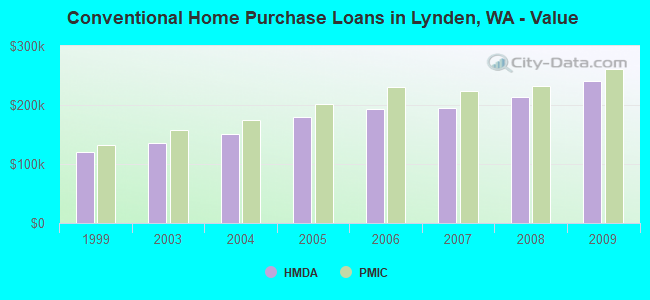
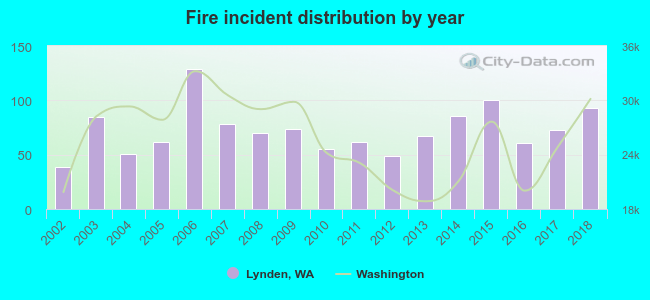 According to the data from the years 2002 - 2018 the average number of fires per year is 73. The highest number of fire incidents - 129 took place in 2006, and the least - 39 in 2002. The data has a growing trend.
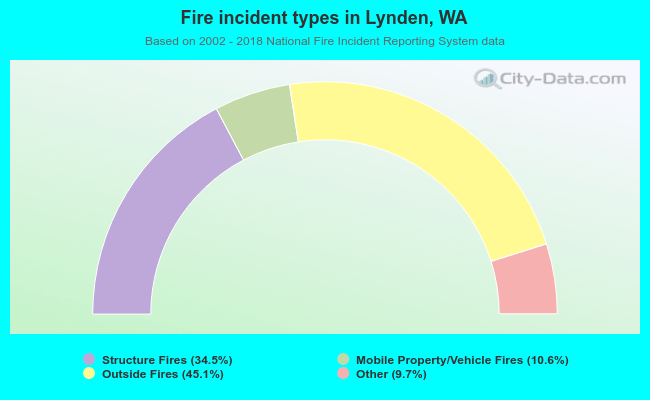 When looking into fire subcategories, the most reports belonged to: Outside Fires (45.1%), and Structure Fires (34.5%).