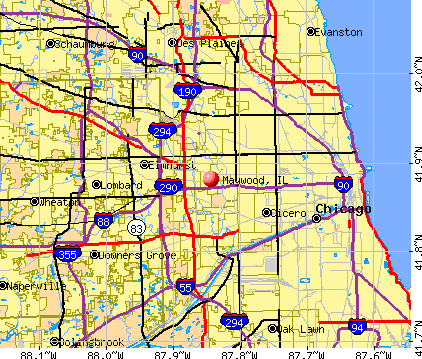
Maywood, Illinois
Maywood: Horse track
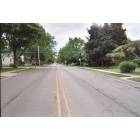
Maywood: 5th Avenue just south of Iowa St, looking south in Maywood
Maywood: 5th Avenue just south of Iowa St, looking north, in Maywood
- add
your
Submit your own pictures of this village and show them to the world
- OSM Map
- General Map
- Google Map
- MSN Map
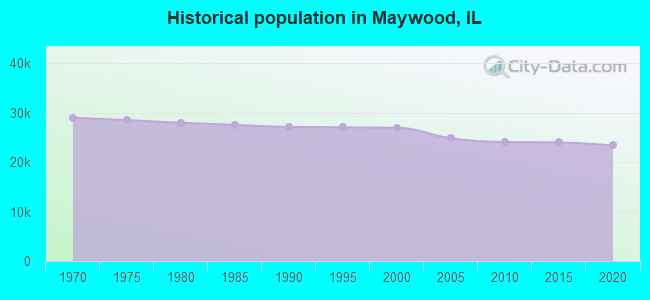
Population change since 2000: -15.0%
 |
| Males: 11,230 | |
| Females: 11,702 |
| Median resident age: | 37.6 years |
| Illinois median age: | 39.1 years |
Zip codes: 60153.
| Maywood: | $63,384 |
| IL: | $76,708 |
Estimated per capita income in 2022: $26,379 (it was $14,915 in 2000)
Maywood village income, earnings, and wages data
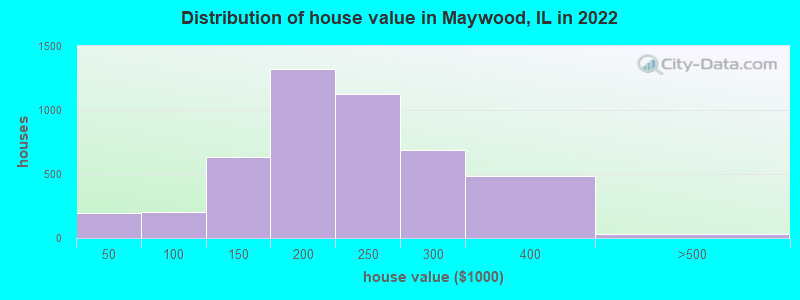
Estimated median house or condo value in 2022: $200,831 (it was $108,300 in 2000)
| Maywood: | $200,831 |
| IL: | $251,600 |
Mean prices in 2022: all housing units: $195,939; detached houses: $190,184; townhouses or other attached units: $173,397; in 2-unit structures: $217,771; in 3-to-4-unit structures: $201,730; in 5-or-more-unit structures: $316,598
Median gross rent in 2022: $1,137.
(6.2% for White Non-Hispanic residents, 15.1% for Black residents, 15.9% for Hispanic or Latino residents, 17.8% for other race residents, 22.6% for two or more races residents)
Detailed information about poverty and poor residents in Maywood, IL

Compare current foreclosures in Maywood, IL:
| Photo | Address | Area | Beds / Baths | Price | Details |
|---|---|---|---|---|---|

|
#1
S 13th Ave
Maywood, IL 60153
|
1,176 sq. feet
|
1 baths 3 beds |
$279,900
|
show details |

|
#2
S 17th Ave
Maywood, IL 60153
|
800 sq. feet
|
1 baths 2 beds |
$64,900
|
show details |

|
#3
N 2nd Ave
Maywood, IL 60153
|
1,756 sq. feet
|
2 baths 3 beds |
show details | |

|
#4
S 20th Ave
Maywood, IL 60153
|
2,023 sq. feet
|
2 baths 4 beds |
show details | |

|
#5
S 7th Ave
Maywood, IL 60153
|
1,918 sq. feet
|
1 baths 4 beds |
show details | |

|
#6
S 11th Ave
Maywood, IL 60153
|
1,651 sq. feet
|
2 baths 3 beds |
show details | |

|
#7
S 22nd Ave
Maywood, IL 60153
|
728 sq. feet
|
1 baths 1 beds |
show details | |

|
#8
S 21st Ave
Maywood, IL 60153
|
1,488 sq. feet
|
1 baths 3 beds |
show details | |

|
#9
S 2nd Ave
Maywood, IL 60153
|
1,258 sq. feet
|
1 baths 3 beds |
show details | |

|
#10
S 9th Ave
Maywood, IL 60153
|
1,455 sq. feet
|
2 baths 4 beds |
show details |
| Photo | Address | Area | Beds / Baths | Price | Details |
|---|---|---|---|---|---|

|
#11
Saint Charles Rd
Maywood, IL 60153
|
1,710 sq. feet
|
2 baths 3 beds |
show details | |

|
#12
S 9th Ave
Maywood, IL 60153
|
954 sq. feet
|
1 baths 2 beds |
show details | |

|
#13
S 17th Ave
Maywood, IL 60153
|
855 sq. feet
|
1 baths 2 beds |
show details | |

|
#14
S 6th Ave
Maywood, IL 60153
|
1,677 sq. feet
|
2 baths 3 beds |
show details | |

|
#15
S 16th Ave
Maywood, IL 60153
|
1,934 sq. feet
|
2 baths 4 beds |
show details | |

|
#16
S 7th Ave
Maywood, IL 60153
|
900 sq. feet
|
2 baths - beds |
show details | |

|
#17
S 21st Ave
Maywood, IL 60153
|
1,458 sq. feet
|
1 baths - beds |
show details | |

|
#18
S 6th Ave
Maywood, IL 60153
|
1,589 sq. feet
|
2 baths - beds |
show details | |

|
#19
S 7th Ave
Maywood, IL 60153
|
1,758 sq. feet
|
2 baths - beds |
show details | |

|
#20
N 6th Ave
Maywood, IL 60153
|
1,552 sq. feet
|
1 baths - beds |
show details |
| Photo | Address | Area | Beds / Baths | Price | Details |
|---|---|---|---|---|---|

|
#21
S 4th Ave
Maywood, IL 60153
|
2,496 sq. feet
|
2 baths - beds |
show details | |

|
#22
S 10th Ave
Maywood, IL 60153
|
1,792 sq. feet
|
3 baths - beds |
show details | |

|
#23
S 7th Ave
Maywood, IL 60153
|
1,876 sq. feet
|
1 baths - beds |
show details | |

|
#24
S 14th Ave
Maywood, IL 60153
|
2,237 sq. feet
|
3 baths - beds |
show details | |

|
#25
S 10th Ave
Maywood, IL 60153
|
2,077 sq. feet
|
2 baths - beds |
show details | |

|
#26
S 8th Ave
Maywood, IL 60153
|
840 sq. feet
|
1 baths - beds |
show details | |

|
#27
Greenwood Ave
Maywood, IL 60153
|
776 sq. feet
|
1 baths - beds |
show details | |

|
#28
S 11th Ave
Maywood, IL 60153
|
1,116 sq. feet
|
1 baths - beds |
show details | |

|
#29
S 7th Ave
Maywood, IL 60153
|
1,014 sq. feet
|
2 baths - beds |
show details | |

|
#30
S 10th Ave
Maywood, IL 60153
|
1,009 sq. feet
|
1 baths - beds |
show details |
| Photo | Address | Area | Beds / Baths | Price | Details |
|---|---|---|---|---|---|

|
#31
S 3rd Ave
Maywood, IL 60153
|
1,400 sq. feet
|
1 baths - beds |
show details | |

|
#32
S 18th Ave
Maywood, IL 60153
|
1,994 sq. feet
|
2 baths - beds |
show details | |

|
#33
S 2nd Ave
Maywood, IL 60153
|
1,365 sq. feet
|
2 baths - beds |
show details | |

|
#34
S 10th Ave
Maywood, IL 60153
|
1,531 sq. feet
|
1 baths - beds |
show details | |

|
#35
S 19th Ave
Maywood, IL 60153
|
2,180 sq. feet
|
2 baths - beds |
show details | |

|
#36
S 9th Ave
Maywood, IL 60153
|
2,104 sq. feet
|
3 baths - beds |
show details | |

|
#37
S 19th Ave Apt 1b
Maywood, IL 60153
|
4,029 sq. feet
|
6 baths - beds |
show details | |

|
#38
S 11th Ave
Maywood, IL 60153
|
1,341 sq. feet
|
2 baths - beds |
show details | |

|
#39
S 12th Ave
Maywood, IL 60153
|
881 sq. feet
|
1 baths - beds |
show details | |

|
#40
N 8th Ave Apt 1
Maywood, IL 60153
|
3,312 sq. feet
|
3 baths - beds |
show details |
| Photo | Address | Area | Beds / Baths | Price | Details |
|---|---|---|---|---|---|

|
#41
S 18th Ave
Maywood, IL 60153
|
1,235 sq. feet
|
1 baths - beds |
show details | |

|
#42
S 20th Ave
Maywood, IL 60153
|
976 sq. feet
|
1 baths - beds |
show details | |

|
#43
N 3rd Ave
Maywood, IL 60153
|
1,344 sq. feet
|
1 baths - beds |
show details | |

|
#44
S 4th Ave
Maywood, IL 60153
|
844 sq. feet
|
1 baths - beds |
show details | |

|
#45
S 12th Ave
Maywood, IL 60153
|
1,150 sq. feet
|
1 baths - beds |
show details | |

|
#46
S 12th Ave
Maywood, IL 60153
|
1,455 sq. feet
|
1 baths - beds |
show details | |

|
#47
S 21st Ave
Maywood, IL 60153
|
1,275 sq. feet
|
1 baths - beds |
show details | |

|
#48
S 8th Ave
Maywood, IL 60153
|
828 sq. feet
|
1 baths - beds |
show details | |

|
#49
N 7th Ave
Maywood, IL 60153
|
1,875 sq. feet
|
2 baths - beds |
show details | |

|
Check over 1 million property listings on Foreclosure.com!
|
browse all offers | |||


- 13,41058.6%Black alone
- 7,09431.0%Hispanic
- 1,2725.6%White alone
- 5982.6%Two or more races
- 2441.1%Asian alone
- 580.3%Other race alone
- 440.2%American Indian alone
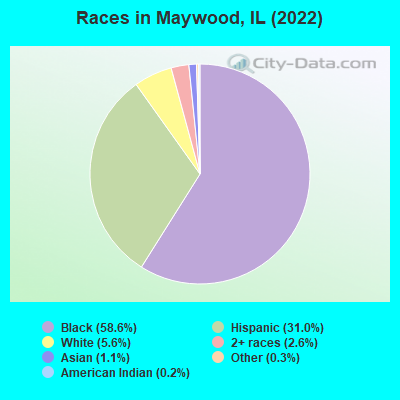
Races in Maywood detailed stats: ancestries, foreign born residents, place of birth
According to our research of Illinois and other state lists, there were 33 registered sex offenders living in Maywood, Illinois as of April 27, 2024.
The ratio of all residents to sex offenders in Maywood is 725 to 1.
The ratio of registered sex offenders to all residents in this city is near the state average.
Type |
2009 |
2010 |
2011 |
2012 |
2013 |
2014 |
2015 |
2016 |
2017 |
2018 |
2019 |
2020 |
|---|---|---|---|---|---|---|---|---|---|---|---|---|
| Murders (per 100,000) | 2 (8.1) | 3 (12.5) | 13 (53.8) | 7 (28.9) | 6 (24.8) | 7 (29.0) | 13 (53.9) | 5 (20.8) | 10 (42.2) | 4 (17.0) | 11 (47.3) | 16 (69.4) |
| Rapes (per 100,000) | 0 (0.0) | 9 (37.4) | 15 (62.1) | 18 (74.4) | 18 (74.4) | 16 (66.2) | 24 (99.4) | 15 (62.5) | 16 (67.5) | 20 (84.8) | 19 (81.6) | 16 (69.4) |
| Robberies (per 100,000) | 126 (507.5) | 98 (406.8) | 93 (384.9) | 94 (388.3) | 90 (372.1) | 82 (339.2) | 85 (352.1) | 68 (283.4) | 103 (434.7) | 57 (241.8) | 48 (206.2) | 92 (399.0) |
| Assaults (per 100,000) | 115 (463.1) | 111 (460.8) | 123 (509.0) | 119 (491.6) | 93 (384.6) | 108 (446.8) | 113 (468.1) | 77 (320.9) | 73 (308.1) | 54 (229.1) | 57 (244.9) | 93 (403.4) |
| Burglaries (per 100,000) | 267 (1,075) | 297 (1,233) | 357 (1,477) | 397 (1,640) | 295 (1,220) | 207 (856.3) | 221 (915.5) | 144 (600.2) | 112 (472.6) | 120 (509.1) | 88 (378.1) | 62 (268.9) |
| Thefts (per 100,000) | 561 (2,259) | 562 (2,333) | 493 (2,040) | 465 (1,921) | 447 (1,848) | 365 (1,510) | 312 (1,292) | 339 (1,413) | 341 (1,439) | 345 (1,464) | 277 (1,190) | 300 (1,301) |
| Auto thefts (per 100,000) | 103 (414.8) | 103 (427.6) | 90 (372.5) | 126 (520.5) | 102 (421.8) | 108 (446.8) | 98 (405.9) | 89 (370.9) | 93 (392.5) | 105 (445.4) | 105 (451.1) | 102 (442.4) |
| Arson (per 100,000) | 8 (32.2) | 3 (12.5) | 8 (33.1) | 9 (37.2) | 6 (24.8) | 2 (8.3) | 5 (20.7) | 2 (8.3) | 5 (21.1) | 4 (17.0) | 3 (12.9) | 3 (13.0) |
| City-Data.com crime index | 459.8 | 482.8 | 589.4 | 565.4 | 490.8 | 458.1 | 534.7 | 369.1 | 452.5 | 350.0 | 380.8 | 501.0 |
The City-Data.com crime index weighs serious crimes and violent crimes more heavily. Higher means more crime, U.S. average is 246.1. It adjusts for the number of visitors and daily workers commuting into cities.
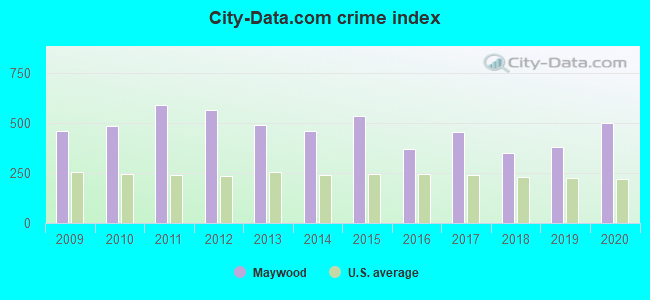
Crime rate in Maywood detailed stats: murders, rapes, robberies, assaults, burglaries, thefts, arson
Full-time law enforcement employees in 2015, including police officers: 62 (50 officers - 44 male; 6 female).
| Officers per 1,000 residents here: | 2.07 |
| Illinois average: | 2.42 |
 Recent articles from our blog. Our writers, many of them Ph.D. graduates or candidates, create easy-to-read articles on a wide variety of topics.

 | Adjacent suburbs that are vastly different from each other. (53 replies) |
| Suburbs of Suburbs (32 replies) |
| Maywood (9 replies) |
| Oak Lawn, Midlothian, Palos [Insert Noun Here], Worth (16 replies) |
| Young Single Woman Working in Maywood... Safe? (11 replies) |
| safe suburbs close to Maywood, IL (11 replies) |
Latest news from Maywood, IL collected exclusively by city-data.com from local newspapers, TV, and radio stations
Current Local Time: CST time zone
Elevation: 627 feet
Land area: 2.71 square miles.
Population density: 8,468 people per square mile (high).
3,071 residents are foreign born (12.2% Latin America).
| This village: | 13.4% |
| Illinois: | 14.1% |
Median real estate property taxes paid for housing units with mortgages in 2022: $5,612 (2.8%)
Median real estate property taxes paid for housing units with no mortgage in 2022: $5,706 (2.7%)
Nearest city with pop. 50,000+: Oak Park, IL  (2.7 miles , pop. 52,524).
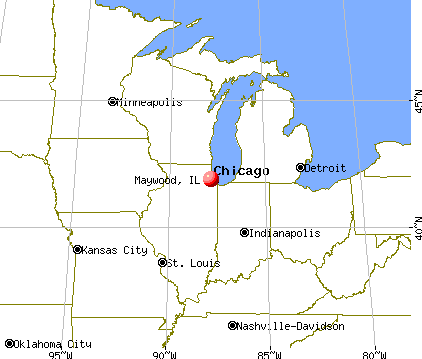
Nearest city with pop. 200,000+: Chicago, IL (8.9 miles , pop. 2,896,016).
Nearest cities:
), ), ), Latitude: 41.88 N, Longitude: 87.84 W
Daytime population change due to commuting: +1,507 (+6.6%)
Workers who live and work in this village: 1,294 (13.6%)
Area codes: 708, 630
Maywood, Illinois accommodation & food services, waste management - Economy and Business Data
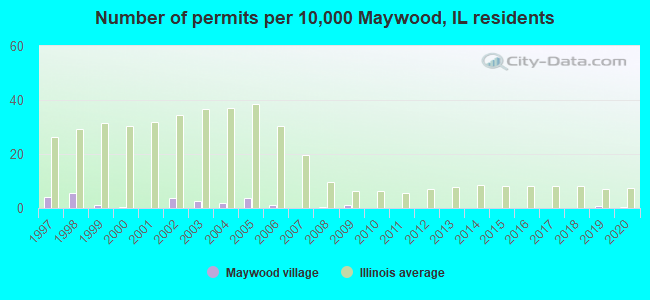
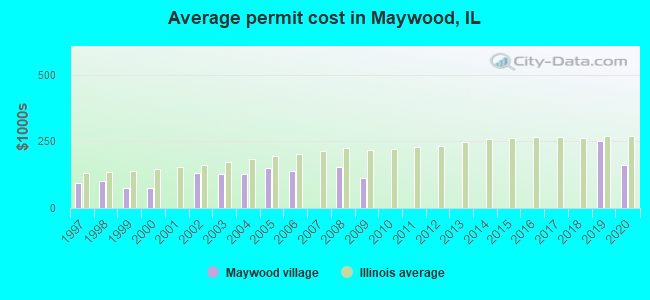
Single-family new house construction building permits:
- 2020: 1 building, cost: $160,000
- 2019: 2 buildings, average cost: $250,000
- 2009: 3 buildings, average cost: $114,200
- 2008: 1 building, cost: $154,000
- 2006: 3 buildings, average cost: $137,700
- 2005: 10 buildings, average cost: $149,400
- 2004: 5 buildings, average cost: $127,100
- 2003: 7 buildings, average cost: $129,100
- 2002: 10 buildings, average cost: $132,500
- 2000: 1 building, cost: $75,000
- 1999: 3 buildings, average cost: $75,700
- 1998: 15 buildings, average cost: $100,900
- 1997: 11 buildings, average cost: $94,500
| Here: | 6.3% |
| Illinois: | 4.2% |
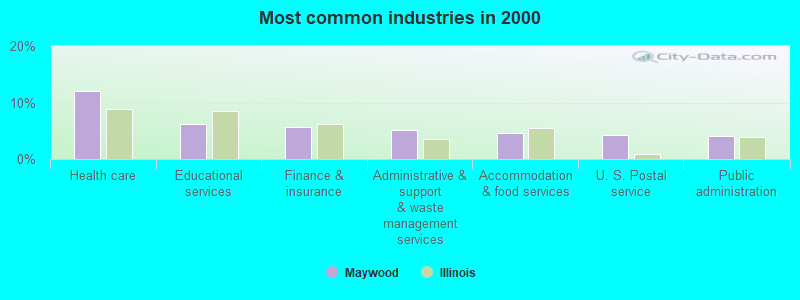
- Health care (12.0%)
- Educational services (6.2%)
- Finance & insurance (5.7%)
- Administrative & support & waste management services (5.1%)
- Accommodation & food services (4.5%)
- U. S. Postal service (4.3%)
- Public administration (4.1%)
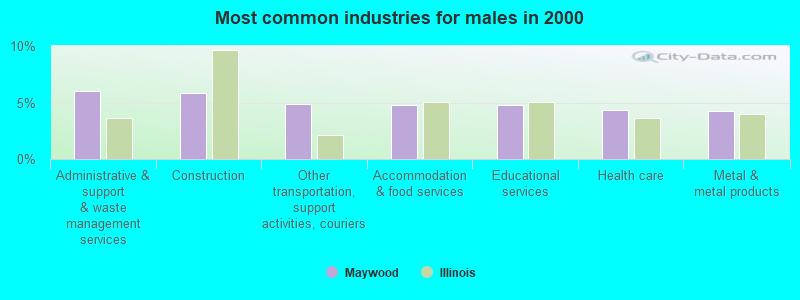
- Administrative & support & waste management services (6.1%)
- Construction (5.9%)
- Other transportation, support activities, couriers (4.9%)
- Accommodation & food services (4.8%)
- Educational services (4.7%)
- Health care (4.3%)
- Metal & metal products (4.2%)
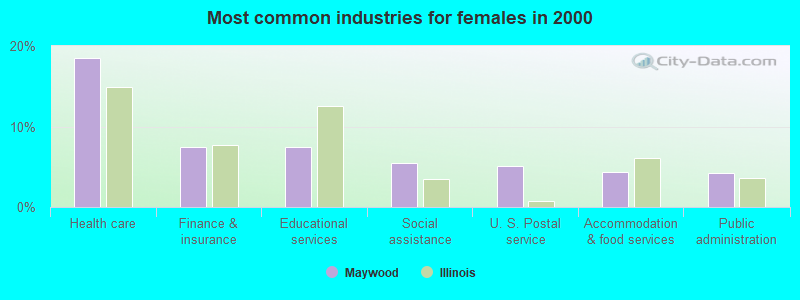
- Health care (18.5%)
- Finance & insurance (7.5%)
- Educational services (7.4%)
- Social assistance (5.5%)
- U. S. Postal service (5.1%)
- Accommodation & food services (4.3%)
- Public administration (4.2%)
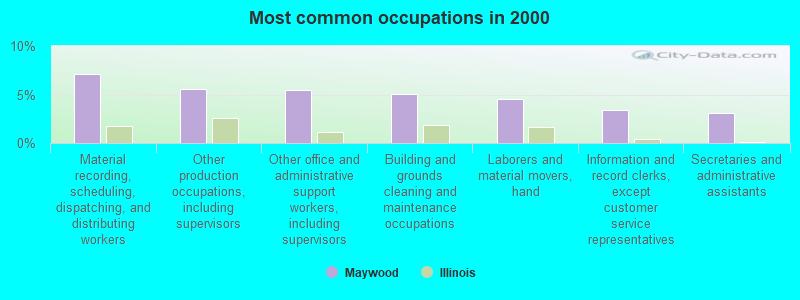
- Material recording, scheduling, dispatching, and distributing workers (7.1%)
- Other production occupations, including supervisors (5.5%)
- Other office and administrative support workers, including supervisors (5.5%)
- Building and grounds cleaning and maintenance occupations (5.0%)
- Laborers and material movers, hand (4.6%)
- Information and record clerks, except customer service representatives (3.4%)
- Secretaries and administrative assistants (3.1%)
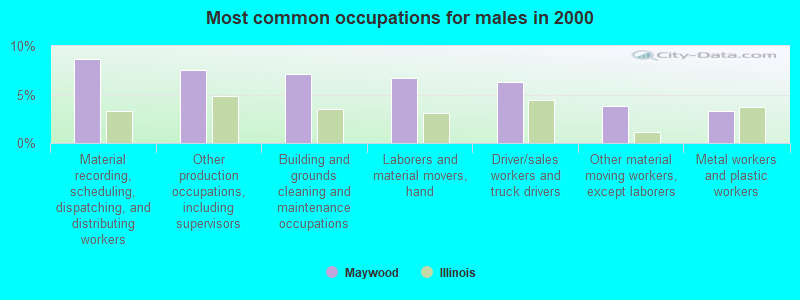
- Material recording, scheduling, dispatching, and distributing workers (8.6%)
- Other production occupations, including supervisors (7.5%)
- Building and grounds cleaning and maintenance occupations (7.1%)
- Laborers and material movers, hand (6.7%)
- Driver/sales workers and truck drivers (6.3%)
- Other material moving workers, except laborers (3.8%)
- Metal workers and plastic workers (3.3%)
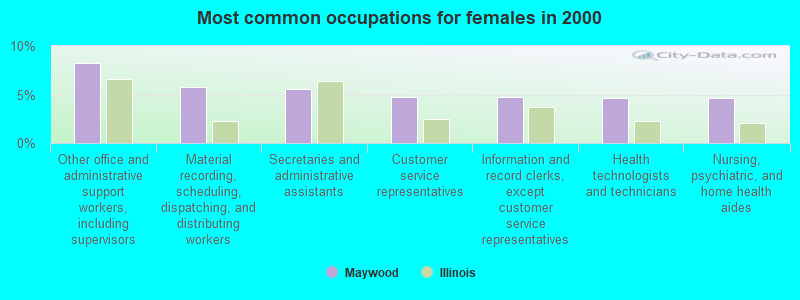
- Other office and administrative support workers, including supervisors (8.3%)
- Material recording, scheduling, dispatching, and distributing workers (5.8%)
- Secretaries and administrative assistants (5.5%)
- Customer service representatives (4.8%)
- Information and record clerks, except customer service representatives (4.8%)
- Health technologists and technicians (4.6%)
- Nursing, psychiatric, and home health aides (4.6%)
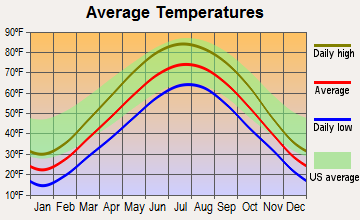
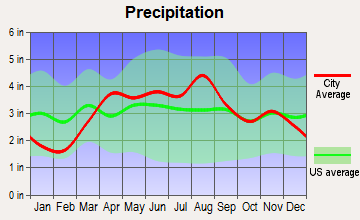
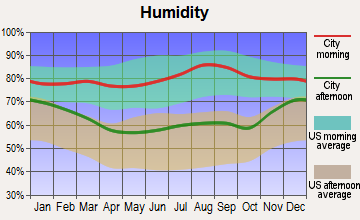
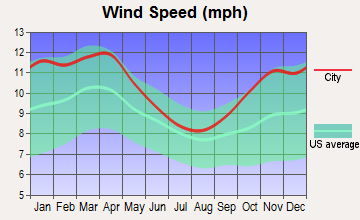
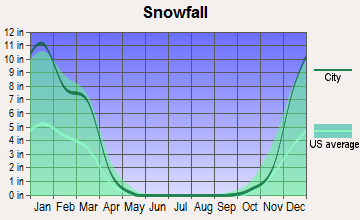
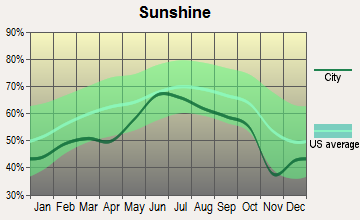
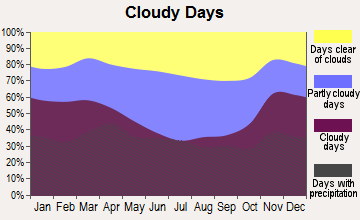
Average climate in Maywood, Illinois
Based on data reported by over 4,000 weather stations
|
|

(lower is better)
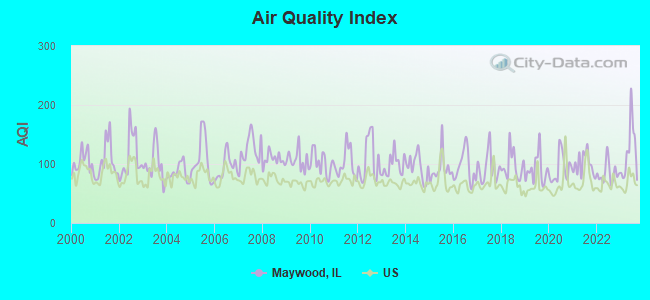
Air Quality Index (AQI) level in 2023 was 121. This is significantly worse than average.
| City: | 121 |
| U.S.: | 73 |
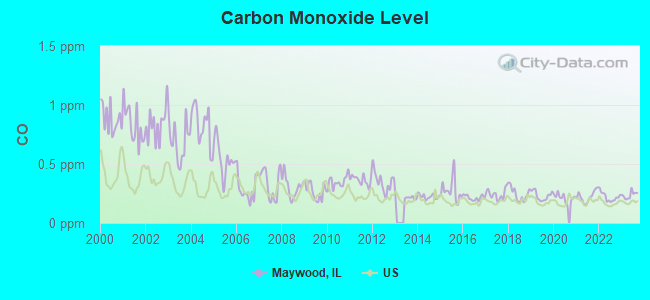
Carbon Monoxide (CO) [ppm] level in 2023 was 0.237. This is about average. Closest monitor was 0.6 miles away from the city center.
| City: | 0.237 |
| U.S.: | 0.251 |
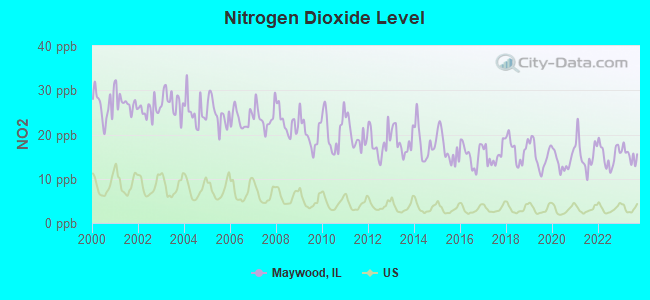
Nitrogen Dioxide (NO2) [ppb] level in 2023 was 15.4. This is significantly worse than average. Closest monitor was 0.6 miles away from the city center.
| City: | 15.4 |
| U.S.: | 5.1 |
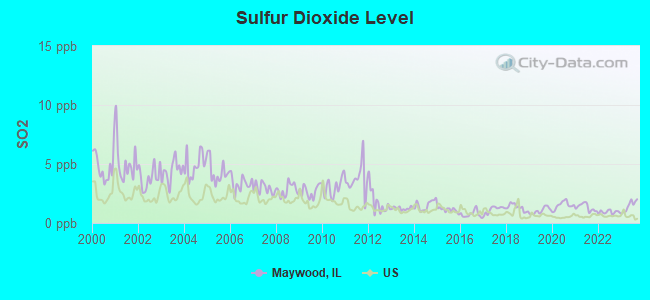
Sulfur Dioxide (SO2) [ppb] level in 2023 was 1.45. This is about average. Closest monitor was 0.6 miles away from the city center.
| City: | 1.45 |
| U.S.: | 1.51 |
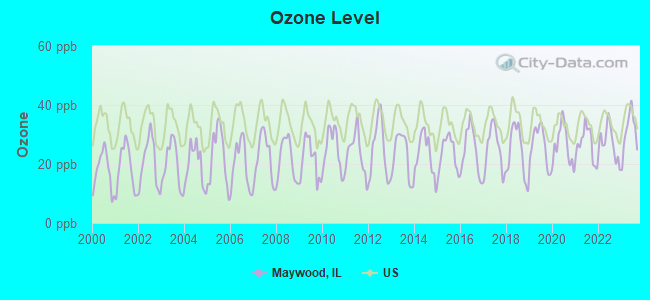
Ozone [ppb] level in 2023 was 30.9. This is about average. Closest monitor was 0.6 miles away from the city center.
| City: | 30.9 |
| U.S.: | 33.3 |
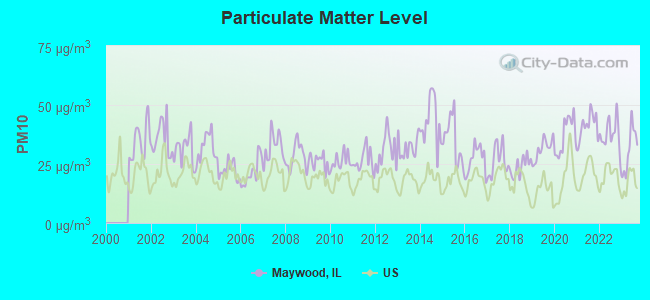
Particulate Matter (PM10) [µg/m3] level in 2023 was 31.1. This is significantly worse than average. Closest monitor was 1.1 miles away from the city center.
| City: | 31.1 |
| U.S.: | 19.2 |
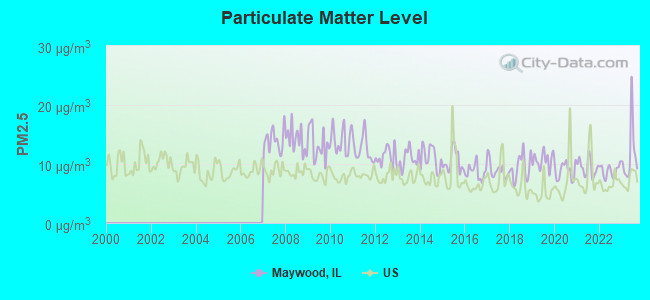
Particulate Matter (PM2.5) [µg/m3] level in 2023 was 11.5. This is significantly worse than average. Closest monitor was 4.6 miles away from the city center.
| City: | 11.5 |
| U.S.: | 8.1 |
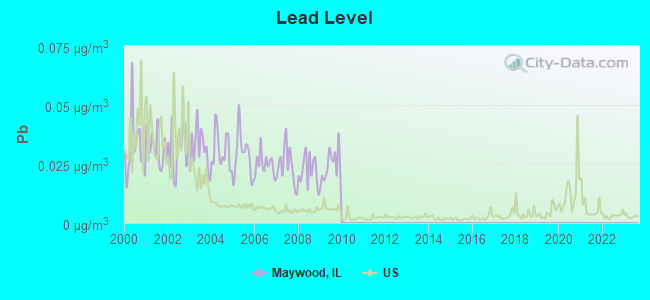
Lead (Pb) [µg/m3] level in 2009 was 0.0242. This is significantly worse than average. Closest monitor was 0.9 miles away from the city center.
| City: | 0.0242 |
| U.S.: | 0.0093 |
Tornado activity:
Maywood-area historical tornado activity is slightly below Illinois state average. It is 45% greater than the overall U.S. average.
On 8/28/1990, a category F5 (max. wind speeds 261-318 mph) tornado 28.3 miles away from the Maywood village center killed 29 people and injured 350 people and caused between $50,000 and $500,000 in damages.
On 6/13/1976, a category F4 (max. wind speeds 207-260 mph) tornado 11.2 miles away from the village center killed 2 people and injured 23 people and caused between $500,000 and $5,000,000 in damages.
Earthquake activity:
Maywood-area historical earthquake activity is significantly above Illinois state average. It is 40% greater than the overall U.S. average.On 4/18/2008 at 09:36:59, a magnitude 5.4 (5.1 MB, 4.8 MS, 5.4 MW, 5.2 MW, Class: Moderate, Intensity: VI - VII) earthquake occurred 237.2 miles away from Maywood center
On 6/10/1987 at 23:48:54, a magnitude 5.1 (4.9 MB, 4.4 MS, 4.6 MS, 5.1 LG) earthquake occurred 211.7 miles away from the city center
On 4/18/2008 at 09:36:59, a magnitude 5.2 (5.2 MW, Depth: 8.9 mi) earthquake occurred 237.2 miles away from Maywood center
On 6/28/2004 at 06:10:52, a magnitude 4.2 (4.2 MW, Depth: 6.2 mi, Class: Light, Intensity: IV - V) earthquake occurred 61.9 miles away from Maywood center
On 6/18/2002 at 17:37:15, a magnitude 5.0 (4.3 MB, 4.6 MW, 5.0 LG) earthquake occurred 269.4 miles away from the city center
On 2/10/2010 at 09:59:35, a magnitude 3.8 (3.8 MW, Depth: 6.2 mi, Class: Light, Intensity: II - III) earthquake occurred 34.2 miles away from the city center
Magnitude types: regional Lg-wave magnitude (LG), body-wave magnitude (MB), surface-wave magnitude (MS), moment magnitude (MW)
Natural disasters:
The number of natural disasters in Cook County (20) is greater than the US average (15).Major Disasters (Presidential) Declared: 15
Emergencies Declared: 4
Causes of natural disasters: Floods: 13, Storms: 12, Tornadoes: 3, Snowstorms: 2, Winter Storms: 2, Blizzard: 1, Hurricane: 1, Snow: 1, Wind: 1, Other: 1 (Note: some incidents may be assigned to more than one category).

Hospitals and medical centers in Maywood:
Amtrak stations near Maywood:
- 5 miles: LA GRANGE ROAD (LA GRANGE, 25 W. BURLINGTON AVE.) . Services: enclosed waiting area, public payphones, taxi stand, public transit connection.
- 7 miles: SUMMIT (ARCHER & CENTER AVE.) . Services: public payphones, free short-term parking, free long-term parking, call for taxi service, public transit connection.
- 11 miles: CHICAGO (225 S. CANAL ST.) . Services: ticket office, partially wheelchair accessible, enclosed waiting area, public restrooms, public payphones, snack bar, paid short-term parking, paid long-term parking, call for car rental service, taxi stand, public transit connection.
Colleges/universities with over 2000 students nearest to Maywood:
- Dominican University (about 2 miles; River Forest, IL; Full-time enrollment: 2,971)
- Concordia University-Chicago (about 3 miles; River Forest, IL; FT enrollment: 3,944)
- Triton College (about 3 miles; River Grove, IL; FT enrollment: 8,817)
- Elmhurst College (about 6 miles; Elmhurst, IL; FT enrollment: 3,364)
- Morton College (about 6 miles; Cicero, IL; FT enrollment: 3,236)
- City Colleges of Chicago-Wilbur Wright College (about 7 miles; Chicago, IL; FT enrollment: 8,683)
- City Colleges of Chicago-Malcolm X College (about 9 miles; Chicago, IL; FT enrollment: 5,494)
Public high school in Maywood:
- PROVISO EAST HIGH SCHOOL (Students: 1,872, Location: 807 S 1ST AVE, Grades: 9-12)
Public elementary/middle schools in Maywood:
- GARFIELD ELEM SCHOOL (Students: 500, Location: 1514 S 9TH AVE, Grades: KG-5)
- EMERSON ELEM SCHOOL (Students: 375, Location: 311 WASHINGTON BLVD, Grades: PK-5)
- WASHINGTON ELEM SCHOOL (Students: 364, Location: 1111 WASHINGTON BLVD, Grades: PK-1)
- IRVING ELEM SCHOOL (Location: 805 S 17TH AVE, Grades: 6-8)
- LINCOLN ELEM SCHOOL (Location: 811 CHICAGO AVE, Grades: PK-5)
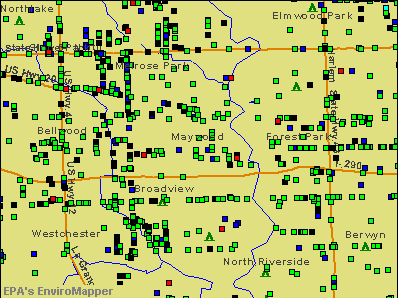
Points of interest:
Notable locations in Maywood: Maywood Fire Department Station 1 (A), Maywood Fire Department Station 2 (B). Display/hide their locations on the map
Churches in Maywood include: Emmanuel Evangelical Lutheran Church (A), Saint Eulalia Church (B), Alpha and Omega Baptist Church (C), Christ Temple Church (D), First Baptist Church (E), First Christian Church (F), First Congregational Church (G), Fresh Anointing Faith Church (H), God's Heritage Full Gospel Church (I). Display/hide their locations on the map
Creek: Silver Creek (A). Display/hide its location on the map
Parks in Maywood include: Memorial Park (1), Maywood Park (2). Display/hide their locations on the map
Courts: Cook County - Circuit Court- District No 4- Court Clerk- Civil Divi (1500 Maybrook Drive), Cook County - Circuit Court- District No 4- Court Clerk- Personal & Prop (1500 Maybrook Drive), Cook County - Circuit Court- District No 4- Judicial (1500 Maybrook Drive), Cook County - Vital Statistics- District No 4- Circuit Court- County Clerk-Maywood Br (1500 Maybrook Drive), Cook County - Circuit Court- District No 4- Juvenile Courts (1500 Maybrook Drive), Cook County - Circuit Court- District No 4- Public Defender (1500 Maybrook Drive), Cook County - Circuit Court- District No 4- Sheriff- Civil Process (1500 Maybrook Drive), Cook County - Court Houses- Maywood 4th District Courts (1500 Maybrook Drive), Cook County - Circuit Court- District No 4- Sheriff- Court Services Divi (1500 Maybrook Drive).
Birthplace of: Walter Burley Griffin - Architect of Canberra, John Prine - Country singer, Dennis Franz - Film actor, Jacob Pullen - Basketball player, Jim Brewer (basketball) - Basketball player, Kwatsi Alibaruho - NASA flight director, Marcia P. Sward - Mathematician, Naima Adedapo - Singer, Reggie Brown (impersonator) - Comedian, Shirley Jameson - Baseball player.
Drinking water stations with addresses in Maywood and their reported violations in the past:
FPHP TAMPIER LAKE WEST 5223 (Population served: 400, Groundwater):Past monitoring violations:TURTLEHEAD LAKE 5064 (Population served: 400, Groundwater):
- Monitoring, Repeat Major (TCR) - Between JAN-2009 and DEC-2009, Contaminant: Coliform (TCR). Follow-up actions: St Compliance Meeting conducted (JAN-20-2010)
Past monitoring violations:WEST CHESTER WOODS 4125 (Population served: 25, Groundwater):
- Monitoring, Repeat Major (TCR) - Between APR-2008 and JUN-2008, Contaminant: Coliform (TCR). Follow-up actions: St Violation/Reminder Notice (MAY-23-2008)
Past health violations:GREEN LAKE HP 6296 (Population served: 25, Groundwater):Past monitoring violations:
- MCL, Acute (TCR) - In APR-2013, Contaminant: Coliform. Follow-up actions: St Violation/Reminder Notice (MAY-15-2014)
- Monitoring, Repeat Major (TCR) - Between APR-2008 and JUN-2008, Contaminant: Coliform (TCR). Follow-up actions: St Compliance achieved (JUN-18-2009)
Past health violations:ST PAUL WOODS 2105 (Population served: 25, Groundwater):Past monitoring violations:
- MCL, Monthly (TCR) - Between JAN-2009 and DEC-2009, Contaminant: Coliform. Follow-up actions: St Compliance achieved (JUN-16-2010), St Formal NOV issued (JUN-22-2010)
- Monitoring, Repeat Major (TCR) - Between JAN-2009 and DEC-2009, Contaminant: Coliform (TCR). Follow-up actions: St Compliance achieved (SEP-02-2009), St Compliance Meeting conducted (JAN-20-2010)
- Monitoring, Repeat Major (TCR) - Between APR-2007 and JUN-2007, Contaminant: Coliform (TCR). Follow-up actions: St Violation/Reminder Notice (MAY-23-2008), St Compliance achieved (JUL-09-2008)
- One routine major monitoring violation
Past monitoring violations:SUNDOWN MEADOW 4208 (Population served: 25, Groundwater):
- One regular monitoring violation
Past health violations:NATIONAL GROVE 4205 (Population served: 25, Groundwater):Past monitoring violations:
- MCL, Monthly (TCR) - In AUG-2010, Contaminant: Coliform. Follow-up actions: St Compliance achieved (JUL-21-2011)
- Monitoring, Repeat Major (TCR) - In AUG-2010, Contaminant: Coliform (TCR). Follow-up actions: St Compliance achieved (JUL-21-2011)
Past health violations:SAUK TRAIL SOUTH HP 6253 (Population served: 25, Groundwater):Past monitoring violations:
- MCL, Acute (TCR) - Between JAN-2009 and DEC-2009, Contaminant: Coliform
- Monitoring, Repeat Major (TCR) - Between JAN-2009 and DEC-2009, Contaminant: Coliform (TCR). Follow-up actions: St Compliance Meeting conducted (JAN-20-2010), St Violation/Reminder Notice (JAN-20-2010), St Compliance achieved (AUG-31-2010)
- Monitoring, Repeat Major (TCR) - Between JAN-2005 and DEC-2005, Contaminant: Coliform (TCR). Follow-up actions: St Violation/Reminder Notice (JUL-11-2007)
Past monitoring violations:
- Monitoring, Repeat Major (TCR) - In JUN-2010, Contaminant: Coliform (TCR). Follow-up actions: St Compliance achieved (SEP-08-2010)
- One routine major monitoring violation
- One regular monitoring violation
Drinking water stations with addresses in Maywood that have no violations reported:
- LANSING WOODS GR 2 6220 (Population served: 400, Primary Water Source Type: Groundwater)
- LANSING WOODS GR HP 6265 (Population served: 400, Primary Water Source Type: Groundwater)
- SCHILLER WOODS 3102 (Population served: 400, Primary Water Source Type: Groundwater)
- SCHILLER WOODS W 3072 (Population served: 400, Primary Water Source Type: Groundwater)
- SCHILLER WOODS W GR 3080 (Population served: 25, Primary Water Source Type: Groundwater)
- WAYSIDE WDS 2090 (Population served: 25, Primary Water Source Type: Groundwater)
- POWDERHORN LAKE HP 5293 (Population served: 25, Primary Water Source Type: Groundwater)
- MIDLOTHIAN MEADOW 5072 (Population served: 25, Primary Water Source Type: Groundwater)
- LINNE WOODS 2104 (Population served: 25, Primary Water Source Type: Groundwater)
- MIDLOTHIAN MEADOW 5069 (Population served: 25, Primary Water Source Type: Groundwater)
| This village: | 3.2 people |
| Illinois: | 2.6 people |
| This village: | 74.8% |
| Whole state: | 65.8% |
| This village: | 6.4% |
| Whole state: | 6.3% |
Likely homosexual households (counted as self-reported same-sex unmarried-partner households)
- Lesbian couples: 0.6% of all households
- Gay men: 0.2% of all households
People in group quarters in Maywood in 2010:
- 31 people in residential treatment centers for adults
- 12 people in workers' group living quarters and job corps centers
- 11 people in group homes intended for adults
People in group quarters in Maywood in 2000:
- 130 people in other noninstitutional group quarters
- 36 people in homes or halfway houses for drug/alcohol abuse
- 21 people in homes for the mentally ill
- 2 people in religious group quarters
Banks with branches in Maywood (2011 data):
- Seaway Bank and Trust Company: First Suburban National Bank Branch at 150 South 5th Avenue, branch established on 1943/09/07. Info updated 2011/03/14: Bank assets: $603.1 mil, Deposits: $527.9 mil, headquarters in Chicago, IL, positive income, Commercial Lending Specialization, 12 total offices, Holding Company: Seaway Bancshares, Inc.
- U.S. Bank National Association: Maywood Branch at 400 Madison Street, branch established on 2000/03/27. Info updated 2012/01/30: Bank assets: $330,470.8 mil, Deposits: $236,091.5 mil, headquarters in Cincinnati, OH, positive income, 3121 total offices, Holding Company: U.S. Bancorp
For population 15 years and over in Maywood:
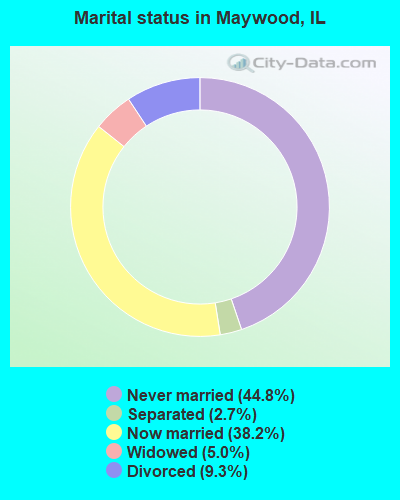
- Never married: 44.8%
- Now married: 38.2%
- Separated: 2.7%
- Widowed: 5.0%
- Divorced: 9.3%
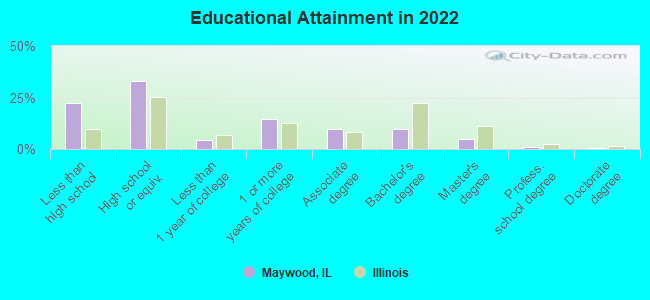
For population 25 years and over in Maywood:
- High school or higher: 77.7%
- Bachelor's degree or higher: 15.5%
- Graduate or professional degree: 6.1%
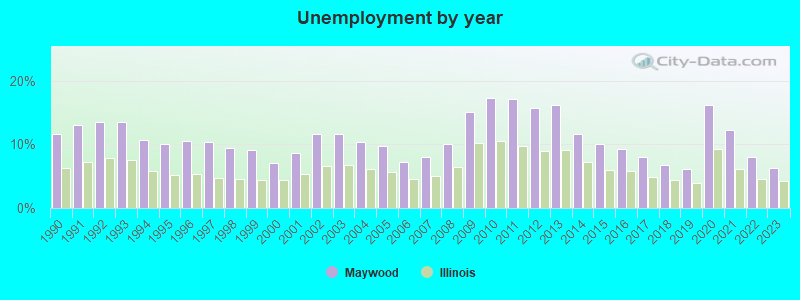
- Unemployed: 11.7%
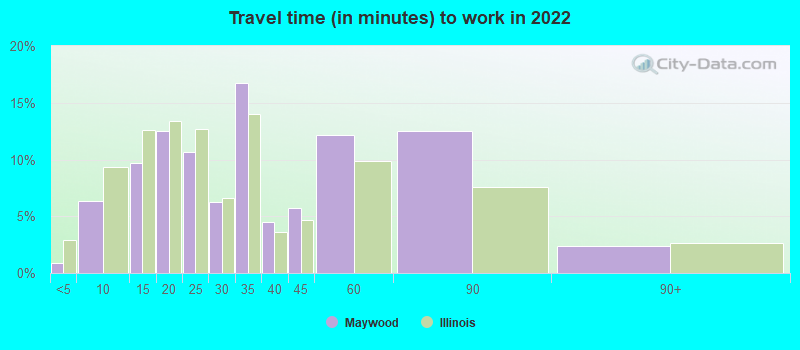
- Mean travel time to work (commute): 27.5 minutes
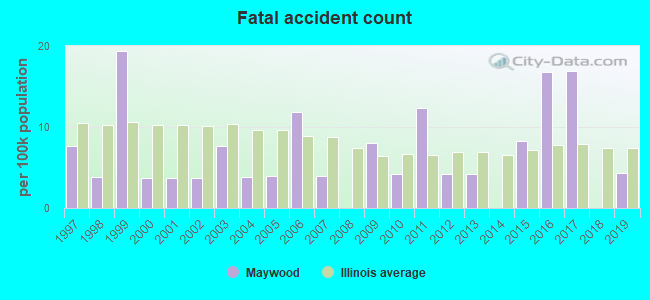
| Here: | 15.8 |
| Illinois average: | 12.5 |


Graphs represent county-level data. Detailed 2008 Election Results
Neighborhoods in Maywood:
(Maywood, Illinois Neighborhood Map)Religion statistics for Maywood, IL (based on Cook County data)


| Religion | Adherents | Congregations |
|---|---|---|
| Catholic | 1,947,223 | 376 |
| Evangelical Protestant | 432,975 | 1,484 |
| Other | 312,636 | 403 |
| Mainline Protestant | 202,114 | 630 |
| Black Protestant | 148,895 | 395 |
| Orthodox | 53,276 | 66 |
| None | 2,097,556 | - |
Food Environment Statistics:
| This county: | 2.77 / 10,000 pop. |
| Illinois: | 2.24 / 10,000 pop. |
| This county: | 0.04 / 10,000 pop. |
| Illinois: | 0.08 / 10,000 pop. |
| Here: | 0.93 / 10,000 pop. |
| State: | 0.75 / 10,000 pop. |
| Cook County: | 1.53 / 10,000 pop. |
| Illinois: | 2.61 / 10,000 pop. |
| This county: | 6.67 / 10,000 pop. |
| Illinois: | 6.86 / 10,000 pop. |
| Cook County: | 8.4% |
| Illinois: | 8.3% |
| Here: | 23.5% |
| State: | 25.2% |
| Cook County: | 16.3% |
| State: | 14.5% |
Health and Nutrition:
| Maywood: | 47.2% |
| Illinois: | 49.5% |
| Maywood: | 45.0% |
| State: | 47.2% |
| Here: | 30.1 |
| Illinois: | 28.6 |
| Maywood: | 18.5% |
| Illinois: | 20.5% |
| Maywood: | 13.4% |
| Illinois: | 10.8% |
| This city: | 6.6 |
| Illinois: | 6.8 |
| This city: | 36.2% |
| Illinois: | 33.4% |
| Maywood: | 53.4% |
| Illinois: | 56.4% |
| Maywood: | 83.6% |
| Illinois: | 79.9% |
More about Health and Nutrition of Maywood, IL Residents
| Local government employment and payroll (March 2022) | |||||
| Function | Full-time employees | Monthly full-time payroll | Average yearly full-time wage | Part-time employees | Monthly part-time payroll |
|---|---|---|---|---|---|
| Police Protection - Officers | 40 | $351,814 | $105,544 | 3 | $5,575 |
| Firefighters | 40 | $358,654 | $107,596 | 0 | $0 |
| Other and Unallocable | 16 | $80,822 | $60,617 | 0 | $0 |
| Streets and Highways | 10 | $62,553 | $75,064 | 0 | $0 |
| Financial Administration | 8 | $44,150 | $66,225 | 1 | $639 |
| Police - Other | 7 | $31,765 | $54,454 | 11 | $8,771 |
| Other Government Administration | 6 | $45,528 | $91,056 | 10 | $10,864 |
| Housing and Community Development (Local) | 4 | $39,713 | $119,139 | 0 | $0 |
| Fire - Other | 2 | $9,447 | $56,682 | 0 | $0 |
| Sewerage | 1 | $5,929 | $71,148 | 0 | $0 |
| Water Supply | 1 | $7,185 | $86,220 | 0 | $0 |
| Totals for Government | 135 | $1,037,559 | $92,227 | 25 | $25,848 |
Maywood government finances - Expenditure in 2021 (per resident):
- Construction - General - Other: $396,000 ($17.27)
- Current Operations - Police Protection: $13,487,000 ($588.13)
Water Utilities: $9,627,000 ($419.81)
Local Fire Protection: $8,397,000 ($366.17)
General Public Buildings: $5,128,000 ($223.62)
Regular Highways: $4,284,000 ($186.81)
General - Other: $1,187,000 ($51.76)
Financial Administration: $849,000 ($37.02)
Parks and Recreation: $100,000 ($4.36)
- General - Interest on Debt: $524,000 ($22.85)
- Intergovernmental to Local - Other - General - Other: $4,501,000 ($196.28)
- Other Capital Outlay - Regular Highways: $2,887,000 ($125.89)
Central Staff Services: $966,000 ($42.12)
Police Protection: $253,000 ($11.03)
Water Utilities: $116,000 ($5.06)
Local Fire Protection: $26,000 ($1.13)
- Total Salaries and Wages: $13,755,000 ($599.82)
Maywood government finances - Revenue in 2021 (per resident):
- Charges - Solid Waste Management: $1,973,000 ($86.04)
Sewerage: $337,000 ($14.70)
- Federal Intergovernmental - General Local Government Support: $794,000 ($34.62)
- Miscellaneous - General Revenue - Other: $892,000 ($38.90)
Fines and Forfeits: $271,000 ($11.82)
Interest Earnings: $22,000 ($0.96)
- Revenue - Water Utilities: $8,004,000 ($349.03)
- State Intergovernmental - General Local Government Support: $5,653,000 ($246.51)
Highways: $747,000 ($32.57)
Other: $19,000 ($0.83)
- Tax - Property: $24,835,000 ($1082.98)
Other Selective Sales: $1,402,000 ($61.14)
Public Utilities Sales: $1,315,000 ($57.34)
Other License: $1,310,000 ($57.13)
Maywood government finances - Debt in 2021 (per resident):
- Long Term Debt - Beginning Outstanding - Unspecified Public Purpose: $5,424,000 ($236.53)
Outstanding Unspecified Public Purpose: $3,043,000 ($132.70)
Retired Unspecified Public Purpose: $2,381,000 ($103.83)
Maywood government finances - Cash and Securities in 2021 (per resident):
- Other Funds - Cash and Securities: $15,449,000 ($673.69)
3.53% of this county's 2021 resident taxpayers lived in other counties in 2020 ($82,405 average adjusted gross income)
| Here: | 3.53% |
| Illinois average: | 5.09% |
0.01% of residents moved from foreign countries ($114 average AGI)
Cook County: 0.01% Illinois average: 0.01%
Top counties from which taxpayers relocated into this county between 2020 and 2021:
| from DuPage County, IL | |
| from Lake County, IL | |
| from Will County, IL |
5.44% of this county's 2020 resident taxpayers moved to other counties in 2021 ($120,340 average adjusted gross income)
| Here: | 5.44% |
| Illinois average: | 6.10% |
0.01% of residents moved to foreign countries ($140 average AGI)
Cook County: 0.01% Illinois average: 0.01%
Top counties to which taxpayers relocated from this county between 2020 and 2021:
| to DuPage County, IL | |
| to Will County, IL | |
| to Lake County, IL |
| Businesses in Maywood, IL | ||||
| Name | Count | Name | Count | |
|---|---|---|---|---|
| AutoZone | 1 | McDonald's | 1 | |
| Burger King | 2 | Popeyes | 1 | |
| Church's Chicken | 1 | Subway | 1 | |
| Cricket Wireless | 1 | UPS | 8 | |
| Dunkin Donuts | 1 | Walgreens | 1 | |
| H&R Block | 1 | White Castle | 1 | |
Strongest AM radio stations in Maywood:
- WMVP (1000 AM; 50 kW; CHICAGO, IL; Owner: ABC, INC.)
- WSCR (670 AM; 50 kW; CHICAGO, IL; Owner: INFINITY BROADCASTING OPERATIONS, INC.)
- WBBM (780 AM; 50 kW; CHICAGO, IL; Owner: INFINITY BROADCASTING OPERATIONS, INC.)
- WGN (720 AM; 50 kW; CHICAGO, IL; Owner: WGN CONTINENTAL BROADCASTING CO.)
- WCSN (820 AM; 5 kW; CHICAGO, IL; Owner: WYPA, INC.)
- WLS (890 AM; 50 kW; CHICAGO, IL; Owner: WLS, INC.)
- WPNA (1490 AM; 1 kW; OAK PARK, IL; Owner: ALLIANCE COMMUNICATIONS, INC.)
- WYLL (1160 AM; 50 kW; CHICAGO, IL; Owner: SCA LICENSE CORPORATION)
- WJJG (1530 AM; daytime; 2 kW; ELMHURST, IL; Owner: JOSEPH J. GENTILE, INC.)
- WMBI (1110 AM; daytime; 5 kW; CHICAGO, IL; Owner: THE MOODY BIBLE INSTITUTE OF CHICAGO)
- WVIV (1200 AM; 20 kW; CHICAGO, IL; Owner: WLXX-AM LICENSE CORP.)
- WGCI (1390 AM; 5 kW; CHICAGO, IL; Owner: AMFM RADIO LICENSES, L.L.C.)
- WTMJ (620 AM; 50 kW; MILWAUKEE, WI; Owner: JOURNAL BROADCAST CORPORATION)
Strongest FM radio stations in Maywood:
- WCKG (105.9 FM; ELMWOOD PARK, IL; Owner: INFINITY HOLDINGS CORPORATION OF ORLANDO)
- WLIT-FM (93.9 FM; CHICAGO, IL; Owner: AMFM RADIO LICENSES, L.L.C.)
- WJMK (104.3 FM; CHICAGO, IL; Owner: INFINITY BROADCASTING CORP. OF ILLINOIS)
- WNUA (95.5 FM; CHICAGO, IL; Owner: AMFM RADIO LICENSES, L.L.C.)
- WGCI-FM (107.5 FM; CHICAGO, IL; Owner: AMFM RADIO LICENSES, L.L.C.)
- WTMX (101.9 FM; SKOKIE, IL; Owner: BONNEVILLE HOLDING COMPANY)
- WBBM-FM (96.3 FM; CHICAGO, IL; Owner: INFINITY BROADCASTING OPERATIONS, INC.)
- WKSC-FM (103.5 FM; CHICAGO, IL; Owner: AMFM RADIO LICENSES, L.L.C.)
- WFMT (98.7 FM; CHICAGO, IL; Owner: WINDOW TO THE WORLD COMMUNICATIONS)
- WZZN (94.7 FM; CHICAGO, IL; Owner: ABC CHICAGO FM RADIO,INC.)
- WBEZ (91.5 FM; CHICAGO, IL; Owner: THE WBEZ ALLIANCE, INC.)
- WKQX (101.1 FM; CHICAGO, IL; Owner: EMMIS RADIO LICENSE CORPORATION)
- WLUP-FM (97.9 FM; CHICAGO, IL; Owner: BONNEVILLE HOLDING COMPANY)
- WNND (100.3 FM; CHICAGO, IL; Owner: BONNEVILLE HOLDING COMPANY)
- WOJO (105.1 FM; EVANSTON, IL; Owner: TICHENOR LICENSE CORPORATION ("TLC"))
- WUSN (99.5 FM; CHICAGO, IL; Owner: INFINITY BROADCASTING CORPORATION OF CHICAGO)
- WVAZ (102.7 FM; OAK PARK, IL; Owner: AMFM RADIO LICENSES, L.L.C.)
- WDRV (97.1 FM; CHICAGO, IL; Owner: BONNEVILLE HOLDING COMPANY)
- WXRT-FM (93.1 FM; CHICAGO, IL; Owner: INFINITY BROADCASTING OPERATIONS, INC.)
- WLEY-FM (107.9 FM; AURORA, IL; Owner: WLEY LICENSING, INC.)
TV broadcast stations around Maywood:
- WLS-TV (Channel 7; CHICAGO, IL; Owner: WLS TELEVISION, INC.)
- WMAQ-TV (Channel 5; CHICAGO, IL; Owner: NBC SUBSIDIARY (WMAQ-TV), INC.)
- WTTW (Channel 11; CHICAGO, IL; Owner: WINDOW TO THE WORLD COMMUNICATIONS, INC.)
- WGN-TV (Channel 9; CHICAGO, IL; Owner: WGN CONTINENTAL BROADCASTING COMPANY)
- WGBO-TV (Channel 66; JOLIET, IL; Owner: WGBO LICENSE PARTNERSHIP, G.P.)
- WBBM-TV (Channel 2; CHICAGO, IL; Owner: CBS BROADCASTING INC.)
- WPWR-TV (Channel 50; GARY, IN; Owner: FOX TELEVISION STATIONS, INC.)
- WXFT (Channel 60; AURORA, IL; Owner: TELEFUTURA CHICAGO LLC)
- WCIU-TV (Channel 26; CHICAGO, IL; Owner: WCIU-TV LIMITED PARTNERSHIP)
- WCPX (Channel 38; CHICAGO, IL; Owner: PAXSON CHICAGO LICENSE, INC.)
- WFLD (Channel 32; CHICAGO, IL; Owner: FOX TELEVISION STATIONS, INC.)
- W68DO (Channel 68; PALATINE, IL; Owner: TRINITY BROADCASTING NETWORK)
- WFBT-CA (Channel 23; CHICAGO, IL; Owner: CHANNEL 23 LIMITED PARTNERSHIP)
- WJYS (Channel 62; HAMMOND, IN; Owner: JOVON BROADCASTING CORPORATION)
- WSNS-TV (Channel 44; CHICAGO, IL; Owner: TELEMUNDO OF CHICAGO, INC.)
- WOCH-LP (Channel 28; CHICAGO, IL; Owner: KM LPTV OF CHICAGO-28, L.L.C.)
- WYCC (Channel 20; CHICAGO, IL; Owner: COLLEGE DIST. #508, COUNTY OF COOK)
- WOCK-CA (Channel 13; CHICAGO, IL; Owner: KM LPTV OF CHICAGO-13, L.L.C.)
- W34CK (Channel 34; ARLINGTON HEIGHTS, IL; Owner: FIRST UNITED, INC.)
- W64CQ (Channel 64; ARLINGTON HEIGHTS, IL; Owner: TRINITY BROADCASTING NETWORK)
- WYIN (Channel 56; GARY, IN; Owner: NORTHWEST INDIANA PUBLIC BROADCASTING, INC.)
- W57DN (Channel 57; ELGIN, IL; Owner: TRINITY BROADCASTING NETWORK)
- W24AJ (Channel 24; AURORA, IL; Owner: NELSON TV, INC.)
- W54AP (Channel 54; BLUE ISLAND, IL; Owner: CATHOLIC VIEWS BROADCASTS, INC.)
- National Bridge Inventory (NBI) Statistics
- 9Number of bridges
- 108ft / 32.6mTotal length
- $3,678,000Total costs
- 591,000Total average daily traffic
- 34,954Total average daily truck traffic
FCC Registered Private Land Mobile Towers: 5 (See the full list of FCC Registered Private Land Mobile Towers in Maywood, IL)
FCC Registered Broadcast Land Mobile Towers: 16 (See the full list of FCC Registered Broadcast Land Mobile Towers)
FCC Registered Microwave Towers: 15 (See the full list of FCC Registered Microwave Towers in this town)
FCC Registered Paging Towers: 3 (See the full list of FCC Registered Paging Towers)
FCC Registered Maritime Coast & Aviation Ground Towers: 1 (See the full list of FCC Registered Maritime Coast & Aviation Ground Towers)
FCC Registered Amateur Radio Licenses: 21 (See the full list of FCC Registered Amateur Radio Licenses in Maywood)
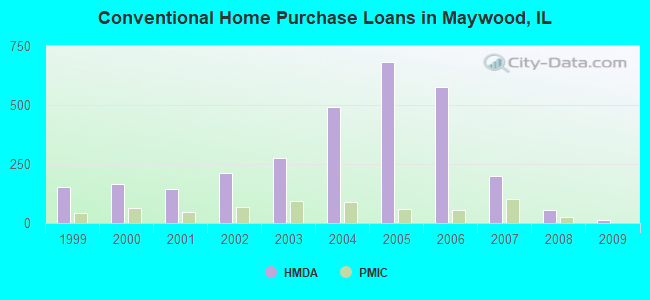
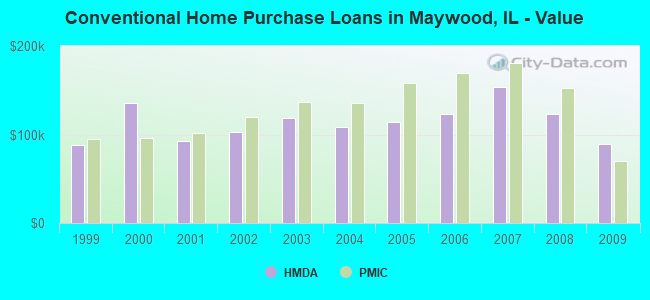
| Home Mortgage Disclosure Act Aggregated Statistics For Year 2009 (Based on 5 full and 1 partial tracts) | ||||||||||||
| A) FHA, FSA/RHS & VA Home Purchase Loans | B) Conventional Home Purchase Loans | C) Refinancings | D) Home Improvement Loans | E) Loans on Dwellings For 5+ Families | F) Non-occupant Loans on < 5 Family Dwellings (A B C & D) | |||||||
|---|---|---|---|---|---|---|---|---|---|---|---|---|
| Number | Average Value | Number | Average Value | Number | Average Value | Number | Average Value | Number | Average Value | Number | Average Value | |
| LOANS ORIGINATED | 46 | $126,627 | 13 | $89,357 | 195 | $148,022 | 19 | $36,787 | 5 | $1,106,650 | 27 | $93,488 |
| APPLICATIONS APPROVED, NOT ACCEPTED | 7 | $114,220 | 4 | $82,005 | 42 | $145,089 | 6 | $15,008 | 0 | $0 | 3 | $85,257 |
| APPLICATIONS DENIED | 21 | $125,518 | 13 | $102,401 | 208 | $144,400 | 32 | $52,015 | 2 | $430,080 | 17 | $109,268 |
| APPLICATIONS WITHDRAWN | 12 | $108,269 | 4 | $71,750 | 75 | $142,641 | 0 | $0 | 0 | $0 | 4 | $129,885 |
| FILES CLOSED FOR INCOMPLETENESS | 7 | $116,610 | 2 | $56,500 | 30 | $159,412 | 2 | $20,000 | 1 | $345,000 | 2 | $175,305 |
Detailed HMDA statistics for the following Tracts: 8172.00 , 8173.00, 8174.00, 8175.00, 8176.00, 8177.00
| Private Mortgage Insurance Companies Aggregated Statistics For Year 2009 (Based on 5 full and 1 partial tracts) | ||||||
| A) Conventional Home Purchase Loans | B) Refinancings | C) Non-occupant Loans on < 5 Family Dwellings (A & B) | ||||
|---|---|---|---|---|---|---|
| Number | Average Value | Number | Average Value | Number | Average Value | |
| LOANS ORIGINATED | 2 | $70,500 | 3 | $131,780 | 0 | $0 |
| APPLICATIONS APPROVED, NOT ACCEPTED | 5 | $120,034 | 4 | $179,500 | 0 | $0 |
| APPLICATIONS DENIED | 0 | $0 | 1 | $80,000 | 0 | $0 |
| APPLICATIONS WITHDRAWN | 1 | $40,000 | 3 | $91,447 | 0 | $0 |
| FILES CLOSED FOR INCOMPLETENESS | 1 | $51,000 | 0 | $0 | 1 | $51,000 |
Detailed PMIC statistics for the following Tracts: 8172.00 , 8173.00, 8174.00, 8175.00, 8176.00, 8177.00
2002 - 2018 National Fire Incident Reporting System (NFIRS) incidents
- Fire incident types reported to NFIRS in Maywood, IL
- 1,75362.9%Structure Fires
- 43315.5%Outside Fires
- 41414.8%Mobile Property/Vehicle Fires
- 1896.8%Other
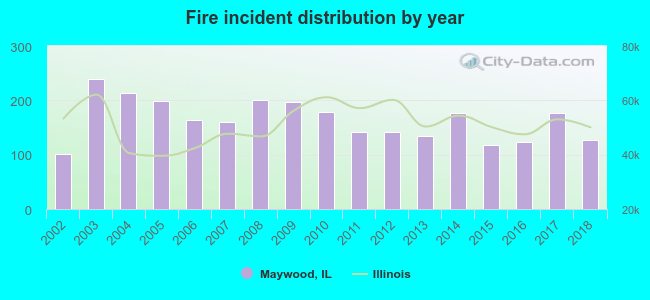 Based on the data from the years 2002 - 2018 the average number of fires per year is 164. The highest number of reported fires - 239 took place in 2003, and the least - 101 in 2002. The data has a rising trend.
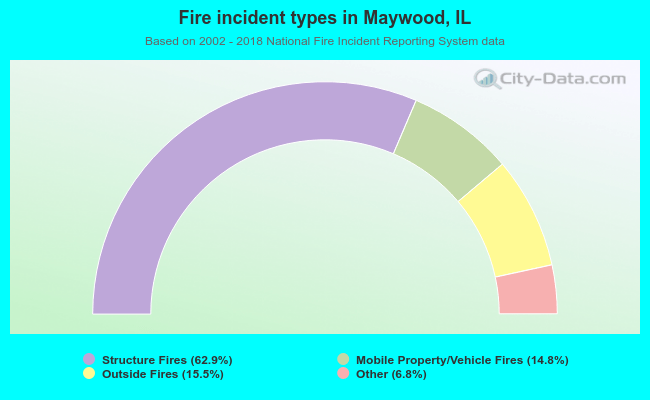 When looking into fire subcategories, the most reports belonged to: Structure Fires (62.9%), and Outside Fires (15.5%).
| Most common first names in Maywood, IL among deceased individuals | ||
| Name | Count | Lived (average) |
|---|---|---|
| John | 329 | 72.7 years |
| Mary | 302 | 78.5 years |
| William | 258 | 72.2 years |
| James | 232 | 70.6 years |
| Joseph | 202 | 72.2 years |
| Frank | 167 | 75.2 years |
| George | 164 | 73.5 years |
| Charles | 157 | 71.0 years |
| Anna | 157 | 82.6 years |
| Robert | 148 | 67.1 years |
| Most common last names in Maywood, IL among deceased individuals | ||
| Last name | Count | Lived (average) |
|---|---|---|
| Williams | 148 | 69.1 years |
| Smith | 141 | 70.1 years |
| Johnson | 98 | 69.9 years |
| Brown | 82 | 67.8 years |
| Jones | 79 | 70.4 years |
| Miller | 72 | 70.8 years |
| Jackson | 57 | 69.4 years |
| Robinson | 54 | 66.7 years |
| Thomas | 53 | 70.0 years |
| Davis | 51 | 68.6 years |
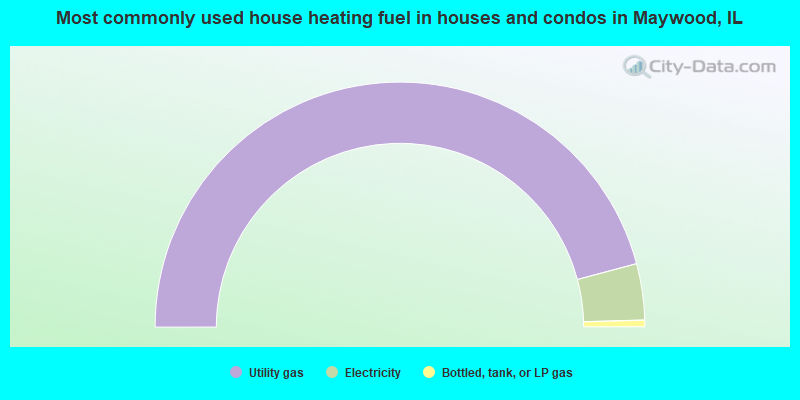
- 91.6%Utility gas
- 7.4%Electricity
- 0.9%Bottled, tank, or LP gas
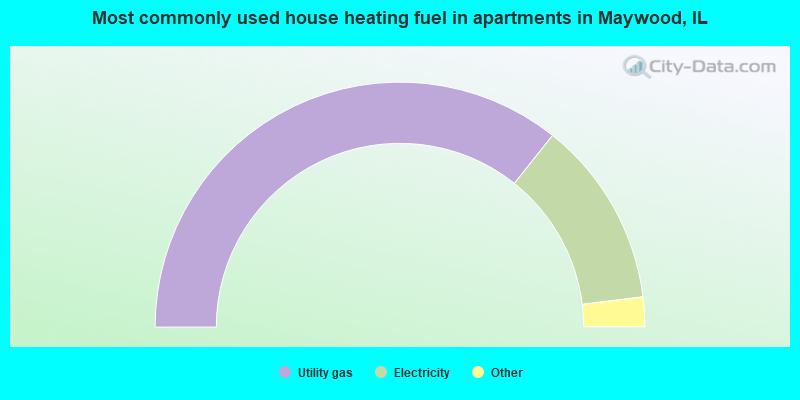
- 71.4%Utility gas
- 24.7%Electricity
- 2.4%Bottled, tank, or LP gas
- 1.1%Other fuel
- 0.4%No fuel used
Maywood compared to Illinois state average:
- Black race population percentage significantly above state average.
- Median age below state average.
- Length of stay since moving in significantly above state average.
- House age above state average.
- Percentage of population with a bachelor's degree or higher below state average.
Maywood on our top lists:
- #40 on the list of "Top 100 cities with old houses but young residents (pop. 5,000+)"
- #53 on the list of "Top 101 cities with largest percentage of females in industries: transportation and warehousing (population 5,000+)"
- #63 on the list of "Top 100 cities with oldest houses (pop. 5,000+)"
- #68 on the list of "Top 101 cities with the highest number of murders per 100,000 residents, excludes tourist destinations and others with a lot of outsiders visiting based on city industries data (population 5,000+)"
- #93 on the list of "Top 101 cities with largest percentage of males in occupations: transportation occupations (population 5,000+)"
- #85 (60153) on the list of "Top 101 zip codes with the lowest 2012 average net capital gain/loss (pop 5,000+)"
- #1 on the list of "Top 101 counties with the most Black Protestant congregations"
- #1 on the list of "Top 101 counties with the most Catholic congregations"
- #1 on the list of "Top 101 counties with the highest surface withdrawal of fresh water for public supply"
- #2 on the list of "Top 101 counties with the most Black Protestant adherents"
- #2 on the list of "Top 101 counties with the most Orthodox congregations (pop. 50,000+)"

|
|
Total of 18 patent applications in 2008-2024.