Miamisburg, Ohio Submit your own pictures of this city and show them to the world
OSM Map
General Map
Google Map
MSN Map
OSM Map
General Map
Google Map
MSN Map
OSM Map
General Map
Google Map
MSN Map
OSM Map
General Map
Google Map
MSN Map
Please wait while loading the map...
Population in 2022: 19,780 (99% urban, 1% rural). Population change since 2000: +1.5%Males: 9,746 Females: 10,034
March 2022 cost of living index in Miamisburg: 94.6 (less than average, U.S. average is 100) Percentage of residents living in poverty in 2022: 12.9%for White Non-Hispanic residents , 18.4% for Black residents , 23.9% for Hispanic or Latino residents , 16.5% for other race residents , 33.2% for two or more races residents )
Profiles of local businesses
Business Search - 14 Million verified businesses
Data:
Median household income ($)
Median household income (% change since 2000)
Household income diversity
Ratio of average income to average house value (%)
Ratio of average income to average rent
Median household income ($) - White
Median household income ($) - Black or African American
Median household income ($) - Asian
Median household income ($) - Hispanic or Latino
Median household income ($) - American Indian and Alaska Native
Median household income ($) - Multirace
Median household income ($) - Other Race
Median household income for houses/condos with a mortgage ($)
Median household income for apartments without a mortgage ($)
Races - White alone (%)
Races - White alone (% change since 2000)
Races - Black alone (%)
Races - Black alone (% change since 2000)
Races - American Indian alone (%)
Races - American Indian alone (% change since 2000)
Races - Asian alone (%)
Races - Asian alone (% change since 2000)
Races - Hispanic (%)
Races - Hispanic (% change since 2000)
Races - Native Hawaiian and Other Pacific Islander alone (%)
Races - Native Hawaiian and Other Pacific Islander alone (% change since 2000)
Races - Two or more races (%)
Races - Two or more races (% change since 2000)
Races - Other race alone (%)
Races - Other race alone (% change since 2000)
Racial diversity
Unemployment (%)
Unemployment (% change since 2000)
Unemployment (%) - White
Unemployment (%) - Black or African American
Unemployment (%) - Asian
Unemployment (%) - Hispanic or Latino
Unemployment (%) - American Indian and Alaska Native
Unemployment (%) - Multirace
Unemployment (%) - Other Race
Population density (people per square mile)
Population - Males (%)
Population - Females (%)
Population - Males (%) - White
Population - Males (%) - Black or African American
Population - Males (%) - Asian
Population - Males (%) - Hispanic or Latino
Population - Males (%) - American Indian and Alaska Native
Population - Males (%) - Multirace
Population - Males (%) - Other Race
Population - Females (%) - White
Population - Females (%) - Black or African American
Population - Females (%) - Asian
Population - Females (%) - Hispanic or Latino
Population - Females (%) - American Indian and Alaska Native
Population - Females (%) - Multirace
Population - Females (%) - Other Race
Coronavirus confirmed cases (Apr 26, 2024)
Deaths caused by coronavirus (Apr 26, 2024)
Coronavirus confirmed cases (per 100k population) (Apr 26, 2024)
Deaths caused by coronavirus (per 100k population) (Apr 26, 2024)
Daily increase in number of cases (Apr 26, 2024)
Weekly increase in number of cases (Apr 26, 2024)
Cases doubled (in days) (Apr 26, 2024)
Hospitalized patients (Apr 18, 2022)
Negative test results (Apr 18, 2022)
Total test results (Apr 18, 2022)
COVID Vaccine doses distributed (per 100k population) (Sep 19, 2023)
COVID Vaccine doses administered (per 100k population) (Sep 19, 2023)
COVID Vaccine doses distributed (Sep 19, 2023)
COVID Vaccine doses administered (Sep 19, 2023)
Likely homosexual households (%)
Likely homosexual households (% change since 2000)
Likely homosexual households - Lesbian couples (%)
Likely homosexual households - Lesbian couples (% change since 2000)
Likely homosexual households - Gay men (%)
Likely homosexual households - Gay men (% change since 2000)
Cost of living index
Median gross rent ($)
Median contract rent ($)
Median monthly housing costs ($)
Median house or condo value ($)
Median house or condo value ($ change since 2000)
Mean house or condo value by units in structure - 1, detached ($)
Mean house or condo value by units in structure - 1, attached ($)
Mean house or condo value by units in structure - 2 ($)
Mean house or condo value by units in structure by units in structure - 3 or 4 ($)
Mean house or condo value by units in structure - 5 or more ($)
Mean house or condo value by units in structure - Boat, RV, van, etc. ($)
Mean house or condo value by units in structure - Mobile home ($)
Median house or condo value ($) - White
Median house or condo value ($) - Black or African American
Median house or condo value ($) - Asian
Median house or condo value ($) - Hispanic or Latino
Median house or condo value ($) - American Indian and Alaska Native
Median house or condo value ($) - Multirace
Median house or condo value ($) - Other Race
Median resident age
Resident age diversity
Median resident age - Males
Median resident age - Females
Median resident age - White
Median resident age - Black or African American
Median resident age - Asian
Median resident age - Hispanic or Latino
Median resident age - American Indian and Alaska Native
Median resident age - Multirace
Median resident age - Other Race
Median resident age - Males - White
Median resident age - Males - Black or African American
Median resident age - Males - Asian
Median resident age - Males - Hispanic or Latino
Median resident age - Males - American Indian and Alaska Native
Median resident age - Males - Multirace
Median resident age - Males - Other Race
Median resident age - Females - White
Median resident age - Females - Black or African American
Median resident age - Females - Asian
Median resident age - Females - Hispanic or Latino
Median resident age - Females - American Indian and Alaska Native
Median resident age - Females - Multirace
Median resident age - Females - Other Race
Commute - mean travel time to work (minutes)
Travel time to work - Less than 5 minutes (%)
Travel time to work - Less than 5 minutes (% change since 2000)
Travel time to work - 5 to 9 minutes (%)
Travel time to work - 5 to 9 minutes (% change since 2000)
Travel time to work - 10 to 19 minutes (%)
Travel time to work - 10 to 19 minutes (% change since 2000)
Travel time to work - 20 to 29 minutes (%)
Travel time to work - 20 to 29 minutes (% change since 2000)
Travel time to work - 30 to 39 minutes (%)
Travel time to work - 30 to 39 minutes (% change since 2000)
Travel time to work - 40 to 59 minutes (%)
Travel time to work - 40 to 59 minutes (% change since 2000)
Travel time to work - 60 to 89 minutes (%)
Travel time to work - 60 to 89 minutes (% change since 2000)
Travel time to work - 90 or more minutes (%)
Travel time to work - 90 or more minutes (% change since 2000)
Marital status - Never married (%)
Marital status - Now married (%)
Marital status - Separated (%)
Marital status - Widowed (%)
Marital status - Divorced (%)
Median family income ($)
Median family income (% change since 2000)
Median non-family income ($)
Median non-family income (% change since 2000)
Median per capita income ($)
Median per capita income (% change since 2000)
Median family income ($) - White
Median family income ($) - Black or African American
Median family income ($) - Asian
Median family income ($) - Hispanic or Latino
Median family income ($) - American Indian and Alaska Native
Median family income ($) - Multirace
Median family income ($) - Other Race
Median year house/condo built
Median year apartment built
Year house built - Built 2005 or later (%)
Year house built - Built 2000 to 2004 (%)
Year house built - Built 1990 to 1999 (%)
Year house built - Built 1980 to 1989 (%)
Year house built - Built 1970 to 1979 (%)
Year house built - Built 1960 to 1969 (%)
Year house built - Built 1950 to 1959 (%)
Year house built - Built 1940 to 1949 (%)
Year house built - Built 1939 or earlier (%)
Average household size
Household density (households per square mile)
Average household size - White
Average household size - Black or African American
Average household size - Asian
Average household size - Hispanic or Latino
Average household size - American Indian and Alaska Native
Average household size - Multirace
Average household size - Other Race
Occupied housing units (%)
Vacant housing units (%)
Owner occupied housing units (%)
Renter occupied housing units (%)
Vacancy status - For rent (%)
Vacancy status - For sale only (%)
Vacancy status - Rented or sold, not occupied (%)
Vacancy status - For seasonal, recreational, or occasional use (%)
Vacancy status - For migrant workers (%)
Vacancy status - Other vacant (%)
Residents with income below the poverty level (%)
Residents with income below 50% of the poverty level (%)
Children below poverty level (%)
Poor families by family type - Married-couple family (%)
Poor families by family type - Male, no wife present (%)
Poor families by family type - Female, no husband present (%)
Poverty status for native-born residents (%)
Poverty status for foreign-born residents (%)
Poverty among high school graduates not in families (%)
Poverty among people who did not graduate high school not in families (%)
Residents with income below the poverty level (%) - White
Residents with income below the poverty level (%) - Black or African American
Residents with income below the poverty level (%) - Asian
Residents with income below the poverty level (%) - Hispanic or Latino
Residents with income below the poverty level (%) - American Indian and Alaska Native
Residents with income below the poverty level (%) - Multirace
Residents with income below the poverty level (%) - Other Race
Air pollution - Air Quality Index (AQI)
Air pollution - CO
Air pollution - NO2
Air pollution - SO2
Air pollution - Ozone
Air pollution - PM10
Air pollution - PM25
Air pollution - Pb
Crime - Murders per 100,000 population
Crime - Rapes per 100,000 population
Crime - Robberies per 100,000 population
Crime - Assaults per 100,000 population
Crime - Burglaries per 100,000 population
Crime - Thefts per 100,000 population
Crime - Auto thefts per 100,000 population
Crime - Arson per 100,000 population
Crime - City-data.com crime index
Crime - Violent crime index
Crime - Property crime index
Crime - Murders per 100,000 population (5 year average)
Crime - Rapes per 100,000 population (5 year average)
Crime - Robberies per 100,000 population (5 year average)
Crime - Assaults per 100,000 population (5 year average)
Crime - Burglaries per 100,000 population (5 year average)
Crime - Thefts per 100,000 population (5 year average)
Crime - Auto thefts per 100,000 population (5 year average)
Crime - Arson per 100,000 population (5 year average)
Crime - City-data.com crime index (5 year average)
Crime - Violent crime index (5 year average)
Crime - Property crime index (5 year average)
1996 Presidential Elections Results (%) - Democratic Party (Clinton)
1996 Presidential Elections Results (%) - Republican Party (Dole)
1996 Presidential Elections Results (%) - Other
2000 Presidential Elections Results (%) - Democratic Party (Gore)
2000 Presidential Elections Results (%) - Republican Party (Bush)
2000 Presidential Elections Results (%) - Other
2004 Presidential Elections Results (%) - Democratic Party (Kerry)
2004 Presidential Elections Results (%) - Republican Party (Bush)
2004 Presidential Elections Results (%) - Other
2008 Presidential Elections Results (%) - Democratic Party (Obama)
2008 Presidential Elections Results (%) - Republican Party (McCain)
2008 Presidential Elections Results (%) - Other
2012 Presidential Elections Results (%) - Democratic Party (Obama)
2012 Presidential Elections Results (%) - Republican Party (Romney)
2012 Presidential Elections Results (%) - Other
2016 Presidential Elections Results (%) - Democratic Party (Clinton)
2016 Presidential Elections Results (%) - Republican Party (Trump)
2016 Presidential Elections Results (%) - Other
2020 Presidential Elections Results (%) - Democratic Party (Biden)
2020 Presidential Elections Results (%) - Republican Party (Trump)
2020 Presidential Elections Results (%) - Other
Ancestries Reported - Arab (%)
Ancestries Reported - Czech (%)
Ancestries Reported - Danish (%)
Ancestries Reported - Dutch (%)
Ancestries Reported - English (%)
Ancestries Reported - French (%)
Ancestries Reported - French Canadian (%)
Ancestries Reported - German (%)
Ancestries Reported - Greek (%)
Ancestries Reported - Hungarian (%)
Ancestries Reported - Irish (%)
Ancestries Reported - Italian (%)
Ancestries Reported - Lithuanian (%)
Ancestries Reported - Norwegian (%)
Ancestries Reported - Polish (%)
Ancestries Reported - Portuguese (%)
Ancestries Reported - Russian (%)
Ancestries Reported - Scotch-Irish (%)
Ancestries Reported - Scottish (%)
Ancestries Reported - Slovak (%)
Ancestries Reported - Subsaharan African (%)
Ancestries Reported - Swedish (%)
Ancestries Reported - Swiss (%)
Ancestries Reported - Ukrainian (%)
Ancestries Reported - United States (%)
Ancestries Reported - Welsh (%)
Ancestries Reported - West Indian (%)
Ancestries Reported - Other (%)
Educational Attainment - No schooling completed (%)
Educational Attainment - Less than high school (%)
Educational Attainment - High school or equivalent (%)
Educational Attainment - Less than 1 year of college (%)
Educational Attainment - 1 or more years of college (%)
Educational Attainment - Associate degree (%)
Educational Attainment - Bachelor's degree (%)
Educational Attainment - Master's degree (%)
Educational Attainment - Professional school degree (%)
Educational Attainment - Doctorate degree (%)
School Enrollment - Nursery, preschool (%)
School Enrollment - Kindergarten (%)
School Enrollment - Grade 1 to 4 (%)
School Enrollment - Grade 5 to 8 (%)
School Enrollment - Grade 9 to 12 (%)
School Enrollment - College undergrad (%)
School Enrollment - Graduate or professional (%)
School Enrollment - Not enrolled in school (%)
School enrollment - Public schools (%)
School enrollment - Private schools (%)
School enrollment - Not enrolled (%)
Median number of rooms in houses and condos
Median number of rooms in apartments
Housing units lacking complete plumbing facilities (%)
Housing units lacking complete kitchen facilities (%)
Density of houses
Urban houses (%)
Rural houses (%)
Households with people 60 years and over (%)
Households with people 65 years and over (%)
Households with people 75 years and over (%)
Households with one or more nonrelatives (%)
Households with no nonrelatives (%)
Population in households (%)
Family households (%)
Nonfamily households (%)
Population in families (%)
Family households with own children (%)
Median number of bedrooms in owner occupied houses
Mean number of bedrooms in owner occupied houses
Median number of bedrooms in renter occupied houses
Mean number of bedrooms in renter occupied houses
Median number of vehichles in owner occupied houses
Mean number of vehichles in owner occupied houses
Median number of vehichles in renter occupied houses
Mean number of vehichles in renter occupied houses
Mortgage status - with mortgage (%)
Mortgage status - with second mortgage (%)
Mortgage status - with home equity loan (%)
Mortgage status - with both second mortgage and home equity loan (%)
Mortgage status - without a mortgage (%)
Average family size
Average family size - White
Average family size - Black or African American
Average family size - Asian
Average family size - Hispanic or Latino
Average family size - American Indian and Alaska Native
Average family size - Multirace
Average family size - Other Race
Geographical mobility - Same house 1 year ago (%)
Geographical mobility - Moved within same county (%)
Geographical mobility - Moved from different county within same state (%)
Geographical mobility - Moved from different state (%)
Geographical mobility - Moved from abroad (%)
Place of birth - Born in state of residence (%)
Place of birth - Born in other state (%)
Place of birth - Native, outside of US (%)
Place of birth - Foreign born (%)
Housing units in structures - 1, detached (%)
Housing units in structures - 1, attached (%)
Housing units in structures - 2 (%)
Housing units in structures - 3 or 4 (%)
Housing units in structures - 5 to 9 (%)
Housing units in structures - 10 to 19 (%)
Housing units in structures - 20 to 49 (%)
Housing units in structures - 50 or more (%)
Housing units in structures - Mobile home (%)
Housing units in structures - Boat, RV, van, etc. (%)
House/condo owner moved in on average (years ago)
Renter moved in on average (years ago)
Year householder moved into unit - Moved in 1999 to March 2000 (%)
Year householder moved into unit - Moved in 1995 to 1998 (%)
Year householder moved into unit - Moved in 1990 to 1994 (%)
Year householder moved into unit - Moved in 1980 to 1989 (%)
Year householder moved into unit - Moved in 1970 to 1979 (%)
Year householder moved into unit - Moved in 1969 or earlier (%)
Means of transportation to work - Drove car alone (%)
Means of transportation to work - Carpooled (%)
Means of transportation to work - Public transportation (%)
Means of transportation to work - Bus or trolley bus (%)
Means of transportation to work - Streetcar or trolley car (%)
Means of transportation to work - Subway or elevated (%)
Means of transportation to work - Railroad (%)
Means of transportation to work - Ferryboat (%)
Means of transportation to work - Taxicab (%)
Means of transportation to work - Motorcycle (%)
Means of transportation to work - Bicycle (%)
Means of transportation to work - Walked (%)
Means of transportation to work - Other means (%)
Working at home (%)
Industry diversity
Most Common Industries - Agriculture, forestry, fishing and hunting, and mining (%)
Most Common Industries - Agriculture, forestry, fishing and hunting (%)
Most Common Industries - Mining, quarrying, and oil and gas extraction (%)
Most Common Industries - Construction (%)
Most Common Industries - Manufacturing (%)
Most Common Industries - Wholesale trade (%)
Most Common Industries - Retail trade (%)
Most Common Industries - Transportation and warehousing, and utilities (%)
Most Common Industries - Transportation and warehousing (%)
Most Common Industries - Utilities (%)
Most Common Industries - Information (%)
Most Common Industries - Finance and insurance, and real estate and rental and leasing (%)
Most Common Industries - Finance and insurance (%)
Most Common Industries - Real estate and rental and leasing (%)
Most Common Industries - Professional, scientific, and management, and administrative and waste management services (%)
Most Common Industries - Professional, scientific, and technical services (%)
Most Common Industries - Management of companies and enterprises (%)
Most Common Industries - Administrative and support and waste management services (%)
Most Common Industries - Educational services, and health care and social assistance (%)
Most Common Industries - Educational services (%)
Most Common Industries - Health care and social assistance (%)
Most Common Industries - Arts, entertainment, and recreation, and accommodation and food services (%)
Most Common Industries - Arts, entertainment, and recreation (%)
Most Common Industries - Accommodation and food services (%)
Most Common Industries - Other services, except public administration (%)
Most Common Industries - Public administration (%)
Occupation diversity
Most Common Occupations - Management, business, science, and arts occupations (%)
Most Common Occupations - Management, business, and financial occupations (%)
Most Common Occupations - Management occupations (%)
Most Common Occupations - Business and financial operations occupations (%)
Most Common Occupations - Computer, engineering, and science occupations (%)
Most Common Occupations - Computer and mathematical occupations (%)
Most Common Occupations - Architecture and engineering occupations (%)
Most Common Occupations - Life, physical, and social science occupations (%)
Most Common Occupations - Education, legal, community service, arts, and media occupations (%)
Most Common Occupations - Community and social service occupations (%)
Most Common Occupations - Legal occupations (%)
Most Common Occupations - Education, training, and library occupations (%)
Most Common Occupations - Arts, design, entertainment, sports, and media occupations (%)
Most Common Occupations - Healthcare practitioners and technical occupations (%)
Most Common Occupations - Health diagnosing and treating practitioners and other technical occupations (%)
Most Common Occupations - Health technologists and technicians (%)
Most Common Occupations - Service occupations (%)
Most Common Occupations - Healthcare support occupations (%)
Most Common Occupations - Protective service occupations (%)
Most Common Occupations - Fire fighting and prevention, and other protective service workers including supervisors (%)
Most Common Occupations - Law enforcement workers including supervisors (%)
Most Common Occupations - Food preparation and serving related occupations (%)
Most Common Occupations - Building and grounds cleaning and maintenance occupations (%)
Most Common Occupations - Personal care and service occupations (%)
Most Common Occupations - Sales and office occupations (%)
Most Common Occupations - Sales and related occupations (%)
Most Common Occupations - Office and administrative support occupations (%)
Most Common Occupations - Natural resources, construction, and maintenance occupations (%)
Most Common Occupations - Farming, fishing, and forestry occupations (%)
Most Common Occupations - Construction and extraction occupations (%)
Most Common Occupations - Installation, maintenance, and repair occupations (%)
Most Common Occupations - Production, transportation, and material moving occupations (%)
Most Common Occupations - Production occupations (%)
Most Common Occupations - Transportation occupations (%)
Most Common Occupations - Material moving occupations (%)
People in Group quarters - Institutionalized population (%)
People in Group quarters - Correctional institutions (%)
People in Group quarters - Federal prisons and detention centers (%)
People in Group quarters - Halfway houses (%)
People in Group quarters - Local jails and other confinement facilities (including police lockups) (%)
People in Group quarters - Military disciplinary barracks (%)
People in Group quarters - State prisons (%)
People in Group quarters - Other types of correctional institutions (%)
People in Group quarters - Nursing homes (%)
People in Group quarters - Hospitals/wards, hospices, and schools for the handicapped (%)
People in Group quarters - Hospitals/wards and hospices for chronically ill (%)
People in Group quarters - Hospices or homes for chronically ill (%)
People in Group quarters - Military hospitals or wards for chronically ill (%)
People in Group quarters - Other hospitals or wards for chronically ill (%)
People in Group quarters - Hospitals or wards for drug/alcohol abuse (%)
People in Group quarters - Mental (Psychiatric) hospitals or wards (%)
People in Group quarters - Schools, hospitals, or wards for the mentally retarded (%)
People in Group quarters - Schools, hospitals, or wards for the physically handicapped (%)
People in Group quarters - Institutions for the deaf (%)
People in Group quarters - Institutions for the blind (%)
People in Group quarters - Orthopedic wards and institutions for the physically handicapped (%)
People in Group quarters - Wards in general hospitals for patients who have no usual home elsewhere (%)
People in Group quarters - Wards in military hospitals for patients who have no usual home elsewhere (%)
People in Group quarters - Juvenile institutions (%)
People in Group quarters - Long-term care (%)
People in Group quarters - Homes for abused, dependent, and neglected children (%)
People in Group quarters - Residential treatment centers for emotionally disturbed children (%)
People in Group quarters - Training schools for juvenile delinquents (%)
People in Group quarters - Short-term care, detention or diagnostic centers for delinquent children (%)
People in Group quarters - Type of juvenile institution unknown (%)
People in Group quarters - Noninstitutionalized population (%)
People in Group quarters - College dormitories (includes college quarters off campus) (%)
People in Group quarters - Military quarters (%)
People in Group quarters - On base (%)
People in Group quarters - Barracks, unaccompanied personnel housing (UPH), (Enlisted/Officer), ;and similar group living quarters for military personnel (%)
People in Group quarters - Transient quarters for temporary residents (%)
People in Group quarters - Military ships (%)
People in Group quarters - Group homes (%)
People in Group quarters - Homes or halfway houses for drug/alcohol abuse (%)
People in Group quarters - Homes for the mentally ill (%)
People in Group quarters - Homes for the mentally retarded (%)
People in Group quarters - Homes for the physically handicapped (%)
People in Group quarters - Other group homes (%)
People in Group quarters - Religious group quarters (%)
People in Group quarters - Dormitories (%)
People in Group quarters - Agriculture workers' dormitories on farms (%)
People in Group quarters - Job Corps and vocational training facilities (%)
People in Group quarters - Other workers' dormitories (%)
People in Group quarters - Crews of maritime vessels (%)
People in Group quarters - Other nonhousehold living situations (%)
People in Group quarters - Other noninstitutional group quarters (%)
Residents speaking English at home (%)
Residents speaking English at home - Born in the United States (%)
Residents speaking English at home - Native, born elsewhere (%)
Residents speaking English at home - Foreign born (%)
Residents speaking Spanish at home (%)
Residents speaking Spanish at home - Born in the United States (%)
Residents speaking Spanish at home - Native, born elsewhere (%)
Residents speaking Spanish at home - Foreign born (%)
Residents speaking other language at home (%)
Residents speaking other language at home - Born in the United States (%)
Residents speaking other language at home - Native, born elsewhere (%)
Residents speaking other language at home - Foreign born (%)
Class of Workers - Employee of private company (%)
Class of Workers - Self-employed in own incorporated business (%)
Class of Workers - Private not-for-profit wage and salary workers (%)
Class of Workers - Local government workers (%)
Class of Workers - State government workers (%)
Class of Workers - Federal government workers (%)
Class of Workers - Self-employed workers in own not incorporated business and Unpaid family workers (%)
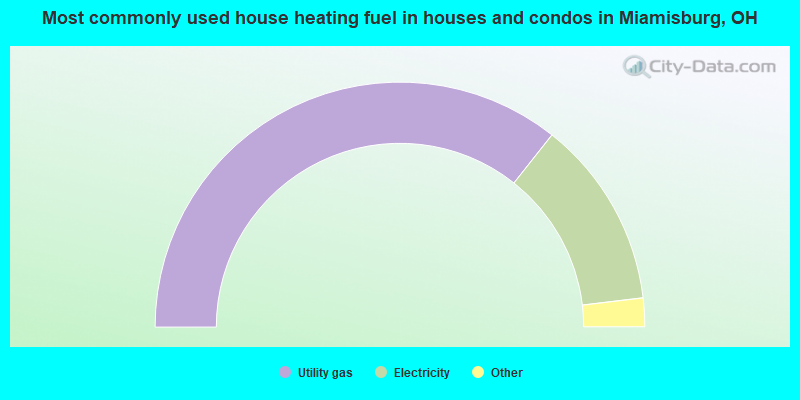
House heating fuel used in houses and condos - Utility gas (%)
House heating fuel used in houses and condos - Bottled, tank, or LP gas (%)
House heating fuel used in houses and condos - Electricity (%)
House heating fuel used in houses and condos - Fuel oil, kerosene, etc. (%)
House heating fuel used in houses and condos - Coal or coke (%)
House heating fuel used in houses and condos - Wood (%)
House heating fuel used in houses and condos - Solar energy (%)
House heating fuel used in houses and condos - Other fuel (%)
House heating fuel used in houses and condos - No fuel used (%)
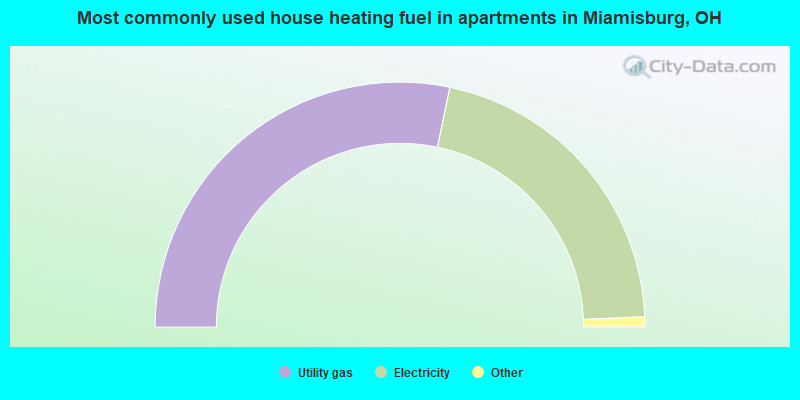
House heating fuel used in apartments - Utility gas (%)
House heating fuel used in apartments - Bottled, tank, or LP gas (%)
House heating fuel used in apartments - Electricity (%)
House heating fuel used in apartments - Fuel oil, kerosene, etc. (%)
House heating fuel used in apartments - Coal or coke (%)
House heating fuel used in apartments - Wood (%)
House heating fuel used in apartments - Solar energy (%)
House heating fuel used in apartments - Other fuel (%)
House heating fuel used in apartments - No fuel used (%)
Armed forces status - In Armed Forces (%)
Armed forces status - Civilian (%)
Armed forces status - Civilian - Veteran (%)
Armed forces status - Civilian - Nonveteran (%)
Fatal accidents locations in years 2005-2021
Fatal accidents locations in 2005
Fatal accidents locations in 2006
Fatal accidents locations in 2007
Fatal accidents locations in 2008
Fatal accidents locations in 2009
Fatal accidents locations in 2010
Fatal accidents locations in 2011
Fatal accidents locations in 2012
Fatal accidents locations in 2013
Fatal accidents locations in 2014
Fatal accidents locations in 2015
Fatal accidents locations in 2016
Fatal accidents locations in 2017
Fatal accidents locations in 2018
Fatal accidents locations in 2019
Fatal accidents locations in 2020
Fatal accidents locations in 2021
Alcohol use - People drinking some alcohol every month (%)
Alcohol use - People not drinking at all (%)
Alcohol use - Average days/month drinking alcohol
Alcohol use - Average drinks/week
Alcohol use - Average days/year people drink much
Audiometry - Average condition of hearing (%)
Audiometry - People that can hear a whisper from across a quiet room (%)
Audiometry - People that can hear normal voice from across a quiet room (%)
Audiometry - Ears ringing, roaring, buzzing (%)
Audiometry - Had a job exposure to loud noise (%)
Audiometry - Had off-work exposure to loud noise (%)
Blood Pressure & Cholesterol - Has high blood pressure (%)
Blood Pressure & Cholesterol - Checking blood pressure at home (%)
Blood Pressure & Cholesterol - Frequently checking blood cholesterol (%)
Blood Pressure & Cholesterol - Has high cholesterol level (%)
Consumer Behavior - Money monthly spent on food at supermarket/grocery store
Consumer Behavior - Money monthly spent on food at other stores
Consumer Behavior - Money monthly spent on eating out
Consumer Behavior - Money monthly spent on carryout/delivered foods
Consumer Behavior - Income spent on food at supermarket/grocery store (%)
Consumer Behavior - Income spent on food at other stores (%)
Consumer Behavior - Income spent on eating out (%)
Consumer Behavior - Income spent on carryout/delivered foods (%)
Current Health Status - General health condition (%)
Current Health Status - Blood donors (%)
Current Health Status - Has blood ever tested for HIV virus (%)
Current Health Status - Left-handed people (%)
Dermatology - People using sunscreen (%)
Diabetes - Diabetics (%)
Diabetes - Had a blood test for high blood sugar (%)
Diabetes - People taking insulin (%)
Diet Behavior & Nutrition - Diet health (%)
Diet Behavior & Nutrition - Milk product consumption (# of products/month)
Diet Behavior & Nutrition - Meals not home prepared (#/week)
Diet Behavior & Nutrition - Meals from fast food or pizza place (#/week)
Diet Behavior & Nutrition - Ready-to-eat foods (#/month)
Diet Behavior & Nutrition - Frozen meals/pizza (#/month)
Drug Use - People that ever used marijuana or hashish (%)
Drug Use - Ever used hard drugs (%)
Drug Use - Ever used any form of cocaine (%)
Drug Use - Ever used heroin (%)
Drug Use - Ever used methamphetamine (%)
Health Insurance - People covered by health insurance (%)
Kidney Conditions-Urology - Avg. # of times urinating at night
Medical Conditions - People with asthma (%)
Medical Conditions - People with anemia (%)
Medical Conditions - People with psoriasis (%)
Medical Conditions - People with overweight (%)
Medical Conditions - Elderly people having difficulties in thinking or remembering (%)
Medical Conditions - People who ever received blood transfusion (%)
Medical Conditions - People having trouble seeing even with glass/contacts (%)
Medical Conditions - People with arthritis (%)
Medical Conditions - People with gout (%)
Medical Conditions - People with congestive heart failure (%)
Medical Conditions - People with coronary heart disease (%)
Medical Conditions - People with angina pectoris (%)
Medical Conditions - People who ever had heart attack (%)
Medical Conditions - People who ever had stroke (%)
Medical Conditions - People with emphysema (%)
Medical Conditions - People with thyroid problem (%)
Medical Conditions - People with chronic bronchitis (%)
Medical Conditions - People with any liver condition (%)
Medical Conditions - People who ever had cancer or malignancy (%)
Mental Health - People who have little interest in doing things (%)
Mental Health - People feeling down, depressed, or hopeless (%)
Mental Health - People who have trouble sleeping or sleeping too much (%)
Mental Health - People feeling tired or having little energy (%)
Mental Health - People with poor appetite or overeating (%)
Mental Health - People feeling bad about themself (%)
Mental Health - People who have trouble concentrating on things (%)
Mental Health - People moving or speaking slowly or too fast (%)
Mental Health - People having thoughts they would be better off dead (%)
Oral Health - Average years since last visit a dentist
Oral Health - People embarrassed because of mouth (%)
Oral Health - People with gum disease (%)
Oral Health - General health of teeth and gums (%)
Oral Health - Average days a week using dental floss/device
Oral Health - Average days a week using mouthwash for dental problem
Oral Health - Average number of teeth
Pesticide Use - Households using pesticides to control insects (%)
Pesticide Use - Households using pesticides to kill weeds (%)
Physical Activity - People doing vigorous-intensity work activities (%)
Physical Activity - People doing moderate-intensity work activities (%)
Physical Activity - People walking or bicycling (%)
Physical Activity - People doing vigorous-intensity recreational activities (%)
Physical Activity - People doing moderate-intensity recreational activities (%)
Physical Activity - Average hours a day doing sedentary activities
Physical Activity - Average hours a day watching TV or videos
Physical Activity - Average hours a day using computer
Physical Functioning - People having limitations keeping them from working (%)
Physical Functioning - People limited in amount of work they can do (%)
Physical Functioning - People that need special equipment to walk (%)
Physical Functioning - People experiencing confusion/memory problems (%)
Physical Functioning - People requiring special healthcare equipment (%)
Prescription Medications - Average number of prescription medicines taking
Preventive Aspirin Use - Adults 40+ taking low-dose aspirin (%)
Reproductive Health - Vaginal deliveries (%)
Reproductive Health - Cesarean deliveries (%)
Reproductive Health - Deliveries resulted in a live birth (%)
Reproductive Health - Pregnancies resulted in a delivery (%)
Reproductive Health - Women breastfeeding newborns (%)
Reproductive Health - Women that had a hysterectomy (%)
Reproductive Health - Women that had both ovaries removed (%)
Reproductive Health - Women that have ever taken birth control pills (%)
Reproductive Health - Women taking birth control pills (%)
Reproductive Health - Women that have ever used Depo-Provera or injectables (%)
Reproductive Health - Women that have ever used female hormones (%)
Sexual Behavior - People 18+ that ever had sex (vaginal, anal, or oral) (%)
Sexual Behavior - Males 18+ that ever had vaginal sex with a woman (%)
Sexual Behavior - Males 18+ that ever performed oral sex on a woman (%)
Sexual Behavior - Males 18+ that ever had anal sex with a woman (%)
Sexual Behavior - Males 18+ that ever had any sex with a man (%)
Sexual Behavior - Females 18+ that ever had vaginal sex with a man (%)
Sexual Behavior - Females 18+ that ever performed oral sex on a man (%)
Sexual Behavior - Females 18+ that ever had anal sex with a man (%)
Sexual Behavior - Females 18+ that ever had any kind of sex with a woman (%)
Sexual Behavior - Average age people first had sex
Sexual Behavior - Average number of female sex partners in lifetime (males 18+)
Sexual Behavior - Average number of female vaginal sex partners in lifetime (males 18+)
Sexual Behavior - Average age people first performed oral sex on a woman (18+)
Sexual Behavior - Average number of woman performed oral sex on in lifetime (18+)
Sexual Behavior - Average number of male sex partners in lifetime (males 18+)
Sexual Behavior - Average number of male anal sex partners in lifetime (males 18+)
Sexual Behavior - Average age people first performed oral sex on a man (18+)
Sexual Behavior - Average number of male oral sex partners in lifetime (18+)
Sexual Behavior - People using protection when performing oral sex (%)
Sexual Behavior - Average number of times people have vaginal or anal sex a year
Sexual Behavior - People having sex without condom (%)
Sexual Behavior - Average number of male sex partners in lifetime (females 18+)
Sexual Behavior - Average number of male vaginal sex partners in lifetime (females 18+)
Sexual Behavior - Average number of female sex partners in lifetime (females 18+)
Sexual Behavior - Circumcised males 18+ (%)
Sleep Disorders - Average hours sleeping at night
Sleep Disorders - People that has trouble sleeping (%)
Smoking-Cigarette Use - People smoking cigarettes (%)
Taste & Smell - People 40+ having problems with smell (%)
Taste & Smell - People 40+ having problems with taste (%)
Taste & Smell - People 40+ that ever had wisdom teeth removed (%)
Taste & Smell - People 40+ that ever had tonsils teeth removed (%)
Taste & Smell - People 40+ that ever had a loss of consciousness because of a head injury (%)
Taste & Smell - People 40+ that ever had a broken nose or other serious injury to face or skull (%)
Taste & Smell - People 40+ that ever had two or more sinus infections (%)
Weight - Average height (inches)
Weight - Average weight (pounds)
Weight - Average BMI
Weight - People that are obese (%)
Weight - People that ever were obese (%)
Weight - People trying to lose weight (%)
Officers per 1,000 residents here:
1.89Ohio average:
2.31
Latest news from Miamisburg, OH collected exclusively by city-data.com from local newspapers, TV, and radio stations
Ancestries: German (19.7%), American (17.4%), English (12.1%), Irish (10.4%), European (6.0%), Scottish (4.5%).
Current Local Time:
Land area: 11.2 square miles.
Population density: 1,768 people per square mile (low).
534 residents are foreign born (1.5% Asia , 0.5% Europe , 0.3% Latin America ).
Median real estate property taxes paid for housing units with mortgages in 2022: $3,605 (1.6%)Median real estate property taxes paid for housing units with no mortgage in 2022: $2,856 (1.5%)
Nearest city with pop. 50,000+: Kettering, OH
Nearest city with pop. 200,000+: Cincinnati, OH
Nearest city with pop. 1,000,000+: Chicago, IL
Nearest cities:
Latitude: 39.64 N, Longitude: 84.28 W
Daytime population change due to commuting: +3,422 (+17.3%)Workers who live and work in this city: 2,763 (29.2%)
Area code commonly used in this area: 937
Single-family new house construction building permits:
2022: 56 buildings , average cost: $309,0002021: 51 buildings , average cost: $250,8002020: 14 buildings , average cost: $392,5002019: 1 building , cost: $340,0002018: 11 buildings , average cost: $273,1002017: 5 buildings , average cost: $239,0002016: 8 buildings , average cost: $258,0002015: 4 buildings , average cost: $197,8002014: 4 buildings , average cost: $276,0002013: 12 buildings , average cost: $262,1002012: 13 buildings , average cost: $151,5002011: 13 buildings , average cost: $121,9002010: 14 buildings , average cost: $166,2002009: 7 buildings , average cost: $196,9002008: 14 buildings , average cost: $202,7002007: 39 buildings , average cost: $183,0002006: 53 buildings , average cost: $183,0002005: 129 buildings , average cost: $143,5002004: 74 buildings , average cost: $156,3002003: 85 buildings , average cost: $141,5002002: 92 buildings , average cost: $134,0002001: 132 buildings , average cost: $117,3002000: 143 buildings , average cost: $122,3001999: 147 buildings , average cost: $124,3001998: 126 buildings , average cost: $125,7001997: 108 buildings , average cost: $117,500Unemployment in December 2023:
Population change in the 1990s: +1,319 (+7.3%).
Most common occupations in Miamisburg, OH (%)
Both Males Females
Other production occupations, including supervisors (4.5%)
Other office and administrative support workers, including supervisors (4.2%)
Other management occupations, except farmers and farm managers (4.0%)
Metal workers and plastic workers (3.7%)
Secretaries and administrative assistants (3.7%)
Other sales and related occupations, including supervisors (3.4%)
Building and grounds cleaning and maintenance occupations (3.4%)
Other production occupations, including supervisors (6.9%)
Metal workers and plastic workers (6.6%)
Electrical equipment mechanics and other installation, maintenance, and repair workers, including supervisors (4.5%)
Engineers (4.5%)
Other management occupations, except farmers and farm managers (4.0%)
Driver/sales workers and truck drivers (4.0%)
Other sales and related occupations, including supervisors (3.7%)
Secretaries and administrative assistants (7.8%)
Other office and administrative support workers, including supervisors (6.8%)
Information and record clerks, except customer service representatives (5.3%)
Registered nurses (5.0%)
Other management occupations, except farmers and farm managers (4.0%)
Cashiers (3.6%)
Building and grounds cleaning and maintenance occupations (3.5%)
Tornado activity:
Miamisburg-area historical tornado activity is slightly above Ohio state average. It is 62% greater than the overall U.S. average.
On 4/3/1974, a category F5 (max. wind speeds 261-318 mph) tornado 12.0 miles away from the Miamisburg city center killed 36 people and injured 1150 people and caused between $50,000,000 and $500,000,000 in damages.
On 4/3/1974, a category F4 (max. wind speeds 207-260 mph) tornado 14.4 miles away from the city center killed 2 people and injured 39 people and caused between $50,000 and $500,000 in damages.
Earthquake activity:
Miamisburg-area historical earthquake activity is significantly above Ohio state average. It is 31% greater than the overall U.S. average. On 7/27/1980 at 18:52:21, a magnitude 5.2 (5.1 MB, 4.7 MS, 5.0 UK, 5.2 UK, Class: Moderate, Intensity: VI - VII) earthquake occurred 100.8 miles away from the city center On 4/18/2008 at 09:36:59, a magnitude 5.4 (5.1 MB, 4.8 MS, 5.4 MW, 5.2 MW) earthquake occurred 210.6 miles away from the city center On 7/12/1986 at 08:19:37, a magnitude 4.5 (4.5 MB, Class: Light, Intensity: IV - V) earthquake occurred 62.4 miles away from the city center On 4/18/2008 at 09:36:59, a magnitude 5.2 (5.2 MW, Depth: 8.9 mi) earthquake occurred 210.6 miles away from the city center On 6/10/1987 at 23:48:54, a magnitude 5.1 (4.9 MB, 4.4 MS, 4.6 MS, 5.1 LG) earthquake occurred 201.5 miles away from the city center On 9/7/1988 at 02:28:09, a magnitude 4.6 (4.5 MB, 4.6 LG) earthquake occurred 105.6 miles away from the city center Magnitude types: regional Lg-wave magnitude (LG), body-wave magnitude (MB), surface-wave magnitude (MS), moment magnitude (MW) Natural disasters: The number of natural disasters in Montgomery County (9) is smaller than the US average (15).Major Disasters (Presidential) Declared: 4Emergencies Declared: 3Floods: 4, Storms: 3, Mudslides: 2, Winds: 2, Blizzard: 1, Heavy Rain: 1, Hurricane: 1, Landslide: 1, Snow: 1, Snowstorm: 1, Tornado: 1, Tropical Depression: 1, Winter Storm: 1, Other: 1 (Note: some incidents may be assigned to more than one category). Main business address for: HUFFY CORP [3949] ).
Hospitals and medical centers in Miamisburg: KETTERING MEDICAL CENTER - SYCAMORE (Voluntary non-profit - Church, provides emergency services, 4000 MIAMISBURG-CENTERVILLE ROAD) LIFE CARE HOSPITALS OF DAYTON (2150 LEITER ROAD) NURSES CARE, INC. (9009 SPRINGBORO PIKE)
HEARTLAND OF MIAMISBURG (450 OAK RIDGE BOULEVARD)
KINGSTON OF MIAMISBURG (1120 SOUTH DUNAWAY STREET)
MIAMI CHRISTEL MANOR, INC (1120 S DUNAWAY ST)
SYCAMORE GLEN HEALTH CENTER (2175 LEITER ROAD)
Heliports located in Miamisburg:
College/University in Miamisburg: Dayton Barber College Full-time enrollment: 68; Location: 2741 C Lyons Road; Private, for-profit; Website: www.daytonbarbercollege.com)
Colleges/universities with over 2000 students nearest to Miamisburg:
Fortis College-Centerville (about 7 miles; Centerville, OH ; Full-time enrollment: 4,527)
University of Dayton (about 9 miles; Dayton, OH ; FT enrollment: 10,392)
Sinclair Community College (about 10 miles; Dayton, OH ; FT enrollment: 13,779)
Wright State University-Main Campus (about 15 miles; Dayton, OH ; FT enrollment: 14,482)
Central State University (about 22 miles; Wilberforce, OH ; FT enrollment: 2,094)
Miami University-Hamilton (about 24 miles; Hamilton, OH ; FT enrollment: 2,906)
Cedarville University (about 26 miles; Cedarville, OH ; FT enrollment: 3,396)
Public high schools in Miamisburg:
Private high schools in Miamisburg: DAYTON CHRISTIAN SCHOOL Students: 974, Location: 9391 WASHINGTON CHURCH RD, Grades: PK-12)
CALVARY CHRISTIAN SCHOOL Students: 3, Location: 748 S GEBHART CHURCH RD, Grades: 10-12)
Public elementary/middle schools in Miamisburg: MEDLAR VIEW ELEMENTARY SCHOOL Students: 647, Location: 4400 MEDLAR RD, Grades: KG-5)MARK TWAIN ELEMENTARY SCHOOL Students: 358, Location: 822 N 9TH ST, Grades: KG-5)KINDER ELEMENTARY SCHOOL Students: 260, Location: 536 E CENTRAL AVE, Grades: KG-5)BEAR ELEMENTARY SCHOOL Students: 243, Location: 545 SCHOOL ST, Grades: KG-5)MOUND ELEMENTARY SCHOOL Location: 1108 RANGE AVE, Grades: KG-5)
MIAMISBURG Location: 8668 MIAMISBURG SPRINGBORO RD, Grades: 6-8)
JANE CHANCE ELEMENTARY Location: 10661 WOOD RD, Grades: KG-5)
See full list of schools located in Miamisburg
Notable locations in Miamisburg: (A) , Atomic Energy Commission Mound Laboratory (B) , Miamisburg Fire Department Station 53 (C) , Miami Township Fire Department Station 3 (D) , Miamisburg Fire Department Station 1 (E) , Miamisburg Branch Library (F) . Display/hide their locations on the map
Shopping Centers: (1) , Mini-Mall Shopping Center (2) , Clocktower Plaza Shopping Center (3) , Miamisburg Plaza Shopping Center (4) . Display/hide their locations on the map
Main business address in Miamisburg: (A) . Display/hide its location on the map
Churches in Miamisburg include: (A) , Saint Johns Church (B) , Church of the Nazarene (C) , First Lutheran Church (D) , First Methodist Church (E) , Free Pentecostal Church of God (F) , Trinity United Church of Christ (G) , Miamisburg First Church of God (H) , Miamisburg Free Will Baptist Church (I) . Display/hide their locations on the map
Cemeteries: (1) , Hill Grove Cemetery (2) , Highland Memorial Cemetery (3) , Miamisburg Cemetery (4) . Display/hide their locations on the map
Creeks: (A) , Bear Creek (B) . Display/hide their locations on the map
Parks in Miamisburg include: (1) , Groby Field (2) , Sycamore Trails Park (3) , Meadow Lane Park (4) , Orchard Hill Park (5) , Overlook Park (6) , Beachler Field (7) , Westover Park (8) , Miamisburg Community Park (9) . Display/hide their locations on the map
Tourist attraction:
Hotels:
Courts:
Birthplace of: Al Graham - Football player, Matt Muncy - Football player, Paul F. Schenck - Politician, Shannon McIntosh - Racing driver, George Kinderdine - Football player, Lee Fenner - Football player, Lou Partlow - Football player.
Montgomery County has a predicted average indoor radon screening level greater than 4 pCi/L (pico curies per liter) - Highest Potential Drinking water stations with addresses in Miamisburg and their reported violations in the past:
TEMPLE BAPTIST CHURCH CARLISLE (Population served: 100, Groundwater):
Past health violations:
MCL, Monthly (TCR) - Between JUL-2009 and SEP-2009, Contaminant: Coliform. Follow-up actions: St Violation/Reminder Notice (JUL-30-2009), St Public Notif requested (JUL-30-2009), St AO (w/penalty) issued (DEC-31-2009), St Compliance achieved (FEB-09-2012), St Public Notif received (MAR-06-2012)
Past monitoring violations:
Monitoring, Source Water (GWR) - In JUL-01-2011, Contaminant: E. COLI. Follow-up actions: St Public Notif requested (JUL-20-2011), St Violation/Reminder Notice (JUL-20-2011), St Compliance achieved (JUL-28-2011), St Public Notif received (MAR-06-2012)
Monitoring, Repeat Major (TCR) - Between APR-2011 and JUN-2011, Contaminant: Coliform (TCR). Follow-up actions: St Public Notif requested (JUL-20-2011), St Violation/Reminder Notice (JUL-20-2011), St Public Notif received (JUL-26-2011), St Compliance achieved (FEB-09-2012)
Monitoring, Repeat Major (TCR) - Between JAN-2005 and MAR-2005, Contaminant: Coliform (TCR). Follow-up actions: St Public Notif requested (APR-29-2005), St Violation/Reminder Notice (APR-29-2005), St Compliance achieved (APR-19-2007), St AO (w/penalty) issued (DEC-31-2009)
19 routine major monitoring violations
5 regular monitoring violations
Population served: 60, Groundwater):
Past health violations:
MCL, Monthly (TCR) - Between APR-2014 and JUN-2014, Contaminant: Coliform. Follow-up actions: St Violation/Reminder Notice (JUN-19-2014), St Public Notif requested (JUN-19-2014)
MCL, Monthly (TCR) - In OCT-2013, Contaminant: Coliform. Follow-up actions: St Public Notif requested (DEC-02-2013), St Violation/Reminder Notice (DEC-02-2013), St Public Notif received (DEC-27-2013), St Compliance achieved (MAR-16-2014)
MCL, Monthly (TCR) - In SEP-2013, Contaminant: Coliform. Follow-up actions: St Public Notif requested (OCT-03-2013), St Violation/Reminder Notice (OCT-03-2013), St Public Notif received (DEC-27-2013), St Compliance achieved (MAR-16-2014)
MCL, Monthly (TCR) - In AUG-2013, Contaminant: Coliform. Follow-up actions: St Public Notif requested (SEP-11-2013), St Violation/Reminder Notice (SEP-11-2013), St Public Notif received (DEC-27-2013), St Compliance achieved (MAR-16-2014)
MCL, Monthly (TCR) - In JUL-2013, Contaminant: Coliform. Follow-up actions: St Public Notif requested (JUL-30-2013), St Violation/Reminder Notice (JUL-30-2013), St Public Notif received (AUG-22-2013), St Compliance achieved (MAR-16-2014)
MCL, Monthly (TCR) - Between JUL-2007 and SEP-2007, Contaminant: Coliform. Follow-up actions: St Public Notif received (NOV-06-2007), St Public Notif requested (NOV-19-2007), St Violation/Reminder Notice (NOV-19-2007), St Compliance achieved (APR-24-2008)
Past monitoring violations:
Monitoring, Source Water (GWR) - In NOV-14-2013, Contaminant: E. COLI. Follow-up actions: St Public Notif requested (NOV-19-2013), St Violation/Reminder Notice (NOV-19-2013), St Public Notif received (DEC-02-2013), St Compliance achieved (DEC-03-2013)
Monitoring, Repeat Major (TCR) - In OCT-2013, Contaminant: Coliform (TCR). Follow-up actions: St Public Notif requested (NOV-19-2013), St Violation/Reminder Notice (NOV-19-2013), St Public Notif received (DEC-02-2013), St Compliance achieved (DEC-03-2013)
2 routine major monitoring violations
One regular monitoring violation
Average household size: This city:
2.5 peopleOhio:
2.4 people
Percentage of family households: This city:
70.1%Whole state:
65.0%
Percentage of households with unmarried partners: This city:
6.0%Whole state:
6.8%
Likely homosexual households (counted as self-reported same-sex unmarried-partner households)
Lesbian couples: 0.3% of all households Gay men: 0.2% of all households
311 people in nursing facilities/skilled-nursing facilities in 2010People in group quarters in Miamisburg in 2000:
474 people in nursing homes
137 people in other nonhousehold living situations
2 people in religious group quarters
Banks with branches in Miamisburg (2011 data):
Fifth Third Bank: Alex Road Banking Center Branch at 120 South Alex Road, branch established on 1880/01/01; Miamisburg Bank Mart at 155 North Heincke Road, branch established on 1880/01/01. Info updated 2009/10/05: Bank assets: $114,540.4 mil, Deposits: $89,689.1 mil, headquarters in Cincinnati, OH, positive income , Commercial Lending Specialization, 1378 total offices , Holding Company: Fifth Third Bancorp
The Farmers and Merchants Bank: The Farmers And Merchants Bank at 41 South First Street, branch established on 1923/11/23. Info updated 2012/01/04: Bank assets: $103.4 mil, Deposits: $93.5 mil, local headquarters , positive income , Commercial Lending Specialization, 3 total offices , Holding Company: F&M Bancorp
PNC Bank, National Association: Dayton Mall Branch at 8220 Springboro Pike, branch established on 1884/01/01. Info updated 2012/03/20: Bank assets: $263,309.6 mil, Deposits: $197,343.0 mil, headquarters in Wilmington, DE, positive income , Commercial Lending Specialization, 3085 total offices , Holding Company: Pnc Financial Services Group, Inc., The
JPMorgan Chase Bank, National Association: Miamisburg Branch at 210 South Heincke Road, branch established on 1981/08/27. Info updated 2011/11/10: Bank assets: $1,811,678.0 mil, Deposits: $1,190,738.0 mil, headquarters in Columbus, OH, positive income , International Specialization, 5577 total offices , Holding Company: Jpmorgan Chase & Co.
U.S. Bank National Association: Miamisburg Branch at 515 East Central Avenue, branch established on 1888/04/13. Info updated 2012/01/30: Bank assets: $330,470.8 mil, Deposits: $236,091.5 mil, headquarters in Cincinnati, OH, positive income , 3121 total offices , Holding Company: U.S. Bancorp
KeyBank National Association: Dayton Mall Branch at 2950 Miamisburg-Centerville Road, branch established on 1970/10/26. Info updated 2008/03/03: Bank assets: $86,198.8 mil, Deposits: $64,214.8 mil, headquarters in Cleveland, OH, positive income , Commercial Lending Specialization, 1067 total offices , Holding Company: Keycorp
The Citizens National Bank of Southwestern Ohio: Miamisburg Branch at 9700 Springboro Pike, branch established on 2007/05/01. Info updated 2006/11/03: Bank assets: $114.2 mil, Deposits: $104.8 mil, headquarters in Dayton, OH, positive income , Commercial Lending Specialization, 3 total offices , Holding Company: Tcnb Financial Corp.
For population 15 years and over in Miamisburg:
Never married: 27.0%Now married: 56.4%Separated: 1.0%Widowed: 6.8%Divorced: 8.8% For population 25 years and over in Miamisburg:
High school or higher: 93.7%Bachelor's degree or higher: 27.1%Graduate or professional degree: 9.0%Unemployed: 4.9%Mean travel time to work (commute): 18.0 minutes
Education Gini index (Inequality in education) Here:
10.5Ohio average:
11.0
Religion statistics for Miamisburg, OH (based on Montgomery County data)
Religion Adherents Congregations Evangelical Protestant 93,334 306 Catholic 78,909 34 Mainline Protestant 47,961 143 Black Protestant 21,263 56 Other 14,123 41 Orthodox 4,205 3 None 275,358 -
Source: Clifford Grammich, Kirk Hadaway, Richard Houseal, Dale E.Jones, Alexei Krindatch, Richie Stanley and Richard H.Taylor. 2012. 2010 U.S.Religion Census: Religious Congregations & Membership Study. Association of Statisticians of American Religious Bodies. Jones, Dale E., et al. 2002. Congregations and Membership in the United States 2000. Nashville, TN: Glenmary Research Center. Graphs represent county-level data
Food Environment Statistics: Number of grocery stores : 82This county :
1.52 / 10,000 pop.Ohio :
1.89 / 10,000 pop.
Number of supercenters and club stores : 8Montgomery County :
0.15 / 10,000 pop.Ohio :
0.13 / 10,000 pop.
Number of convenience stores (no gas) : 75Montgomery County :
1.39 / 10,000 pop.Ohio :
1.25 / 10,000 pop.
Number of convenience stores (with gas) : 124Montgomery County :
2.31 / 10,000 pop.Ohio :
2.93 / 10,000 pop.
Number of full-service restaurants : 310This county :
5.76 / 10,000 pop.Ohio :
6.25 / 10,000 pop.
Adult diabetes rate : Montgomery County :
11.0%Ohio :
10.3%
Low-income preschool obesity rate : Health and Nutrition:
Average overall health of teeth and gums : This city:
49.5%State:
47.8%
People feeling badly about themselves : Miamisburg:
21.5%State:
20.6%
People not drinking alcohol at all : Average hours sleeping at night : Overweight people : Miamisburg:
34.2%Ohio:
34.3%
General health condition : This city:
57.6%Ohio:
57.0%
Average condition of hearing : More about Health and Nutrition of Miamisburg, OH Residents
Local government employment and payroll (March 2022)
Function
Full-time employees
Monthly full-time payroll
Average yearly full-time wage
Part-time employees
Monthly part-time payroll
Firefighters
22 $158,331 $86,362 23 $20,104 Police Protection - Officers
18 $114,357 $76,238 11 $19,829 Streets and Highways
11 $59,458 $64,863 0 $0 Police - Other
6 $28,379 $56,758 5 $7,636 Financial Administration
5 $19,001 $45,602 4 $8,522 Other Government Administration
4 $12,972 $38,916 16 $16,382
Totals for Government
66 $392,498 $71,363 59 $72,473
Miamisburg government finances - Expenditure in 2021 (per resident):
Construction - Sewerage: $7,869,000 ($397.83)
Regular Highways: $2,759,000 ($139.48)Water Utilities: $2,545,000 ($128.67)General Public Buildings: $127,000 ($6.42)Parks and Recreation: $123,000 ($6.22)Housing and Community Development: $42,000 ($2.12)Current Operations - General - Other: $8,352,000 ($422.24)
Police Protection: $3,999,000 ($202.17)Parks and Recreation: $3,614,000 ($182.71)Sewerage: $2,670,000 ($134.98)Water Utilities: $2,140,000 ($108.19)Judicial and Legal Services: $1,235,000 ($62.44)Solid Waste Management: $1,138,000 ($57.53)Regular Highways: $1,083,000 ($54.75)Central Staff Services: $1,075,000 ($54.35)Housing and Community Development: $982,000 ($49.65)Financial Administration: $634,000 ($32.05)General Public Buildings: $301,000 ($15.22)Protective Inspection and Regulation - Other: $253,000 ($12.79)Corrections - Other: $142,000 ($7.18)General - Interest on Debt: $2,760,000 ($139.53)
Intergovernmental to Local - Other - Local Fire Protection: $3,800,000 ($192.11)
Other - Police Protection: $295,000 ($14.91)Other - Public Welfare - Other: $72,000 ($3.64)Other Capital Outlay - Police Protection: $174,000 ($8.80)
Water Utilities: $168,000 ($8.49)General Public Building: $117,000 ($5.92)Sewerage: $98,000 ($4.95)Housing and Community Development: $28,000 ($1.42)Parks and Recreation: $26,000 ($1.31)Judicial and Legal Services: $5,000 ($0.25)Financial Administration: $1,000 ($0.05)Total Salaries and Wages: $10,555,000 ($533.62)
Miamisburg government finances - Revenue in 2021 (per resident):
Charges - Parks and Recreation: $2,044,000 ($103.34)
Solid Waste Management: $986,000 ($49.85)Miscellaneous Commercial Activities: $49,000 ($2.48)Other: $6,000 ($0.30)Federal Intergovernmental - Public Welfare: $60,000 ($3.03)
Housing and Community Development: $30,000 ($1.52)Local Intergovernmental - General Local Government Support: $688,000 ($34.78)
Other: $379,000 ($19.16)Public Welfare: $35,000 ($1.77)Miscellaneous - General Revenue - Other: $1,787,000 ($90.34)
Fines and Forfeits: $1,723,000 ($87.11)Interest Earnings: $760,000 ($38.42)Special Assessments: $268,000 ($13.55)Sale of Property: $44,000 ($2.22)Donations From Private Sources: $27,000 ($1.37)Revenue - Water Utilities: $8,852,000 ($447.52)
State Intergovernmental - Highways: $1,594,000 ($80.59)
Other: $421,000 ($21.28)General Local Government Support: $393,000 ($19.87)Public Welfare: $49,000 ($2.48)Tax - Individual Income: $17,094,000 ($864.21)
Property: $2,607,000 ($131.80)Corporation Net Income: $1,843,000 ($93.17)Other: $200,000 ($10.11)Occupation and Business License - Other: $128,000 ($6.47)Motor Vehicle License: $52,000 ($2.63)Public Utility License: $32,000 ($1.62)Alcoholic Beverage License: $23,000 ($1.16)Other License: $7,000 ($0.35)
Miamisburg government finances - Debt in 2021 (per resident):
Long Term Debt - Beginning Outstanding - Unspecified Public Purpose: $77,209,000 ($3903.39)
Outstanding Unspecified Public Purpose: $73,941,000 ($3738.17)Retired Unspecified Public Purpose: $3,268,000 ($165.22)
Miamisburg government finances - Cash and Securities in 2021 (per resident):
Other Funds - Cash and Securities: $48,968,000 ($2475.63)
5.90% of this county's 2021 resident taxpayers lived in other counties in 2020 ($51,044 average adjusted gross income )
Here:
5.90%Ohio average:
5.68%
0.06% of residents moved from foreign countries ($588 average AGI )Montgomery County:
0.06%Ohio average:
0.01%
Top counties from which taxpayers relocated into this county between 2020 and 2021:
6.00% of this county's 2020 resident taxpayers moved to other counties in 2021 ($58,304 average adjusted gross income )
Here:
6.00%Ohio average:
5.79%
0.04% of residents moved to foreign countries ($390 average AGI )Montgomery County:
0.04%Ohio average:
0.01%
Top counties to which taxpayers relocated from this county between 2020 and 2021:
Businesses in Miamisburg, OH
Name Count Name Count
Ace Hardware 1 Kroger 1 Advance Auto Parts 1 Marriott 1 Arby's 1 MasterBrand Cabinets 8 AutoZone 1 McDonald's 2 Blockbuster 1 OfficeMax 1 Burger King 2 Payless 1 CVS 1 Penske 1 Casual Male XL 1 Quality 1 Chevrolet 1 RadioShack 1 Chuck E. Cheese's 1 Red Lobster 1 Comfort Suites 1 Red Roof Inn 1 Cricket Wireless 1 Sprint Nextel 1 Curves 1 Starbucks 1 Dairy Queen 1 Steak 'n Shake 1 Decora Cabinetry 4 Studio 6 1 Discount Tire 1 Super 8 1 Domino's Pizza 1 T-Mobile 2 FedEx 11 T.J.Maxx 1 Ford 1 Taco Bell 2 Goodwill 1 The Room Place 1 H&R Block 2 Tim Hortons 1 Hardee's 1 Toyota 1 Hawthorn 1 Toys"R"Us 1 Hilton 2 UPS 8 Hobby Lobby 1 Waffle House 1 Holiday Inn 1 Walgreens 1 KFC 1 Wendy's 1 Knights Inn 1
Strongest AM radio stations in Miamisburg:
WLW (700 AM; 50 kW; CINCINNATI, OH; Owner: JACOR BROADCASTING CORPORATION)
WONE (980 AM; 5 kW; DAYTON, OH; Owner: CITICASTERS LICENSES, L.P.)
WING (1410 AM; 5 kW; DAYTON, OH)
WHIO (1290 AM; 5 kW; DAYTON, OH; Owner: CXR HOLDINGS, INC.)
WSAI (1530 AM; 50 kW; CINCINNATI, OH; Owner: JACOR BROADCASTING CORPORATION)
WDAO (1210 AM; daytime; 1 kW; DAYTON, OH; Owner: JOHNSON COMMUNICATIONS, INC.)
WTVN (610 AM; 50 kW; COLUMBUS, OH; Owner: CITICASTERS LICENSES, L.P.)
WPFB (910 AM; 1 kW; MIDDLETOWN, OH)
WGNZ (1110 AM; daytime; 2 kW; FAIRBORN, OH; Owner: L&D BROADCASTORS INC.)
WCNW (1560 AM; daytime; 5 kW; FAIRFIELD, OH)
WRFD (880 AM; daytime; 23 kW; COLUMBUS-WORTHINGTON, OH; Owner: SALEM MEDIA OF OHIO, INC.)
WHAS (840 AM; 50 kW; LOUISVILLE, KY; Owner: CLEAR CHANNEL BROADCASTING LICENSES, INC.)
WKRC (550 AM; 5 kW; CINCINNATI, OH; Owner: JACOR BROADCASTING CORPORATION)
Strongest FM radio stations in Miamisburg:
WFCJ (93.7 FM; MIAMISBURG, OH; Owner: MIAMI VALLEY CHRISTIAN BROADCASTING ASSOCIATION)
WHKO (99.1 FM; DAYTON, OH; Owner: CXR HOLDINGS, INC.)
WRNB (92.1 FM; WEST CARROLLTON, OH; Owner: RADIO ONE OF DAYTON LICENSES, LLC)
WLQT (99.9 FM; KETTERING, OH; Owner: CITICASTERS LICENSES, L.P.)
WMMX (107.7 FM; DAYTON, OH; Owner: CITICASTERS LICENSES, L.P.)
WTUE (104.7 FM; DAYTON, OH; Owner: CITICASTERS LICENSES, L.P.)
WDPR (88.1 FM; WEST CARROLLTON, OH; Owner: DAYTON PUBLIC RADIO, INC.)
WPFB-FM (105.9 FM; MIDDLETOWN, OH; Owner: RADIO STATIONS WPAY/WPFB, INC.)
WXEG (103.9 FM; BEAVERCREEK, OH; Owner: CITICASTERS LICENSES, L.P.)
WYGY (96.5 FM; LEBANON, OH; Owner: WVAE LICO, INC.)
WCWT-FM (101.5 FM; CENTERVILLE, OH; Owner: CENTERVILLE CITY BOARD OF EDUCATION)
WGTZ (92.9 FM; EATON, OH; Owner: BLUE CHIP BROADCASTING LICENSES, LTD)
WMOJ (94.9 FM; FAIRFIELD, OH; Owner: WVAE LICO, INC.)
WDPS (89.5 FM; DAYTON, OH; Owner: DAYTON CITY SCHOOLS)
WGRR (103.5 FM; HAMILTON, OH; Owner: INFINITY RADIO OPERATIONS INC.)
WAQZ (97.3 FM; FORT THOMAS, KY; Owner: INFINITY RADIO OPERATIONS INC.)
WDKF (94.5 FM; ENGLEWOOD, OH; Owner: CITICASTERS LICENSES, L.P.)
WQRP (89.5 FM; DAYTON, OH; Owner: WQRP FAMILY RADIO, INC.)
WRRM (98.5 FM; CINCINNATI, OH; Owner: WRRM LICO, INC)
WRVT (88.7 FM; RUTLAND, VT; Owner: VERMONT PUBLIC RADIO)
TV broadcast stations around Miamisburg:
WDTN (Channel 2; DAYTON, OH; Owner: WDTN BROADCASTING, LLC)
WHIO-TV (Channel 7; DAYTON, OH; Owner: WHIO-TV HOLDINGS, INC.)
WPTD (Channel 16; DAYTON, OH; Owner: GREATER DAYTON PUBLIC TV, INC.)
WKEF (Channel 22; DAYTON, OH; Owner: WKEF LICENSEE L.P.)
WRGT-TV (Channel 45; DAYTON, OH; Owner: WRGT LICENSEE, LLC)
W61DE (Channel 61; CINCINNATI, OH; Owner: TRINITY BROADCASTING NETWORK)
WRCX-LP (Channel 51; DAYTON, OH; Owner: ROSS COMMUNICATIONS, LTD.)
WWRD-LP (Channel 55; CENTERVILLE, OH; Owner: LIFE BROADCASTING NETWORK)
WKOI (Channel 43; RICHMOND, IN; Owner: TRINITY BROADCASTING OF INDIANA, INC.)
WPTO (Channel 14; OXFORD, OH; Owner: GREATER DAYTON PUBLIC TELEVISION, INC.)
WBDT (Channel 26; SPRINGFIELD, OH; Owner: ACME TV LICENSES OF OHIO, LLC)
WLWT (Channel 5; CINCINNATI, OH; Owner: OHIO/OKLAHOMA HEARST-ARGYLE TV, INC)
WCPO-TV (Channel 9; CINCINNATI, OH; Owner: SCRIPPS HOWARD BROADCASTING COMPANY)
WXIX-TV (Channel 19; NEWPORT, KY; Owner: RAYCOM NATIONAL, INC.)
WKRC-TV (Channel 12; CINCINNATI, OH; Owner: CITICASTERS CO.)
WSTR-TV (Channel 64; CINCINNATI, OH; Owner: WSTR LICENSEE, INC.)
WCET (Channel 48; CINCINNATI, OH; Owner: THE GREATER CINCINNATI TV EDUC'L. FOUNDATION)
WBQC-CA (Channel 25; CINCINNATI, OH; Owner: ELLIOTT B. BLOCK)
WOTH-LP (Channel 35; CINCINNATI, OH; Owner: ELLIOTT B. BLOCK)
W66AQ (Channel 66; DAYTON, OH; Owner: WSTR LICENSEE, INC.)
National Bridge Inventory (NBI) Statistics 57 Number of bridges764ft / 233m Total length $178,499,000 Total costs1,410,944 Total average daily traffic98,530 Total average daily truck traffic
New bridges - historical statistics
1 1920-1929 1 1930-1939 1 1940-1949 1 1950-1959 10 1960-1969 3 1970-1979 28 1980-1989 5 1990-1999 3 2000-2009 4 2010-2019
See full National Bridge Inventory statistics for Miamisburg, OH
Home Mortgage Disclosure Act Aggregated Statistics For Year 2009(Based on 2 full and 6 partial tracts) A) FHA, FSA/RHS & VA B) Conventional C) Refinancings D) Home Improvement Loans E) Loans on Dwellings For 5+ Families F) Non-occupant Loans on G) Loans On Manufactured Number Average Value Number Average Value Number Average Value Number Average Value Number Average Value Number Average Value Number Average Value
LOANS ORIGINATED 97 $125,624 78 $90,613 465 $130,069 21 $28,719 1 $82,390 20 $103,340 12 $34,664 APPLICATIONS APPROVED, NOT ACCEPTED 7 $107,084 8 $91,799 38 $141,851 4 $39,748 0 $0 3 $107,147 3 $32,977 APPLICATIONS DENIED 11 $127,075 11 $90,453 135 $141,295 18 $27,589 1 $67,040 8 $72,091 1 $67,530 APPLICATIONS WITHDRAWN 7 $124,080 5 $155,996 75 $153,543 5 $50,004 0 $0 1 $144,030 1 $38,770 FILES CLOSED FOR INCOMPLETENESS 3 $74,193 2 $31,905 26 $129,621 1 $28,270 0 $0 3 $101,153 1 $28,270
Aggregated Statistics For Year 2008(Based on 2 full and 6 partial tracts) A) FHA, FSA/RHS & VA B) Conventional C) Refinancings D) Home Improvement Loans E) Loans on Dwellings For 5+ Families F) Non-occupant Loans on G) Loans On Manufactured Number Average Value Number Average Value Number Average Value Number Average Value Number Average Value Number Average Value Number Average Value
LOANS ORIGINATED 91 $129,519 117 $116,302 240 $130,190 24 $27,653 2 $908,665 29 $92,304 9 $42,449 APPLICATIONS APPROVED, NOT ACCEPTED 7 $121,243 13 $79,278 32 $144,201 5 $41,704 0 $0 4 $97,525 5 $42,128 APPLICATIONS DENIED 15 $113,192 25 $85,604 145 $124,783 34 $38,231 1 $393,000 8 $118,350 10 $44,573 APPLICATIONS WITHDRAWN 8 $136,560 8 $95,482 76 $132,763 5 $58,906 1 $282,690 6 $110,460 1 $23,420 FILES CLOSED FOR INCOMPLETENESS 1 $60,000 4 $90,970 15 $149,103 1 $74,960 0 $0 1 $23,030 1 $40,380
Aggregated Statistics For Year 2007(Based on 2 full and 6 partial tracts) A) FHA, FSA/RHS & VA B) Conventional C) Refinancings D) Home Improvement Loans E) Loans on Dwellings For 5+ Families F) Non-occupant Loans on G) Loans On Manufactured Number Average Value Number Average Value Number Average Value Number Average Value Number Average Value Number Average Value Number Average Value
LOANS ORIGINATED 56 $122,547 283 $116,943 267 $114,517 51 $40,022 4 $2,158,470 42 $109,974 9 $40,823 APPLICATIONS APPROVED, NOT ACCEPTED 0 $0 28 $103,501 60 $125,301 9 $44,221 0 $0 3 $91,980 5 $53,772 APPLICATIONS DENIED 13 $148,535 43 $94,771 216 $126,131 57 $41,602 0 $0 15 $107,773 15 $37,107 APPLICATIONS WITHDRAWN 4 $139,632 27 $112,444 83 $132,629 11 $60,349 0 $0 11 $173,206 1 $35,180 FILES CLOSED FOR INCOMPLETENESS 1 $59,000 8 $105,875 34 $145,710 3 $95,250 0 $0 2 $62,815 0 $0
Aggregated Statistics For Year 2006(Based on 2 full and 6 partial tracts) A) FHA, FSA/RHS & VA B) Conventional C) Refinancings D) Home Improvement Loans E) Loans on Dwellings For 5+ Families F) Non-occupant Loans on G) Loans On Manufactured Number Average Value Number Average Value Number Average Value Number Average Value Number Average Value Number Average Value Number Average Value
LOANS ORIGINATED 66 $128,034 356 $110,090 336 $102,583 55 $30,559 1 $1,970,230 52 $101,654 5 $50,166 APPLICATIONS APPROVED, NOT ACCEPTED 5 $115,522 43 $86,069 95 $117,803 11 $33,518 0 $0 6 $100,737 11 $48,002 APPLICATIONS DENIED 7 $102,581 66 $82,251 228 $112,865 45 $29,119 0 $0 19 $99,763 15 $46,559 APPLICATIONS WITHDRAWN 6 $104,825 30 $101,306 109 $114,823 14 $85,644 0 $0 8 $111,732 1 $85,000 FILES CLOSED FOR INCOMPLETENESS 7 $141,601 10 $130,066 30 $114,854 2 $52,985 0 $0 5 $76,810 0 $0
Aggregated Statistics For Year 2005(Based on 2 full and 6 partial tracts) A) FHA, FSA/RHS & VA B) Conventional C) Refinancings D) Home Improvement Loans E) Loans on Dwellings For 5+ Families F) Non-occupant Loans on G) Loans On Manufactured Number Average Value Number Average Value Number Average Value Number Average Value Number Average Value Number Average Value Number Average Value
LOANS ORIGINATED 67 $124,999 426 $120,495 426 $113,804 52 $35,947 3 $448,870 66 $92,971 4 $48,048 APPLICATIONS APPROVED, NOT ACCEPTED 6 $107,522 46 $101,709 95 $116,379 11 $63,063 0 $0 12 $104,731 9 $53,966 APPLICATIONS DENIED 8 $130,586 61 $100,577 251 $118,811 49 $34,057 3 $160,463 16 $120,014 7 $64,686 APPLICATIONS WITHDRAWN 2 $126,845 36 $104,940 197 $136,354 14 $143,311 2 $506,830 10 $102,690 2 $153,865 FILES CLOSED FOR INCOMPLETENESS 1 $109,290 7 $71,944 39 $125,287 5 $30,118 0 $0 1 $64,240 0 $0
Aggregated Statistics For Year 2004(Based on 2 full and 6 partial tracts) A) FHA, FSA/RHS & VA B) Conventional C) Refinancings D) Home Improvement Loans E) Loans on Dwellings For 5+ Families F) Non-occupant Loans on G) Loans On Manufactured Number Average Value Number Average Value Number Average Value Number Average Value Number Average Value Number Average Value Number Average Value
LOANS ORIGINATED 103 $120,115 420 $115,224 556 $111,901 50 $35,066 2 $3,977,205 66 $93,643 8 $57,268 APPLICATIONS APPROVED, NOT ACCEPTED 6 $84,833 42 $94,317 130 $125,858 12 $33,121 0 $0 8 $115,286 5 $66,468 APPLICATIONS DENIED 15 $112,713 52 $103,595 285 $110,780 53 $30,774 0 $0 16 $97,368 12 $40,002 APPLICATIONS WITHDRAWN 2 $124,585 33 $103,366 209 $116,195 7 $40,276 0 $0 14 $104,492 2 $58,245 FILES CLOSED FOR INCOMPLETENESS 2 $100,870 10 $106,128 34 $131,386 6 $27,865 0 $0 1 $92,220 0 $0
Aggregated Statistics For Year 2003(Based on 2 full and 6 partial tracts) A) FHA, FSA/RHS & VA B) Conventional C) Refinancings D) Home Improvement Loans E) Loans on Dwellings For 5+ Families F) Non-occupant Loans on Number Average Value Number Average Value Number Average Value Number Average Value Number Average Value Number Average Value
LOANS ORIGINATED 113 $124,834 312 $118,850 1,333 $112,283 64 $21,045 2 $367,925 68 $79,852 APPLICATIONS APPROVED, NOT ACCEPTED 8 $114,449 34 $92,383 161 $104,425 11 $14,608 0 $0 9 $88,373 APPLICATIONS DENIED 11 $102,242 50 $107,922 293 $105,118 40 $20,300 0 $0 18 $90,900 APPLICATIONS WITHDRAWN 4 $102,998 26 $131,866 211 $118,444 3 $25,207 0 $0 12 $94,103 FILES CLOSED FOR INCOMPLETENESS 3 $108,163 3 $110,900 66 $124,203 6 $47,250 0 $0 2 $56,745
Aggregated Statistics For Year 2002(Based on 2 full and 6 partial tracts) A) FHA, FSA/RHS & VA B) Conventional C) Refinancings D) Home Improvement Loans E) Loans on Dwellings For 5+ Families F) Non-occupant Loans on Number Average Value Number Average Value Number Average Value Number Average Value Number Average Value Number Average Value
LOANS ORIGINATED 115 $109,689 340 $111,676 901 $112,673 58 $21,520 4 $410,070 50 $84,647 APPLICATIONS APPROVED, NOT ACCEPTED 5 $113,248 40 $80,326 160 $111,391 19 $12,694 0 $0 9 $72,642 APPLICATIONS DENIED 10 $127,453 55 $72,435 269 $106,919 49 $11,606 0 $0 8 $70,230 APPLICATIONS WITHDRAWN 5 $117,510 24 $132,665 203 $107,508 3 $55,947 0 $0 4 $137,595 FILES CLOSED FOR INCOMPLETENESS 1 $81,370 13 $96,487 50 $120,968 2 $24,500 0 $0 4 $76,255
Aggregated Statistics For Year 2001(Based on 2 full and 6 partial tracts) A) FHA, FSA/RHS & VA B) Conventional C) Refinancings D) Home Improvement Loans E) Loans on Dwellings For 5+ Families F) Non-occupant Loans on Number Average Value Number Average Value Number Average Value Number Average Value Number Average Value Number Average Value
LOANS ORIGINATED 127 $109,787 312 $113,417 751 $100,914 78 $15,337 1 $439,190 56 $82,404 APPLICATIONS APPROVED, NOT ACCEPTED 4 $74,942 47 $67,541 127 $97,264 28 $15,000 1 $649,390 9 $77,946 APPLICATIONS DENIED 14 $107,631 104 $57,866 262 $90,200 66 $10,713 0 $0 16 $70,709 APPLICATIONS WITHDRAWN 6 $92,542 21 $121,180 184 $99,359 15 $16,299 0 $0 4 $49,465 FILES CLOSED FOR INCOMPLETENESS 2 $93,855 7 $89,609 36 $109,931 4 $15,368 0 $0 1 $84,810
Aggregated Statistics For Year 2000(Based on 2 full and 6 partial tracts) A) FHA, FSA/RHS & VA B) Conventional C) Refinancings D) Home Improvement Loans E) Loans on Dwellings For 5+ Families F) Non-occupant Loans on Number Average Value Number Average Value Number Average Value Number Average Value Number Average Value Number Average Value
LOANS ORIGINATED 119 $104,457 281 $106,814 211 $84,713 92 $13,391 0 $0 35 $63,773 APPLICATIONS APPROVED, NOT ACCEPTED 8 $88,062 29 $63,492 72 $91,360 28 $12,813 1 $56,540 4 $75,662 APPLICATIONS DENIED 9 $74,959 89 $49,302 184 $79,571 75 $15,575 0 $0 12 $68,011 APPLICATIONS WITHDRAWN 8 $95,031 26 $105,435 85 $70,854 8 $25,840 1 $181,730 4 $59,158 FILES CLOSED FOR INCOMPLETENESS 1 $111,540 2 $92,785 26 $79,264 1 $15,000 0 $0 1 $69,000
Aggregated Statistics For Year 1999(Based on 2 full and 6 partial tracts) A) FHA, FSA/RHS & VA B) Conventional C) Refinancings D) Home Improvement Loans E) Loans on Dwellings For 5+ Families F) Non-occupant Loans on Number Average Value Number Average Value Number Average Value Number Average Value Number Average Value Number Average Value
LOANS ORIGINATED 137 $97,530 309 $111,241 357 $87,745 116 $10,140 2 $320,800 31 $81,903 APPLICATIONS APPROVED, NOT ACCEPTED 10 $90,960 43 $76,811 111 $77,886 25 $8,691 0 $0 5 $108,432 APPLICATIONS DENIED 13 $80,964 74 $54,386 157 $77,043 63 $9,554 1 $112,000 12 $56,266 APPLICATIONS WITHDRAWN 4 $101,315 24 $113,068 122 $75,225 11 $37,097 0 $0 2 $63,560 FILES CLOSED FOR INCOMPLETENESS 0 $0 2 $151,790 32 $73,811 0 $0 0 $0 1 $28,680
Detailed HMDA statistics for the following Tracts:
0501.01
, 0503.02 , 0504.01 , 0504.02 , 0505.01 , 0505.02 , 0506.00
Private Mortgage Insurance Companies Aggregated Statistics For Year 2009(Based on 2 full and 6 partial tracts) A) Conventional B) Refinancings C) Non-occupant Loans on Number Average Value Number Average Value Number Average Value
LOANS ORIGINATED 12 $137,534 18 $157,093 1 $131,660 APPLICATIONS APPROVED, NOT ACCEPTED 4 $138,550 5 $112,782 0 $0 APPLICATIONS DENIED 2 $232,895 3 $206,450 0 $0 APPLICATIONS WITHDRAWN 0 $0 1 $199,000 0 $0 FILES CLOSED FOR INCOMPLETENESS 1 $58,910 0 $0 0 $0
Aggregated Statistics For Year 2008(Based on 2 full and 6 partial tracts) A) Conventional B) Refinancings C) Non-occupant Loans on Number Average Value Number Average Value Number Average Value
LOANS ORIGINATED 50 $142,262 16 $157,718 3 $105,573 APPLICATIONS APPROVED, NOT ACCEPTED 6 $146,822 11 $179,075 1 $203,530 APPLICATIONS DENIED 3 $118,520 0 $0 0 $0 APPLICATIONS WITHDRAWN 1 $180,020 1 $51,870 0 $0 FILES CLOSED FOR INCOMPLETENESS 0 $0 0 $0 0 $0
Aggregated Statistics For Year 2007(Based on 2 full and 6 partial tracts) A) Conventional B) Refinancings C) Non-occupant Loans on Number Average Value Number Average Value Number Average Value
LOANS ORIGINATED 87 $141,969 29 $140,964 11 $129,715 APPLICATIONS APPROVED, NOT ACCEPTED 18 $165,228 8 $188,099 2 $165,750 APPLICATIONS DENIED 1 $122,600 0 $0 0 $0 APPLICATIONS WITHDRAWN 2 $149,815 2 $166,530 0 $0 FILES CLOSED FOR INCOMPLETENESS 0 $0 0 $0 0 $0
Aggregated Statistics For Year 2006(Based on 2 full and 6 partial tracts) A) Conventional B) Refinancings C) Non-occupant Loans on Number Average Value Number Average Value Number Average Value
LOANS ORIGINATED 66 $154,723 16 $133,812 9 $148,393 APPLICATIONS APPROVED, NOT ACCEPTED 10 $164,955 11 $146,305 3 $88,770 APPLICATIONS DENIED 2 $94,730 0 $0 1 $36,000 APPLICATIONS WITHDRAWN 7 $141,829 2 $209,180 0 $0 FILES CLOSED FOR INCOMPLETENESS 0 $0 0 $0 0 $0
Aggregated Statistics For Year 2005(Based on 2 full and 6 partial tracts) A) Conventional B) Refinancings C) Non-occupant Loans on Number Average Value Number Average Value Number Average Value
LOANS ORIGINATED 96 $144,141 34 $139,723 9 $105,271 APPLICATIONS APPROVED, NOT ACCEPTED 11 $118,152 20 $137,560 3 $58,560 APPLICATIONS DENIED 0 $0 1 $141,360 0 $0 APPLICATIONS WITHDRAWN 6 $188,337 4 $117,312 0 $0 FILES CLOSED FOR INCOMPLETENESS 0 $0 1 $124,570 0 $0
Aggregated Statistics For Year 2004(Based on 2 full and 6 partial tracts) A) Conventional B) Refinancings C) Non-occupant Loans on Number Average Value Number Average Value Number Average Value
LOANS ORIGINATED 79 $150,307 57 $130,296 8 $93,632 APPLICATIONS APPROVED, NOT ACCEPTED 14 $136,934 22 $131,861 0 $0 APPLICATIONS DENIED 1 $99,350 1 $67,040 1 $99,350 APPLICATIONS WITHDRAWN 6 $112,458 8 $115,352 2 $69,945 FILES CLOSED FOR INCOMPLETENESS 1 $118,730 1 $126,120 0 $0
Aggregated Statistics For Year 2003(Based on 2 full and 6 partial tracts) A) Conventional B) Refinancings C) Non-occupant Loans on Number Average Value Number Average Value Number Average Value
LOANS ORIGINATED 78 $140,922 161 $132,013 10 $71,979 APPLICATIONS APPROVED, NOT ACCEPTED 20 $135,196 29 $116,222 2 $98,195 APPLICATIONS DENIED 0 $0 6 $110,770 1 $44,530 APPLICATIONS WITHDRAWN 4 $107,060 7 $139,141 2 $115,330 FILES CLOSED FOR INCOMPLETENESS 0 $0 1 $118,090 0 $0
Aggregated Statistics For Year 2002(Based on 2 full and 6 partial tracts) A) Conventional B) Refinancings C) Non-occupant Loans on Number Average Value Number Average Value Number Average Value
LOANS ORIGINATED 87 $133,376 119 $131,226 7 $88,063 APPLICATIONS APPROVED, NOT ACCEPTED 20 $133,476 26 $144,880 4 $71,725 APPLICATIONS DENIED 1 $33,100 3 $134,360 1 $33,100 APPLICATIONS WITHDRAWN 6 $172,632 8 $130,531 1 $161,010 FILES CLOSED FOR INCOMPLETENESS 0 $0 3 $127,470 0 $0
Aggregated Statistics For Year 2001(Based on 2 full and 6 partial tracts) A) Conventional B) Refinancings C) Non-occupant Loans on Number Average Value Number Average Value Number Average Value
LOANS ORIGINATED 107 $126,202 98 $133,859 8 $78,636 APPLICATIONS APPROVED, NOT ACCEPTED 12 $152,424 17 $126,771 0 $0 APPLICATIONS DENIED 2 $98,745 7 $128,941 4 $62,975 APPLICATIONS WITHDRAWN 2 $195,450 1 $93,860 0 $0 FILES CLOSED FOR INCOMPLETENESS 1 $124,390 0 $0 0 $0
Aggregated Statistics For Year 2000(Based on 2 full and 6 partial tracts) A) Conventional B) Refinancings C) Non-occupant Loans on Number Average Value Number Average Value Number Average Value
LOANS ORIGINATED 82 $128,958 15 $101,395 6 $73,372 APPLICATIONS APPROVED, NOT ACCEPTED 14 $164,997 8 $120,224 4 $69,462 APPLICATIONS DENIED 2 $74,525 0 $0 2 $68,000 APPLICATIONS WITHDRAWN 2 $99,345 0 $0 0 $0 FILES CLOSED FOR INCOMPLETENESS 0 $0 0 $0 0 $0
Aggregated Statistics For Year 1999(Based on 2 full and 6 partial tracts) A) Conventional B) Refinancings C) Non-occupant Loans on Number Average Value Number Average Value Number Average Value
LOANS ORIGINATED 111 $130,880 66 $111,930 4 $72,308 APPLICATIONS APPROVED, NOT ACCEPTED 6 $123,078 7 $134,196 0 $0 APPLICATIONS DENIED 4 $73,735 3 $129,000 2 $67,925 APPLICATIONS WITHDRAWN 3 $141,667 1 $108,760 0 $0 FILES CLOSED FOR INCOMPLETENESS 1 $130,920 0 $0 0 $0
Detailed PMIC statistics for the following Tracts:
0501.01
, 0503.02 , 0504.01 , 0504.02 , 0505.01 , 0505.02 , 0506.00 Fire-safe hotels and motels in Miamisburg, Ohio:
Hawthorn Suites - Dayton South, 155 Prestige Pl, Miamisburg, Ohio 45342 Phone: (937) 434-7881, Fax: (937) 434-9308
Courtyard Dayton Mall, 100 Prestige Pl, Miamisburg, Ohio 45342 Phone: (513) 433-3131, Fax: (937) 433-0285
Quality Inn & Suites, 250 Byers Rd, Miamisburg, Ohio 45342 Phone: (937) 865-0077, Fax: (937) 865-0077
Super 8, 155 Monarch Ln, Miamisburg, Ohio 45342 Phone: (937) 866-5500, Fax: (937) 866-8270
Knights Inn, 185 Byers Rd, Miamisburg, Ohio 45342 Phone: (937) 859-8797, Fax: (937) 859-5254
Wyndham Garden Dayton South, 31 Prestige Plz Dr, Miamisburg, Ohio 45342 Phone: (937) 434-8030, Fax: (937) 434-6452
Comfort Suites, 42 Prestige Plaza Dr, Miamisburg, Ohio 45342 Phone: (937) 436-4529, Fax: (937) 436-4965
Hilton Garden Inn Dayton South/Austin Landing, 12000 Innovation Dr, Miamisburg, Ohio 45342 Phone: (937) 247-5850, Fax: (937) 247-5859
2 other hotels and motels
All 10 fire-safe hotels and motels in Miamisburg, Ohio
Most common first names in Miamisburg, OH among deceased individuals Name Count Lived (average)
Mary 202 80.6 years William 160 74.6 years John 157 74.5 years Robert 154 74.0 years Charles 138 73.0 years James 132 71.6 years Helen 95 82.8 years Margaret 74 79.8 years Paul 71 73.8 years Dorothy 70 79.1 years
Most common last names in Miamisburg, OH among deceased individuals Last name Count Lived (average)
Smith 81 76.3 years Miller 54 71.1 years Johnson 47 75.3 years Moore 35 77.8 years Brown 35 75.4 years Jones 34 72.6 years Davis 31 72.7 years Hill 30 78.5 years Williams 29 79.1 years Cox 28 77.3 years
Miamisburg compared to Ohio state average:
Unemployed percentage below state average. Black race population percentage significantly below state average. Hispanic race population percentage significantly below state average. Foreign-born population percentage below state average. Length of stay since moving in significantly above state average. Miamisburg on our top lists :
#88 on the list of "Top 101 cities with the highest percentage of English-only speaking households, population 5,000+"
#20 on the list of "Top 101 counties with the largest increase in the number of infant deaths per 1000 residents 2000-2006 to 2007-2013 (pop. 50,000+)"
#25 on the list of "Top 101 counties with the highest ground withdrawal of fresh water for public supply"
#37 on the list of "Top 101 counties with the highest number of infant deaths per 1000 residents 2007-2013 (pop. 50,000+)"
#40 on the list of "Top 101 counties with the lowest percentage of residents that drank alcohol in the past 30 days"
#47 on the list of "Top 101 counties with the most Black Protestant adherents"
Top Patent Applicants
Masao Akei (22)
Harsha S. Bulathsinghalage (15)
Timothy John Hawryschuk (10)
Bobby G. James, Jr. (7)
Richard D. Puckett (7)
Jan Watson (5)
Scott Alan Schimmels (5)
Timothy J. Hawryschuk (5)
Steven T. Cook (5)
Jason Knapp (5)
Total of 216 patent applications in 2008-2024.


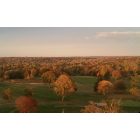
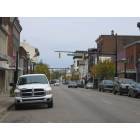


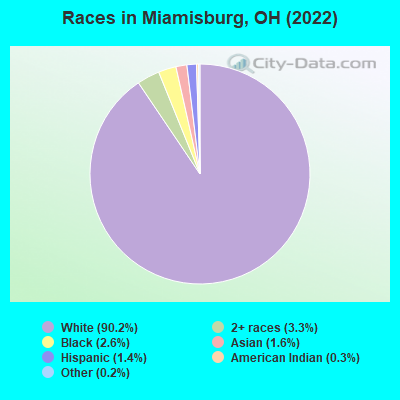
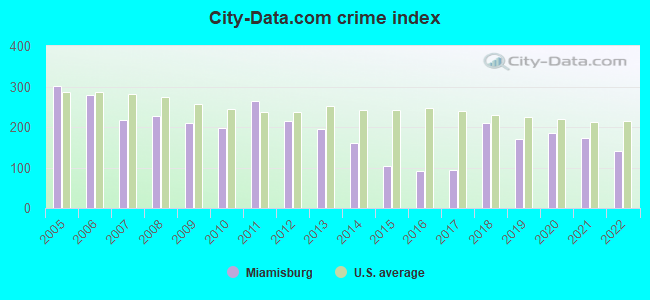
 Recent articles from our blog. Our writers, many of them Ph.D. graduates or candidates, create easy-to-read articles on a wide variety of topics.

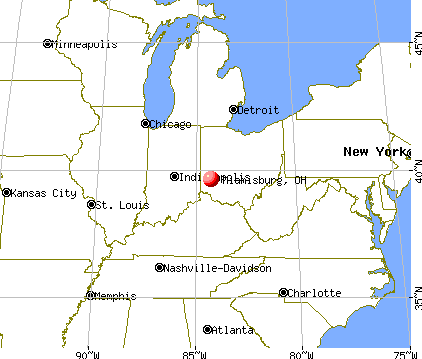
 (7.7 miles
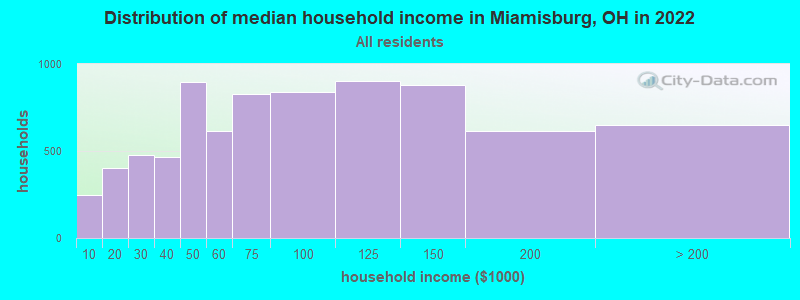
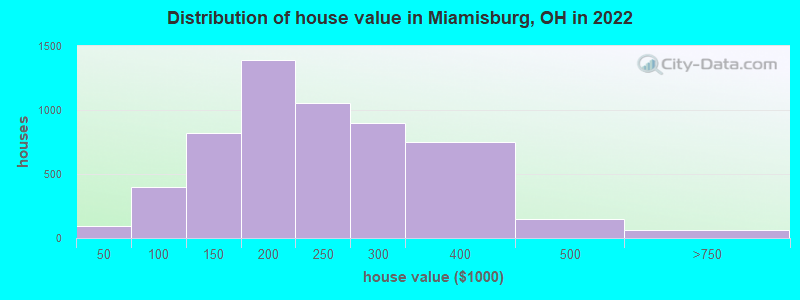
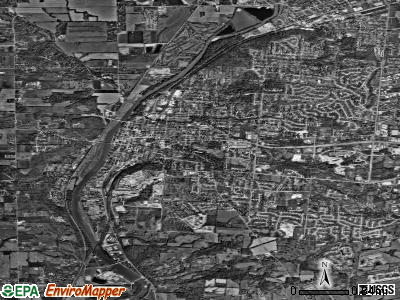
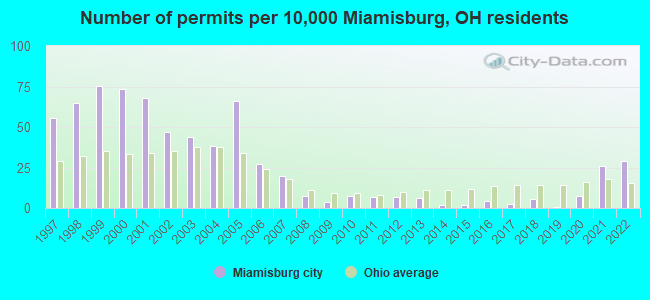
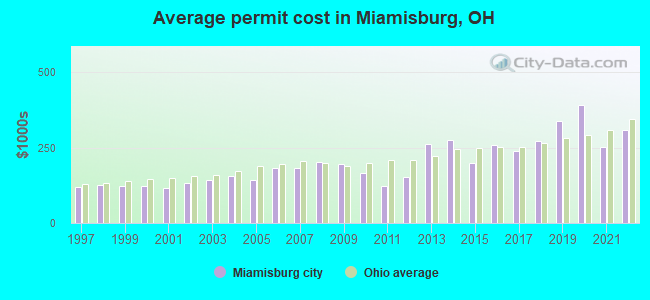
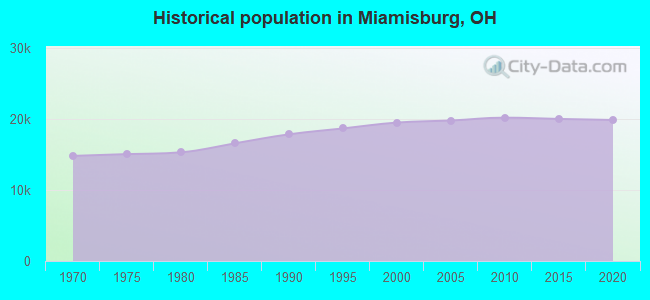
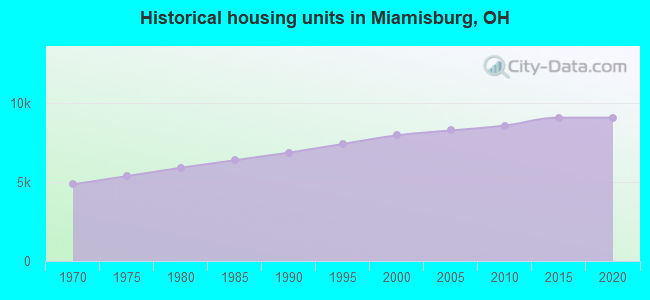
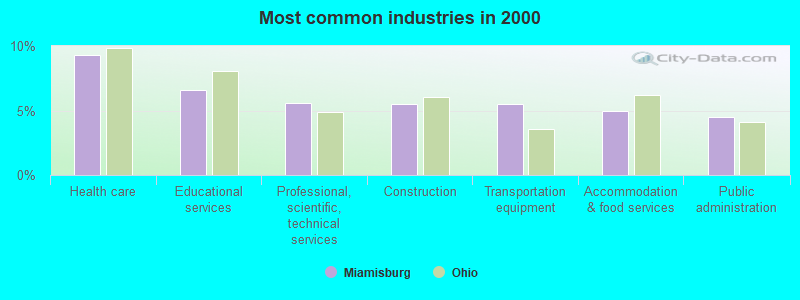
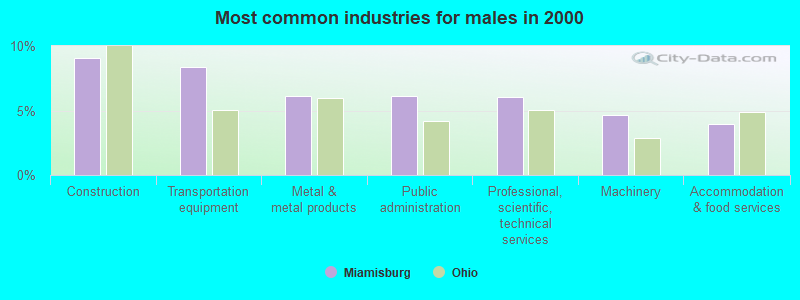
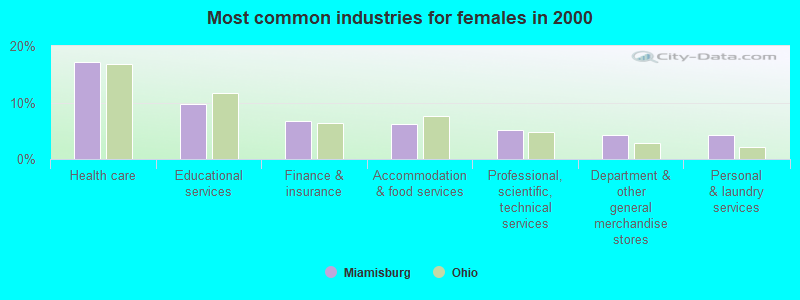
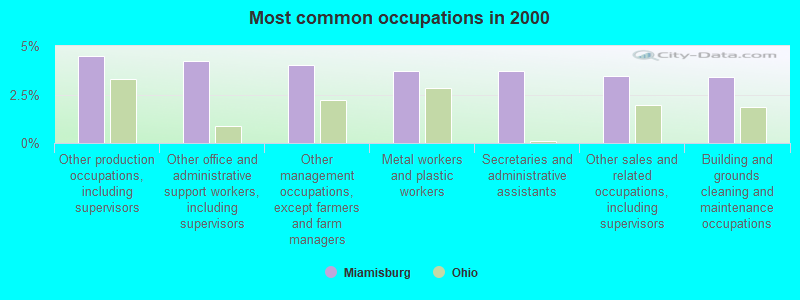
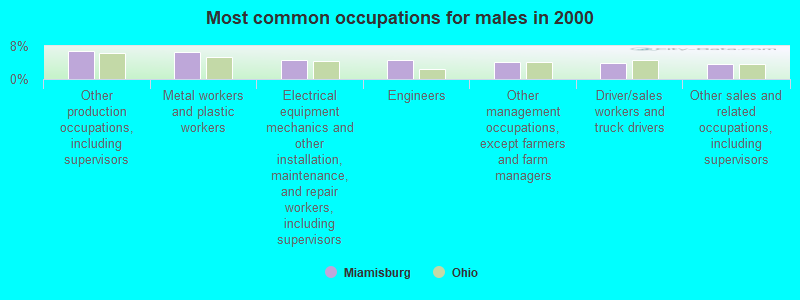
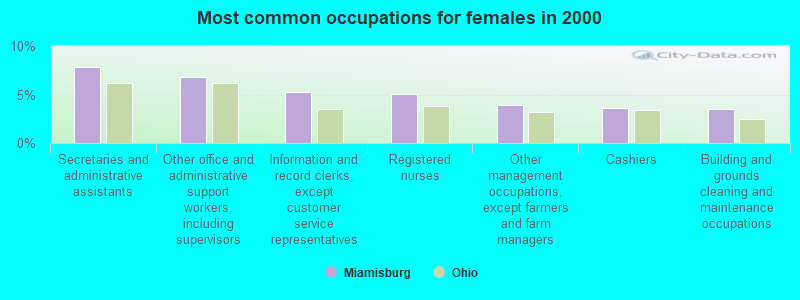
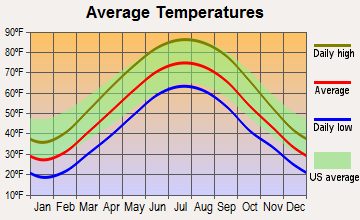
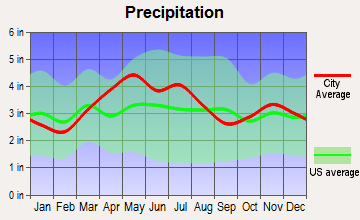
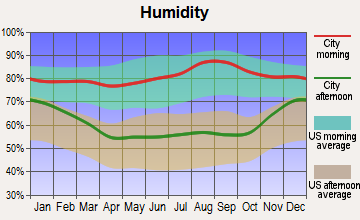
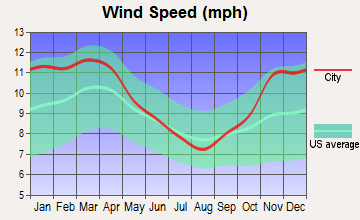
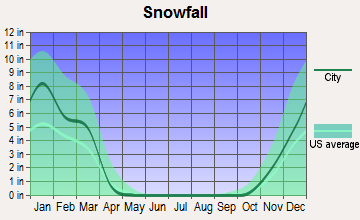
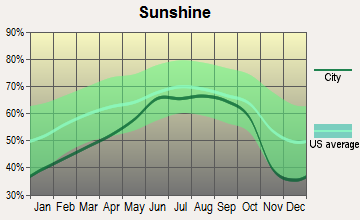
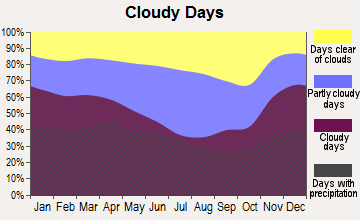
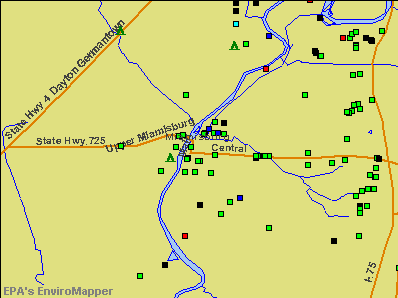

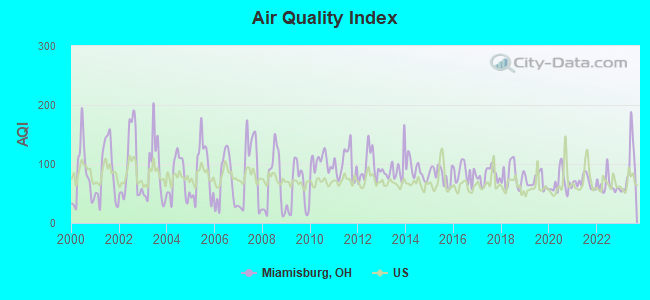
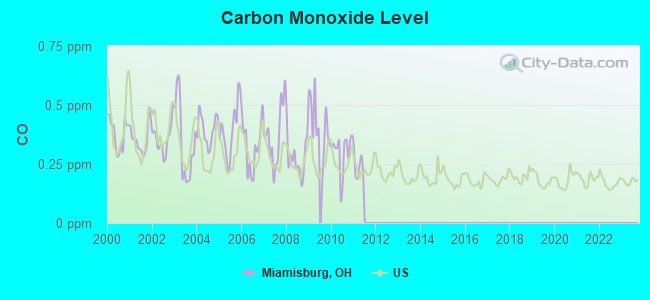
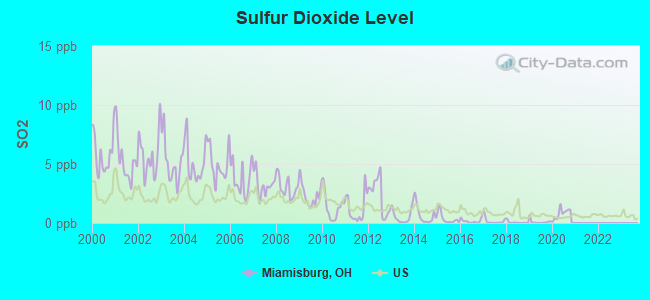
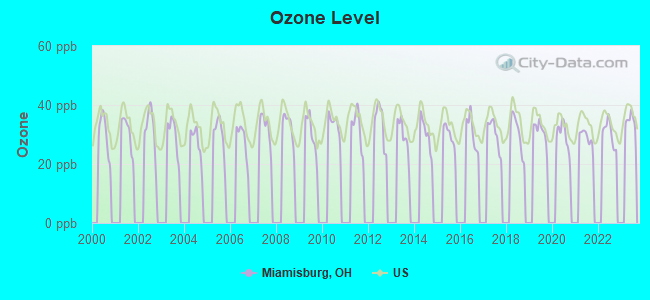
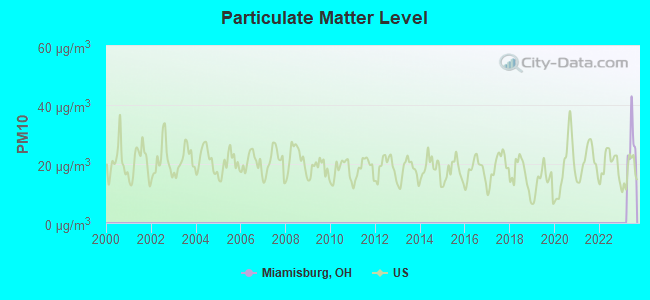
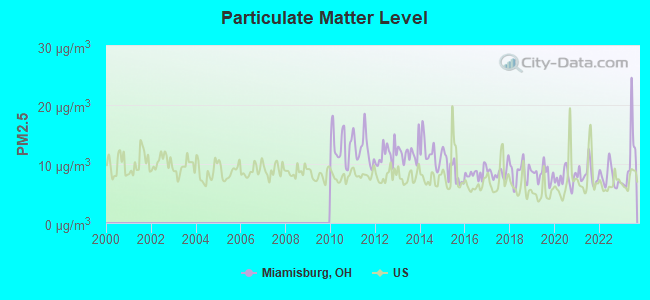
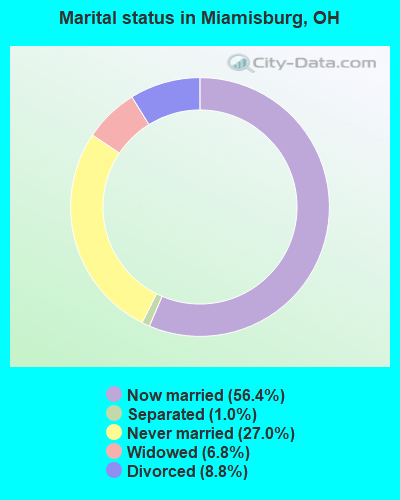
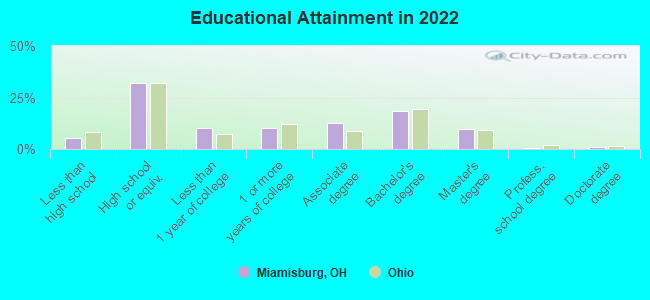
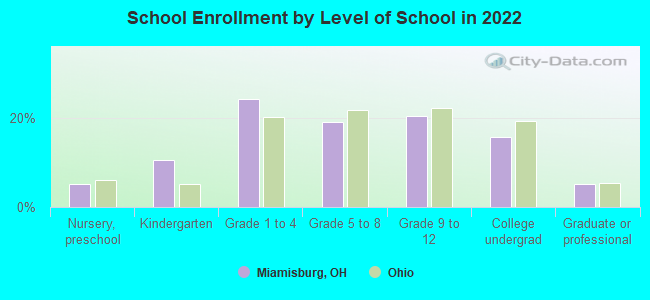
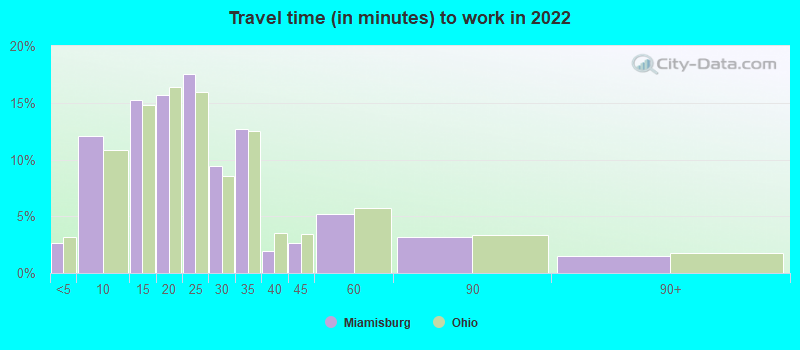
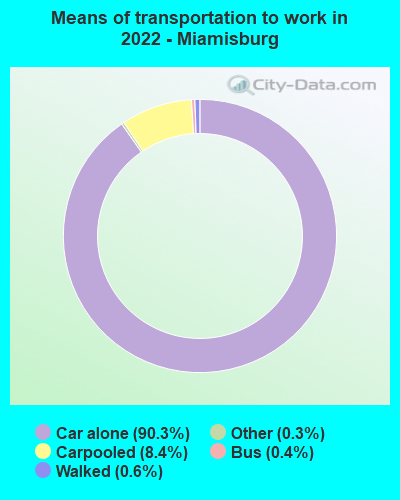
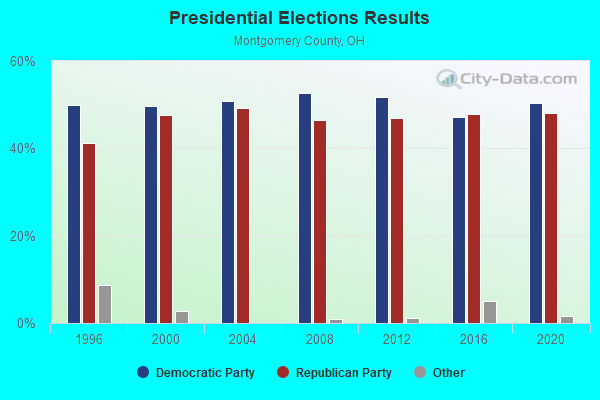
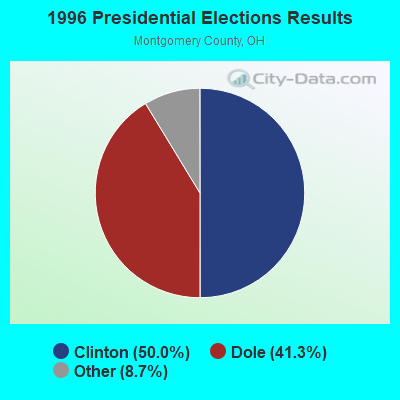
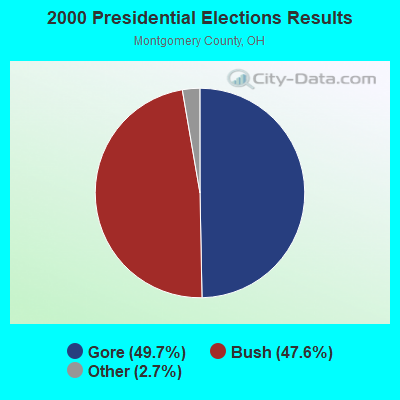
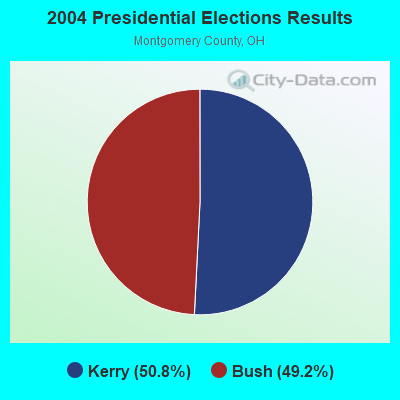
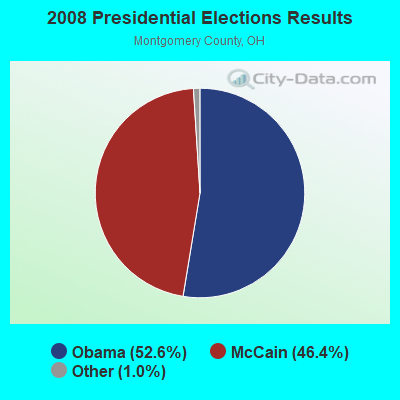

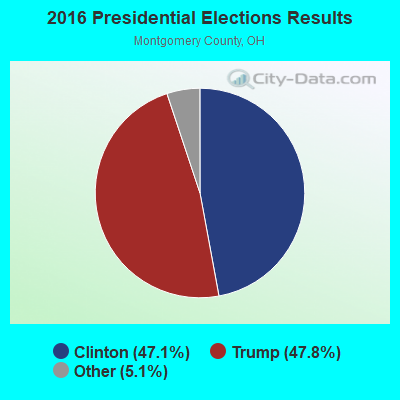
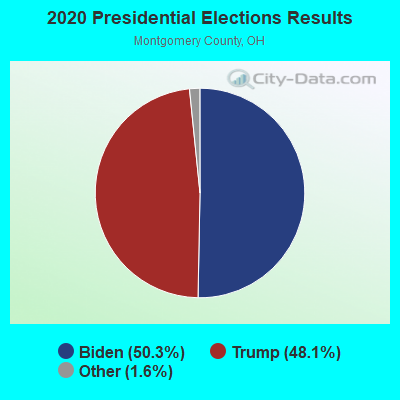
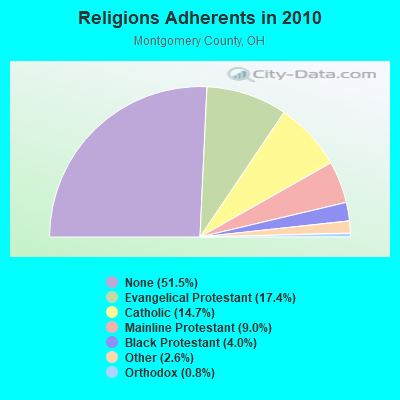
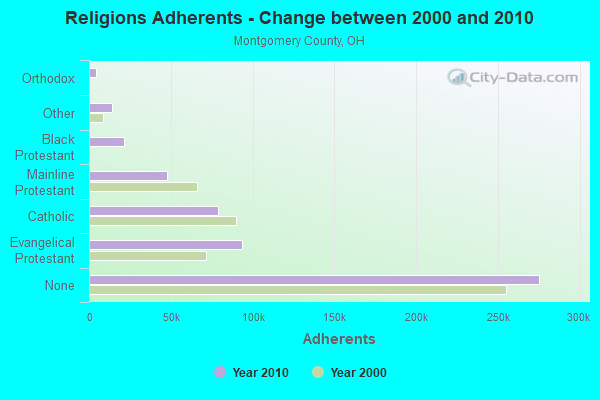
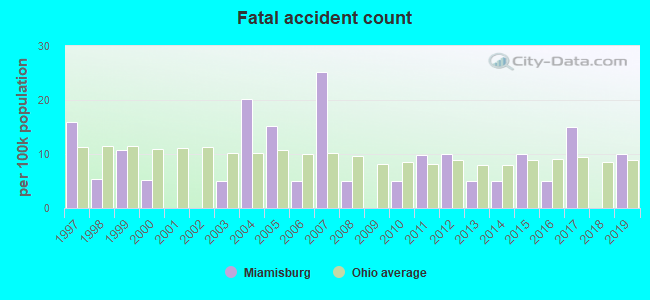

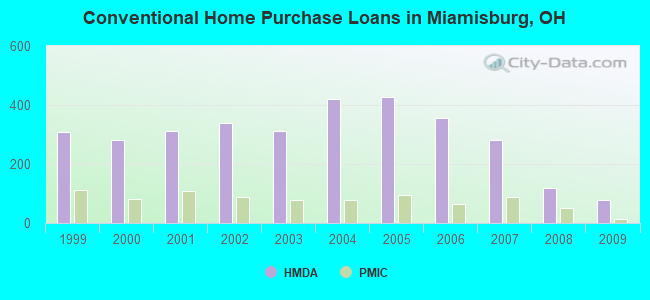
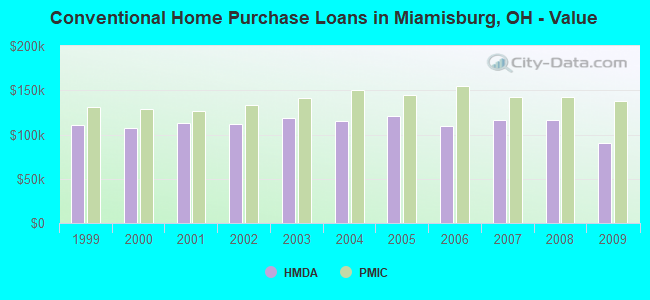
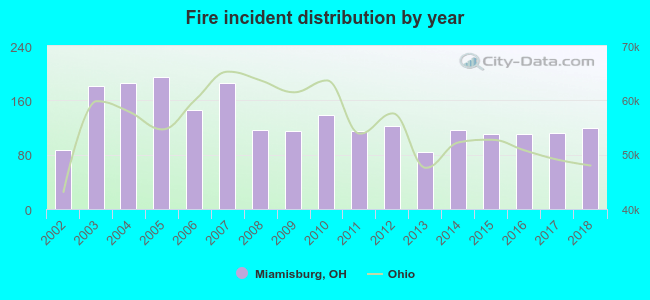 Based on the data from the years 2002 - 2018 the average number of fire incidents per year is 132. The highest number of reported fire incidents - 195 took place in 2005, and the least - 84 in 2013. The data has an increasing trend.
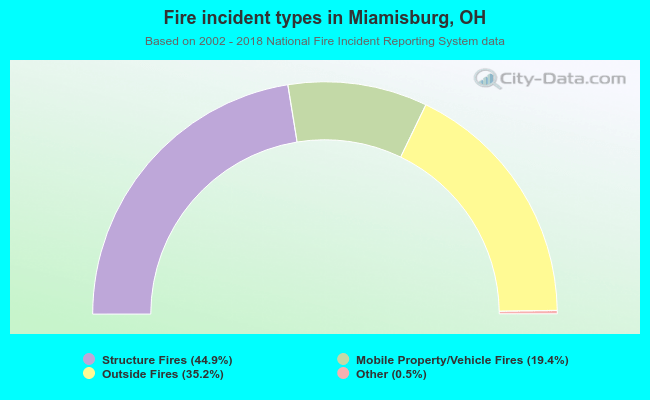 When looking into fire subcategories, the most incidents belonged to: Structure Fires (44.9%), and Outside Fires (35.2%).