Springboro, Ohio Submit your own pictures of this city and show them to the world
OSM Map
General Map
Google Map
MSN Map
OSM Map
General Map
Google Map
MSN Map
OSM Map
General Map
Google Map
MSN Map
OSM Map
General Map
Google Map
MSN Map
Please wait while loading the map...
Population in 2022: 19,427 (99% urban, 1% rural). Population change since 2000: +56.9%Males: 9,562 Females: 9,865
March 2022 cost of living index in Springboro: 89.3 (less than average, U.S. average is 100) Percentage of residents living in poverty in 2022: 3.3%for White Non-Hispanic residents , 1.3% for Black residents , 1.5% for Hispanic or Latino residents , 0.6% for other race residents , 1.1% for two or more races residents )
Profiles of local businesses
Business Search - 14 Million verified businesses
Data:
Median household income ($)
Median household income (% change since 2000)
Household income diversity
Ratio of average income to average house value (%)
Ratio of average income to average rent
Median household income ($) - White
Median household income ($) - Black or African American
Median household income ($) - Asian
Median household income ($) - Hispanic or Latino
Median household income ($) - American Indian and Alaska Native
Median household income ($) - Multirace
Median household income ($) - Other Race
Median household income for houses/condos with a mortgage ($)
Median household income for apartments without a mortgage ($)
Races - White alone (%)
Races - White alone (% change since 2000)
Races - Black alone (%)
Races - Black alone (% change since 2000)
Races - American Indian alone (%)
Races - American Indian alone (% change since 2000)
Races - Asian alone (%)
Races - Asian alone (% change since 2000)
Races - Hispanic (%)
Races - Hispanic (% change since 2000)
Races - Native Hawaiian and Other Pacific Islander alone (%)
Races - Native Hawaiian and Other Pacific Islander alone (% change since 2000)
Races - Two or more races (%)
Races - Two or more races (% change since 2000)
Races - Other race alone (%)
Races - Other race alone (% change since 2000)
Racial diversity
Unemployment (%)
Unemployment (% change since 2000)
Unemployment (%) - White
Unemployment (%) - Black or African American
Unemployment (%) - Asian
Unemployment (%) - Hispanic or Latino
Unemployment (%) - American Indian and Alaska Native
Unemployment (%) - Multirace
Unemployment (%) - Other Race
Population density (people per square mile)
Population - Males (%)
Population - Females (%)
Population - Males (%) - White
Population - Males (%) - Black or African American
Population - Males (%) - Asian
Population - Males (%) - Hispanic or Latino
Population - Males (%) - American Indian and Alaska Native
Population - Males (%) - Multirace
Population - Males (%) - Other Race
Population - Females (%) - White
Population - Females (%) - Black or African American
Population - Females (%) - Asian
Population - Females (%) - Hispanic or Latino
Population - Females (%) - American Indian and Alaska Native
Population - Females (%) - Multirace
Population - Females (%) - Other Race
Coronavirus confirmed cases (Apr 27, 2024)
Deaths caused by coronavirus (Apr 27, 2024)
Coronavirus confirmed cases (per 100k population) (Apr 27, 2024)
Deaths caused by coronavirus (per 100k population) (Apr 27, 2024)
Daily increase in number of cases (Apr 27, 2024)
Weekly increase in number of cases (Apr 27, 2024)
Cases doubled (in days) (Apr 27, 2024)
Hospitalized patients (Apr 18, 2022)
Negative test results (Apr 18, 2022)
Total test results (Apr 18, 2022)
COVID Vaccine doses distributed (per 100k population) (Sep 19, 2023)
COVID Vaccine doses administered (per 100k population) (Sep 19, 2023)
COVID Vaccine doses distributed (Sep 19, 2023)
COVID Vaccine doses administered (Sep 19, 2023)
Likely homosexual households (%)
Likely homosexual households (% change since 2000)
Likely homosexual households - Lesbian couples (%)
Likely homosexual households - Lesbian couples (% change since 2000)
Likely homosexual households - Gay men (%)
Likely homosexual households - Gay men (% change since 2000)
Cost of living index
Median gross rent ($)
Median contract rent ($)
Median monthly housing costs ($)
Median house or condo value ($)
Median house or condo value ($ change since 2000)
Mean house or condo value by units in structure - 1, detached ($)
Mean house or condo value by units in structure - 1, attached ($)
Mean house or condo value by units in structure - 2 ($)
Mean house or condo value by units in structure by units in structure - 3 or 4 ($)
Mean house or condo value by units in structure - 5 or more ($)
Mean house or condo value by units in structure - Boat, RV, van, etc. ($)
Mean house or condo value by units in structure - Mobile home ($)
Median house or condo value ($) - White
Median house or condo value ($) - Black or African American
Median house or condo value ($) - Asian
Median house or condo value ($) - Hispanic or Latino
Median house or condo value ($) - American Indian and Alaska Native
Median house or condo value ($) - Multirace
Median house or condo value ($) - Other Race
Median resident age
Resident age diversity
Median resident age - Males
Median resident age - Females
Median resident age - White
Median resident age - Black or African American
Median resident age - Asian
Median resident age - Hispanic or Latino
Median resident age - American Indian and Alaska Native
Median resident age - Multirace
Median resident age - Other Race
Median resident age - Males - White
Median resident age - Males - Black or African American
Median resident age - Males - Asian
Median resident age - Males - Hispanic or Latino
Median resident age - Males - American Indian and Alaska Native
Median resident age - Males - Multirace
Median resident age - Males - Other Race
Median resident age - Females - White
Median resident age - Females - Black or African American
Median resident age - Females - Asian
Median resident age - Females - Hispanic or Latino
Median resident age - Females - American Indian and Alaska Native
Median resident age - Females - Multirace
Median resident age - Females - Other Race
Commute - mean travel time to work (minutes)
Travel time to work - Less than 5 minutes (%)
Travel time to work - Less than 5 minutes (% change since 2000)
Travel time to work - 5 to 9 minutes (%)
Travel time to work - 5 to 9 minutes (% change since 2000)
Travel time to work - 10 to 19 minutes (%)
Travel time to work - 10 to 19 minutes (% change since 2000)
Travel time to work - 20 to 29 minutes (%)
Travel time to work - 20 to 29 minutes (% change since 2000)
Travel time to work - 30 to 39 minutes (%)
Travel time to work - 30 to 39 minutes (% change since 2000)
Travel time to work - 40 to 59 minutes (%)
Travel time to work - 40 to 59 minutes (% change since 2000)
Travel time to work - 60 to 89 minutes (%)
Travel time to work - 60 to 89 minutes (% change since 2000)
Travel time to work - 90 or more minutes (%)
Travel time to work - 90 or more minutes (% change since 2000)
Marital status - Never married (%)
Marital status - Now married (%)
Marital status - Separated (%)
Marital status - Widowed (%)
Marital status - Divorced (%)
Median family income ($)
Median family income (% change since 2000)
Median non-family income ($)
Median non-family income (% change since 2000)
Median per capita income ($)
Median per capita income (% change since 2000)
Median family income ($) - White
Median family income ($) - Black or African American
Median family income ($) - Asian
Median family income ($) - Hispanic or Latino
Median family income ($) - American Indian and Alaska Native
Median family income ($) - Multirace
Median family income ($) - Other Race
Median year house/condo built
Median year apartment built
Year house built - Built 2005 or later (%)
Year house built - Built 2000 to 2004 (%)
Year house built - Built 1990 to 1999 (%)
Year house built - Built 1980 to 1989 (%)
Year house built - Built 1970 to 1979 (%)
Year house built - Built 1960 to 1969 (%)
Year house built - Built 1950 to 1959 (%)
Year house built - Built 1940 to 1949 (%)
Year house built - Built 1939 or earlier (%)
Average household size
Household density (households per square mile)
Average household size - White
Average household size - Black or African American
Average household size - Asian
Average household size - Hispanic or Latino
Average household size - American Indian and Alaska Native
Average household size - Multirace
Average household size - Other Race
Occupied housing units (%)
Vacant housing units (%)
Owner occupied housing units (%)
Renter occupied housing units (%)
Vacancy status - For rent (%)
Vacancy status - For sale only (%)
Vacancy status - Rented or sold, not occupied (%)
Vacancy status - For seasonal, recreational, or occasional use (%)
Vacancy status - For migrant workers (%)
Vacancy status - Other vacant (%)
Residents with income below the poverty level (%)
Residents with income below 50% of the poverty level (%)
Children below poverty level (%)
Poor families by family type - Married-couple family (%)
Poor families by family type - Male, no wife present (%)
Poor families by family type - Female, no husband present (%)
Poverty status for native-born residents (%)
Poverty status for foreign-born residents (%)
Poverty among high school graduates not in families (%)
Poverty among people who did not graduate high school not in families (%)
Residents with income below the poverty level (%) - White
Residents with income below the poverty level (%) - Black or African American
Residents with income below the poverty level (%) - Asian
Residents with income below the poverty level (%) - Hispanic or Latino
Residents with income below the poverty level (%) - American Indian and Alaska Native
Residents with income below the poverty level (%) - Multirace
Residents with income below the poverty level (%) - Other Race
Air pollution - Air Quality Index (AQI)
Air pollution - CO
Air pollution - NO2
Air pollution - SO2
Air pollution - Ozone
Air pollution - PM10
Air pollution - PM25
Air pollution - Pb
Crime - Murders per 100,000 population
Crime - Rapes per 100,000 population
Crime - Robberies per 100,000 population
Crime - Assaults per 100,000 population
Crime - Burglaries per 100,000 population
Crime - Thefts per 100,000 population
Crime - Auto thefts per 100,000 population
Crime - Arson per 100,000 population
Crime - City-data.com crime index
Crime - Violent crime index
Crime - Property crime index
Crime - Murders per 100,000 population (5 year average)
Crime - Rapes per 100,000 population (5 year average)
Crime - Robberies per 100,000 population (5 year average)
Crime - Assaults per 100,000 population (5 year average)
Crime - Burglaries per 100,000 population (5 year average)
Crime - Thefts per 100,000 population (5 year average)
Crime - Auto thefts per 100,000 population (5 year average)
Crime - Arson per 100,000 population (5 year average)
Crime - City-data.com crime index (5 year average)
Crime - Violent crime index (5 year average)
Crime - Property crime index (5 year average)
1996 Presidential Elections Results (%) - Democratic Party (Clinton)
1996 Presidential Elections Results (%) - Republican Party (Dole)
1996 Presidential Elections Results (%) - Other
2000 Presidential Elections Results (%) - Democratic Party (Gore)
2000 Presidential Elections Results (%) - Republican Party (Bush)
2000 Presidential Elections Results (%) - Other
2004 Presidential Elections Results (%) - Democratic Party (Kerry)
2004 Presidential Elections Results (%) - Republican Party (Bush)
2004 Presidential Elections Results (%) - Other
2008 Presidential Elections Results (%) - Democratic Party (Obama)
2008 Presidential Elections Results (%) - Republican Party (McCain)
2008 Presidential Elections Results (%) - Other
2012 Presidential Elections Results (%) - Democratic Party (Obama)
2012 Presidential Elections Results (%) - Republican Party (Romney)
2012 Presidential Elections Results (%) - Other
2016 Presidential Elections Results (%) - Democratic Party (Clinton)
2016 Presidential Elections Results (%) - Republican Party (Trump)
2016 Presidential Elections Results (%) - Other
2020 Presidential Elections Results (%) - Democratic Party (Biden)
2020 Presidential Elections Results (%) - Republican Party (Trump)
2020 Presidential Elections Results (%) - Other
Ancestries Reported - Arab (%)
Ancestries Reported - Czech (%)
Ancestries Reported - Danish (%)
Ancestries Reported - Dutch (%)
Ancestries Reported - English (%)
Ancestries Reported - French (%)
Ancestries Reported - French Canadian (%)
Ancestries Reported - German (%)
Ancestries Reported - Greek (%)
Ancestries Reported - Hungarian (%)
Ancestries Reported - Irish (%)
Ancestries Reported - Italian (%)
Ancestries Reported - Lithuanian (%)
Ancestries Reported - Norwegian (%)
Ancestries Reported - Polish (%)
Ancestries Reported - Portuguese (%)
Ancestries Reported - Russian (%)
Ancestries Reported - Scotch-Irish (%)
Ancestries Reported - Scottish (%)
Ancestries Reported - Slovak (%)
Ancestries Reported - Subsaharan African (%)
Ancestries Reported - Swedish (%)
Ancestries Reported - Swiss (%)
Ancestries Reported - Ukrainian (%)
Ancestries Reported - United States (%)
Ancestries Reported - Welsh (%)
Ancestries Reported - West Indian (%)
Ancestries Reported - Other (%)
Educational Attainment - No schooling completed (%)
Educational Attainment - Less than high school (%)
Educational Attainment - High school or equivalent (%)
Educational Attainment - Less than 1 year of college (%)
Educational Attainment - 1 or more years of college (%)
Educational Attainment - Associate degree (%)
Educational Attainment - Bachelor's degree (%)
Educational Attainment - Master's degree (%)
Educational Attainment - Professional school degree (%)
Educational Attainment - Doctorate degree (%)
School Enrollment - Nursery, preschool (%)
School Enrollment - Kindergarten (%)
School Enrollment - Grade 1 to 4 (%)
School Enrollment - Grade 5 to 8 (%)
School Enrollment - Grade 9 to 12 (%)
School Enrollment - College undergrad (%)
School Enrollment - Graduate or professional (%)
School Enrollment - Not enrolled in school (%)
School enrollment - Public schools (%)
School enrollment - Private schools (%)
School enrollment - Not enrolled (%)
Median number of rooms in houses and condos
Median number of rooms in apartments
Housing units lacking complete plumbing facilities (%)
Housing units lacking complete kitchen facilities (%)
Density of houses
Urban houses (%)
Rural houses (%)
Households with people 60 years and over (%)
Households with people 65 years and over (%)
Households with people 75 years and over (%)
Households with one or more nonrelatives (%)
Households with no nonrelatives (%)
Population in households (%)
Family households (%)
Nonfamily households (%)
Population in families (%)
Family households with own children (%)
Median number of bedrooms in owner occupied houses
Mean number of bedrooms in owner occupied houses
Median number of bedrooms in renter occupied houses
Mean number of bedrooms in renter occupied houses
Median number of vehichles in owner occupied houses
Mean number of vehichles in owner occupied houses
Median number of vehichles in renter occupied houses
Mean number of vehichles in renter occupied houses
Mortgage status - with mortgage (%)
Mortgage status - with second mortgage (%)
Mortgage status - with home equity loan (%)
Mortgage status - with both second mortgage and home equity loan (%)
Mortgage status - without a mortgage (%)
Average family size
Average family size - White
Average family size - Black or African American
Average family size - Asian
Average family size - Hispanic or Latino
Average family size - American Indian and Alaska Native
Average family size - Multirace
Average family size - Other Race
Geographical mobility - Same house 1 year ago (%)
Geographical mobility - Moved within same county (%)
Geographical mobility - Moved from different county within same state (%)
Geographical mobility - Moved from different state (%)
Geographical mobility - Moved from abroad (%)
Place of birth - Born in state of residence (%)
Place of birth - Born in other state (%)
Place of birth - Native, outside of US (%)
Place of birth - Foreign born (%)
Housing units in structures - 1, detached (%)
Housing units in structures - 1, attached (%)
Housing units in structures - 2 (%)
Housing units in structures - 3 or 4 (%)
Housing units in structures - 5 to 9 (%)
Housing units in structures - 10 to 19 (%)
Housing units in structures - 20 to 49 (%)
Housing units in structures - 50 or more (%)
Housing units in structures - Mobile home (%)
Housing units in structures - Boat, RV, van, etc. (%)
House/condo owner moved in on average (years ago)
Renter moved in on average (years ago)
Year householder moved into unit - Moved in 1999 to March 2000 (%)
Year householder moved into unit - Moved in 1995 to 1998 (%)
Year householder moved into unit - Moved in 1990 to 1994 (%)
Year householder moved into unit - Moved in 1980 to 1989 (%)
Year householder moved into unit - Moved in 1970 to 1979 (%)
Year householder moved into unit - Moved in 1969 or earlier (%)
Means of transportation to work - Drove car alone (%)
Means of transportation to work - Carpooled (%)
Means of transportation to work - Public transportation (%)
Means of transportation to work - Bus or trolley bus (%)
Means of transportation to work - Streetcar or trolley car (%)
Means of transportation to work - Subway or elevated (%)
Means of transportation to work - Railroad (%)
Means of transportation to work - Ferryboat (%)
Means of transportation to work - Taxicab (%)
Means of transportation to work - Motorcycle (%)
Means of transportation to work - Bicycle (%)
Means of transportation to work - Walked (%)
Means of transportation to work - Other means (%)
Working at home (%)
Industry diversity
Most Common Industries - Agriculture, forestry, fishing and hunting, and mining (%)
Most Common Industries - Agriculture, forestry, fishing and hunting (%)
Most Common Industries - Mining, quarrying, and oil and gas extraction (%)
Most Common Industries - Construction (%)
Most Common Industries - Manufacturing (%)
Most Common Industries - Wholesale trade (%)
Most Common Industries - Retail trade (%)
Most Common Industries - Transportation and warehousing, and utilities (%)
Most Common Industries - Transportation and warehousing (%)
Most Common Industries - Utilities (%)
Most Common Industries - Information (%)
Most Common Industries - Finance and insurance, and real estate and rental and leasing (%)
Most Common Industries - Finance and insurance (%)
Most Common Industries - Real estate and rental and leasing (%)
Most Common Industries - Professional, scientific, and management, and administrative and waste management services (%)
Most Common Industries - Professional, scientific, and technical services (%)
Most Common Industries - Management of companies and enterprises (%)
Most Common Industries - Administrative and support and waste management services (%)
Most Common Industries - Educational services, and health care and social assistance (%)
Most Common Industries - Educational services (%)
Most Common Industries - Health care and social assistance (%)
Most Common Industries - Arts, entertainment, and recreation, and accommodation and food services (%)
Most Common Industries - Arts, entertainment, and recreation (%)
Most Common Industries - Accommodation and food services (%)
Most Common Industries - Other services, except public administration (%)
Most Common Industries - Public administration (%)
Occupation diversity
Most Common Occupations - Management, business, science, and arts occupations (%)
Most Common Occupations - Management, business, and financial occupations (%)
Most Common Occupations - Management occupations (%)
Most Common Occupations - Business and financial operations occupations (%)
Most Common Occupations - Computer, engineering, and science occupations (%)
Most Common Occupations - Computer and mathematical occupations (%)
Most Common Occupations - Architecture and engineering occupations (%)
Most Common Occupations - Life, physical, and social science occupations (%)
Most Common Occupations - Education, legal, community service, arts, and media occupations (%)
Most Common Occupations - Community and social service occupations (%)
Most Common Occupations - Legal occupations (%)
Most Common Occupations - Education, training, and library occupations (%)
Most Common Occupations - Arts, design, entertainment, sports, and media occupations (%)
Most Common Occupations - Healthcare practitioners and technical occupations (%)
Most Common Occupations - Health diagnosing and treating practitioners and other technical occupations (%)
Most Common Occupations - Health technologists and technicians (%)
Most Common Occupations - Service occupations (%)
Most Common Occupations - Healthcare support occupations (%)
Most Common Occupations - Protective service occupations (%)
Most Common Occupations - Fire fighting and prevention, and other protective service workers including supervisors (%)
Most Common Occupations - Law enforcement workers including supervisors (%)
Most Common Occupations - Food preparation and serving related occupations (%)
Most Common Occupations - Building and grounds cleaning and maintenance occupations (%)
Most Common Occupations - Personal care and service occupations (%)
Most Common Occupations - Sales and office occupations (%)
Most Common Occupations - Sales and related occupations (%)
Most Common Occupations - Office and administrative support occupations (%)
Most Common Occupations - Natural resources, construction, and maintenance occupations (%)
Most Common Occupations - Farming, fishing, and forestry occupations (%)
Most Common Occupations - Construction and extraction occupations (%)
Most Common Occupations - Installation, maintenance, and repair occupations (%)
Most Common Occupations - Production, transportation, and material moving occupations (%)
Most Common Occupations - Production occupations (%)
Most Common Occupations - Transportation occupations (%)
Most Common Occupations - Material moving occupations (%)
People in Group quarters - Institutionalized population (%)
People in Group quarters - Correctional institutions (%)
People in Group quarters - Federal prisons and detention centers (%)
People in Group quarters - Halfway houses (%)
People in Group quarters - Local jails and other confinement facilities (including police lockups) (%)
People in Group quarters - Military disciplinary barracks (%)
People in Group quarters - State prisons (%)
People in Group quarters - Other types of correctional institutions (%)
People in Group quarters - Nursing homes (%)
People in Group quarters - Hospitals/wards, hospices, and schools for the handicapped (%)
People in Group quarters - Hospitals/wards and hospices for chronically ill (%)
People in Group quarters - Hospices or homes for chronically ill (%)
People in Group quarters - Military hospitals or wards for chronically ill (%)
People in Group quarters - Other hospitals or wards for chronically ill (%)
People in Group quarters - Hospitals or wards for drug/alcohol abuse (%)
People in Group quarters - Mental (Psychiatric) hospitals or wards (%)
People in Group quarters - Schools, hospitals, or wards for the mentally retarded (%)
People in Group quarters - Schools, hospitals, or wards for the physically handicapped (%)
People in Group quarters - Institutions for the deaf (%)
People in Group quarters - Institutions for the blind (%)
People in Group quarters - Orthopedic wards and institutions for the physically handicapped (%)
People in Group quarters - Wards in general hospitals for patients who have no usual home elsewhere (%)
People in Group quarters - Wards in military hospitals for patients who have no usual home elsewhere (%)
People in Group quarters - Juvenile institutions (%)
People in Group quarters - Long-term care (%)
People in Group quarters - Homes for abused, dependent, and neglected children (%)
People in Group quarters - Residential treatment centers for emotionally disturbed children (%)
People in Group quarters - Training schools for juvenile delinquents (%)
People in Group quarters - Short-term care, detention or diagnostic centers for delinquent children (%)
People in Group quarters - Type of juvenile institution unknown (%)
People in Group quarters - Noninstitutionalized population (%)
People in Group quarters - College dormitories (includes college quarters off campus) (%)
People in Group quarters - Military quarters (%)
People in Group quarters - On base (%)
People in Group quarters - Barracks, unaccompanied personnel housing (UPH), (Enlisted/Officer), ;and similar group living quarters for military personnel (%)
People in Group quarters - Transient quarters for temporary residents (%)
People in Group quarters - Military ships (%)
People in Group quarters - Group homes (%)
People in Group quarters - Homes or halfway houses for drug/alcohol abuse (%)
People in Group quarters - Homes for the mentally ill (%)
People in Group quarters - Homes for the mentally retarded (%)
People in Group quarters - Homes for the physically handicapped (%)
People in Group quarters - Other group homes (%)
People in Group quarters - Religious group quarters (%)
People in Group quarters - Dormitories (%)
People in Group quarters - Agriculture workers' dormitories on farms (%)
People in Group quarters - Job Corps and vocational training facilities (%)
People in Group quarters - Other workers' dormitories (%)
People in Group quarters - Crews of maritime vessels (%)
People in Group quarters - Other nonhousehold living situations (%)
People in Group quarters - Other noninstitutional group quarters (%)
Residents speaking English at home (%)
Residents speaking English at home - Born in the United States (%)
Residents speaking English at home - Native, born elsewhere (%)
Residents speaking English at home - Foreign born (%)
Residents speaking Spanish at home (%)
Residents speaking Spanish at home - Born in the United States (%)
Residents speaking Spanish at home - Native, born elsewhere (%)
Residents speaking Spanish at home - Foreign born (%)
Residents speaking other language at home (%)
Residents speaking other language at home - Born in the United States (%)
Residents speaking other language at home - Native, born elsewhere (%)
Residents speaking other language at home - Foreign born (%)
Class of Workers - Employee of private company (%)
Class of Workers - Self-employed in own incorporated business (%)
Class of Workers - Private not-for-profit wage and salary workers (%)
Class of Workers - Local government workers (%)
Class of Workers - State government workers (%)
Class of Workers - Federal government workers (%)
Class of Workers - Self-employed workers in own not incorporated business and Unpaid family workers (%)
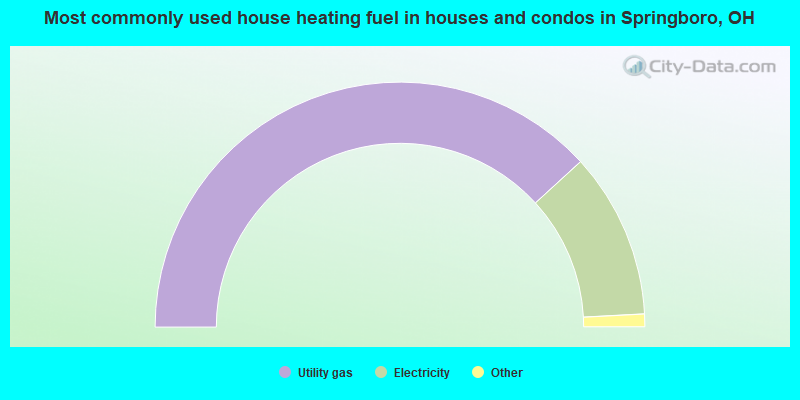
House heating fuel used in houses and condos - Utility gas (%)
House heating fuel used in houses and condos - Bottled, tank, or LP gas (%)
House heating fuel used in houses and condos - Electricity (%)
House heating fuel used in houses and condos - Fuel oil, kerosene, etc. (%)
House heating fuel used in houses and condos - Coal or coke (%)
House heating fuel used in houses and condos - Wood (%)
House heating fuel used in houses and condos - Solar energy (%)
House heating fuel used in houses and condos - Other fuel (%)
House heating fuel used in houses and condos - No fuel used (%)
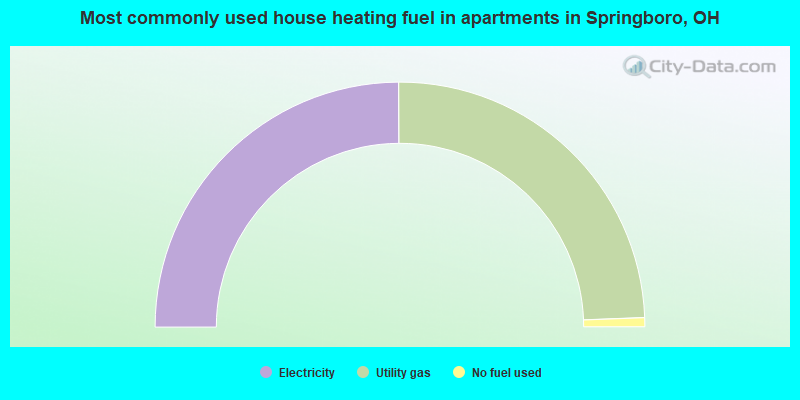
House heating fuel used in apartments - Utility gas (%)
House heating fuel used in apartments - Bottled, tank, or LP gas (%)
House heating fuel used in apartments - Electricity (%)
House heating fuel used in apartments - Fuel oil, kerosene, etc. (%)
House heating fuel used in apartments - Coal or coke (%)
House heating fuel used in apartments - Wood (%)
House heating fuel used in apartments - Solar energy (%)
House heating fuel used in apartments - Other fuel (%)
House heating fuel used in apartments - No fuel used (%)
Armed forces status - In Armed Forces (%)
Armed forces status - Civilian (%)
Armed forces status - Civilian - Veteran (%)
Armed forces status - Civilian - Nonveteran (%)
Fatal accidents locations in years 2005-2021
Fatal accidents locations in 2005
Fatal accidents locations in 2006
Fatal accidents locations in 2007
Fatal accidents locations in 2008
Fatal accidents locations in 2009
Fatal accidents locations in 2010
Fatal accidents locations in 2011
Fatal accidents locations in 2012
Fatal accidents locations in 2013
Fatal accidents locations in 2014
Fatal accidents locations in 2015
Fatal accidents locations in 2016
Fatal accidents locations in 2017
Fatal accidents locations in 2018
Fatal accidents locations in 2019
Fatal accidents locations in 2020
Fatal accidents locations in 2021
Alcohol use - People drinking some alcohol every month (%)
Alcohol use - People not drinking at all (%)
Alcohol use - Average days/month drinking alcohol
Alcohol use - Average drinks/week
Alcohol use - Average days/year people drink much
Audiometry - Average condition of hearing (%)
Audiometry - People that can hear a whisper from across a quiet room (%)
Audiometry - People that can hear normal voice from across a quiet room (%)
Audiometry - Ears ringing, roaring, buzzing (%)
Audiometry - Had a job exposure to loud noise (%)
Audiometry - Had off-work exposure to loud noise (%)
Blood Pressure & Cholesterol - Has high blood pressure (%)
Blood Pressure & Cholesterol - Checking blood pressure at home (%)
Blood Pressure & Cholesterol - Frequently checking blood cholesterol (%)
Blood Pressure & Cholesterol - Has high cholesterol level (%)
Consumer Behavior - Money monthly spent on food at supermarket/grocery store
Consumer Behavior - Money monthly spent on food at other stores
Consumer Behavior - Money monthly spent on eating out
Consumer Behavior - Money monthly spent on carryout/delivered foods
Consumer Behavior - Income spent on food at supermarket/grocery store (%)
Consumer Behavior - Income spent on food at other stores (%)
Consumer Behavior - Income spent on eating out (%)
Consumer Behavior - Income spent on carryout/delivered foods (%)
Current Health Status - General health condition (%)
Current Health Status - Blood donors (%)
Current Health Status - Has blood ever tested for HIV virus (%)
Current Health Status - Left-handed people (%)
Dermatology - People using sunscreen (%)
Diabetes - Diabetics (%)
Diabetes - Had a blood test for high blood sugar (%)
Diabetes - People taking insulin (%)
Diet Behavior & Nutrition - Diet health (%)
Diet Behavior & Nutrition - Milk product consumption (# of products/month)
Diet Behavior & Nutrition - Meals not home prepared (#/week)
Diet Behavior & Nutrition - Meals from fast food or pizza place (#/week)
Diet Behavior & Nutrition - Ready-to-eat foods (#/month)
Diet Behavior & Nutrition - Frozen meals/pizza (#/month)
Drug Use - People that ever used marijuana or hashish (%)
Drug Use - Ever used hard drugs (%)
Drug Use - Ever used any form of cocaine (%)
Drug Use - Ever used heroin (%)
Drug Use - Ever used methamphetamine (%)
Health Insurance - People covered by health insurance (%)
Kidney Conditions-Urology - Avg. # of times urinating at night
Medical Conditions - People with asthma (%)
Medical Conditions - People with anemia (%)
Medical Conditions - People with psoriasis (%)
Medical Conditions - People with overweight (%)
Medical Conditions - Elderly people having difficulties in thinking or remembering (%)
Medical Conditions - People who ever received blood transfusion (%)
Medical Conditions - People having trouble seeing even with glass/contacts (%)
Medical Conditions - People with arthritis (%)
Medical Conditions - People with gout (%)
Medical Conditions - People with congestive heart failure (%)
Medical Conditions - People with coronary heart disease (%)
Medical Conditions - People with angina pectoris (%)
Medical Conditions - People who ever had heart attack (%)
Medical Conditions - People who ever had stroke (%)
Medical Conditions - People with emphysema (%)
Medical Conditions - People with thyroid problem (%)
Medical Conditions - People with chronic bronchitis (%)
Medical Conditions - People with any liver condition (%)
Medical Conditions - People who ever had cancer or malignancy (%)
Mental Health - People who have little interest in doing things (%)
Mental Health - People feeling down, depressed, or hopeless (%)
Mental Health - People who have trouble sleeping or sleeping too much (%)
Mental Health - People feeling tired or having little energy (%)
Mental Health - People with poor appetite or overeating (%)
Mental Health - People feeling bad about themself (%)
Mental Health - People who have trouble concentrating on things (%)
Mental Health - People moving or speaking slowly or too fast (%)
Mental Health - People having thoughts they would be better off dead (%)
Oral Health - Average years since last visit a dentist
Oral Health - People embarrassed because of mouth (%)
Oral Health - People with gum disease (%)
Oral Health - General health of teeth and gums (%)
Oral Health - Average days a week using dental floss/device
Oral Health - Average days a week using mouthwash for dental problem
Oral Health - Average number of teeth
Pesticide Use - Households using pesticides to control insects (%)
Pesticide Use - Households using pesticides to kill weeds (%)
Physical Activity - People doing vigorous-intensity work activities (%)
Physical Activity - People doing moderate-intensity work activities (%)
Physical Activity - People walking or bicycling (%)
Physical Activity - People doing vigorous-intensity recreational activities (%)
Physical Activity - People doing moderate-intensity recreational activities (%)
Physical Activity - Average hours a day doing sedentary activities
Physical Activity - Average hours a day watching TV or videos
Physical Activity - Average hours a day using computer
Physical Functioning - People having limitations keeping them from working (%)
Physical Functioning - People limited in amount of work they can do (%)
Physical Functioning - People that need special equipment to walk (%)
Physical Functioning - People experiencing confusion/memory problems (%)
Physical Functioning - People requiring special healthcare equipment (%)
Prescription Medications - Average number of prescription medicines taking
Preventive Aspirin Use - Adults 40+ taking low-dose aspirin (%)
Reproductive Health - Vaginal deliveries (%)
Reproductive Health - Cesarean deliveries (%)
Reproductive Health - Deliveries resulted in a live birth (%)
Reproductive Health - Pregnancies resulted in a delivery (%)
Reproductive Health - Women breastfeeding newborns (%)
Reproductive Health - Women that had a hysterectomy (%)
Reproductive Health - Women that had both ovaries removed (%)
Reproductive Health - Women that have ever taken birth control pills (%)
Reproductive Health - Women taking birth control pills (%)
Reproductive Health - Women that have ever used Depo-Provera or injectables (%)
Reproductive Health - Women that have ever used female hormones (%)
Sexual Behavior - People 18+ that ever had sex (vaginal, anal, or oral) (%)
Sexual Behavior - Males 18+ that ever had vaginal sex with a woman (%)
Sexual Behavior - Males 18+ that ever performed oral sex on a woman (%)
Sexual Behavior - Males 18+ that ever had anal sex with a woman (%)
Sexual Behavior - Males 18+ that ever had any sex with a man (%)
Sexual Behavior - Females 18+ that ever had vaginal sex with a man (%)
Sexual Behavior - Females 18+ that ever performed oral sex on a man (%)
Sexual Behavior - Females 18+ that ever had anal sex with a man (%)
Sexual Behavior - Females 18+ that ever had any kind of sex with a woman (%)
Sexual Behavior - Average age people first had sex
Sexual Behavior - Average number of female sex partners in lifetime (males 18+)
Sexual Behavior - Average number of female vaginal sex partners in lifetime (males 18+)
Sexual Behavior - Average age people first performed oral sex on a woman (18+)
Sexual Behavior - Average number of woman performed oral sex on in lifetime (18+)
Sexual Behavior - Average number of male sex partners in lifetime (males 18+)
Sexual Behavior - Average number of male anal sex partners in lifetime (males 18+)
Sexual Behavior - Average age people first performed oral sex on a man (18+)
Sexual Behavior - Average number of male oral sex partners in lifetime (18+)
Sexual Behavior - People using protection when performing oral sex (%)
Sexual Behavior - Average number of times people have vaginal or anal sex a year
Sexual Behavior - People having sex without condom (%)
Sexual Behavior - Average number of male sex partners in lifetime (females 18+)
Sexual Behavior - Average number of male vaginal sex partners in lifetime (females 18+)
Sexual Behavior - Average number of female sex partners in lifetime (females 18+)
Sexual Behavior - Circumcised males 18+ (%)
Sleep Disorders - Average hours sleeping at night
Sleep Disorders - People that has trouble sleeping (%)
Smoking-Cigarette Use - People smoking cigarettes (%)
Taste & Smell - People 40+ having problems with smell (%)
Taste & Smell - People 40+ having problems with taste (%)
Taste & Smell - People 40+ that ever had wisdom teeth removed (%)
Taste & Smell - People 40+ that ever had tonsils teeth removed (%)
Taste & Smell - People 40+ that ever had a loss of consciousness because of a head injury (%)
Taste & Smell - People 40+ that ever had a broken nose or other serious injury to face or skull (%)
Taste & Smell - People 40+ that ever had two or more sinus infections (%)
Weight - Average height (inches)
Weight - Average weight (pounds)
Weight - Average BMI
Weight - People that are obese (%)
Weight - People that ever were obese (%)
Weight - People trying to lose weight (%)
According to our research of Ohio and other state lists, there were 11 registered sex offenders living in Springboro, Ohio as of April 27, 2024 . The ratio of all residents to sex offenders in Springboro is 1,638 to 1.The ratio of registered sex offenders to all residents in this city is much lower than the state average.
Officers per 1,000 residents here:
1.60Ohio average:
2.31
Latest news from Springboro, OH collected exclusively by city-data.com from local newspapers, TV, and radio stations
Ancestries: German (23.9%), American (11.5%), English (8.3%), Italian (4.8%), Irish (4.2%), European (2.1%).
Current Local Time:
Land area: 8.81 square miles.
Population density: 2,205 people per square mile (low).
754 residents are foreign born (2.3% Asia , 1.0% Latin America ).
Median real estate property taxes paid for housing units with mortgages in 2022: $3,346 (1.0%)Median real estate property taxes paid for housing units with no mortgage in 2022: $3,416 (1.0%)
Nearest city with pop. 50,000+: Middletown, OH
Nearest city with pop. 200,000+: Cincinnati, OH
Nearest city with pop. 1,000,000+: Chicago, IL
Nearest cities:
Latitude: 39.56 N, Longitude: 84.23 W
Daytime population change due to commuting: +1,458 (+7.4%)Workers who live and work in this city: 2,994 (30.0%)
Area code commonly used in this area: 937
Single-family new house construction building permits:
2022: 2 buildings , average cost: $330,1002021: 13 buildings , average cost: $381,5002020: 57 buildings , average cost: $305,7002019: 50 buildings , average cost: $248,6002018: 54 buildings , average cost: $237,6002017: 67 buildings , average cost: $226,3002016: 55 buildings , average cost: $220,9002015: 67 buildings , average cost: $212,0002014: 73 buildings , average cost: $170,1002013: 95 buildings , average cost: $179,4002012: 68 buildings , average cost: $144,8002011: 24 buildings , average cost: $170,0002010: 24 buildings , average cost: $156,1002009: 32 buildings , average cost: $181,5002008: 41 buildings , average cost: $181,4002007: 69 buildings , average cost: $182,0002006: 95 buildings , average cost: $179,3002005: 137 buildings , average cost: $184,9002004: 204 buildings , average cost: $170,7002003: 277 buildings , average cost: $147,6002002: 256 buildings , average cost: $125,9002001: 294 buildings , average cost: $113,7002000: 288 buildings , average cost: $113,9001999: 325 buildings , average cost: $113,0001998: 256 buildings , average cost: $117,8001997: 211 buildings , average cost: $115,600Unemployment in December 2023:
Population change in the 1990s: +5,512 (+80.3%).
Most common occupations in Springboro, OH (%)
Both Males Females
Sales representatives, services, wholesale and manufacturing (5.6%)
Other management occupations, except farmers and farm managers (5.4%)
Other sales and related occupations, including supervisors (5.1%)
Engineers (4.9%)
Computer specialists (3.8%)
Other production occupations, including supervisors (3.6%)
Preschool, kindergarten, elementary, and middle school teachers (3.4%)
Other management occupations, except farmers and farm managers (8.1%)
Engineers (8.0%)
Sales representatives, services, wholesale and manufacturing (6.9%)
Other sales and related occupations, including supervisors (6.2%)
Top executives (5.8%)
Computer specialists (4.4%)
Other production occupations, including supervisors (4.4%)
Preschool, kindergarten, elementary, and middle school teachers (6.9%)
Secretaries and administrative assistants (6.6%)
Registered nurses (5.0%)
Sales representatives, services, wholesale and manufacturing (4.1%)
Other sales and related occupations, including supervisors (3.8%)
Other office and administrative support workers, including supervisors (3.8%)
Retail sales workers, except cashiers (3.3%)
Tornado activity:
Springboro-area historical tornado activity is slightly above Ohio state average. It is 59% greater than the overall U.S. average.
On 4/3/1974, a category F5 (max. wind speeds 261-318 mph) tornado 10.5 miles away from the Springboro city center killed 36 people and injured 1150 people and caused between $50,000,000 and $500,000,000 in damages.
On 4/3/1974, a category F4 (max. wind speeds 207-260 mph) tornado 9.7 miles away from the city center killed 2 people and injured 39 people and caused between $50,000 and $500,000 in damages.
Earthquake activity:
Springboro-area historical earthquake activity is significantly above Ohio state average. It is 31% greater than the overall U.S. average. On 7/27/1980 at 18:52:21, a magnitude 5.2 (5.1 MB, 4.7 MS, 5.0 UK, 5.2 UK, Class: Moderate, Intensity: VI - VII) earthquake occurred 95.2 miles away from Springboro center On 4/18/2008 at 09:36:59, a magnitude 5.4 (5.1 MB, 4.8 MS, 5.4 MW, 5.2 MW) earthquake occurred 211.1 miles away from Springboro center On 4/18/2008 at 09:36:59, a magnitude 5.2 (5.2 MW, Depth: 8.9 mi) earthquake occurred 211.1 miles away from Springboro center On 7/12/1986 at 08:19:37, a magnitude 4.5 (4.5 MB, Class: Light, Intensity: IV - V) earthquake occurred 67.7 miles away from the city center On 9/7/1988 at 02:28:09, a magnitude 4.6 (4.5 MB, 4.6 LG) earthquake occurred 100.1 miles away from the city center On 6/10/1987 at 23:48:54, a magnitude 5.1 (4.9 MB, 4.4 MS, 4.6 MS, 5.1 LG) earthquake occurred 202.6 miles away from Springboro center Magnitude types: regional Lg-wave magnitude (LG), body-wave magnitude (MB), surface-wave magnitude (MS), moment magnitude (MW) Natural disasters: The number of natural disasters in Warren County (10) is smaller than the US average (15).Major Disasters (Presidential) Declared: 6Emergencies Declared: 3Floods: 4, Heavy Rains: 2, Storms: 2, Blizzard: 1, Hurricane: 1, Mudslide: 1, Snow: 1, Snowstorm: 1, Tornado: 1, Tropical Depression: 1, Wind: 1, Winter Storm: 1, Other: 1 (Note: some incidents may be assigned to more than one category). Hospitals and medical centers in Springboro: HILLSPRING HEALTH CARE AND REHAB (325 EAST CENTRAL AVENUE)
DIALYSIS CENTERS OF WARREN COUNTY (90 COMMERCIAL WAY)
GREENSPRINGS HOME HEALTH CARE, LLC (776 WEST CENTRAL AVENUE)
College/University in Springboro: Miami-Jacobs Career College-Springboro Full-time enrollment: 239; Location: 875 West Central Ave; Private, for-profit; Website: www.miamijacobs.edu)
Colleges/universities with over 2000 students nearest to Springboro:
Fortis College-Centerville (about 8 miles; Centerville, OH ; Full-time enrollment: 4,527)
University of Dayton (about 13 miles; Dayton, OH ; FT enrollment: 10,392)
Sinclair Community College (about 14 miles; Dayton, OH ; FT enrollment: 13,779)
Wright State University-Main Campus (about 18 miles; Dayton, OH ; FT enrollment: 14,482)
Central State University (about 22 miles; Wilberforce, OH ; FT enrollment: 2,094)
Miami University-Hamilton (about 23 miles; Hamilton, OH ; FT enrollment: 2,906)
University of Cincinnati-Blue Ash College (about 25 miles; Blue Ash, OH ; FT enrollment: 3,711)
Public high school in Springboro:
Public elementary/middle schools in Springboro:
Private elementary/middle school in Springboro: MINDS IN MOTION Students: 271, Location: 20 ELEANOR DR, Grades: PK-8)
See full list of schools located in Springboro Birthplace of: Jake Ballard - Football player, Adam Gill - College basketball player (Central Florida Knights), Ryan Teets - College basketball player (Air Force Falcons), Seth Doliboa - Basketball player.
Warren County has a predicted average indoor radon screening level greater than 4 pCi/L (pico curies per liter) - Highest Potential Average household size: This city:
2.9 peopleOhio:
2.4 people
Percentage of family households: This city:
81.2%Whole state:
65.0%
Percentage of households with unmarried partners: This city:
4.4%Whole state:
6.8%
Likely homosexual households (counted as self-reported same-sex unmarried-partner households)
Lesbian couples: 0.4% of all households Gay men: 0.3% of all households
110 people in nursing facilities/skilled-nursing facilities in 2010people in nursing homes in 2000
Banks with most branches in Springboro (2011 data):
PNC Bank, National Association: Settle's Walk Branch at 650 North Main Street, branch established on 2005/04/11; Springboro Franklin Branch at 860 West Central Avenue, branch established on 1987/03/30. Info updated 2012/03/20: Bank assets: $263,309.6 mil, Deposits: $197,343.0 mil, headquarters in Wilmington, DE, positive income , Commercial Lending Specialization, 3085 total offices , Holding Company: Pnc Financial Services Group, Inc., The
The National Bank and Trust Company: Springboro Branch at 95 Edgebrook Drive, branch established on 1987/04/27. Info updated 2010/03/22: Bank assets: $675.5 mil, Deposits: $589.3 mil, headquarters in Wilmington, OH, positive income , Commercial Lending Specialization, 24 total offices , Holding Company: Nb&T Financial Group, Inc.
LCNB National Bank: Springboro/Franklin Branch at 525 West Central Avenue, branch established on 1996/07/18. Info updated 2010/06/02: Bank assets: $787.1 mil, Deposits: $664.9 mil, headquarters in Lebanon, OH, positive income , Commercial Lending Specialization, 26 total offices , Holding Company: Lcnb Corp.
The Park National Bank: 2412 Springboro Office Branch at 720 Gardner Road, branch established on 2008/04/14. Info updated 2008/09/29: Bank assets: $6,281.7 mil, Deposits: $4,611.6 mil, headquarters in Newark, OH, positive income , Commercial Lending Specialization, 123 total offices , Holding Company: Park National Corporation
JPMorgan Chase Bank, National Association: Springboro Branch at 15 Springwood Drive, branch established on 1979/09/13. Info updated 2011/11/10: Bank assets: $1,811,678.0 mil, Deposits: $1,190,738.0 mil, headquarters in Columbus, OH, positive income , International Specialization, 5577 total offices , Holding Company: Jpmorgan Chase & Co.
The Huntington National Bank: Springboro Branch at 736 North Main Street, branch established on 1962/02/12. Info updated 2012/04/02: Bank assets: $54,183.4 mil, Deposits: $44,300.3 mil, headquarters in Columbus, OH, positive income , Commercial Lending Specialization, 878 total offices , Holding Company: Huntington Bancshares Incorporated
First Financial Bank, National Association: Springboro Branch at 885 West Central Avenue, branch established on 1977/12/05. Info updated 2009/09/21: Bank assets: $6,663.4 mil, Deposits: $5,754.9 mil, headquarters in Hamilton, OH, positive income , Commercial Lending Specialization, 101 total offices , Holding Company: First Financial Bancorp
Liberty Savings Bank, F.S.B.: West Central Ave Branch at 260 W Central Ave, branch established on 2007/03/19. Info updated 2011/07/21: Bank assets: $683.0 mil, Deposits: $553.2 mil, headquarters in Wilmington, OH, positive income , Mortgage Lending Specialization, 33 total offices
KeyBank National Association: Springboro Branch at 690 North Main Street, branch established on 2004/09/04. Info updated 2008/03/03: Bank assets: $86,198.8 mil, Deposits: $64,214.8 mil, headquarters in Cleveland, OH, positive income , Commercial Lending Specialization, 1067 total offices , Holding Company: Keycorp
3 other banks with 3 local branches
For population 15 years and over in Springboro:
Never married: 19.9%Now married: 66.5%Separated: 0.5%Widowed: 4.4%Divorced: 8.7% For population 25 years and over in Springboro:
High school or higher: 97.8%Bachelor's degree or higher: 55.2%Graduate or professional degree: 23.8%Unemployed: 2.1%Mean travel time to work (commute): 22.4 minutes
Education Gini index (Inequality in education) Here:
9.0Ohio average:
11.0
Religion statistics for Springboro, OH (based on Warren County data)
Religion Adherents Congregations Evangelical Protestant 31,559 117 Catholic 19,509 5 Mainline Protestant 10,874 35 Black Protestant 191 1 Other 97 4 None 150,463 -
Source: Clifford Grammich, Kirk Hadaway, Richard Houseal, Dale E.Jones, Alexei Krindatch, Richie Stanley and Richard H.Taylor. 2012. 2010 U.S.Religion Census: Religious Congregations & Membership Study. Association of Statisticians of American Religious Bodies. Jones, Dale E., et al. 2002. Congregations and Membership in the United States 2000. Nashville, TN: Glenmary Research Center. Graphs represent county-level data
Food Environment Statistics: Number of grocery stores : 21Warren County :
1.03 / 10,000 pop.Ohio :
1.89 / 10,000 pop.
Number of supercenters and club stores : 2Here :
0.10 / 10,000 pop.Ohio :
0.13 / 10,000 pop.
Number of convenience stores (no gas) : 17This county :
0.83 / 10,000 pop.State :
1.25 / 10,000 pop.
Number of convenience stores (with gas) : 52This county :
2.55 / 10,000 pop.State :
2.93 / 10,000 pop.
Number of full-service restaurants : 111Warren County :
5.45 / 10,000 pop.Ohio :
6.25 / 10,000 pop.
Adult obesity rate : Warren County :
27.2%Ohio :
29.1%
Low-income preschool obesity rate : This county :
16.1%State :
11.9%
Health and Nutrition: Healthy diet rate : Springboro:
55.8%Ohio:
50.4%
Average overall health of teeth and gums : Average BMI : Springboro:
27.8State:
28.7
People feeling badly about themselves : Springboro:
19.7%Ohio:
20.6%
People not drinking alcohol at all : Average hours sleeping at night : Overweight people : This city:
33.3%State:
34.3%
General health condition : This city:
63.1%State:
57.0%
Average condition of hearing : Springboro:
82.5%State:
79.1%
More about Health and Nutrition of Springboro, OH Residents
Local government employment and payroll (March 2022)
Function
Full-time employees
Monthly full-time payroll
Average yearly full-time wage
Part-time employees
Monthly part-time payroll
Police Protection - Officers
23 $156,635 $81,723 0 $0 Parks and Recreation
17 $83,815 $59,164 22 $6,691 Streets and Highways
12 $70,315 $70,315 0 $0 Financial Administration
9 $59,979 $79,972 0 $0 Police - Other
6 $43,937 $87,874 2 $2,827 Other Government Administration
5 $46,206 $110,894 6 $7,325 Water Supply
3 $15,578 $62,312 0 $0 Other and Unallocable
3 $20,914 $83,656 1 $1,849 Judicial and Legal
1 $4,885 $58,620 1 $381
Totals for Government
79 $502,264 $76,293 32 $19,073
Springboro government finances - Expenditure in 2018 (per resident):
Construction - General - Other: $7,302,000 ($375.87)
Parks and Recreation: $1,320,000 ($67.95)Current Operations - Police Protection: $3,067,000 ($157.87)
Parks and Recreation: $2,875,000 ($147.99)General - Other: $2,746,000 ($141.35)Water Utilities: $2,079,000 ($107.02)Sewerage: $1,412,000 ($72.68)Regular Highways: $1,339,000 ($68.92)Financial Administration: $1,220,000 ($62.80)Solid Waste Management: $1,220,000 ($62.80)Central Staff Services: $1,077,000 ($55.44)Protective Inspection and Regulation - Other: $392,000 ($20.18)Judicial and Legal Services: $41,000 ($2.11)Libraries: $34,000 ($1.75)Health - Other: $19,000 ($0.98)Correctional Institutions: $8,000 ($0.41)General - Interest on Debt: $1,367,000 ($70.37)
Other Capital Outlay - Sewerage: $599,000 ($30.83)
Water Utilities: $232,000 ($11.94)Parks and Recreation: $109,000 ($5.61)Police Protection: $31,000 ($1.60)General - Other: $23,000 ($1.18)Judicial and Legal Services: $13,000 ($0.67)Regular Highways: $6,000 ($0.31)Total Salaries and Wages: $8,284,000 ($426.42)
Springboro government finances - Revenue in 2018 (per resident):
Charges - Sewerage: $5,011,000 ($257.94)
Parks and Recreation: $1,710,000 ($88.02)Solid Waste Management: $1,123,000 ($57.81)Miscellaneous - Special Assessments: $1,155,000 ($59.45)
Fines and Forfeits: $817,000 ($42.05)General Revenue - Other: $735,000 ($37.83)Interest Earnings: $148,000 ($7.62)Donations From Private Sources: $9,000 ($0.46)Revenue - Water Utilities: $5,094,000 ($262.21)
State Intergovernmental - Highways: $928,000 ($47.77)
General Local Government Support: $367,000 ($18.89)Other: $96,000 ($4.94)Tax - Individual Income: $15,182,000 ($781.49)
Property: $991,000 ($51.01)
Springboro government finances - Debt in 2018 (per resident):
Long Term Debt - Beginning Outstanding - Unspecified Public Purpose: $28,595,000 ($1471.92)
Outstanding Unspecified Public Purpose: $25,405,000 ($1307.72)Retired Unspecified Public Purpose: $3,190,000 ($164.20)
Springboro government finances - Cash and Securities in 2018 (per resident):
Bond Funds - Cash and Securities: $2,896,000 ($149.07)
Other Funds - Cash and Securities: $28,205,000 ($1451.85)
Sinking Funds - Cash and Securities: $178,000 ($9.16)
9.23% of this county's 2021 resident taxpayers lived in other counties in 2020 ($85,617 average adjusted gross income )
Here:
9.23%Ohio average:
5.68%
0.02% of residents moved from foreign countries ($170 average AGI )Warren County:
0.02%Ohio average:
0.01%
Top counties from which taxpayers relocated into this county between 2020 and 2021:
Businesses in Springboro, OH
Name Count Name Count
Ace Hardware 1 Kmart 1 Applebee's 1 Kroger 1 Blockbuster 1 Lane Furniture 1 Buffalo Wild Wings 1 Little Caesars Pizza 2 Burger King 1 Long John Silver's 1 CVS 1 McDonald's 1 Chipotle 1 Penske 1 Cold Stone Creamery 1 Pizza Hut 1 Comfort Inn 1 RadioShack 1 Dairy Queen 1 Subway 2 Domino's Pizza 1 T-Mobile 1 FedEx 2 Taco Bell 1 H&R Block 1 Tim Hortons 1 Hilton 1 UPS 8 Jimmy John's 1 Wendy's 1 KFC 1 YMCA 1
Strongest AM radio stations in Springboro:
WLW (700 AM; 50 kW; CINCINNATI, OH; Owner: JACOR BROADCASTING CORPORATION)
WONE (980 AM; 5 kW; DAYTON, OH; Owner: CITICASTERS LICENSES, L.P.)
WING (1410 AM; 5 kW; DAYTON, OH)
WHIO (1290 AM; 5 kW; DAYTON, OH; Owner: CXR HOLDINGS, INC.)
WSAI (1530 AM; 50 kW; CINCINNATI, OH; Owner: JACOR BROADCASTING CORPORATION)
WPFB (910 AM; 1 kW; MIDDLETOWN, OH)
WTVN (610 AM; 50 kW; COLUMBUS, OH; Owner: CITICASTERS LICENSES, L.P.)
WGNZ (1110 AM; daytime; 2 kW; FAIRBORN, OH; Owner: L&D BROADCASTORS INC.)
WCNW (1560 AM; daytime; 5 kW; FAIRFIELD, OH)
WDAO (1210 AM; daytime; 1 kW; DAYTON, OH; Owner: JOHNSON COMMUNICATIONS, INC.)
WRFD (880 AM; daytime; 23 kW; COLUMBUS-WORTHINGTON, OH; Owner: SALEM MEDIA OF OHIO, INC.)
WKRC (550 AM; 5 kW; CINCINNATI, OH; Owner: JACOR BROADCASTING CORPORATION)
WCKY (1360 AM; 5 kW; CINCINNATI, OH; Owner: JACOR BROADCASTING CORPORATION)
Strongest FM radio stations in Springboro:
WPFB-FM (105.9 FM; MIDDLETOWN, OH; Owner: RADIO STATIONS WPAY/WPFB, INC.)
WHKO (99.1 FM; DAYTON, OH; Owner: CXR HOLDINGS, INC.)
WFCJ (93.7 FM; MIAMISBURG, OH; Owner: MIAMI VALLEY CHRISTIAN BROADCASTING ASSOCIATION)
WLQT (99.9 FM; KETTERING, OH; Owner: CITICASTERS LICENSES, L.P.)
WMMX (107.7 FM; DAYTON, OH; Owner: CITICASTERS LICENSES, L.P.)
WTUE (104.7 FM; DAYTON, OH; Owner: CITICASTERS LICENSES, L.P.)
WRNB (92.1 FM; WEST CARROLLTON, OH; Owner: RADIO ONE OF DAYTON LICENSES, LLC)
WYGY (96.5 FM; LEBANON, OH; Owner: WVAE LICO, INC.)
WXEG (103.9 FM; BEAVERCREEK, OH; Owner: CITICASTERS LICENSES, L.P.)
WCWT-FM (101.5 FM; CENTERVILLE, OH; Owner: CENTERVILLE CITY BOARD OF EDUCATION)
WMOJ (94.9 FM; FAIRFIELD, OH; Owner: WVAE LICO, INC.)
WAQZ (97.3 FM; FORT THOMAS, KY; Owner: INFINITY RADIO OPERATIONS INC.)
WDPR (88.1 FM; WEST CARROLLTON, OH; Owner: DAYTON PUBLIC RADIO, INC.)
WGRR (103.5 FM; HAMILTON, OH; Owner: INFINITY RADIO OPERATIONS INC.)
WGTZ (92.9 FM; EATON, OH; Owner: BLUE CHIP BROADCASTING LICENSES, LTD)
WRRM (98.5 FM; CINCINNATI, OH; Owner: WRRM LICO, INC)
WUBE-FM (105.1 FM; CINCINNATI, OH; Owner: INFINITY RADIO OPERATIONS INC.)
WGUC (90.9 FM; CINCINNATI, OH; Owner: CINCINNATI CLASSICAL PUBLIC RADIO, INC.)
WKRQ (101.9 FM; CINCINNATI, OH; Owner: INFINITY RADIO OPERATIONS INC.)
WKFS (107.1 FM; MILFORD, OH; Owner: JACOR BROADCASTING CORPORATION)
TV broadcast stations around Springboro:
WWRD-LP (Channel 55; CENTERVILLE, OH; Owner: LIFE BROADCASTING NETWORK)
WDTN (Channel 2; DAYTON, OH; Owner: WDTN BROADCASTING, LLC)
WHIO-TV (Channel 7; DAYTON, OH; Owner: WHIO-TV HOLDINGS, INC.)
WPTD (Channel 16; DAYTON, OH; Owner: GREATER DAYTON PUBLIC TV, INC.)
WKEF (Channel 22; DAYTON, OH; Owner: WKEF LICENSEE L.P.)
WRGT-TV (Channel 45; DAYTON, OH; Owner: WRGT LICENSEE, LLC)
W61DE (Channel 61; CINCINNATI, OH; Owner: TRINITY BROADCASTING NETWORK)
WRCX-LP (Channel 51; DAYTON, OH; Owner: ROSS COMMUNICATIONS, LTD.)
WKOI (Channel 43; RICHMOND, IN; Owner: TRINITY BROADCASTING OF INDIANA, INC.)
WPTO (Channel 14; OXFORD, OH; Owner: GREATER DAYTON PUBLIC TELEVISION, INC.)
WBDT (Channel 26; SPRINGFIELD, OH; Owner: ACME TV LICENSES OF OHIO, LLC)
WLWT (Channel 5; CINCINNATI, OH; Owner: OHIO/OKLAHOMA HEARST-ARGYLE TV, INC)
WCPO-TV (Channel 9; CINCINNATI, OH; Owner: SCRIPPS HOWARD BROADCASTING COMPANY)
WXIX-TV (Channel 19; NEWPORT, KY; Owner: RAYCOM NATIONAL, INC.)
WKRC-TV (Channel 12; CINCINNATI, OH; Owner: CITICASTERS CO.)
WSTR-TV (Channel 64; CINCINNATI, OH; Owner: WSTR LICENSEE, INC.)
WCET (Channel 48; CINCINNATI, OH; Owner: THE GREATER CINCINNATI TV EDUC'L. FOUNDATION)
WBQC-CA (Channel 25; CINCINNATI, OH; Owner: ELLIOTT B. BLOCK)
WOTH-LP (Channel 35; CINCINNATI, OH; Owner: ELLIOTT B. BLOCK)
National Bridge Inventory (NBI) Statistics 21 Number of bridges151ft / 45.8m Total length341,186 Total average daily traffic34,185 Total average daily truck traffic
New bridges - historical statistics
3 1950-1959 1 1960-1969 4 1970-1979 1 1980-1989 3 1990-1999 4 2000-2009 5 2010-2019
See full National Bridge Inventory statistics for Springboro, OH
FCC Registered Cell Phone Towers: 1 (
See the full list of FCC Registered Cell Phone Towers in Springboro )
FCC Registered Antenna Towers: 59 (
See the full list of FCC Registered Antenna Towers )
FCC Registered Broadcast Land Mobile Towers: 15 (
See the full list of FCC Registered Broadcast Land Mobile Towers in Springboro, OH )
FCC Registered Microwave Towers: 5
OH-DAY016A, 96 Greenwood Lane (Lat: 39.568611 Lon: -84.261667), Type: Pole, Structure height: 56.4 m, Overall height: 57.6 m, Call Sign: WQGU869, Assigned Frequencies: 17960.0 MHz, Grant Date: 03/21/2017, Expiration Date: 04/23/2027, Cancellation Date: 01/29/2019, Certifier: Nadja Sodos-Wallace, Registrant: Sprint Corporation, 12502 Sunrise Valley Drive, M/S: Varesa0209, Reston, VA 20196, Phone: (800) 572-8256, Fax: (703) 433-4483, Email:
SPRINGBORO OH1, 96 Greenwood Lane (Lat: 39.568611 Lon: -84.261667), Type: Pole, Structure height: 56.4 m, Overall height: 57.6 m, Call Sign: WQIK766, Assigned Frequencies: 11035.0 MHz, Grant Date: 03/05/2008, Expiration Date: 03/05/2018, Cancellation Date: 09/05/2009, Certifier: William Chastain, Registrant: Radio Dynamics Corporation, Silver Spring, MD 20914, Phone: (301) 493-5171, Fax: (301) 576-4553, Email:
CIN0207, 96 Greenwood Lane (Lat: 39.568611 Lon: -84.261667), Type: Pole, Structure height: 56.4 m, Overall height: 57.6 m, Call Sign: WQNC228, Assigned Frequencies: 10735.0 MHz, 10815.0 MHz, Grant Date: 12/09/2010, Expiration Date: 12/09/2020, Cancellation Date: 08/28/2020, Certifier: John T Scott Iii, Registrant: Verizon Wireless, 5055 North Point Pkwy, Np2ne Network Engineering, Alpharetta, GA 30022, Phone: (770) 797-1070, Fax: (678) 259-1319, Email:
FIVE POINTS, W Lytle-Five Points Road (Lat: 39.569750 Lon: -84.186167), Type: Ltower, Structure height: 84.7 m, Overall height: 89.9 m, Call Sign: WQTL469, Assigned Frequencies: 17815.0 MHz, 17865.0 MHz, Grant Date: 01/23/2024, Expiration Date: 02/27/2034, Certifier: John Monday, Registrant: At&t Services, Inc., 208 S Akard St, 20f, Dallas, TX 75202, Phone: (855) 699-7073, Email:
CI15052A, 96 Greenwood Lane (Lat: 39.568611 Lon: -84.261667), Type: Pole, Structure height: 56.4 m, Overall height: 58.2 m, Call Sign: WRVE298, Assigned Frequencies: 19540.0 MHz, 19620.0 MHz, 19540.0 MHz, 19620.0 MHz, 19540.0 MHz, 19620.0 MHz, 19540.0 MHz, 19620.0 MHz, 19540.0 MHz, 19620.0 MHz... (+12 more), Grant Date: 11/08/2022, Expiration Date: 11/08/2032, Certifier: Jenny Knopf, Registrant: T-Mobile Usa, Inc., 12920 Se 38th Street, Bellevue, WA 98006, Phone: (425) 383-8401, Fax: (425) 383-4040, Email:
FCC Registered Paging Towers: 1
2.65 Miles Ne On Five Point-Lytle Road (Lat: 39.569778 Lon: -84.186028), Call Sign: KWU264, Assigned Frequencies: 152.840 MHz, Grant Date: 10/15/1999, Expiration Date: 10/12/2009, Cancellation Date: 09/11/2003, Registrant: Ameritech Regional Wireless Engineering, 529 South 7th Street, Rm 3a, Springfield, IL 62721, Phone: (217) 527-2367, Fax: (217) 527-2368, Email:
FCC Registered Amateur Radio Licenses: 140 (
See the full list of FCC Registered Amateur Radio Licenses in Springboro )
FAA Registered Aircraft: 28 (
See the full list of FAA Registered Aircraft in Springboro )
Home Mortgage Disclosure Act Aggregated Statistics For Year 2009(Based on 4 partial tracts) A) FHA, FSA/RHS & VA B) Conventional C) Refinancings D) Home Improvement Loans F) Non-occupant Loans on Number Average Value Number Average Value Number Average Value Number Average Value Number Average Value
LOANS ORIGINATED 67 $147,900 55 $150,677 318 $161,951 5 $69,044 13 $121,543 APPLICATIONS APPROVED, NOT ACCEPTED 3 $119,760 4 $159,428 20 $157,992 1 $18,250 1 $132,520 APPLICATIONS DENIED 8 $166,381 7 $130,314 80 $169,925 7 $19,506 4 $118,190 APPLICATIONS WITHDRAWN 8 $159,611 4 $174,918 49 $158,816 2 $184,370 1 $205,230 FILES CLOSED FOR INCOMPLETENESS 2 $120,275 2 $152,960 6 $140,533 2 $57,655 0 $0
Aggregated Statistics For Year 2008(Based on 4 partial tracts) A) FHA, FSA/RHS & VA B) Conventional C) Refinancings D) Home Improvement Loans F) Non-occupant Loans on Number Average Value Number Average Value Number Average Value Number Average Value Number Average Value
LOANS ORIGINATED 52 $160,028 84 $161,767 161 $158,904 15 $31,281 11 $106,936 APPLICATIONS APPROVED, NOT ACCEPTED 3 $170,867 6 $107,047 25 $165,389 1 $6,830 1 $76,780 APPLICATIONS DENIED 7 $122,256 11 $213,385 81 $140,349 8 $44,995 2 $87,825 APPLICATIONS WITHDRAWN 7 $202,564 4 $164,762 45 $146,693 2 $41,195 2 $79,755 FILES CLOSED FOR INCOMPLETENESS 1 $222,640 2 $75,015 11 $156,743 0 $0 0 $0
Aggregated Statistics For Year 2007(Based on 4 partial tracts) A) FHA, FSA/RHS & VA B) Conventional C) Refinancings D) Home Improvement Loans E) Loans on Dwellings For 5+ Families F) Non-occupant Loans on G) Loans On Manufactured Number Average Value Number Average Value Number Average Value Number Average Value Number Average Value Number Average Value Number Average Value
LOANS ORIGINATED 23 $173,063 168 $152,035 140 $136,425 20 $33,898 2 $2,415,190 28 $96,154 0 $0 APPLICATIONS APPROVED, NOT ACCEPTED 1 $161,640 13 $148,239 29 $149,219 6 $28,525 0 $0 4 $161,978 0 $0 APPLICATIONS DENIED 4 $165,830 17 $187,175 102 $134,056 14 $51,684 0 $0 5 $124,482 1 $21,390 APPLICATIONS WITHDRAWN 2 $145,190 20 $176,702 41 $147,361 2 $53,160 0 $0 5 $107,808 0 $0 FILES CLOSED FOR INCOMPLETENESS 1 $80,030 3 $149,323 12 $164,594 0 $0 0 $0 1 $181,260 0 $0
Aggregated Statistics For Year 2006(Based on 4 partial tracts) A) FHA, FSA/RHS & VA B) Conventional C) Refinancings D) Home Improvement Loans F) Non-occupant Loans on Number Average Value Number Average Value Number Average Value Number Average Value Number Average Value
LOANS ORIGINATED 25 $157,219 231 $150,549 157 $123,479 34 $38,069 24 $106,547 APPLICATIONS APPROVED, NOT ACCEPTED 0 $0 20 $149,582 34 $128,973 4 $33,535 3 $75,197 APPLICATIONS DENIED 2 $109,240 25 $139,154 118 $139,159 27 $54,470 6 $168,937 APPLICATIONS WITHDRAWN 2 $238,790 16 $157,760 62 $130,090 5 $56,242 5 $140,050 FILES CLOSED FOR INCOMPLETENESS 0 $0 11 $125,025 20 $151,542 2 $88,900 1 $124,770
Aggregated Statistics For Year 2005(Based on 4 partial tracts) A) FHA, FSA/RHS & VA B) Conventional C) Refinancings D) Home Improvement Loans F) Non-occupant Loans on G) Loans On Manufactured Number Average Value Number Average Value Number Average Value Number Average Value Number Average Value Number Average Value
LOANS ORIGINATED 28 $146,304 257 $144,604 218 $140,277 29 $44,351 34 $88,902 0 $0 APPLICATIONS APPROVED, NOT ACCEPTED 1 $150,790 19 $129,600 62 $126,573 5 $29,814 8 $80,221 0 $0 APPLICATIONS DENIED 5 $162,488 30 $131,416 138 $142,493 25 $28,240 13 $121,648 1 $38,100 APPLICATIONS WITHDRAWN 0 $0 21 $138,525 81 $157,636 7 $157,730 5 $110,508 0 $0 FILES CLOSED FOR INCOMPLETENESS 1 $233,390 8 $169,619 26 $174,052 2 $82,010 1 $168,660 0 $0
Aggregated Statistics For Year 2004(Based on 4 partial tracts) A) FHA, FSA/RHS & VA B) Conventional C) Refinancings D) Home Improvement Loans F) Non-occupant Loans on G) Loans On Manufactured Number Average Value Number Average Value Number Average Value Number Average Value Number Average Value Number Average Value
LOANS ORIGINATED 29 $148,609 261 $154,425 319 $137,634 25 $37,119 29 $117,599 0 $0 APPLICATIONS APPROVED, NOT ACCEPTED 1 $77,520 24 $155,658 70 $124,131 7 $37,623 5 $153,796 0 $0 APPLICATIONS DENIED 4 $166,900 23 $129,329 141 $123,817 18 $35,569 5 $110,710 1 $34,420 APPLICATIONS WITHDRAWN 2 $192,205 18 $133,123 92 $133,924 4 $42,500 6 $136,072 0 $0 FILES CLOSED FOR INCOMPLETENESS 0 $0 5 $96,226 17 $138,548 3 $22,097 0 $0 0 $0
Aggregated Statistics For Year 2003(Based on 4 partial tracts) A) FHA, FSA/RHS & VA B) Conventional C) Refinancings D) Home Improvement Loans F) Non-occupant Loans on Number Average Value Number Average Value Number Average Value Number Average Value Number Average Value
LOANS ORIGINATED 50 $137,644 245 $152,174 846 $132,411 25 $14,392 44 $86,820 APPLICATIONS APPROVED, NOT ACCEPTED 4 $165,888 17 $147,149 94 $125,802 8 $30,706 4 $80,088 APPLICATIONS DENIED 3 $155,103 17 $116,524 147 $131,280 13 $21,904 6 $84,170 APPLICATIONS WITHDRAWN 2 $156,645 16 $123,536 113 $132,320 2 $99,480 2 $100,970 FILES CLOSED FOR INCOMPLETENESS 1 $69,480 7 $99,720 34 $126,449 1 $37,390 0 $0
Aggregated Statistics For Year 2002(Based on 2 partial tracts) A) FHA, FSA/RHS & VA B) Conventional C) Refinancings D) Home Improvement Loans F) Non-occupant Loans on Number Average Value Number Average Value Number Average Value Number Average Value Number Average Value
LOANS ORIGINATED 10 $122,596 37 $110,686 98 $114,605 6 $24,928 5 $99,216 APPLICATIONS APPROVED, NOT ACCEPTED 0 $0 5 $90,140 20 $108,730 2 $41,620 0 $0 APPLICATIONS DENIED 2 $85,540 6 $88,875 37 $106,878 3 $11,377 1 $44,990 APPLICATIONS WITHDRAWN 1 $96,830 3 $118,563 24 $125,663 0 $0 0 $0 FILES CLOSED FOR INCOMPLETENESS 0 $0 1 $120,300 8 $107,650 0 $0 0 $0
Aggregated Statistics For Year 2001(Based on 2 partial tracts) A) FHA, FSA/RHS & VA B) Conventional C) Refinancings D) Home Improvement Loans F) Non-occupant Loans on Number Average Value Number Average Value Number Average Value Number Average Value Number Average Value
LOANS ORIGINATED 22 $116,212 37 $103,195 87 $112,983 7 $21,833 5 $77,564 APPLICATIONS APPROVED, NOT ACCEPTED 1 $189,150 2 $89,210 23 $98,887 3 $19,443 0 $0 APPLICATIONS DENIED 2 $98,610 5 $89,236 44 $103,547 5 $11,730 0 $0 APPLICATIONS WITHDRAWN 1 $150,580 2 $134,090 27 $111,872 1 $55,160 0 $0 FILES CLOSED FOR INCOMPLETENESS 0 $0 1 $90,710 3 $122,753 0 $0 0 $0
Aggregated Statistics For Year 2000(Based on 2 partial tracts) A) FHA, FSA/RHS & VA B) Conventional C) Refinancings D) Home Improvement Loans F) Non-occupant Loans on Number Average Value Number Average Value Number Average Value Number Average Value Number Average Value
LOANS ORIGINATED 15 $111,848 33 $115,607 30 $87,743 8 $16,536 2 $69,895 APPLICATIONS APPROVED, NOT ACCEPTED 1 $129,800 3 $88,120 9 $81,791 2 $21,060 0 $0 APPLICATIONS DENIED 1 $161,200 6 $87,177 27 $84,833 9 $21,363 1 $56,910 APPLICATIONS WITHDRAWN 1 $77,330 2 $219,435 11 $78,212 0 $0 0 $0 FILES CLOSED FOR INCOMPLETENESS 0 $0 0 $0 5 $102,334 0 $0 0 $0
Aggregated Statistics For Year 1999(Based on 3 partial tracts) A) FHA, FSA/RHS & VA B) Conventional C) Refinancings D) Home Improvement Loans E) Loans on Dwellings For 5+ Families F) Non-occupant Loans on Number Average Value Number Average Value Number Average Value Number Average Value Number Average Value Number Average Value
LOANS ORIGINATED 59 $113,000 237 $151,888 197 $110,786 42 $20,380 1 $1,248,910 17 $81,674 APPLICATIONS APPROVED, NOT ACCEPTED 1 $141,950 20 $135,104 57 $105,246 13 $14,283 0 $0 1 $133,620 APPLICATIONS DENIED 5 $108,350 11 $114,123 80 $106,697 32 $15,862 0 $0 3 $129,757 APPLICATIONS WITHDRAWN 2 $102,875 18 $116,629 59 $106,416 6 $44,020 0 $0 2 $73,350 FILES CLOSED FOR INCOMPLETENESS 0 $0 3 $68,813 13 $97,911 1 $46,470 0 $0 0 $0
Detailed HMDA statistics for the following Tracts:
0305.01
, 0305.03 , 0305.04 , 0501.03
Private Mortgage Insurance Companies Aggregated Statistics For Year 2009(Based on 4 partial tracts) A) Conventional B) Refinancings Number Average Value Number Average Value
LOANS ORIGINATED 11 $183,999 18 $164,349 APPLICATIONS APPROVED, NOT ACCEPTED 5 $161,706 6 $145,568 APPLICATIONS DENIED 1 $449,690 3 $249,520 APPLICATIONS WITHDRAWN 0 $0 1 $178,040 FILES CLOSED FOR INCOMPLETENESS 0 $0 0 $0
Aggregated Statistics For Year 2008(Based on 4 partial tracts) A) Conventional B) Refinancings C) Non-occupant Loans on Number Average Value Number Average Value Number Average Value
LOANS ORIGINATED 29 $167,089 19 $195,219 1 $56,360 APPLICATIONS APPROVED, NOT ACCEPTED 6 $161,110 11 $186,752 1 $93,790 APPLICATIONS DENIED 3 $114,767 3 $214,050 2 $152,700 APPLICATIONS WITHDRAWN 1 $296,980 2 $201,145 0 $0 FILES CLOSED FOR INCOMPLETENESS 0 $0 1 $155,630 0 $0
Aggregated Statistics For Year 2007(Based on 4 partial tracts) A) Conventional B) Refinancings C) Non-occupant Loans on Number Average Value Number Average Value Number Average Value
LOANS ORIGINATED 48 $157,548 21 $173,741 5 $119,394 APPLICATIONS APPROVED, NOT ACCEPTED 4 $197,238 3 $213,063 0 $0 APPLICATIONS DENIED 0 $0 0 $0 0 $0 APPLICATIONS WITHDRAWN 1 $150,340 4 $139,198 0 $0 FILES CLOSED FOR INCOMPLETENESS 0 $0 0 $0 0 $0
Aggregated Statistics For Year 2006(Based on 4 partial tracts) A) Conventional B) Refinancings C) Non-occupant Loans on Number Average Value Number Average Value Number Average Value
LOANS ORIGINATED 31 $179,936 8 $156,884 1 $91,960 APPLICATIONS APPROVED, NOT ACCEPTED 5 $266,340 5 $159,828 0 $0 APPLICATIONS DENIED 0 $0 0 $0 0 $0 APPLICATIONS WITHDRAWN 2 $217,185 2 $131,740 0 $0 FILES CLOSED FOR INCOMPLETENESS 0 $0 0 $0 0 $0
Aggregated Statistics For Year 2005(Based on 4 partial tracts) A) Conventional B) Refinancings C) Non-occupant Loans on Number Average Value Number Average Value Number Average Value
LOANS ORIGINATED 27 $168,061 17 $171,985 1 $84,820 APPLICATIONS APPROVED, NOT ACCEPTED 6 $223,090 9 $146,753 2 $118,320 APPLICATIONS DENIED 0 $0 0 $0 0 $0 APPLICATIONS WITHDRAWN 2 $178,285 2 $142,920 0 $0 FILES CLOSED FOR INCOMPLETENESS 0 $0 0 $0 0 $0
Aggregated Statistics For Year 2004(Based on 4 partial tracts) A) Conventional B) Refinancings C) Non-occupant Loans on Number Average Value Number Average Value Number Average Value
LOANS ORIGINATED 42 $170,331 23 $143,228 7 $133,817 APPLICATIONS APPROVED, NOT ACCEPTED 8 $191,875 15 $126,995 2 $109,760 APPLICATIONS DENIED 0 $0 0 $0 0 $0 APPLICATIONS WITHDRAWN 2 $235,100 4 $110,080 0 $0 FILES CLOSED FOR INCOMPLETENESS 1 $41,660 1 $194,270 0 $0
Aggregated Statistics For Year 2003(Based on 4 partial tracts) A) Conventional B) Refinancings C) Non-occupant Loans on Number Average Value Number Average Value Number Average Value
LOANS ORIGINATED 46 $162,191 85 $151,297 4 $120,135 APPLICATIONS APPROVED, NOT ACCEPTED 10 $178,522 29 $156,231 2 $143,340 APPLICATIONS DENIED 1 $332,150 1 $120,390 0 $0 APPLICATIONS WITHDRAWN 3 $176,913 7 $139,133 0 $0 FILES CLOSED FOR INCOMPLETENESS 0 $0 0 $0 0 $0
Aggregated Statistics For Year 2002(Based on 2 partial tracts) A) Conventional B) Refinancings C) Non-occupant Loans on Number Average Value Number Average Value Number Average Value
LOANS ORIGINATED 15 $152,269 19 $126,242 2 $86,675 APPLICATIONS APPROVED, NOT ACCEPTED 2 $222,300 6 $118,367 0 $0 APPLICATIONS DENIED 0 $0 1 $162,570 0 $0 APPLICATIONS WITHDRAWN 2 $174,335 2 $116,310 0 $0 FILES CLOSED FOR INCOMPLETENESS 1 $160,130 0 $0 0 $0
Aggregated Statistics For Year 2001(Based on 2 partial tracts) A) Conventional B) Refinancings C) Non-occupant Loans on Number Average Value Number Average Value Number Average Value
LOANS ORIGINATED 17 $142,077 19 $131,098 1 $90,560 APPLICATIONS APPROVED, NOT ACCEPTED 2 $158,440 4 $122,355 0 $0 APPLICATIONS DENIED 1 $159,350 1 $74,750 0 $0 APPLICATIONS WITHDRAWN 0 $0 2 $86,725 0 $0 FILES CLOSED FOR INCOMPLETENESS 1 $111,100 0 $0 0 $0
Aggregated Statistics For Year 2000(Based on 2 partial tracts) A) Conventional B) Refinancings Number Average Value Number Average Value
LOANS ORIGINATED 13 $137,488 4 $132,885 APPLICATIONS APPROVED, NOT ACCEPTED 1 $194,340 1 $75,610 APPLICATIONS DENIED 0 $0 0 $0 APPLICATIONS WITHDRAWN 0 $0 0 $0 FILES CLOSED FOR INCOMPLETENESS 0 $0 0 $0
Aggregated Statistics For Year 1999(Based on 3 partial tracts) A) Conventional B) Refinancings C) Non-occupant Loans on Number Average Value Number Average Value Number Average Value
LOANS ORIGINATED 61 $150,281 31 $129,490 1 $101,330 APPLICATIONS APPROVED, NOT ACCEPTED 5 $144,172 7 $101,079 0 $0 APPLICATIONS DENIED 2 $196,005 1 $87,620 0 $0 APPLICATIONS WITHDRAWN 1 $137,020 1 $77,660 0 $0 FILES CLOSED FOR INCOMPLETENESS 1 $119,000 0 $0 0 $0
Detailed PMIC statistics for the following Tracts:
0305.01
, 0305.03 , 0305.04 , 0501.03 Springboro compared to Ohio state average:
Median household income above state average. Median house value above state average. Unemployed percentage significantly below state average. Black race population percentage significantly below state average. Median age below state average. Renting percentage significantly below state average. Length of stay since moving in above state average. Number of rooms per house above state average. House age significantly below state average. Percentage of population with a bachelor's degree or higher significantly above state average. Springboro on our top lists :
#72 on the list of "Top 101 cities with the lowest number of robberies per 100,000 residents (population 5,000+)"
#30 on the list of "Top 101 counties with the largest decrease in the number of births per 1000 residents 2000-2006 to 2007-2013 (pop 50,000+)"
#71 on the list of "Top 101 counties with the lowest surface withdrawal of fresh water for public supply (pop. 50,000+)"
Top Patent Applicants
Kevin L. Houser (145)
Aruna Zhamu (54)
Stephen J. Balek (25)
Michael J. Vandemark (17)
Charles S. Holland (16)
Joseph D. Roth (16)
George E. Kochanowski (15)
Mark Willard Marusko (14)
Matthew B. Maier (13)
Jin-Wang Lai (13)
Total of 666 patent applications in 2008-2024.
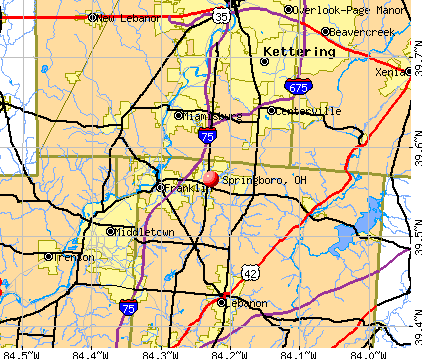


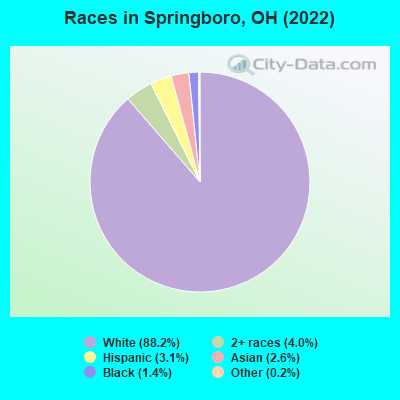
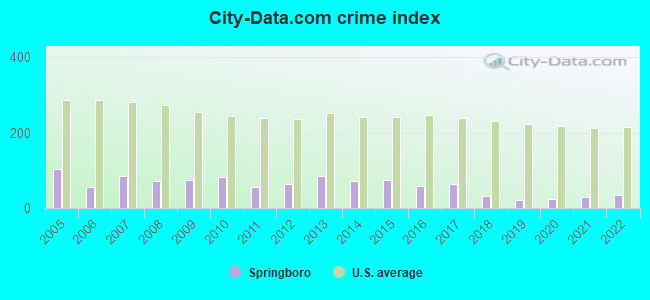
 Recent articles from our blog. Our writers, many of them Ph.D. graduates or candidates, create easy-to-read articles on a wide variety of topics.

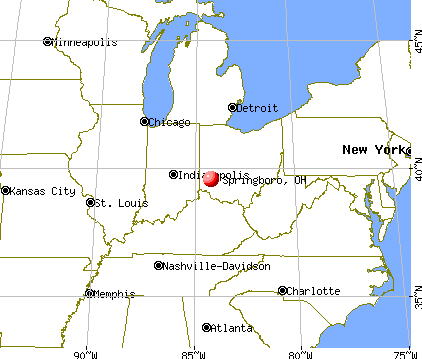
 (8.8 miles
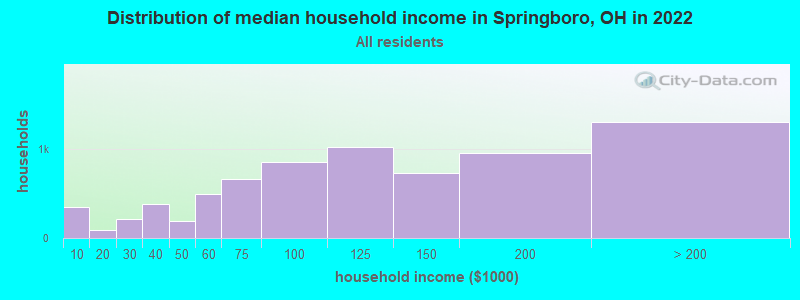
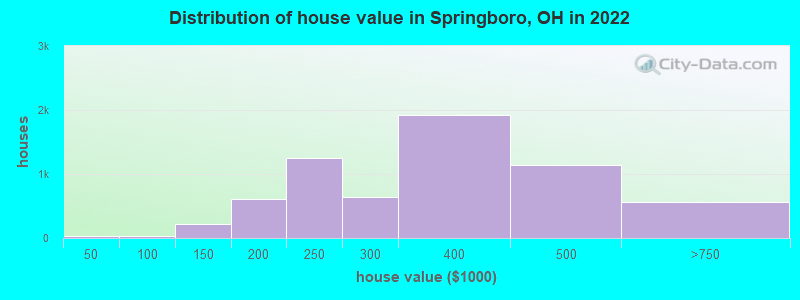

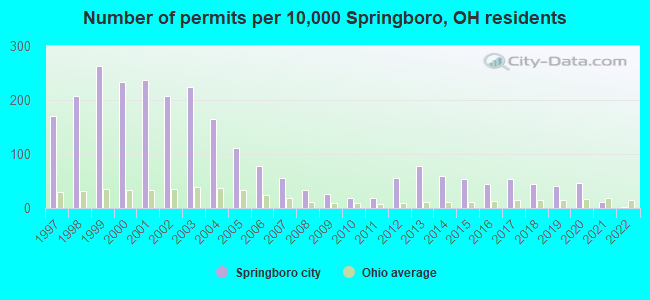
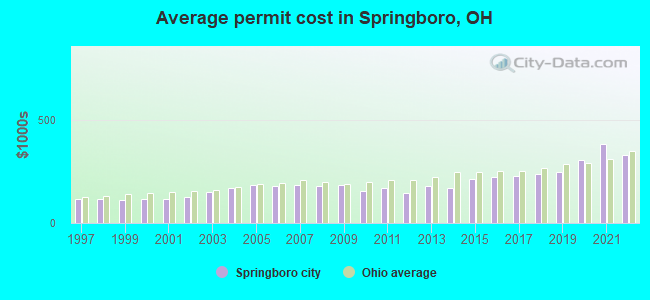
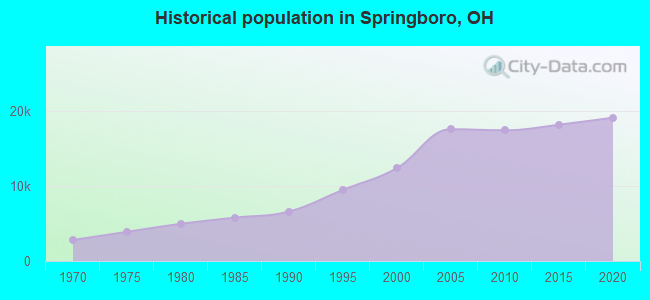
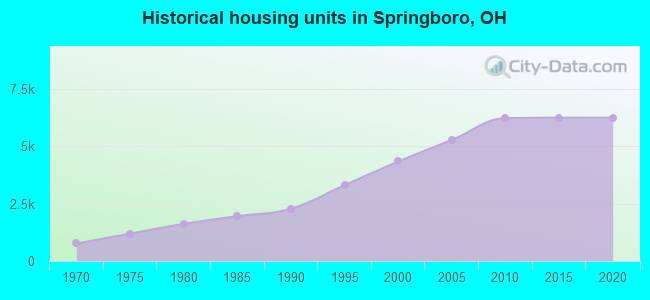
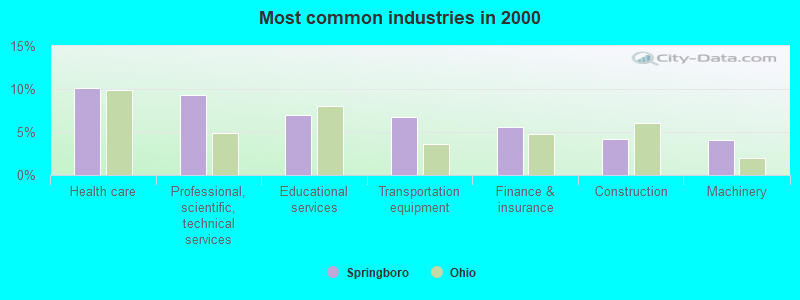
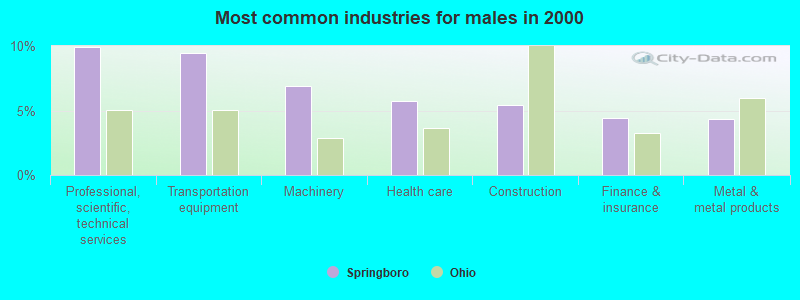
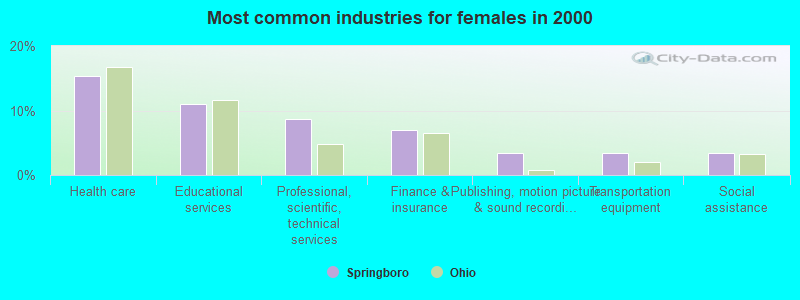
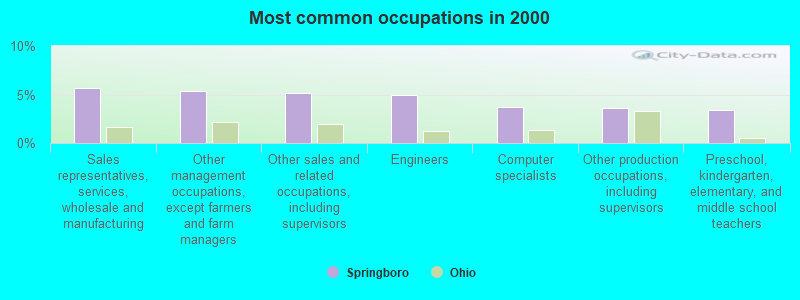
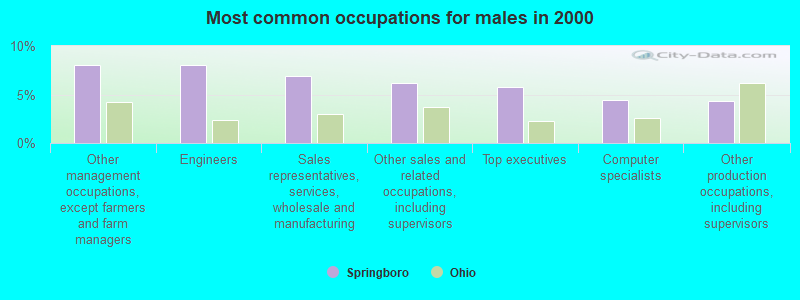
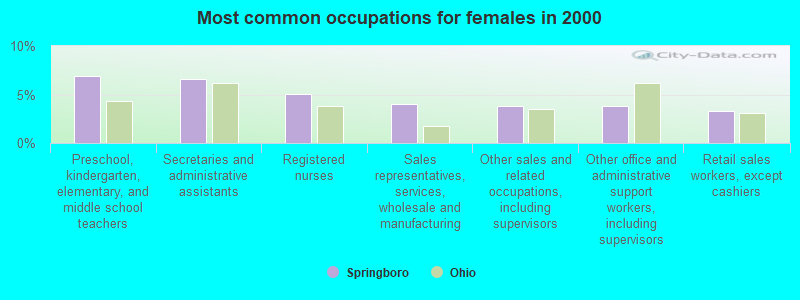


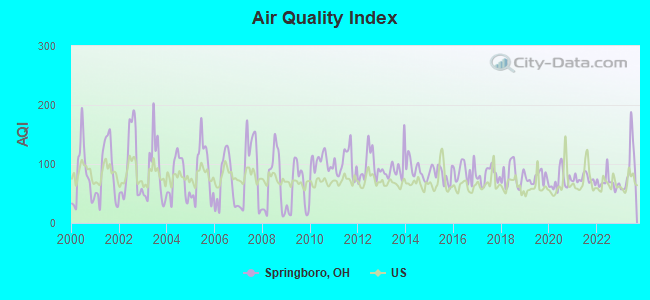
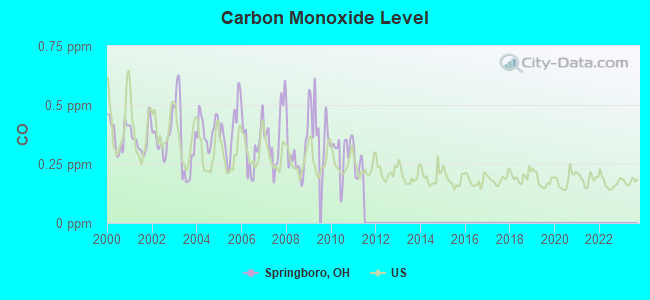
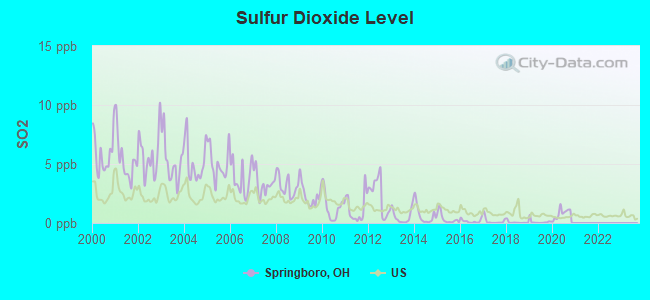
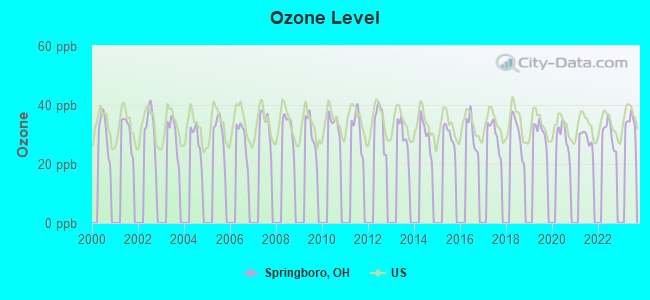
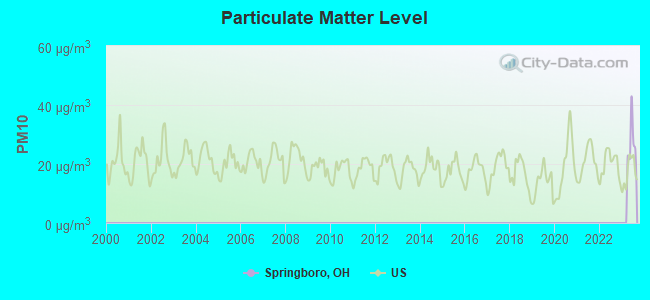
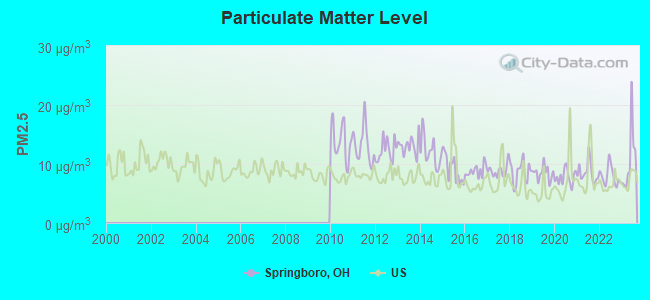

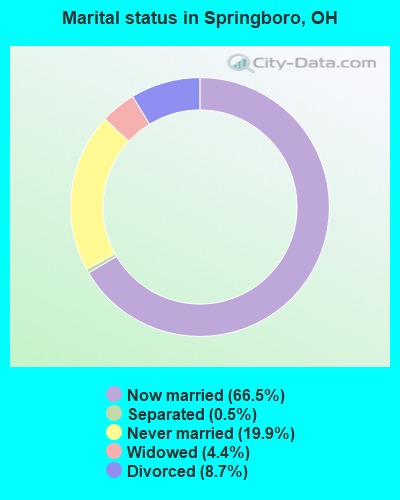
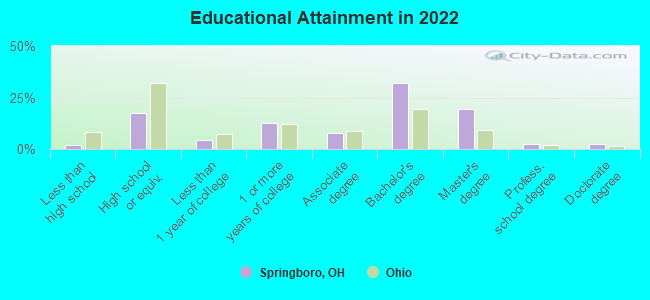
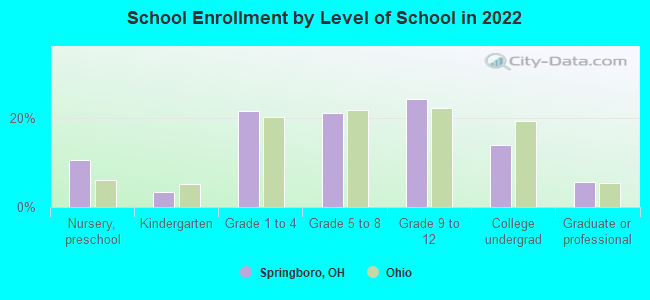
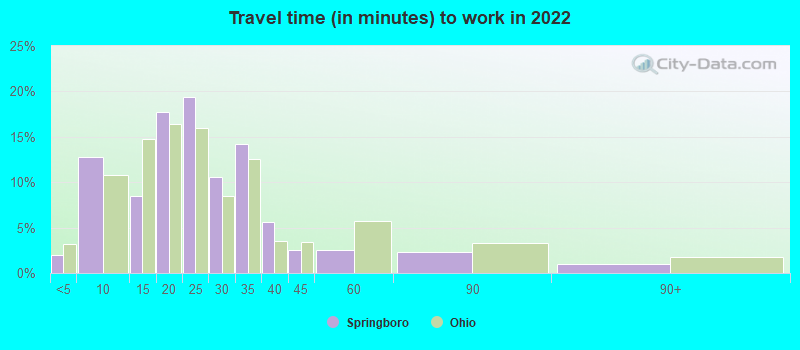
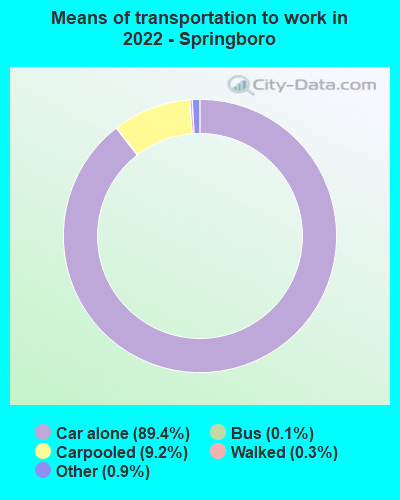
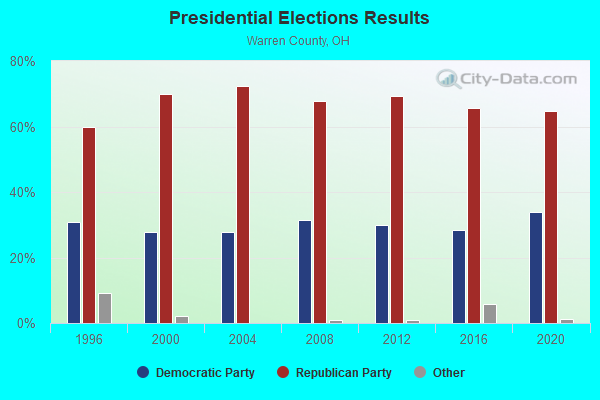
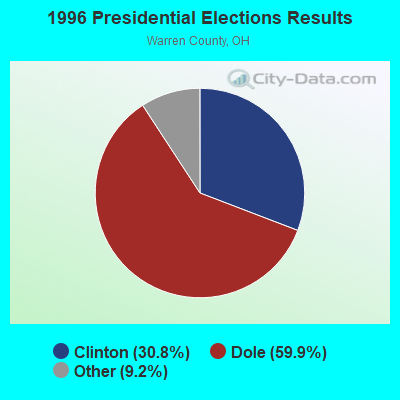

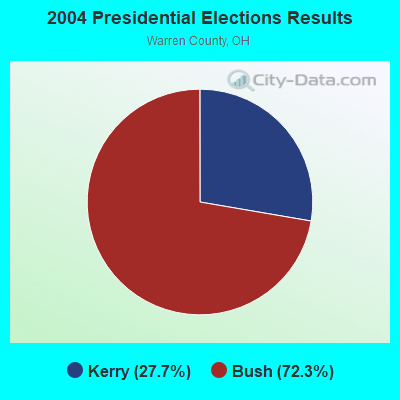
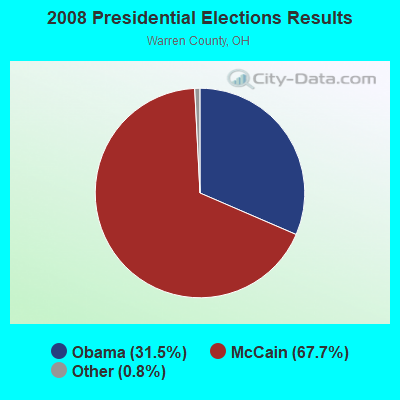
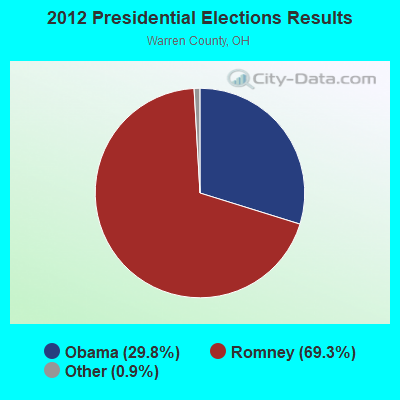
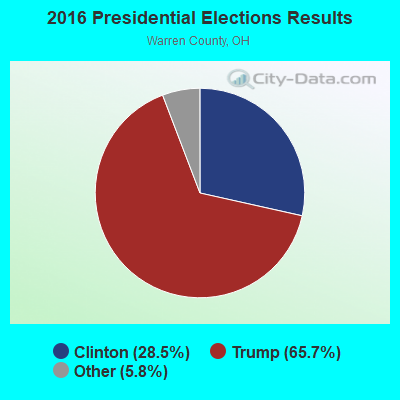

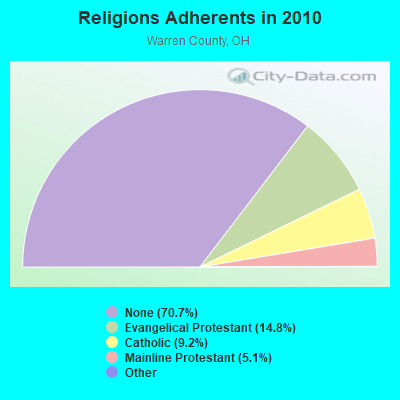
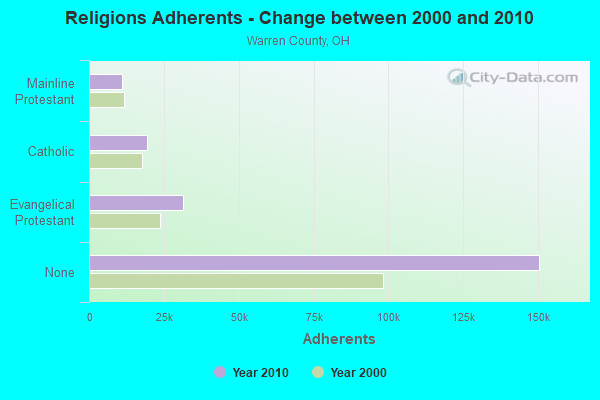
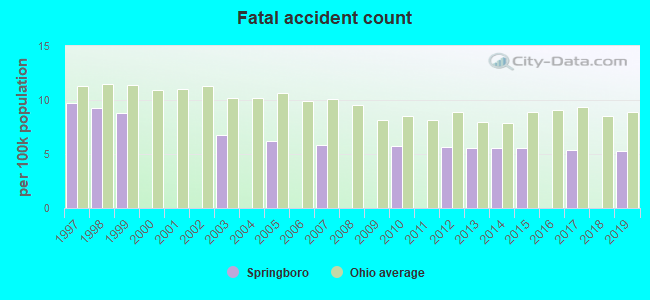
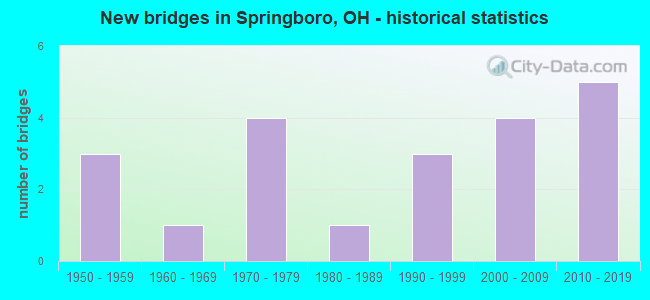
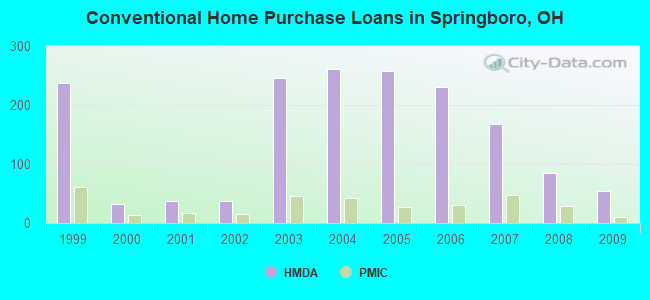
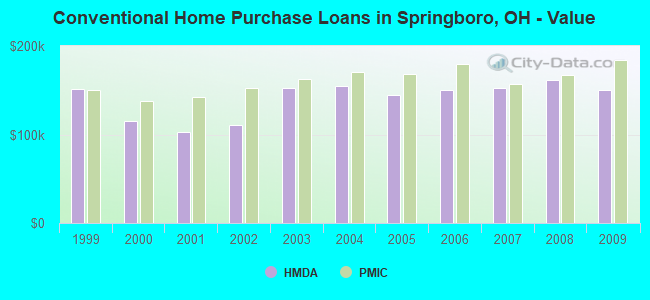
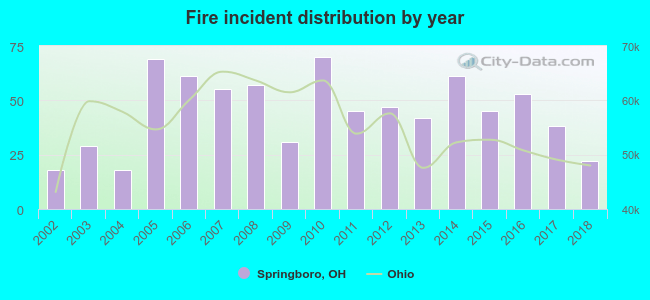 Based on the data from the years 2002 - 2018 the average number of fire incidents per year is 45. The highest number of reported fires - 70 took place in 2010, and the least - 18 in 2002. The data has a rising trend.
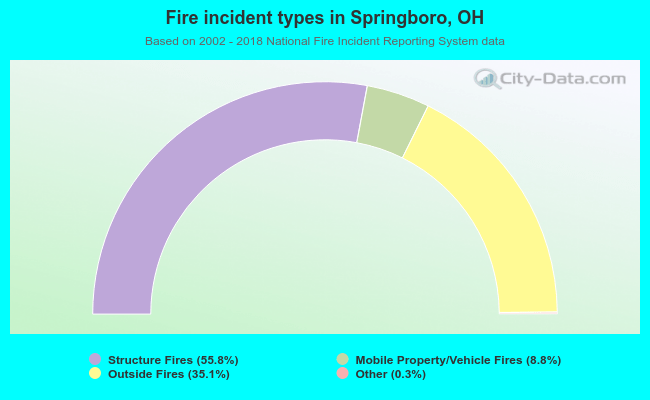 When looking into fire subcategories, the most incidents belonged to: Structure Fires (55.8%), and Outside Fires (35.1%).