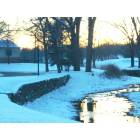
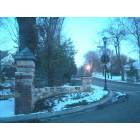
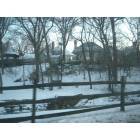
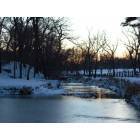
Mission Hills, Kansas Submit your own pictures of this city and show them to the world
OSM Map
General Map
Google Map
MSN Map
OSM Map
General Map
Google Map
MSN Map
OSM Map
General Map
Google Map
MSN Map
OSM Map
General Map
Google Map
MSN Map
Please wait while loading the map...
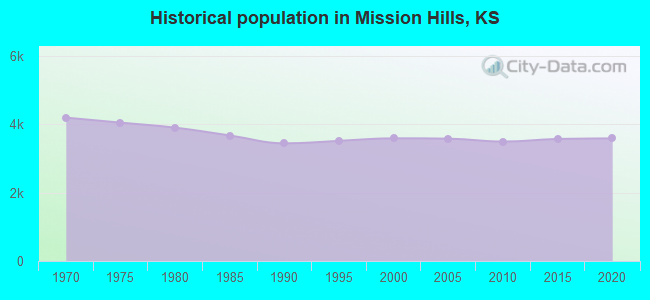
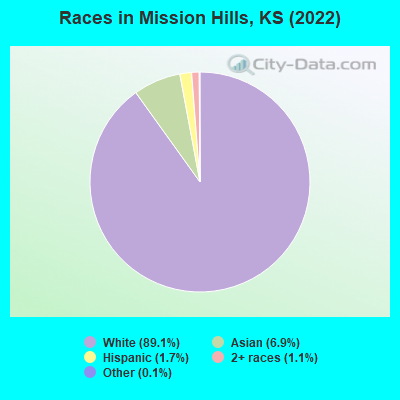
Population in 2022: 3,551 (100% urban, 0% rural). Population change since 2000: -1.2%Males: 1,752 Females: 1,799
March 2022 cost of living index in Mission Hills: 85.8 (less than average, U.S. average is 100) Percentage of residents living in poverty in 2022: 0.8%for White Non-Hispanic residents , 10.2% for Hispanic or Latino residents , 100.0% for other race residents , 15.1% for two or more races residents )Business Search - 14 Million verified businesses
Data:
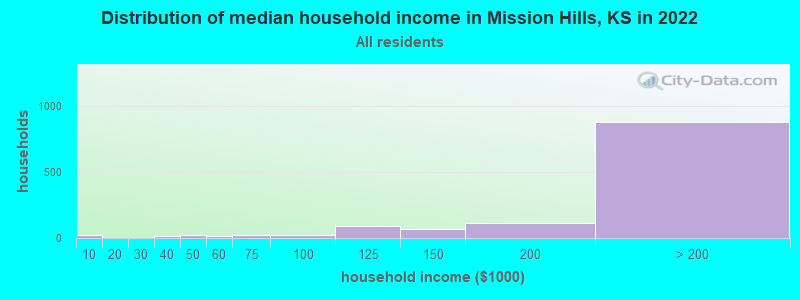
Median household income ($)
Median household income (% change since 2000)
Household income diversity
Ratio of average income to average house value (%)
Ratio of average income to average rent
Median household income ($) - White
Median household income ($) - Black or African American
Median household income ($) - Asian
Median household income ($) - Hispanic or Latino
Median household income ($) - American Indian and Alaska Native
Median household income ($) - Multirace
Median household income ($) - Other Race
Median household income for houses/condos with a mortgage ($)
Median household income for apartments without a mortgage ($)
Races - White alone (%)
Races - White alone (% change since 2000)
Races - Black alone (%)
Races - Black alone (% change since 2000)
Races - American Indian alone (%)
Races - American Indian alone (% change since 2000)
Races - Asian alone (%)
Races - Asian alone (% change since 2000)
Races - Hispanic (%)
Races - Hispanic (% change since 2000)
Races - Native Hawaiian and Other Pacific Islander alone (%)
Races - Native Hawaiian and Other Pacific Islander alone (% change since 2000)
Races - Two or more races (%)
Races - Two or more races (% change since 2000)
Races - Other race alone (%)
Races - Other race alone (% change since 2000)
Racial diversity
Unemployment (%)
Unemployment (% change since 2000)
Unemployment (%) - White
Unemployment (%) - Black or African American
Unemployment (%) - Asian
Unemployment (%) - Hispanic or Latino
Unemployment (%) - American Indian and Alaska Native
Unemployment (%) - Multirace
Unemployment (%) - Other Race
Population density (people per square mile)
Population - Males (%)
Population - Females (%)
Population - Males (%) - White
Population - Males (%) - Black or African American
Population - Males (%) - Asian
Population - Males (%) - Hispanic or Latino
Population - Males (%) - American Indian and Alaska Native
Population - Males (%) - Multirace
Population - Males (%) - Other Race
Population - Females (%) - White
Population - Females (%) - Black or African American
Population - Females (%) - Asian
Population - Females (%) - Hispanic or Latino
Population - Females (%) - American Indian and Alaska Native
Population - Females (%) - Multirace
Population - Females (%) - Other Race
Coronavirus confirmed cases (Apr 28, 2024)
Deaths caused by coronavirus (Apr 28, 2024)
Coronavirus confirmed cases (per 100k population) (Apr 28, 2024)
Deaths caused by coronavirus (per 100k population) (Apr 28, 2024)
Daily increase in number of cases (Apr 28, 2024)
Weekly increase in number of cases (Apr 28, 2024)
Cases doubled (in days) (Apr 28, 2024)
Hospitalized patients (Apr 18, 2022)
Negative test results (Apr 18, 2022)
Total test results (Apr 18, 2022)
COVID Vaccine doses distributed (per 100k population) (Sep 19, 2023)
COVID Vaccine doses administered (per 100k population) (Sep 19, 2023)
COVID Vaccine doses distributed (Sep 19, 2023)
COVID Vaccine doses administered (Sep 19, 2023)
Likely homosexual households (%)
Likely homosexual households (% change since 2000)
Likely homosexual households - Lesbian couples (%)
Likely homosexual households - Lesbian couples (% change since 2000)
Likely homosexual households - Gay men (%)
Likely homosexual households - Gay men (% change since 2000)
Cost of living index
Median gross rent ($)
Median contract rent ($)
Median monthly housing costs ($)
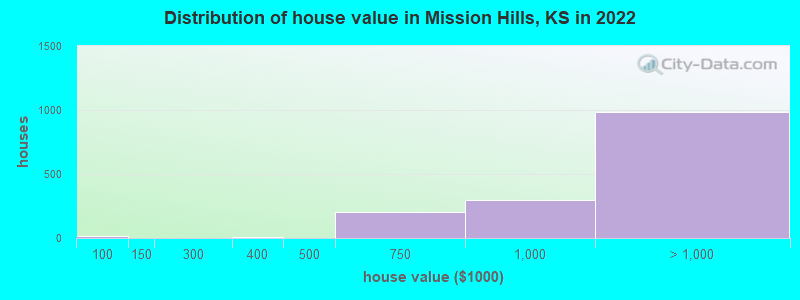
Median house or condo value ($)
Median house or condo value ($ change since 2000)
Mean house or condo value by units in structure - 1, detached ($)
Mean house or condo value by units in structure - 1, attached ($)
Mean house or condo value by units in structure - 2 ($)
Mean house or condo value by units in structure by units in structure - 3 or 4 ($)
Mean house or condo value by units in structure - 5 or more ($)
Mean house or condo value by units in structure - Boat, RV, van, etc. ($)
Mean house or condo value by units in structure - Mobile home ($)
Median house or condo value ($) - White
Median house or condo value ($) - Black or African American
Median house or condo value ($) - Asian
Median house or condo value ($) - Hispanic or Latino
Median house or condo value ($) - American Indian and Alaska Native
Median house or condo value ($) - Multirace
Median house or condo value ($) - Other Race
Median resident age
Resident age diversity
Median resident age - Males
Median resident age - Females
Median resident age - White
Median resident age - Black or African American
Median resident age - Asian
Median resident age - Hispanic or Latino
Median resident age - American Indian and Alaska Native
Median resident age - Multirace
Median resident age - Other Race
Median resident age - Males - White
Median resident age - Males - Black or African American
Median resident age - Males - Asian
Median resident age - Males - Hispanic or Latino
Median resident age - Males - American Indian and Alaska Native
Median resident age - Males - Multirace
Median resident age - Males - Other Race
Median resident age - Females - White
Median resident age - Females - Black or African American
Median resident age - Females - Asian
Median resident age - Females - Hispanic or Latino
Median resident age - Females - American Indian and Alaska Native
Median resident age - Females - Multirace
Median resident age - Females - Other Race
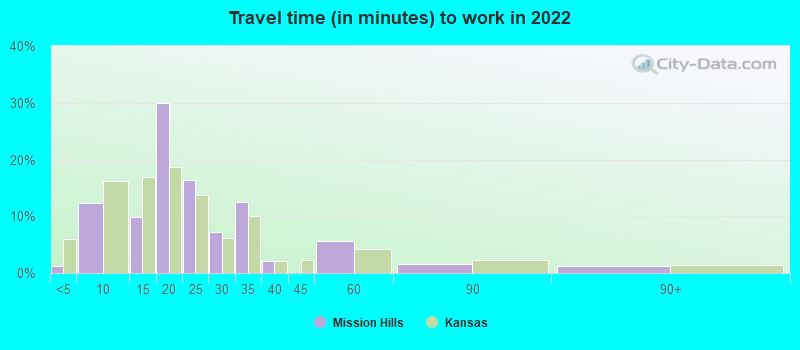
Commute - mean travel time to work (minutes)
Travel time to work - Less than 5 minutes (%)
Travel time to work - Less than 5 minutes (% change since 2000)
Travel time to work - 5 to 9 minutes (%)
Travel time to work - 5 to 9 minutes (% change since 2000)
Travel time to work - 10 to 19 minutes (%)
Travel time to work - 10 to 19 minutes (% change since 2000)
Travel time to work - 20 to 29 minutes (%)
Travel time to work - 20 to 29 minutes (% change since 2000)
Travel time to work - 30 to 39 minutes (%)
Travel time to work - 30 to 39 minutes (% change since 2000)
Travel time to work - 40 to 59 minutes (%)
Travel time to work - 40 to 59 minutes (% change since 2000)
Travel time to work - 60 to 89 minutes (%)
Travel time to work - 60 to 89 minutes (% change since 2000)
Travel time to work - 90 or more minutes (%)
Travel time to work - 90 or more minutes (% change since 2000)
Marital status - Never married (%)
Marital status - Now married (%)
Marital status - Separated (%)
Marital status - Widowed (%)
Marital status - Divorced (%)
Median family income ($)
Median family income (% change since 2000)
Median non-family income ($)
Median non-family income (% change since 2000)
Median per capita income ($)
Median per capita income (% change since 2000)
Median family income ($) - White
Median family income ($) - Black or African American
Median family income ($) - Asian
Median family income ($) - Hispanic or Latino
Median family income ($) - American Indian and Alaska Native
Median family income ($) - Multirace
Median family income ($) - Other Race
Median year house/condo built
Median year apartment built
Year house built - Built 2005 or later (%)
Year house built - Built 2000 to 2004 (%)
Year house built - Built 1990 to 1999 (%)
Year house built - Built 1980 to 1989 (%)
Year house built - Built 1970 to 1979 (%)
Year house built - Built 1960 to 1969 (%)
Year house built - Built 1950 to 1959 (%)
Year house built - Built 1940 to 1949 (%)
Year house built - Built 1939 or earlier (%)
Average household size
Household density (households per square mile)
Average household size - White
Average household size - Black or African American
Average household size - Asian
Average household size - Hispanic or Latino
Average household size - American Indian and Alaska Native
Average household size - Multirace
Average household size - Other Race
Occupied housing units (%)
Vacant housing units (%)
Owner occupied housing units (%)
Renter occupied housing units (%)
Vacancy status - For rent (%)
Vacancy status - For sale only (%)
Vacancy status - Rented or sold, not occupied (%)
Vacancy status - For seasonal, recreational, or occasional use (%)
Vacancy status - For migrant workers (%)
Vacancy status - Other vacant (%)
Residents with income below the poverty level (%)
Residents with income below 50% of the poverty level (%)
Children below poverty level (%)
Poor families by family type - Married-couple family (%)
Poor families by family type - Male, no wife present (%)
Poor families by family type - Female, no husband present (%)
Poverty status for native-born residents (%)
Poverty status for foreign-born residents (%)
Poverty among high school graduates not in families (%)
Poverty among people who did not graduate high school not in families (%)
Residents with income below the poverty level (%) - White
Residents with income below the poverty level (%) - Black or African American
Residents with income below the poverty level (%) - Asian
Residents with income below the poverty level (%) - Hispanic or Latino
Residents with income below the poverty level (%) - American Indian and Alaska Native
Residents with income below the poverty level (%) - Multirace
Residents with income below the poverty level (%) - Other Race
Air pollution - Air Quality Index (AQI)
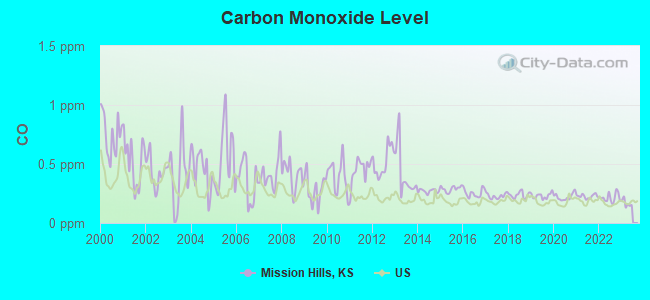
Air pollution - CO
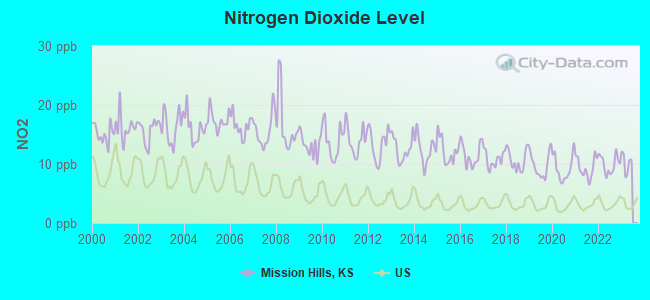
Air pollution - NO2
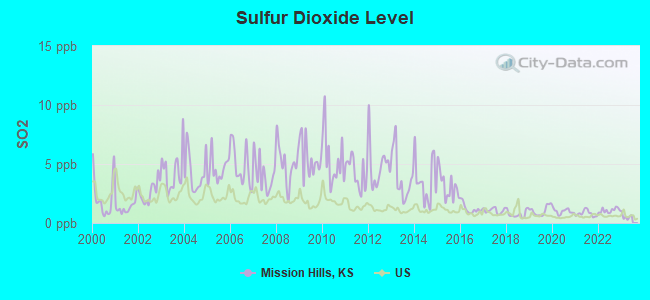
Air pollution - SO2
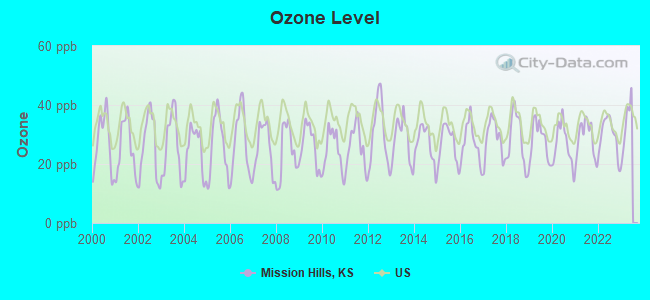
Air pollution - Ozone
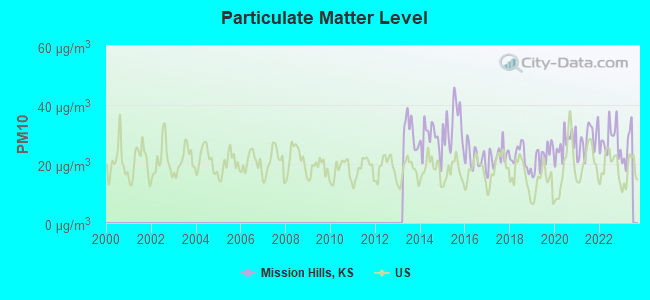
Air pollution - PM10
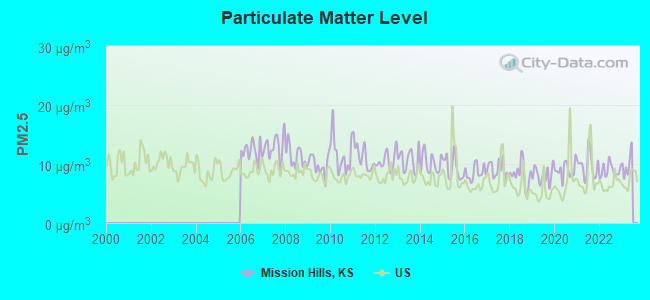
Air pollution - PM25
Air pollution - Pb
Crime - Murders per 100,000 population
Crime - Rapes per 100,000 population
Crime - Robberies per 100,000 population
Crime - Assaults per 100,000 population
Crime - Burglaries per 100,000 population
Crime - Thefts per 100,000 population
Crime - Auto thefts per 100,000 population
Crime - Arson per 100,000 population
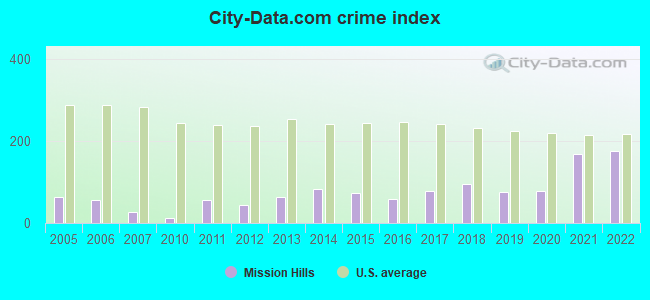
Crime - City-data.com crime index
Crime - Violent crime index
Crime - Property crime index
Crime - Murders per 100,000 population (5 year average)
Crime - Rapes per 100,000 population (5 year average)
Crime - Robberies per 100,000 population (5 year average)
Crime - Assaults per 100,000 population (5 year average)
Crime - Burglaries per 100,000 population (5 year average)
Crime - Thefts per 100,000 population (5 year average)
Crime - Auto thefts per 100,000 population (5 year average)
Crime - Arson per 100,000 population (5 year average)
Crime - City-data.com crime index (5 year average)
Crime - Violent crime index (5 year average)
Crime - Property crime index (5 year average)
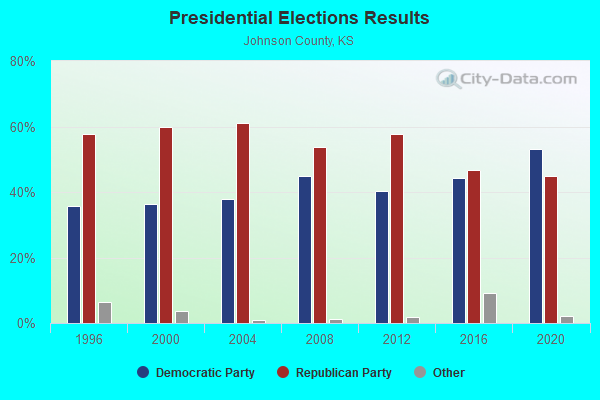
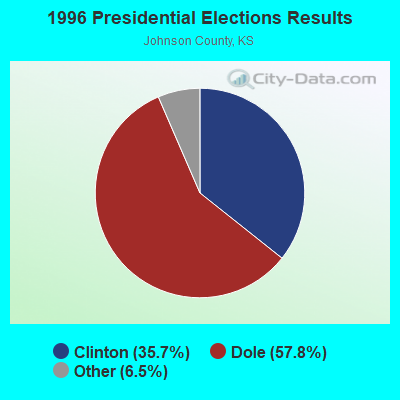
1996 Presidential Elections Results (%) - Democratic Party (Clinton)
1996 Presidential Elections Results (%) - Republican Party (Dole)
1996 Presidential Elections Results (%) - Other
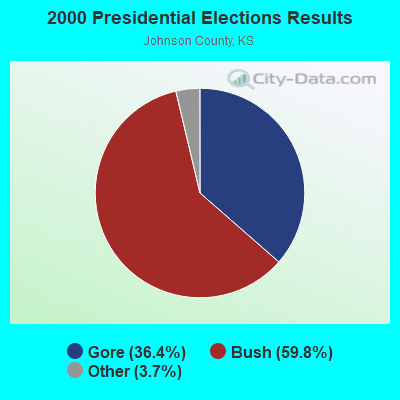
2000 Presidential Elections Results (%) - Democratic Party (Gore)
2000 Presidential Elections Results (%) - Republican Party (Bush)
2000 Presidential Elections Results (%) - Other
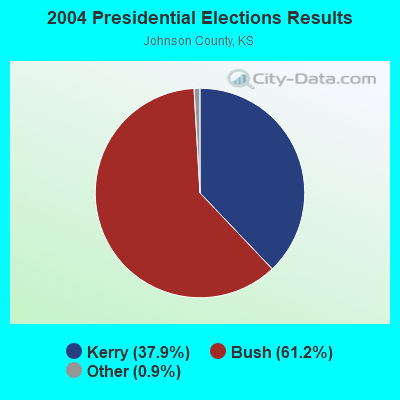
2004 Presidential Elections Results (%) - Democratic Party (Kerry)
2004 Presidential Elections Results (%) - Republican Party (Bush)
2004 Presidential Elections Results (%) - Other
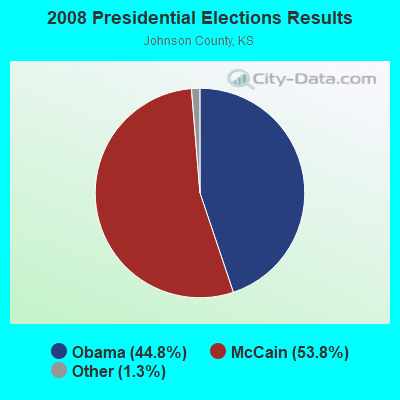
2008 Presidential Elections Results (%) - Democratic Party (Obama)
2008 Presidential Elections Results (%) - Republican Party (McCain)
2008 Presidential Elections Results (%) - Other
2012 Presidential Elections Results (%) - Democratic Party (Obama)
2012 Presidential Elections Results (%) - Republican Party (Romney)
2012 Presidential Elections Results (%) - Other
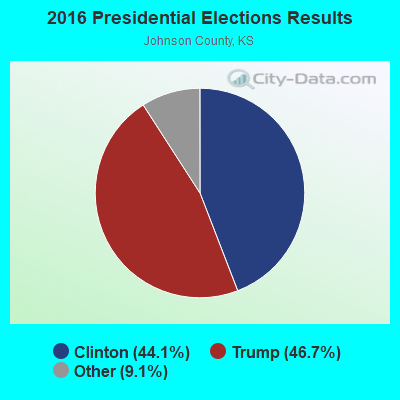
2016 Presidential Elections Results (%) - Democratic Party (Clinton)
2016 Presidential Elections Results (%) - Republican Party (Trump)
2016 Presidential Elections Results (%) - Other
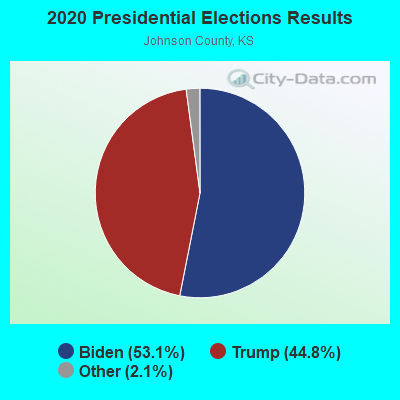
2020 Presidential Elections Results (%) - Democratic Party (Biden)
2020 Presidential Elections Results (%) - Republican Party (Trump)
2020 Presidential Elections Results (%) - Other
Ancestries Reported - Arab (%)
Ancestries Reported - Czech (%)
Ancestries Reported - Danish (%)
Ancestries Reported - Dutch (%)
Ancestries Reported - English (%)
Ancestries Reported - French (%)
Ancestries Reported - French Canadian (%)
Ancestries Reported - German (%)
Ancestries Reported - Greek (%)
Ancestries Reported - Hungarian (%)
Ancestries Reported - Irish (%)
Ancestries Reported - Italian (%)
Ancestries Reported - Lithuanian (%)
Ancestries Reported - Norwegian (%)
Ancestries Reported - Polish (%)
Ancestries Reported - Portuguese (%)
Ancestries Reported - Russian (%)
Ancestries Reported - Scotch-Irish (%)
Ancestries Reported - Scottish (%)
Ancestries Reported - Slovak (%)
Ancestries Reported - Subsaharan African (%)
Ancestries Reported - Swedish (%)
Ancestries Reported - Swiss (%)
Ancestries Reported - Ukrainian (%)
Ancestries Reported - United States (%)
Ancestries Reported - Welsh (%)
Ancestries Reported - West Indian (%)
Ancestries Reported - Other (%)
Educational Attainment - No schooling completed (%)
Educational Attainment - Less than high school (%)
Educational Attainment - High school or equivalent (%)
Educational Attainment - Less than 1 year of college (%)
Educational Attainment - 1 or more years of college (%)
Educational Attainment - Associate degree (%)
Educational Attainment - Bachelor's degree (%)
Educational Attainment - Master's degree (%)
Educational Attainment - Professional school degree (%)
Educational Attainment - Doctorate degree (%)
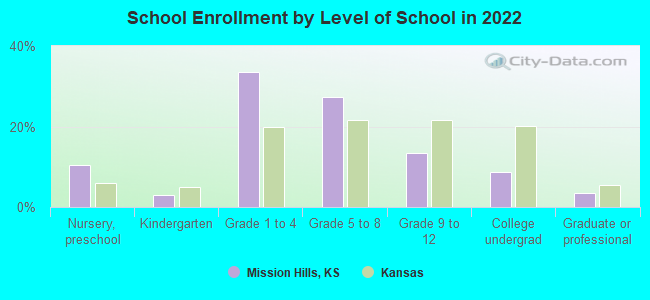
School Enrollment - Nursery, preschool (%)
School Enrollment - Kindergarten (%)
School Enrollment - Grade 1 to 4 (%)
School Enrollment - Grade 5 to 8 (%)
School Enrollment - Grade 9 to 12 (%)
School Enrollment - College undergrad (%)
School Enrollment - Graduate or professional (%)
School Enrollment - Not enrolled in school (%)
School enrollment - Public schools (%)
School enrollment - Private schools (%)
School enrollment - Not enrolled (%)
Median number of rooms in houses and condos
Median number of rooms in apartments
Housing units lacking complete plumbing facilities (%)
Housing units lacking complete kitchen facilities (%)
Density of houses
Urban houses (%)
Rural houses (%)
Households with people 60 years and over (%)
Households with people 65 years and over (%)
Households with people 75 years and over (%)
Households with one or more nonrelatives (%)
Households with no nonrelatives (%)
Population in households (%)
Family households (%)
Nonfamily households (%)
Population in families (%)
Family households with own children (%)
Median number of bedrooms in owner occupied houses
Mean number of bedrooms in owner occupied houses
Median number of bedrooms in renter occupied houses
Mean number of bedrooms in renter occupied houses
Median number of vehichles in owner occupied houses
Mean number of vehichles in owner occupied houses
Median number of vehichles in renter occupied houses
Mean number of vehichles in renter occupied houses
Mortgage status - with mortgage (%)
Mortgage status - with second mortgage (%)
Mortgage status - with home equity loan (%)
Mortgage status - with both second mortgage and home equity loan (%)
Mortgage status - without a mortgage (%)
Average family size
Average family size - White
Average family size - Black or African American
Average family size - Asian
Average family size - Hispanic or Latino
Average family size - American Indian and Alaska Native
Average family size - Multirace
Average family size - Other Race
Geographical mobility - Same house 1 year ago (%)
Geographical mobility - Moved within same county (%)
Geographical mobility - Moved from different county within same state (%)
Geographical mobility - Moved from different state (%)
Geographical mobility - Moved from abroad (%)
Place of birth - Born in state of residence (%)
Place of birth - Born in other state (%)
Place of birth - Native, outside of US (%)
Place of birth - Foreign born (%)
Housing units in structures - 1, detached (%)
Housing units in structures - 1, attached (%)
Housing units in structures - 2 (%)
Housing units in structures - 3 or 4 (%)
Housing units in structures - 5 to 9 (%)
Housing units in structures - 10 to 19 (%)
Housing units in structures - 20 to 49 (%)
Housing units in structures - 50 or more (%)
Housing units in structures - Mobile home (%)
Housing units in structures - Boat, RV, van, etc. (%)
House/condo owner moved in on average (years ago)
Renter moved in on average (years ago)
Year householder moved into unit - Moved in 1999 to March 2000 (%)
Year householder moved into unit - Moved in 1995 to 1998 (%)
Year householder moved into unit - Moved in 1990 to 1994 (%)
Year householder moved into unit - Moved in 1980 to 1989 (%)
Year householder moved into unit - Moved in 1970 to 1979 (%)
Year householder moved into unit - Moved in 1969 or earlier (%)
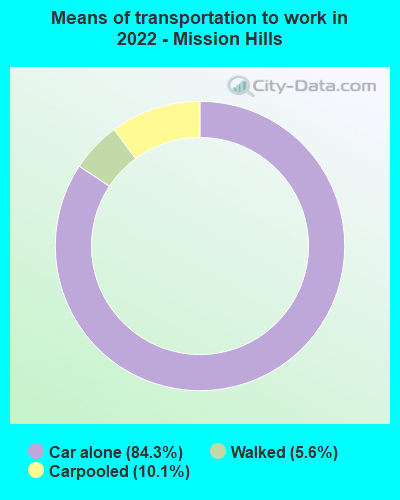
Means of transportation to work - Drove car alone (%)
Means of transportation to work - Carpooled (%)
Means of transportation to work - Public transportation (%)
Means of transportation to work - Bus or trolley bus (%)
Means of transportation to work - Streetcar or trolley car (%)
Means of transportation to work - Subway or elevated (%)
Means of transportation to work - Railroad (%)
Means of transportation to work - Ferryboat (%)
Means of transportation to work - Taxicab (%)
Means of transportation to work - Motorcycle (%)
Means of transportation to work - Bicycle (%)
Means of transportation to work - Walked (%)
Means of transportation to work - Other means (%)
Working at home (%)
Industry diversity
Most Common Industries - Agriculture, forestry, fishing and hunting, and mining (%)
Most Common Industries - Agriculture, forestry, fishing and hunting (%)
Most Common Industries - Mining, quarrying, and oil and gas extraction (%)
Most Common Industries - Construction (%)
Most Common Industries - Manufacturing (%)
Most Common Industries - Wholesale trade (%)
Most Common Industries - Retail trade (%)
Most Common Industries - Transportation and warehousing, and utilities (%)
Most Common Industries - Transportation and warehousing (%)
Most Common Industries - Utilities (%)
Most Common Industries - Information (%)
Most Common Industries - Finance and insurance, and real estate and rental and leasing (%)
Most Common Industries - Finance and insurance (%)
Most Common Industries - Real estate and rental and leasing (%)
Most Common Industries - Professional, scientific, and management, and administrative and waste management services (%)
Most Common Industries - Professional, scientific, and technical services (%)
Most Common Industries - Management of companies and enterprises (%)
Most Common Industries - Administrative and support and waste management services (%)
Most Common Industries - Educational services, and health care and social assistance (%)
Most Common Industries - Educational services (%)
Most Common Industries - Health care and social assistance (%)
Most Common Industries - Arts, entertainment, and recreation, and accommodation and food services (%)
Most Common Industries - Arts, entertainment, and recreation (%)
Most Common Industries - Accommodation and food services (%)
Most Common Industries - Other services, except public administration (%)
Most Common Industries - Public administration (%)
Occupation diversity
Most Common Occupations - Management, business, science, and arts occupations (%)
Most Common Occupations - Management, business, and financial occupations (%)
Most Common Occupations - Management occupations (%)
Most Common Occupations - Business and financial operations occupations (%)
Most Common Occupations - Computer, engineering, and science occupations (%)
Most Common Occupations - Computer and mathematical occupations (%)
Most Common Occupations - Architecture and engineering occupations (%)
Most Common Occupations - Life, physical, and social science occupations (%)
Most Common Occupations - Education, legal, community service, arts, and media occupations (%)
Most Common Occupations - Community and social service occupations (%)
Most Common Occupations - Legal occupations (%)
Most Common Occupations - Education, training, and library occupations (%)
Most Common Occupations - Arts, design, entertainment, sports, and media occupations (%)
Most Common Occupations - Healthcare practitioners and technical occupations (%)
Most Common Occupations - Health diagnosing and treating practitioners and other technical occupations (%)
Most Common Occupations - Health technologists and technicians (%)
Most Common Occupations - Service occupations (%)
Most Common Occupations - Healthcare support occupations (%)
Most Common Occupations - Protective service occupations (%)
Most Common Occupations - Fire fighting and prevention, and other protective service workers including supervisors (%)
Most Common Occupations - Law enforcement workers including supervisors (%)
Most Common Occupations - Food preparation and serving related occupations (%)
Most Common Occupations - Building and grounds cleaning and maintenance occupations (%)
Most Common Occupations - Personal care and service occupations (%)
Most Common Occupations - Sales and office occupations (%)
Most Common Occupations - Sales and related occupations (%)
Most Common Occupations - Office and administrative support occupations (%)
Most Common Occupations - Natural resources, construction, and maintenance occupations (%)
Most Common Occupations - Farming, fishing, and forestry occupations (%)
Most Common Occupations - Construction and extraction occupations (%)
Most Common Occupations - Installation, maintenance, and repair occupations (%)
Most Common Occupations - Production, transportation, and material moving occupations (%)
Most Common Occupations - Production occupations (%)
Most Common Occupations - Transportation occupations (%)
Most Common Occupations - Material moving occupations (%)
People in Group quarters - Institutionalized population (%)
People in Group quarters - Correctional institutions (%)
People in Group quarters - Federal prisons and detention centers (%)
People in Group quarters - Halfway houses (%)
People in Group quarters - Local jails and other confinement facilities (including police lockups) (%)
People in Group quarters - Military disciplinary barracks (%)
People in Group quarters - State prisons (%)
People in Group quarters - Other types of correctional institutions (%)
People in Group quarters - Nursing homes (%)
People in Group quarters - Hospitals/wards, hospices, and schools for the handicapped (%)
People in Group quarters - Hospitals/wards and hospices for chronically ill (%)
People in Group quarters - Hospices or homes for chronically ill (%)
People in Group quarters - Military hospitals or wards for chronically ill (%)
People in Group quarters - Other hospitals or wards for chronically ill (%)
People in Group quarters - Hospitals or wards for drug/alcohol abuse (%)
People in Group quarters - Mental (Psychiatric) hospitals or wards (%)
People in Group quarters - Schools, hospitals, or wards for the mentally retarded (%)
People in Group quarters - Schools, hospitals, or wards for the physically handicapped (%)
People in Group quarters - Institutions for the deaf (%)
People in Group quarters - Institutions for the blind (%)
People in Group quarters - Orthopedic wards and institutions for the physically handicapped (%)
People in Group quarters - Wards in general hospitals for patients who have no usual home elsewhere (%)
People in Group quarters - Wards in military hospitals for patients who have no usual home elsewhere (%)
People in Group quarters - Juvenile institutions (%)
People in Group quarters - Long-term care (%)
People in Group quarters - Homes for abused, dependent, and neglected children (%)
People in Group quarters - Residential treatment centers for emotionally disturbed children (%)
People in Group quarters - Training schools for juvenile delinquents (%)
People in Group quarters - Short-term care, detention or diagnostic centers for delinquent children (%)
People in Group quarters - Type of juvenile institution unknown (%)
People in Group quarters - Noninstitutionalized population (%)
People in Group quarters - College dormitories (includes college quarters off campus) (%)
People in Group quarters - Military quarters (%)
People in Group quarters - On base (%)
People in Group quarters - Barracks, unaccompanied personnel housing (UPH), (Enlisted/Officer), ;and similar group living quarters for military personnel (%)
People in Group quarters - Transient quarters for temporary residents (%)
People in Group quarters - Military ships (%)
People in Group quarters - Group homes (%)
People in Group quarters - Homes or halfway houses for drug/alcohol abuse (%)
People in Group quarters - Homes for the mentally ill (%)
People in Group quarters - Homes for the mentally retarded (%)
People in Group quarters - Homes for the physically handicapped (%)
People in Group quarters - Other group homes (%)
People in Group quarters - Religious group quarters (%)
People in Group quarters - Dormitories (%)
People in Group quarters - Agriculture workers' dormitories on farms (%)
People in Group quarters - Job Corps and vocational training facilities (%)
People in Group quarters - Other workers' dormitories (%)
People in Group quarters - Crews of maritime vessels (%)
People in Group quarters - Other nonhousehold living situations (%)
People in Group quarters - Other noninstitutional group quarters (%)
Residents speaking English at home (%)
Residents speaking English at home - Born in the United States (%)
Residents speaking English at home - Native, born elsewhere (%)
Residents speaking English at home - Foreign born (%)
Residents speaking Spanish at home (%)
Residents speaking Spanish at home - Born in the United States (%)
Residents speaking Spanish at home - Native, born elsewhere (%)
Residents speaking Spanish at home - Foreign born (%)
Residents speaking other language at home (%)
Residents speaking other language at home - Born in the United States (%)
Residents speaking other language at home - Native, born elsewhere (%)
Residents speaking other language at home - Foreign born (%)
Class of Workers - Employee of private company (%)
Class of Workers - Self-employed in own incorporated business (%)
Class of Workers - Private not-for-profit wage and salary workers (%)
Class of Workers - Local government workers (%)
Class of Workers - State government workers (%)
Class of Workers - Federal government workers (%)
Class of Workers - Self-employed workers in own not incorporated business and Unpaid family workers (%)
House heating fuel used in houses and condos - Utility gas (%)
House heating fuel used in houses and condos - Bottled, tank, or LP gas (%)
House heating fuel used in houses and condos - Electricity (%)
House heating fuel used in houses and condos - Fuel oil, kerosene, etc. (%)
House heating fuel used in houses and condos - Coal or coke (%)
House heating fuel used in houses and condos - Wood (%)
House heating fuel used in houses and condos - Solar energy (%)
House heating fuel used in houses and condos - Other fuel (%)
House heating fuel used in houses and condos - No fuel used (%)
House heating fuel used in apartments - Utility gas (%)
House heating fuel used in apartments - Bottled, tank, or LP gas (%)
House heating fuel used in apartments - Electricity (%)
House heating fuel used in apartments - Fuel oil, kerosene, etc. (%)
House heating fuel used in apartments - Coal or coke (%)
House heating fuel used in apartments - Wood (%)
House heating fuel used in apartments - Solar energy (%)
House heating fuel used in apartments - Other fuel (%)
House heating fuel used in apartments - No fuel used (%)
Armed forces status - In Armed Forces (%)
Armed forces status - Civilian (%)
Armed forces status - Civilian - Veteran (%)
Armed forces status - Civilian - Nonveteran (%)
Fatal accidents locations in years 2005-2021
Fatal accidents locations in 2005
Fatal accidents locations in 2006
Fatal accidents locations in 2007
Fatal accidents locations in 2008
Fatal accidents locations in 2009
Fatal accidents locations in 2010
Fatal accidents locations in 2011
Fatal accidents locations in 2012
Fatal accidents locations in 2013
Fatal accidents locations in 2014
Fatal accidents locations in 2015
Fatal accidents locations in 2016
Fatal accidents locations in 2017
Fatal accidents locations in 2018
Fatal accidents locations in 2019
Fatal accidents locations in 2020
Fatal accidents locations in 2021
Alcohol use - People drinking some alcohol every month (%)
Alcohol use - People not drinking at all (%)
Alcohol use - Average days/month drinking alcohol
Alcohol use - Average drinks/week
Alcohol use - Average days/year people drink much
Audiometry - Average condition of hearing (%)
Audiometry - People that can hear a whisper from across a quiet room (%)
Audiometry - People that can hear normal voice from across a quiet room (%)
Audiometry - Ears ringing, roaring, buzzing (%)
Audiometry - Had a job exposure to loud noise (%)
Audiometry - Had off-work exposure to loud noise (%)
Blood Pressure & Cholesterol - Has high blood pressure (%)
Blood Pressure & Cholesterol - Checking blood pressure at home (%)
Blood Pressure & Cholesterol - Frequently checking blood cholesterol (%)
Blood Pressure & Cholesterol - Has high cholesterol level (%)
Consumer Behavior - Money monthly spent on food at supermarket/grocery store
Consumer Behavior - Money monthly spent on food at other stores
Consumer Behavior - Money monthly spent on eating out
Consumer Behavior - Money monthly spent on carryout/delivered foods
Consumer Behavior - Income spent on food at supermarket/grocery store (%)
Consumer Behavior - Income spent on food at other stores (%)
Consumer Behavior - Income spent on eating out (%)
Consumer Behavior - Income spent on carryout/delivered foods (%)
Current Health Status - General health condition (%)
Current Health Status - Blood donors (%)
Current Health Status - Has blood ever tested for HIV virus (%)
Current Health Status - Left-handed people (%)
Dermatology - People using sunscreen (%)
Diabetes - Diabetics (%)
Diabetes - Had a blood test for high blood sugar (%)
Diabetes - People taking insulin (%)
Diet Behavior & Nutrition - Diet health (%)
Diet Behavior & Nutrition - Milk product consumption (# of products/month)
Diet Behavior & Nutrition - Meals not home prepared (#/week)
Diet Behavior & Nutrition - Meals from fast food or pizza place (#/week)
Diet Behavior & Nutrition - Ready-to-eat foods (#/month)
Diet Behavior & Nutrition - Frozen meals/pizza (#/month)
Drug Use - People that ever used marijuana or hashish (%)
Drug Use - Ever used hard drugs (%)
Drug Use - Ever used any form of cocaine (%)
Drug Use - Ever used heroin (%)
Drug Use - Ever used methamphetamine (%)
Health Insurance - People covered by health insurance (%)
Kidney Conditions-Urology - Avg. # of times urinating at night
Medical Conditions - People with asthma (%)
Medical Conditions - People with anemia (%)
Medical Conditions - People with psoriasis (%)
Medical Conditions - People with overweight (%)
Medical Conditions - Elderly people having difficulties in thinking or remembering (%)
Medical Conditions - People who ever received blood transfusion (%)
Medical Conditions - People having trouble seeing even with glass/contacts (%)
Medical Conditions - People with arthritis (%)
Medical Conditions - People with gout (%)
Medical Conditions - People with congestive heart failure (%)
Medical Conditions - People with coronary heart disease (%)
Medical Conditions - People with angina pectoris (%)
Medical Conditions - People who ever had heart attack (%)
Medical Conditions - People who ever had stroke (%)
Medical Conditions - People with emphysema (%)
Medical Conditions - People with thyroid problem (%)
Medical Conditions - People with chronic bronchitis (%)
Medical Conditions - People with any liver condition (%)
Medical Conditions - People who ever had cancer or malignancy (%)
Mental Health - People who have little interest in doing things (%)
Mental Health - People feeling down, depressed, or hopeless (%)
Mental Health - People who have trouble sleeping or sleeping too much (%)
Mental Health - People feeling tired or having little energy (%)
Mental Health - People with poor appetite or overeating (%)
Mental Health - People feeling bad about themself (%)
Mental Health - People who have trouble concentrating on things (%)
Mental Health - People moving or speaking slowly or too fast (%)
Mental Health - People having thoughts they would be better off dead (%)
Oral Health - Average years since last visit a dentist
Oral Health - People embarrassed because of mouth (%)
Oral Health - People with gum disease (%)
Oral Health - General health of teeth and gums (%)
Oral Health - Average days a week using dental floss/device
Oral Health - Average days a week using mouthwash for dental problem
Oral Health - Average number of teeth
Pesticide Use - Households using pesticides to control insects (%)
Pesticide Use - Households using pesticides to kill weeds (%)
Physical Activity - People doing vigorous-intensity work activities (%)
Physical Activity - People doing moderate-intensity work activities (%)
Physical Activity - People walking or bicycling (%)
Physical Activity - People doing vigorous-intensity recreational activities (%)
Physical Activity - People doing moderate-intensity recreational activities (%)
Physical Activity - Average hours a day doing sedentary activities
Physical Activity - Average hours a day watching TV or videos
Physical Activity - Average hours a day using computer
Physical Functioning - People having limitations keeping them from working (%)
Physical Functioning - People limited in amount of work they can do (%)
Physical Functioning - People that need special equipment to walk (%)
Physical Functioning - People experiencing confusion/memory problems (%)
Physical Functioning - People requiring special healthcare equipment (%)
Prescription Medications - Average number of prescription medicines taking
Preventive Aspirin Use - Adults 40+ taking low-dose aspirin (%)
Reproductive Health - Vaginal deliveries (%)
Reproductive Health - Cesarean deliveries (%)
Reproductive Health - Deliveries resulted in a live birth (%)
Reproductive Health - Pregnancies resulted in a delivery (%)
Reproductive Health - Women breastfeeding newborns (%)
Reproductive Health - Women that had a hysterectomy (%)
Reproductive Health - Women that had both ovaries removed (%)
Reproductive Health - Women that have ever taken birth control pills (%)
Reproductive Health - Women taking birth control pills (%)
Reproductive Health - Women that have ever used Depo-Provera or injectables (%)
Reproductive Health - Women that have ever used female hormones (%)
Sexual Behavior - People 18+ that ever had sex (vaginal, anal, or oral) (%)
Sexual Behavior - Males 18+ that ever had vaginal sex with a woman (%)
Sexual Behavior - Males 18+ that ever performed oral sex on a woman (%)
Sexual Behavior - Males 18+ that ever had anal sex with a woman (%)
Sexual Behavior - Males 18+ that ever had any sex with a man (%)
Sexual Behavior - Females 18+ that ever had vaginal sex with a man (%)
Sexual Behavior - Females 18+ that ever performed oral sex on a man (%)
Sexual Behavior - Females 18+ that ever had anal sex with a man (%)
Sexual Behavior - Females 18+ that ever had any kind of sex with a woman (%)
Sexual Behavior - Average age people first had sex
Sexual Behavior - Average number of female sex partners in lifetime (males 18+)
Sexual Behavior - Average number of female vaginal sex partners in lifetime (males 18+)
Sexual Behavior - Average age people first performed oral sex on a woman (18+)
Sexual Behavior - Average number of woman performed oral sex on in lifetime (18+)
Sexual Behavior - Average number of male sex partners in lifetime (males 18+)
Sexual Behavior - Average number of male anal sex partners in lifetime (males 18+)
Sexual Behavior - Average age people first performed oral sex on a man (18+)
Sexual Behavior - Average number of male oral sex partners in lifetime (18+)
Sexual Behavior - People using protection when performing oral sex (%)
Sexual Behavior - Average number of times people have vaginal or anal sex a year
Sexual Behavior - People having sex without condom (%)
Sexual Behavior - Average number of male sex partners in lifetime (females 18+)
Sexual Behavior - Average number of male vaginal sex partners in lifetime (females 18+)
Sexual Behavior - Average number of female sex partners in lifetime (females 18+)
Sexual Behavior - Circumcised males 18+ (%)
Sleep Disorders - Average hours sleeping at night
Sleep Disorders - People that has trouble sleeping (%)
Smoking-Cigarette Use - People smoking cigarettes (%)
Taste & Smell - People 40+ having problems with smell (%)
Taste & Smell - People 40+ having problems with taste (%)
Taste & Smell - People 40+ that ever had wisdom teeth removed (%)
Taste & Smell - People 40+ that ever had tonsils teeth removed (%)
Taste & Smell - People 40+ that ever had a loss of consciousness because of a head injury (%)
Taste & Smell - People 40+ that ever had a broken nose or other serious injury to face or skull (%)
Taste & Smell - People 40+ that ever had two or more sinus infections (%)
Weight - Average height (inches)
Weight - Average weight (pounds)
Weight - Average BMI
Weight - People that are obese (%)
Weight - People that ever were obese (%)
Weight - People trying to lose weight (%)
According to our research of Kansas and other state lists, there was 1 registered sex offender living in Mission Hills, Kansas as of April 28, 2024 . The ratio of all residents to sex offenders in Mission Hills is 3,657 to 1.The ratio of registered sex offenders to all residents in this city is much lower than the state average.
Officers per 1,000 residents here:
0.84Kansas average:
2.66
Latest news from Mission Hills, KS collected exclusively by city-data.com from local newspapers, TV, and radio stations
Ancestries: European (13.5%), English (11.0%), American (10.6%), German (10.2%), Irish (6.6%), Scottish (2.4%).
Current Local Time:
Land area: 2.02 square miles.
Population density: 1,762 people per square mile (low).
190 residents are foreign born (3.5% Asia , 1.4% Europe ).
This city:
5.3%Kansas:
7.1%
Median real estate property taxes paid for housing units with mortgages in 2022: $10,115 (0.9%)Median real estate property taxes paid for housing units with no mortgage in 2022: $10,003 (0.7%)
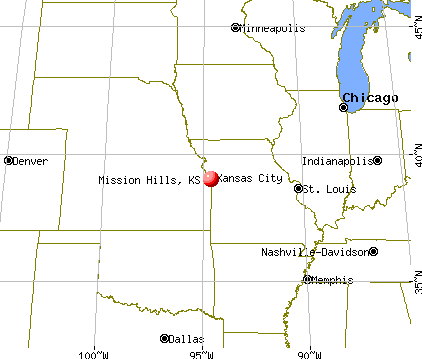
Nearest city with pop. 50,000+: Kansas City, MO
Nearest city with pop. 1,000,000+: Chicago, IL
Nearest cities:
Mission Woods, KS (1.2 miles),
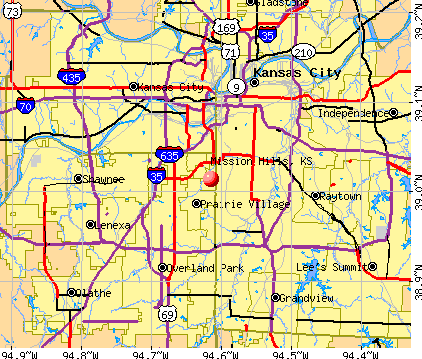
Latitude: 39.01 N, Longitude: 94.62 W
Property values in Mission Hills, KS
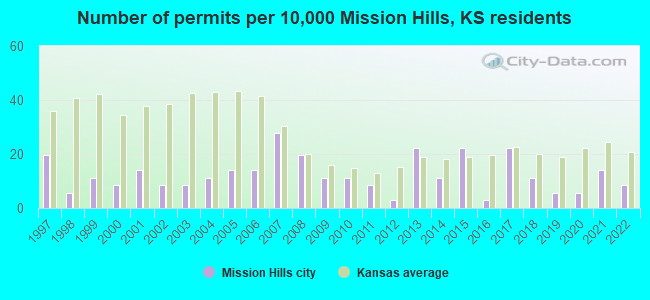
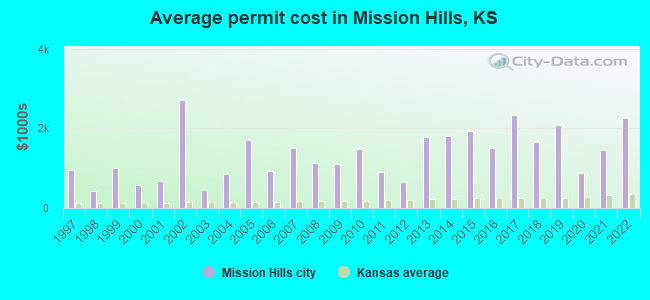
Single-family new house construction building permits:
2022: 3 buildings , average cost: $2,266,7002021: 5 buildings , average cost: $1,448,6002020: 2 buildings , average cost: $889,2002019: 2 buildings , average cost: $2,087,5002018: 4 buildings , average cost: $1,650,0002017: 8 buildings , average cost: $2,332,4002016: 1 building , cost: $1,500,0002015: 8 buildings , average cost: $1,926,9002014: 4 buildings , average cost: $1,800,0002013: 8 buildings , average cost: $1,781,3002012: 1 building , cost: $650,0002011: 3 buildings , average cost: $895,0002010: 4 buildings , average cost: $1,481,3002009: 4 buildings , average cost: $1,100,0002008: 7 buildings , average cost: $1,141,0002007: 10 buildings , average cost: $1,499,0002006: 5 buildings , average cost: $921,6002005: 5 buildings , average cost: $1,715,0002004: 4 buildings , average cost: $847,5002003: 3 buildings , average cost: $443,5002002: 3 buildings , average cost: $2,715,3002001: 5 buildings , average cost: $679,2002000: 3 buildings , average cost: $579,3001999: 4 buildings , average cost: $995,0001998: 2 buildings , average cost: $437,5001997: 7 buildings , average cost: $949,300Unemployment in December 2023:
Population change in the 1990s: +127 (+3.7%).
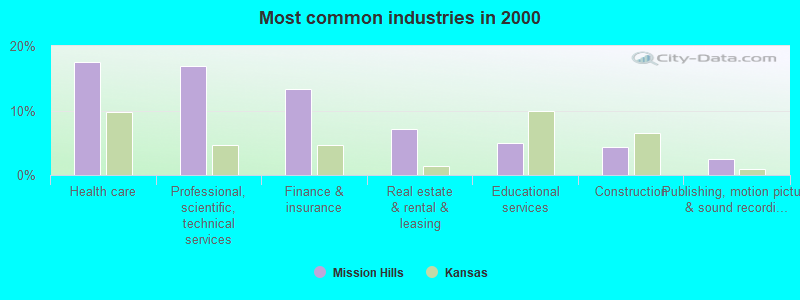
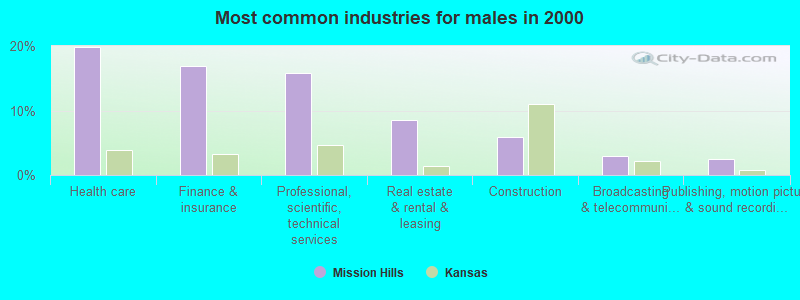
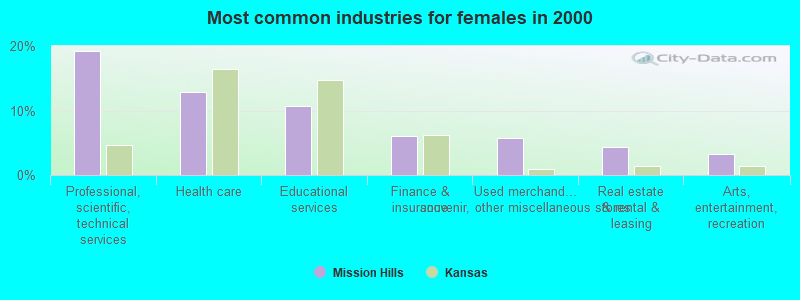
Most common industries in Mission Hills, KS (%)
Both Males Females
Health care (17.5%)
Professional, scientific, technical services (17.0%)
Finance & insurance (13.3%)
Real estate & rental & leasing (7.1%)
Educational services (4.9%)
Construction (4.3%)
Publishing, motion picture & sound recording industries (2.5%)
Health care (19.8%)
Finance & insurance (16.9%)
Professional, scientific, technical services (15.8%)
Real estate & rental & leasing (8.6%)
Construction (5.9%)
Broadcasting & telecommunications (2.9%)
Publishing, motion picture & sound recording industries (2.5%)
Professional, scientific, technical services (19.2%)
Health care (12.9%)
Educational services (10.8%)
Finance & insurance (6.1%)
Used merchandise, gift, novelty, souvenir, other miscellaneous stores (5.7%)
Real estate & rental & leasing (4.3%)
Arts, entertainment, recreation (3.3%)
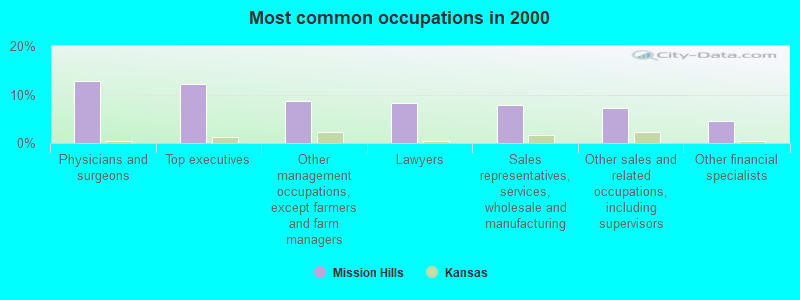
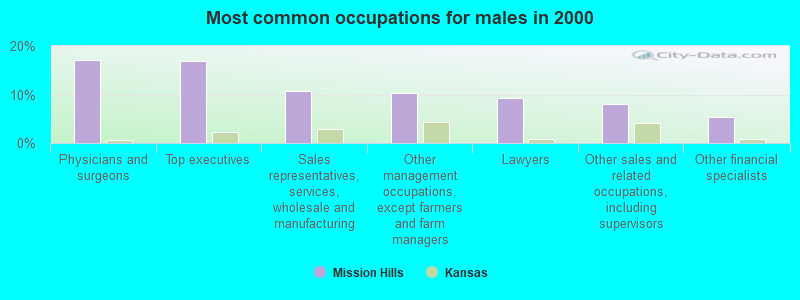
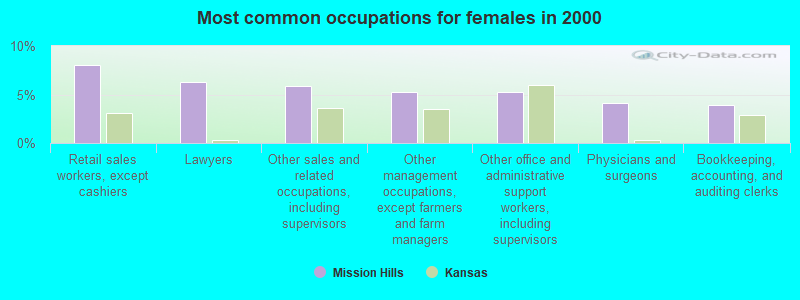
Most common occupations in Mission Hills, KS (%)
Both Males Females
Physicians and surgeons (12.7%)
Top executives (12.1%)
Other management occupations, except farmers and farm managers (8.6%)
Lawyers (8.3%)
Sales representatives, services, wholesale and manufacturing (7.8%)
Other sales and related occupations, including supervisors (7.3%)
Other financial specialists (4.6%)
Physicians and surgeons (17.1%)
Top executives (16.8%)
Sales representatives, services, wholesale and manufacturing (10.7%)
Other management occupations, except farmers and farm managers (10.4%)
Lawyers (9.3%)
Other sales and related occupations, including supervisors (8.0%)
Other financial specialists (5.3%)
Retail sales workers, except cashiers (8.0%)
Lawyers (6.3%)
Other sales and related occupations, including supervisors (5.9%)
Other management occupations, except farmers and farm managers (5.3%)
Other office and administrative support workers, including supervisors (5.3%)
Physicians and surgeons (4.1%)
Bookkeeping, accounting, and auditing clerks (3.9%)
Tornado activity:
Mission Hills-area historical tornado activity is near Kansas state average. It is 101% greater than the overall U.S. average.
On 5/20/1957, a category F5 (max. wind speeds 261-318 mph) tornado 11.8 miles away from the Mission Hills city center killed 44 people and injured 207 people and caused between $500,000 and $5,000,000 in damages.
On 5/22/1952, a category F4 (max. wind speeds 207-260 mph) tornado 6.9 miles away from the city center injured 3 people and caused between $50,000 and $500,000 in damages.
Earthquake activity:
Mission Hills-area historical earthquake activity is significantly above Kansas state average. It is 508% greater than the overall U.S. average. On 9/3/2016 at 12:02:44, a magnitude 5.8 (5.8 MW, Depth: 3.5 mi, Class: Moderate, Intensity: VI - VII) earthquake occurred 219.3 miles away from the city center On 11/6/2011 at 03:53:10, a magnitude 5.7 (5.7 MW, Depth: 3.2 mi) earthquake occurred 268.3 miles away from Mission Hills center On 11/12/2014 at 21:40:00, a magnitude 4.9 (4.9 MW, Depth: 2.5 mi, Class: Light, Intensity: IV - V) earthquake occurred 203.1 miles away from the city center On 11/7/2016 at 01:44:24, a magnitude 5.0 (5.0 MW, Depth: 2.8 mi) earthquake occurred 241.1 miles away from Mission Hills center On 2/13/2016 at 17:07:06, a magnitude 5.1 (5.1 MW, Depth: 5.2 mi) earthquake occurred 283.9 miles away from Mission Hills center On 1/19/2020 at 19:08:42, a magnitude 4.5 (4.5 MW, Depth: 3.1 mi) earthquake occurred 194.2 miles away from Mission Hills center Magnitude types: moment magnitude (MW) Natural disasters: The number of natural disasters in Johnson County (10) is smaller than the US average (15).Major Disasters (Presidential) Declared: 6Emergencies Declared: 2Floods: 6, Storms: 6, Tornadoes: 2, Hurricane: 1, Ice Storm: 1, Wind: 1, Winter Storm: 1, Other: 1 (Note: some incidents may be assigned to more than one category). Hospitals and medical centers near Mission Hills: BRIGHTON GARDENS OF PRAIRIE VILLAGE (Nursing Home, about 2 miles away; PRAIRIE VILLAGE, KS)
VISITING NURSE ASSOCIATION (Home Health Center, about 2 miles away; KANSAS CITY, MO)
RAI - RAINBOW BLVD - WESTWOOD (Dialysis Facility, about 2 miles away; WESTWOOD, KS)
BAPTIST LUTHERAN MEDICAL CENTER (Hospital, about 3 miles away; KANSAS CITY, MO)
HOME SITTER AGENCY, INC (Home Health Center, about 3 miles away; KANSAS CITY, MO)
KC'S HOME HEALTHCARE, INC (Home Health Center, about 3 miles away; KANSAS CITY, MO)
INTERIM HEALTHCARE OF KANSAS CITY (Home Health Center, about 3 miles away; LEAWOOD, KS)
Amtrak stations near Mission Hills: 6 miles: KANSAS CITY (2200 MAIN ST.) Services: ticket office, fully wheelchair accessible, enclosed waiting area, public restrooms, public payphones, snack bar, free short-term parking, paid long-term parking, call for car rental service, taxi stand, public transit connection.
12 miles: INDEPENDENCE (600 S. GRAND AVE.) Services: free short-term parking, call for taxi service.
15 miles: LEE'S SUMMIT (220 S. MAIN ST.) Services: enclosed waiting area, public payphones, free short-term parking, free long-term parking, call for taxi service.
Colleges/universities with over 2000 students nearest to Mission Hills:
University of Missouri-Kansas City (about 3 miles; Kansas City, MO ; Full-time enrollment: 10,544)
Rockhurst University (about 3 miles; Kansas City, MO ; FT enrollment: 2,013)
Metropolitan Community College-Kansas City (about 5 miles; Kansas City, MO ; FT enrollment: 12,834)
Wright Career College (about 7 miles; Overland Park, KS ; FT enrollment: 3,107)
Johnson County Community College (about 9 miles; Overland Park, KS ; FT enrollment: 11,976)
Kansas City Kansas Community College (about 11 miles; Kansas City, KS ; FT enrollment: 4,718)
Park University (about 13 miles; Parkville, MO ; FT enrollment: 9,131)
Private elementary/middle school in Mission Hills: COMMUNITY SCHOOL #1 Students: 19, Location: 6400 STATE LINE RD, Grades: KG-7)
Johnson County has a predicted average indoor radon screening level greater than 4 pCi/L (pico curies per liter) - Highest Potential Average household size: This city:
2.8 peopleKansas:
2.5 people
Percentage of family households: This city:
85.1%Whole state:
66.0%
Percentage of households with unmarried partners: This city:
1.9%Whole state:
5.8%
Likely homosexual households (counted as self-reported same-sex unmarried-partner households)
Lesbian couples: 0.4% of all households Gay men: 0.7% of all households
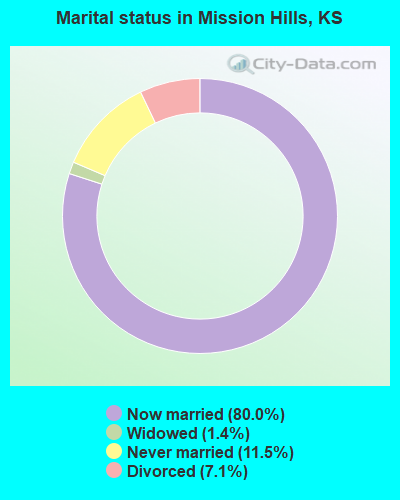
For population 15 years and over in Mission Hills:
Never married: 11.5%Now married: 80.0%Separated: 0.0%Widowed: 1.4%Divorced: 7.1% For population 25 years and over in Mission Hills:
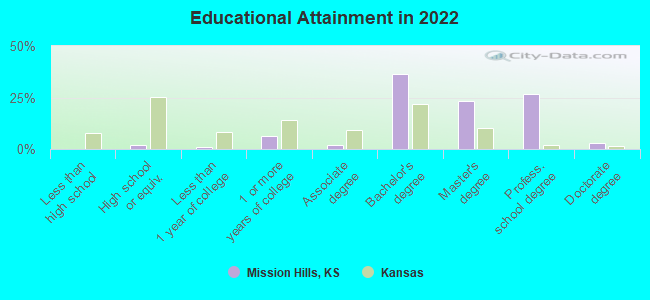
High school or higher: 99.8%Bachelor's degree or higher: 88.1%Graduate or professional degree: 50.8%Unemployed: 1.3%Mean travel time to work (commute): 17.0 minutes
Education Gini index (Inequality in education) Here:
6.9Kansas average:
11.5
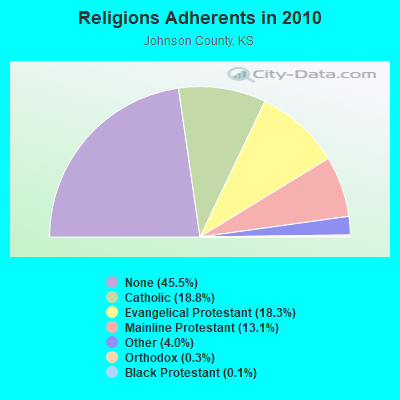
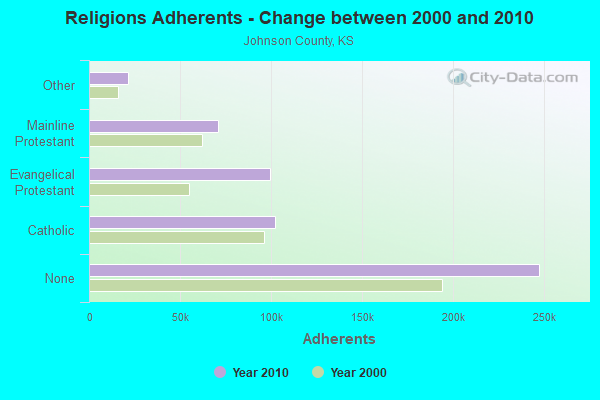
Religion statistics for Mission Hills, KS (based on Johnson County data)
Religion Adherents Congregations Catholic 102,131 18 Evangelical Protestant 99,699 190 Mainline Protestant 71,068 87 Other 21,644 46 Orthodox 1,505 5 Black Protestant 642 4 None 247,490 -
Source: Clifford Grammich, Kirk Hadaway, Richard Houseal, Dale E.Jones, Alexei Krindatch, Richie Stanley and Richard H.Taylor. 2012. 2010 U.S.Religion Census: Religious Congregations & Membership Study. Association of Statisticians of American Religious Bodies. Jones, Dale E., et al. 2002. Congregations and Membership in the United States 2000. Nashville, TN: Glenmary Research Center. Graphs represent county-level data
Food Environment Statistics: Number of grocery stores : 72Johnson County :
1.37 / 10,000 pop.Kansas :
1.96 / 10,000 pop.
Number of supercenters and club stores : 10Johnson County :
0.19 / 10,000 pop.Kansas :
0.20 / 10,000 pop.
Number of convenience stores (no gas) : 13Here :
0.25 / 10,000 pop.Kansas :
0.51 / 10,000 pop.
Number of convenience stores (with gas) : 120This county :
2.29 / 10,000 pop.State :
3.84 / 10,000 pop.
Number of full-service restaurants : 388Johnson County :
7.39 / 10,000 pop.Kansas :
7.33 / 10,000 pop.
Adult diabetes rate : Johnson County :
6.0%Kansas :
8.1%
Adult obesity rate : Johnson County :
23.0%Kansas :
27.9%
Low-income preschool obesity rate : Johnson County :
12.6%Kansas :
13.4%
Health and Nutrition:
Average overall health of teeth and gums : This city:
62.9%Kansas:
46.3%
People feeling badly about themselves : This city:
16.6%Kansas:
21.2%
People not drinking alcohol at all : This city:
6.3%Kansas:
10.5%
Average hours sleeping at night : Mission Hills:
7.1State:
6.8
Overweight people : This city:
35.6%Kansas:
33.5%
General health condition : Mission Hills:
66.2%Kansas:
56.0%
Average condition of hearing : This city:
80.4%Kansas:
78.6%
More about Health and Nutrition of Mission Hills, KS Residents
Local government employment and payroll (March 2022)
Function
Full-time employees
Monthly full-time payroll
Average yearly full-time wage
Part-time employees
Monthly part-time payroll
Other Government Administration
5 $46,200 $110,880 0 $0 Other and Unallocable
2 $12,280 $73,680 0 $0 Financial Administration
1 $6,188 $74,256 0 $0 Streets and Highways
1 $4,848 $58,176 0 $0 Parks and Recreation
1 $6,298 $75,576 0 $0 Judicial and Legal
0 $0 2 $2,048
Totals for Government
10 $75,814 $90,977 2 $2,048
Mission Hills government finances - Expenditure in 2018 (per resident):
Construction - Regular Highways: $1,520,000 ($428.05)
Current Operations - Central Staff Services: $1,140,000 ($321.04)
Parks and Recreation: $1,102,000 ($310.34)Sewerage: $471,000 ($132.64)Solid Waste Management: $378,000 ($106.45)Regular Highways: $366,000 ($103.07)Financial Administration: $71,000 ($19.99)Protective Inspection and Regulation - Other: $57,000 ($16.05)Judicial and Legal Services: $26,000 ($7.32)General - Interest on Debt: $133,000 ($37.45)
Intergovernmental to Local - Other - Police Protection: $1,350,000 ($380.17)
Other - Public Welfare - Other: $7,000 ($1.97)Intergovernmental to State - Police Protection: $12,000 ($3.38)
Other Capital Outlay - Central Staff Services: $30,000 ($8.45)
Total Salaries and Wages: $534,000 ($150.38)
Mission Hills government finances - Revenue in 2018 (per resident):
Charges - Other: $11,000 ($3.10)
Local Intergovernmental - General Local Government Support: $1,814,000 ($510.84)
Miscellaneous - Fines and Forfeits: $210,000 ($59.14)
Interest Earnings: $6,000 ($1.69)Special Assessments: $2,000 ($0.56)State Intergovernmental - Other: $125,000 ($35.20)
Highways: $96,000 ($27.03)Tax - Property: $4,237,000 ($1193.19)
General Sales and Gross Receipts: $817,000 ($230.08)Public Utilities Sales: $434,000 ($122.22)Other License: $417,000 ($117.43)Occupation and Business License - Other: $20,000 ($5.63)
Mission Hills government finances - Debt in 2018 (per resident):
Long Term Debt - Beginning Outstanding - Unspecified Public Purpose: $3,322,000 ($935.51)
Outstanding Unspecified Public Purpose: $2,855,000 ($804.00)Retired Unspecified Public Purpose: $467,000 ($131.51)
Mission Hills government finances - Cash and Securities in 2018 (per resident):
Other Funds - Cash and Securities: $5,019,000 ($1413.40)
7.16% of this county's 2021 resident taxpayers lived in other counties in 2020 ($81,232 average adjusted gross income )
Here:
7.16%Kansas average:
6.64%
0.01% of residents moved from foreign countries ($131 average AGI )Johnson County:
0.01%Kansas average:
0.04%
Top counties from which taxpayers relocated into this county between 2020 and 2021:
6.77% of this county's 2020 resident taxpayers moved to other counties in 2021 ($90,064 average adjusted gross income )
Here:
6.77%Kansas average:
6.88%
0.01% of residents moved to foreign countries ($58 average AGI )Johnson County:
0.01%Kansas average:
0.03%
Top counties to which taxpayers relocated from this county between 2020 and 2021: Strongest AM radio stations in Mission Hills:
KXTR (1660 AM; 10 kW; KANSAS CITY, KS; Owner: ENTERCOM KANSAS CITY LICENSE, LLC)
KMBZ (980 AM; 5 kW; KANSAS CITY, MO; Owner: ENTERCOM KANSAS CITY LICENSE, LLC)
KCSP (610 AM; 5 kW; KANSAS CITY, MO; Owner: ENTERCOM KANSAS CITY LICENSE, LLC)
KCCV (760 AM; daytime; 6 kW; OVERLAND PARK, KS; Owner: BOTT BROADCASTING COMPANY)
WHB (810 AM; 50 kW; KANSAS CITY, MO; Owner: UNION BROADCASTING, INC.)
KPHN (1190 AM; 5 kW; KANSAS CITY, MO; Owner: ABC, INC.)
KKHK (1250 AM; 25 kW; KANSAS CITY, KS)
KCTE (1510 AM; daytime; 10 kW; INDEPENDENCE, MO; Owner: UNION BROADCASTING, INC.)
KCNW (1380 AM; 2 kW; FAIRWAY, KS; Owner: KANSAS CITY RADIO, INC.)
KCMO (710 AM; 10 kW; KANSAS CITY, MO; Owner: SUSQUEHANNA KANSAS CITY PARTNERSHIP)
KPRT (1590 AM; 1 kW; KANSAS CITY, MO; Owner: CARTER BROADCAST GROUP, INC.)
KCZZ (1480 AM; 1 kW; MISSION, KS; Owner: HMEB COMMUNICATIONS, L.L.C.)
KCKN (1340 AM; 1 kW; KANSAS CITY, KS; Owner: CARTER BROADCAST GROUP, INC.)
Strongest FM radio stations in Mission Hills:
KZPL (97.3 FM; LEE'S SUMMIT, MO; Owner: UNION FIRST BROADCASTING, LLC)
KCMO-FM (94.9 FM; KANSAS CITY, MO; Owner: SUSQUEHANNA KANSAS CITY PARTNERSHIP)
KQRC-FM (98.9 FM; LEAVENWORTH, KS; Owner: ENTERCOM KANSAS CITY LICENSE, LLC)
KRBZ (96.5 FM; KANSAS CITY, MO; Owner: ENTERCOM KANSAS CITY LICENSE, LLC)
KYYS (99.7 FM; KANSAS CITY, MO; Owner: ENTERCOM KANSAS CITY LICENSE, LLC)
KMXV (93.3 FM; KANSAS CITY, MO; Owner: INFINITY RADIO OPERATIONS INC.)
KPRS (103.3 FM; KANSAS CITY, MO; Owner: CARTER BROADCAST GROUP, INC.)
WDAF-FM (106.5 FM; LIBERTY, MO; Owner: ENTERCOM KANSAS CITY LICENSE, LLC)
KUDL (98.1 FM; KANSAS CITY, KS; Owner: ENTERCOM KANSAS CITY LICENSE, LLC)
KFKF-FM (94.1 FM; KANSAS CITY, KS; Owner: INFINITY RADIO SUBSIDIARY OPERATIONS INC.)
KSRC (102.1 FM; KANSAS CITY, MO; Owner: INFINITY RADIO OPERATIONS INC.)
KBEQ-FM (104.3 FM; KANSAS CITY, MO; Owner: INFINITY RADIO SUBSIDIARY OPERATIONS INC.)
KCUR-FM (89.3 FM; KANSAS CITY, MO; Owner: CURATORS OF UNIVERSITY OF MISSOURI)
KLJC (88.5 FM; KANSAS CITY, MO; Owner: CALVARY BIBLE COLLEGE)
KKFI (90.1 FM; KANSAS CITY, MO; Owner: MID-COAST RADIO PROJECT, INC.)
KCFX (101.1 FM; HARRISONVILLE, MO; Owner: SUSQUEHANNA KANSAS CITY PARTNERSHIP)
KCCV-FM (92.3 FM; OLATHE, KS; Owner: BOTT BROADCASTING COMPANY)
KMJK (107.3 FM; LEXINGTON, MO; Owner: ALLUR-KANSAS CITY, INC.)
KANU (91.5 FM; LAWRENCE, KS; Owner: UNIVERSITY OF KANSAS)
TV broadcast stations around Mission Hills:
KCTV (Channel 5; KANSAS CITY, MO; Owner: MEREDITH CORPORATION)
KSHB-TV (Channel 41; KANSAS CITY, MO; Owner: SCRIPPS HOWARD BROADCASTING COMPANY)
WDAF-TV (Channel 4; KANSAS CITY, MO; Owner: WDAF LICENSE, INC.)
KMCI (Channel 38; LAWRENCE, KS; Owner: SCRIPPS HOWARD BROADCASTING COMPANY)
KPXE (Channel 50; KANSAS CITY, MO; Owner: PAXSON KANSAS CITY LICENSE, INC.)
KMBC-TV (Channel 9; KANSAS CITY, MO; Owner: KMBC HEARST-ARGYLE TELEVISION, INC.)
K35CT (Channel 35; KANSAS CITY, MO; Owner: WORD OF GOD FELLOWSHIP, INC.)
KCWE (Channel 29; KANSAS CITY, MO; Owner: KCWE-TV, INC.)
KCPT (Channel 19; KANSAS CITY, MO; Owner: PUBLIC TELEVISION 19, INC.)
KSMO-TV (Channel 62; KANSAS CITY, MO; Owner: KSMO LICENSEE, INC.)
K26CR (Channel 26; KANSAS CITY, MO; Owner: VENTANA TELEVISION, INC.)
K48FS (Channel 48; KANSAS CITY, MO; Owner: WORD OF GOD FELLOWSHIP, INC.)
KTAJ (Channel 16; ST. JOSEPH, MO; Owner: TRINITY BROADCASTING NETWORK)
K27FR (Channel 27; OVERLAND PARK, KS; Owner: UNIVERSITY OF KANSAS)
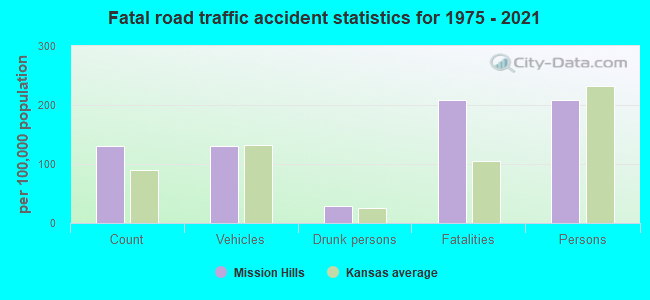
Mission Hills fatal accident statistics for 1975 - 2021
Mission Hills fatal accident list:
Sep 4, 2020 05:25 PM, Indian Ln, Lat: 39.014728, Lon: -94.624583, Vehicles: 1, Persons: 1, Fatalities: 1Vehicles: 1, Persons: 2, Fatalities: 2, Drunk persons involved: 1Vehicles: 1, Persons: 1, Fatalities: 1Vehicles: 1, Persons: 2, Fatalities: 2Vehicles: 1, Persons: 2, Fatalities: 2
National Bridge Inventory (NBI) Statistics 5 Number of bridges30ft / 8.9m Total length11,900 Total average daily traffic1,225 Total average daily truck traffic12,100 Total future (year 2041) average daily traffic
FCC Registered Broadcast Land Mobile Towers: 4
Lat: 39.030639 Lon: -94.607694, Call Sign: KB92506, Assigned Frequencies: 462.337 MHz, 467.337 MHz, 451.337 MHz, 456.337 MHz, Grant Date: 03/24/2022, Expiration Date: 03/31/2032, Registrant: Washington Radio Reports, Gettysburg, PA 17325, Phone: (717) 334-0668, Fax: (717) 334-6440, Email:
Lat: 39.020833 Lon: -94.621889, Call Sign: WPWG541, Assigned Frequencies: 462.187 MHz, 462.262 MHz, 466.062 MHz, 467.187 MHz, Grant Date: 11/12/2002, Expiration Date: 11/12/2012, Cancellation Date: 01/12/2013, Certifier: Loren Breedlove, Registrant: Cara Enterprises Inc, Salt Lake City, UT 84117-0503, Phone: (801) 278-9728Lat: 39.030639 Lon: -94.607694, Call Sign: WQEU595, Assigned Frequencies: 451.337 MHz, 456.337 MHz, 462.337 MHz, 467.337 MHz, Grant Date: 04/18/2006, Expiration Date: 04/18/2016, Cancellation Date: 06/18/2016, Certifier: Brad Gray, Registrant: Cara Enterprises, Inc., Salt Lake City, UT 84117-0503, Phone: (801) 278-9728, Fax: (801) 278-7239, Email:
5406 Mission Dr (Lat: 39.030611 Lon: -94.608111), Type: Pipe, Structure height: 3.9 m, Overall height: 5.3 m, Call Sign: WQPA505, Assigned Frequencies: 169.525 MHz, Grant Date: 03/02/2022, Expiration Date: 03/20/2032, Certifier: John R Keating Mr, Registrant: City Of Overland Park Ks, 8500 Santa Fe Drive, Overland Park, KS 66212, Phone: (913) 895-6040, Fax: (913) 890-1055, Email:
FCC Registered Amateur Radio Licenses: 11 (
See the full list of FCC Registered Amateur Radio Licenses in Mission Hills )
FAA Registered Aircraft: 3
Aircraft: NORTHROP DELTA 1D (Category: Land, Seats: 5, Weight: Up to 12,499 Pounds, Speed: 146 mph), Engine: WRIGHT 1820G102 105 (1100 HP) (Reciprocating)N-Number: 13777, N13777, N-13777, Serial Number: 28, Year manufactured: 1934, Airworthiness Date: 08/17/1967, Certificate Issue Date: 12/12/1966Registrant (Individual): Richard M Davis, 5433 Mission Dr, Mission Hills, KS 66208Aircraft: PILATUS PC-12/45 (Category: Land, Seats: 12, Weight: 12,500 - 19,999 Pounds), Engine: P&W CANADA PT6A-65AG (1300 HP) (Turbo-prop)N-Number: 329NG, N329NG, N-329NG, Serial Number: 329, Year manufactured: 2000, Airworthiness Date: 08/22/2000, Certificate Issue Date: 07/31/2018Registrant (LLC): Queen Of Fleet LLC, 6625 Wenonga Ter, Mission Hills, KS 66208Aircraft: CIRRUS DESIGN CORP SR22 (Category: Land, Seats: 4, Weight: Up to 12,499 Pounds), Engine: CONT MOTOR IO-550-N (310 HP) (Reciprocating)N-Number: 438CP, N438CP, N-438CP, Serial Number: 3258, Year manufactured: 2008, Airworthiness Date: 09/11/2008, Certificate Issue Date: 10/22/2008Registrant (Corporation): Cirrwood LLC, 5650 High Dr, Mission Hills, KS 66208Deregistered: Cancel Date: 01/19/2018
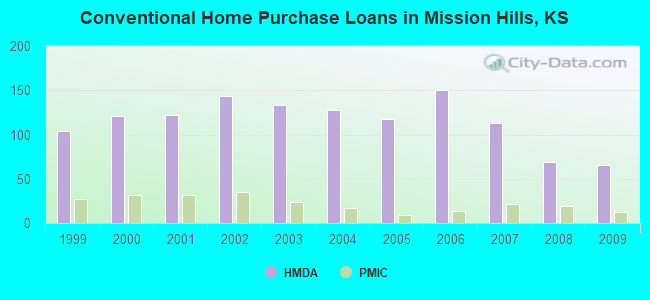
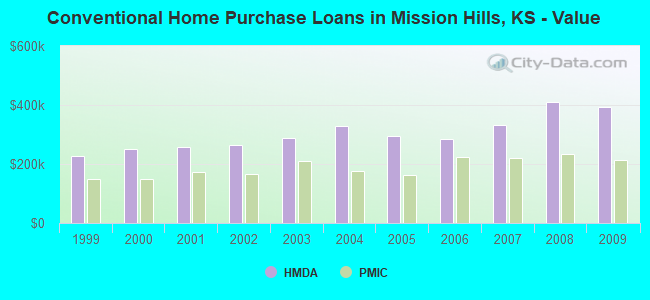
Home Mortgage Disclosure Act Aggregated Statistics For Year 2009(Based on 3 partial tracts) A) FHA, FSA/RHS & VA B) Conventional C) Refinancings D) Home Improvement Loans F) Non-occupant Loans on G) Loans On Manufactured Number Average Value Number Average Value Number Average Value Number Average Value Number Average Value Number Average Value
LOANS ORIGINATED 21 $178,503 66 $393,868 236 $366,917 8 $114,698 9 $432,739 1 $155,620 APPLICATIONS APPROVED, NOT ACCEPTED 2 $177,930 2 $1,156,105 14 $293,276 0 $0 0 $0 0 $0 APPLICATIONS DENIED 1 $163,850 3 $227,317 33 $394,901 1 $258,410 2 $204,640 0 $0 APPLICATIONS WITHDRAWN 3 $223,077 6 $393,067 30 $272,767 1 $167,760 1 $157,850 0 $0 FILES CLOSED FOR INCOMPLETENESS 0 $0 0 $0 4 $256,190 0 $0 0 $0 0 $0
Aggregated Statistics For Year 2008(Based on 3 partial tracts) A) FHA, FSA/RHS & VA B) Conventional C) Refinancings D) Home Improvement Loans F) Non-occupant Loans on Number Average Value Number Average Value Number Average Value Number Average Value Number Average Value
LOANS ORIGINATED 9 $173,799 69 $410,471 128 $320,118 16 $192,245 22 $360,630 APPLICATIONS APPROVED, NOT ACCEPTED 1 $96,180 3 $326,753 9 $408,707 3 $313,093 1 $272,120 APPLICATIONS DENIED 0 $0 9 $231,976 22 $290,346 6 $164,478 1 $88,110 APPLICATIONS WITHDRAWN 2 $182,590 4 $299,192 17 $431,341 2 $182,525 2 $310,765 FILES CLOSED FOR INCOMPLETENESS 0 $0 2 $385,500 5 $439,142 1 $147,360 0 $0
Aggregated Statistics For Year 2007(Based on 3 partial tracts) A) FHA, FSA/RHS & VA B) Conventional C) Refinancings D) Home Improvement Loans F) Non-occupant Loans on Number Average Value Number Average Value Number Average Value Number Average Value Number Average Value
LOANS ORIGINATED 1 $107,260 113 $332,970 108 $363,139 17 $245,049 22 $464,791 APPLICATIONS APPROVED, NOT ACCEPTED 0 $0 4 $234,660 13 $290,482 3 $470,073 0 $0 APPLICATIONS DENIED 1 $89,470 7 $303,623 35 $529,380 7 $121,330 3 $609,883 APPLICATIONS WITHDRAWN 0 $0 11 $457,737 17 $431,746 4 $529,290 0 $0 FILES CLOSED FOR INCOMPLETENESS 0 $0 2 $246,795 7 $251,643 1 $22,370 0 $0
Aggregated Statistics For Year 2006(Based on 3 partial tracts) A) FHA, FSA/RHS & VA B) Conventional C) Refinancings D) Home Improvement Loans F) Non-occupant Loans on Number Average Value Number Average Value Number Average Value Number Average Value Number Average Value
LOANS ORIGINATED 3 $188,590 150 $284,992 101 $297,500 27 $190,705 32 $346,959 APPLICATIONS APPROVED, NOT ACCEPTED 0 $0 11 $308,739 8 $257,986 2 $18,585 2 $105,335 APPLICATIONS DENIED 0 $0 9 $155,167 33 $381,052 6 $55,585 4 $117,888 APPLICATIONS WITHDRAWN 1 $103,450 13 $276,248 24 $240,808 1 $183,620 1 $324,050 FILES CLOSED FOR INCOMPLETENESS 0 $0 5 $272,638 4 $193,578 1 $15,660 1 $73,970
Aggregated Statistics For Year 2005(Based on 3 partial tracts) A) FHA, FSA/RHS & VA B) Conventional C) Refinancings D) Home Improvement Loans F) Non-occupant Loans on Number Average Value Number Average Value Number Average Value Number Average Value Number Average Value
LOANS ORIGINATED 2 $149,935 117 $295,772 155 $383,623 16 $307,231 21 $237,703 APPLICATIONS APPROVED, NOT ACCEPTED 1 $81,640 10 $193,735 13 $303,711 2 $21,430 2 $106,315 APPLICATIONS DENIED 0 $0 10 $248,037 38 $234,479 2 $65,505 1 $246,050 APPLICATIONS WITHDRAWN 0 $0 10 $241,251 53 $330,589 3 $82,080 2 $170,615 FILES CLOSED FOR INCOMPLETENESS 0 $0 3 $618,570 12 $803,841 1 $85,780 0 $0
Aggregated Statistics For Year 2004(Based on 3 partial tracts) A) FHA, FSA/RHS & VA B) Conventional C) Refinancings D) Home Improvement Loans F) Non-occupant Loans on Number Average Value Number Average Value Number Average Value Number Average Value Number Average Value
LOANS ORIGINATED 3 $144,437 128 $328,852 172 $312,301 16 $232,029 19 $215,665 APPLICATIONS APPROVED, NOT ACCEPTED 0 $0 14 $395,906 17 $282,093 2 $30,100 2 $173,385 APPLICATIONS DENIED 0 $0 8 $365,222 48 $296,970 2 $479,670 2 $218,990 APPLICATIONS WITHDRAWN 0 $0 14 $289,079 35 $327,129 0 $0 2 $180,805 FILES CLOSED FOR INCOMPLETENESS 0 $0 4 $97,610 12 $376,341 1 $40,640 0 $0
Aggregated Statistics For Year 2003(Based on 3 partial tracts) A) FHA, FSA/RHS & VA B) Conventional C) Refinancings D) Home Improvement Loans F) Non-occupant Loans on Number Average Value Number Average Value Number Average Value Number Average Value Number Average Value
LOANS ORIGINATED 6 $133,110 133 $288,717 525 $281,989 6 $149,647 22 $172,238 APPLICATIONS APPROVED, NOT ACCEPTED 0 $0 12 $376,714 33 $282,215 0 $0 2 $218,510 APPLICATIONS DENIED 0 $0 10 $300,496 53 $248,404 3 $64,637 2 $99,805 APPLICATIONS WITHDRAWN 0 $0 10 $251,823 56 $299,730 0 $0 1 $124,460 FILES CLOSED FOR INCOMPLETENESS 0 $0 0 $0 19 $262,029 0 $0 0 $0
Aggregated Statistics For Year 2002(Based on 3 partial tracts) A) FHA, FSA/RHS & VA B) Conventional C) Refinancings D) Home Improvement Loans F) Non-occupant Loans on Number Average Value Number Average Value Number Average Value Number Average Value Number Average Value
LOANS ORIGINATED 10 $134,166 144 $265,025 402 $283,857 10 $69,692 14 $174,157 APPLICATIONS APPROVED, NOT ACCEPTED 1 $130,730 9 $198,652 40 $319,774 2 $47,625 1 $120,790 APPLICATIONS DENIED 0 $0 5 $329,666 42 $305,318 2 $22,720 1 $518,990 APPLICATIONS WITHDRAWN 0 $0 12 $370,342 45 $249,852 2 $272,540 0 $0 FILES CLOSED FOR INCOMPLETENESS 1 $77,170 1 $135,550 24 $238,007 0 $0 0 $0
Aggregated Statistics For Year 2001(Based on 3 partial tracts) A) FHA, FSA/RHS & VA B) Conventional C) Refinancings D) Home Improvement Loans F) Non-occupant Loans on Number Average Value Number Average Value Number Average Value Number Average Value Number Average Value
LOANS ORIGINATED 10 $122,251 122 $256,367 293 $270,301 18 $122,451 16 $184,178 APPLICATIONS APPROVED, NOT ACCEPTED 0 $0 8 $360,770 21 $225,864 5 $32,752 1 $119,670 APPLICATIONS DENIED 1 $104,140 7 $220,107 31 $238,080 4 $39,282 1 $58,980 APPLICATIONS WITHDRAWN 0 $0 3 $129,997 29 $249,013 4 $61,932 0 $0 FILES CLOSED FOR INCOMPLETENESS 0 $0 2 $243,910 15 $222,423 1 $106,130 0 $0
Aggregated Statistics For Year 2000(Based on 3 partial tracts) A) FHA, FSA/RHS & VA B) Conventional C) Refinancings D) Home Improvement Loans E) Loans on Dwellings For 5+ Families F) Non-occupant Loans on Number Average Value Number Average Value Number Average Value Number Average Value Number Average Value Number Average Value
LOANS ORIGINATED 4 $123,148 121 $251,826 75 $269,403 17 $58,112 0 $0 7 $290,830 APPLICATIONS APPROVED, NOT ACCEPTED 0 $0 8 $273,190 11 $116,569 4 $32,097 0 $0 0 $0 APPLICATIONS DENIED 0 $0 8 $116,485 20 $191,262 3 $18,880 0 $0 1 $53,540 APPLICATIONS WITHDRAWN 0 $0 6 $361,955 13 $160,761 2 $117,745 0 $0 0 $0 FILES CLOSED FOR INCOMPLETENESS 0 $0 3 $148,027 4 $205,618 0 $0 1 $130,520 0 $0
Aggregated Statistics For Year 1999(Based on 3 partial tracts) A) FHA, FSA/RHS & VA B) Conventional C) Refinancings D) Home Improvement Loans F) Non-occupant Loans on Number Average Value Number Average Value Number Average Value Number Average Value Number Average Value
LOANS ORIGINATED 9 $107,676 104 $226,369 160 $208,213 14 $45,589 8 $119,954 APPLICATIONS APPROVED, NOT ACCEPTED 0 $0 3 $190,847 16 $136,230 3 $52,063 0 $0 APPLICATIONS DENIED 0 $0 11 $259,757 28 $185,409 3 $42,617 0 $0 APPLICATIONS WITHDRAWN 0 $0 9 $172,968 17 $147,637 2 $14,250 0 $0 FILES CLOSED FOR INCOMPLETENESS 0 $0 4 $262,138 4 $113,898 1 $9,800 0 $0
Detailed HMDA statistics for the following Tracts:
0500.00
, 0508.00 , 0509.00
Private Mortgage Insurance Companies Aggregated Statistics For Year 2009(Based on 3 partial tracts) A) Conventional B) Refinancings Number Average Value Number Average Value
LOANS ORIGINATED 12 $213,388 4 $230,628 APPLICATIONS APPROVED, NOT ACCEPTED 1 $150,140 0 $0 APPLICATIONS DENIED 1 $71,580 1 $108,480 APPLICATIONS WITHDRAWN 0 $0 1 $108,480 FILES CLOSED FOR INCOMPLETENESS 0 $0 0 $0
Aggregated Statistics For Year 2008(Based on 3 partial tracts) A) Conventional B) Refinancings C) Non-occupant Loans on Number Average Value Number Average Value Number Average Value
LOANS ORIGINATED 19 $235,357 10 $196,815 1 $254,250 APPLICATIONS APPROVED, NOT ACCEPTED 6 $306,345 3 $279,007 1 $360,680 APPLICATIONS DENIED 0 $0 1 $234,010 0 $0 APPLICATIONS WITHDRAWN 0 $0 1 $184,540 0 $0 FILES CLOSED FOR INCOMPLETENESS 1 $148,000 0 $0 0 $0
Aggregated Statistics For Year 2007(Based on 3 partial tracts) A) Conventional B) Refinancings Number Average Value Number Average Value
LOANS ORIGINATED 22 $218,873 5 $176,406 APPLICATIONS APPROVED, NOT ACCEPTED 2 $279,980 4 $291,560 APPLICATIONS DENIED 0 $0 0 $0 APPLICATIONS WITHDRAWN 0 $0 0 $0 FILES CLOSED FOR INCOMPLETENESS 0 $0 1 $57,040
Aggregated Statistics For Year 2006(Based on 3 partial tracts) A) Conventional B) Refinancings C) Non-occupant Loans on Number Average Value Number Average Value Number Average Value
LOANS ORIGINATED 14 $222,997 3 $260,630 1 $108,480 APPLICATIONS APPROVED, NOT ACCEPTED 1 $110,600 1 $192,910 0 $0 APPLICATIONS DENIED 0 $0 0 $0 0 $0 APPLICATIONS WITHDRAWN 1 $200,350 0 $0 0 $0 FILES CLOSED FOR INCOMPLETENESS 1 $90,590 0 $0 0 $0
Aggregated Statistics For Year 2005(Based on 3 partial tracts) A) Conventional B) Refinancings C) Non-occupant Loans on Number Average Value Number Average Value Number Average Value
LOANS ORIGINATED 9 $163,010 4 $173,950 1 $122,480 APPLICATIONS APPROVED, NOT ACCEPTED 3 $271,100 1 $123,080 0 $0 APPLICATIONS DENIED 0 $0 0 $0 0 $0 APPLICATIONS WITHDRAWN 0 $0 0 $0 0 $0 FILES CLOSED FOR INCOMPLETENESS 0 $0 0 $0 0 $0
Aggregated Statistics For Year 2004(Based on 3 partial tracts) A) Conventional B) Refinancings C) Non-occupant Loans on Number Average Value Number Average Value Number Average Value
LOANS ORIGINATED 17 $176,504 9 $161,986 1 $158,470 APPLICATIONS APPROVED, NOT ACCEPTED 4 $214,312 6 $169,565 0 $0 APPLICATIONS DENIED 0 $0 0 $0 0 $0 APPLICATIONS WITHDRAWN 2 $153,855 0 $0 0 $0 FILES CLOSED FOR INCOMPLETENESS 0 $0 0 $0 0 $0
Aggregated Statistics For Year 2003(Based on 3 partial tracts) A) Conventional B) Refinancings C) Non-occupant Loans on Number Average Value Number Average Value Number Average Value
LOANS ORIGINATED 24 $209,006 27 $168,294 1 $90,770 APPLICATIONS APPROVED, NOT ACCEPTED 3 $321,713 2 $146,905 0 $0 APPLICATIONS DENIED 0 $0 0 $0 0 $0 APPLICATIONS WITHDRAWN 0 $0 2 $110,160 0 $0 FILES CLOSED FOR INCOMPLETENESS 0 $0 0 $0 0 $0
Aggregated Statistics For Year 2002(Based on 3 partial tracts) A) Conventional B) Refinancings C) Non-occupant Loans on Number Average Value Number Average Value Number Average Value
LOANS ORIGINATED 35 $167,643 19 $161,206 3 $111,593 APPLICATIONS APPROVED, NOT ACCEPTED 2 $128,535 2 $232,420 1 $64,310 APPLICATIONS DENIED 1 $72,700 0 $0 0 $0 APPLICATIONS WITHDRAWN 1 $241,520 2 $123,470 0 $0 FILES CLOSED FOR INCOMPLETENESS 0 $0 0 $0 0 $0
Aggregated Statistics For Year 2001(Based on 3 partial tracts) A) Conventional B) Refinancings C) Non-occupant Loans on Number Average Value Number Average Value Number Average Value
LOANS ORIGINATED 32 $174,348 15 $136,009 3 $110,820 APPLICATIONS APPROVED, NOT ACCEPTED 6 $272,795 2 $188,920 0 $0 APPLICATIONS DENIED 0 $0 0 $0 0 $0 APPLICATIONS WITHDRAWN 1 $105,180 0 $0 0 $0 FILES CLOSED FOR INCOMPLETENESS 0 $0 0 $0 0 $0
Aggregated Statistics For Year 2000(Based on 3 partial tracts) A) Conventional B) Refinancings Number Average Value Number Average Value
LOANS ORIGINATED 32 $149,191 4 $148,098 APPLICATIONS APPROVED, NOT ACCEPTED 6 $201,050 0 $0 APPLICATIONS DENIED 1 $208,820 1 $112,260 APPLICATIONS WITHDRAWN 0 $0 1 $292,220 FILES CLOSED FOR INCOMPLETENESS 0 $0 0 $0
Aggregated Statistics For Year 1999(Based on 3 partial tracts) A) Conventional B) Refinancings Number Average Value Number Average Value
LOANS ORIGINATED 27 $149,326 6 $130,860 APPLICATIONS APPROVED, NOT ACCEPTED 2 $299,715 3 $217,877 APPLICATIONS DENIED 1 $80,590 1 $216,610 APPLICATIONS WITHDRAWN 0 $0 0 $0 FILES CLOSED FOR INCOMPLETENESS 0 $0 0 $0
Detailed PMIC statistics for the following Tracts:
0500.00
, 0508.00 , 0509.00
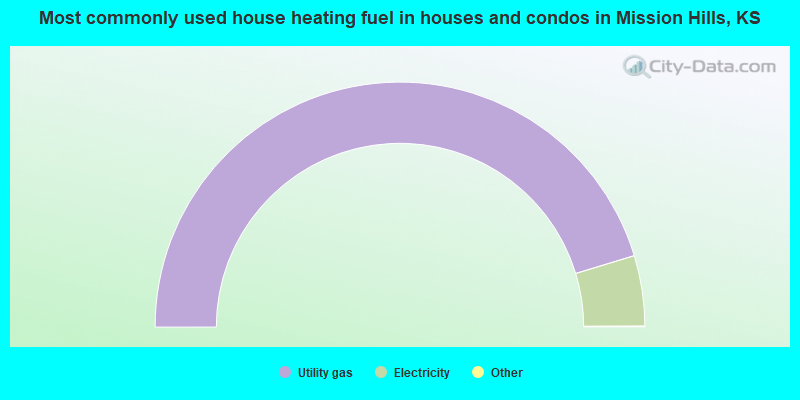
90.6% Utility gas 9.3% Electricity
Mission Hills compared to Kansas state average:
Median household income significantly above state average. Median house value significantly above state average. Unemployed percentage significantly below state average. Black race population percentage significantly below state average. Hispanic race population percentage significantly below state average. Median age significantly above state average. Renting percentage significantly below state average. Length of stay since moving in significantly above state average. Number of rooms per house significantly above state average. Number of college students below state average. Percentage of population with a bachelor's degree or higher significantly above state average. Mission Hills on our top lists :
#10 on the list of "Top 101 cities with the most people having professional degrees (population 500+)"
#17 on the list of "Top 100 best educated cities (highest percentage of bachelor degree holding residents)"
#41 on the list of "Top 100 cities with highest median household income"
#52 on the list of "Top 100 cities with biggest houses"
#9 on the list of "Top 101 counties with the best general health status score of residents (1-5), 3 years of data"
#11 on the list of "Top 101 counties with the highest percentage of residents that visited a dentist within the past year"
#31 on the list of "Top 101 counties with the largest number of people without health insurance coverage in 2000 (pop. 50,000+)"
#33 on the list of "Top 101 counties with the largest number of children under 18 without health insurance coverage in 2000 (pop. 50,000+)"
#36 on the list of "Top 101 counties with the highest percentage of residents that exercised in the past month"
Top Patent Applicants
Lyle Walter Paczkowski (17)
Lyle W. Paczkowski (13)
Robb Krumlauf (9)
Bruce C. Ianni (6)
Audrey Kunin (5)
Andrew Fromm (4)
Clay Patterson (4)
Thomas M. Cray (3)
Martin Smoler (3)
Mark A. Ernst (3)
Total of 97 patent applications in 2008-2024.


 Recent articles from our blog. Our writers, many of them Ph.D. graduates or candidates, create easy-to-read articles on a wide variety of topics.

 (5.4 miles