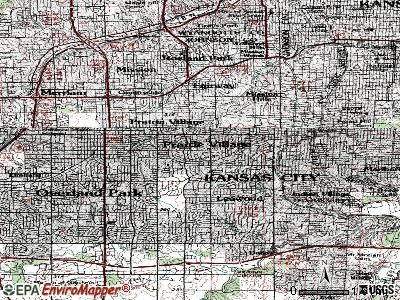
Prairie Village, Kansas
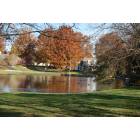
Prairie Village: Duckpond, Prairie Village
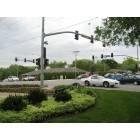
Prairie Village: Intersection of 75th & Mission Rd
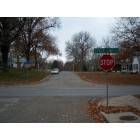
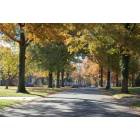
Prairie Village: Looking into Prairie Village, KS from Kansas City, MO - State Line Road @ 72nd Terrace
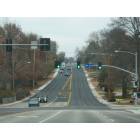
Prairie Village: 75th Street @ Roe Ave
Prairie Village: Catalina St., Prairie Village, KS
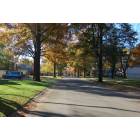
Prairie Village: Catalina St., Prairie Village

Prairie Village: Ice Storm December 2007 - Crabapple Tree w/ Ice
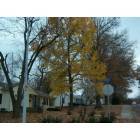
Prairie Village: Fall Color - Thanksgiving Day 2007
- add
your
Submit your own pictures of this city and show them to the world
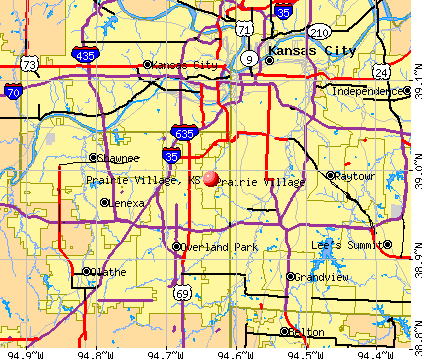
- OSM Map
- General Map
- Google Map
- MSN Map
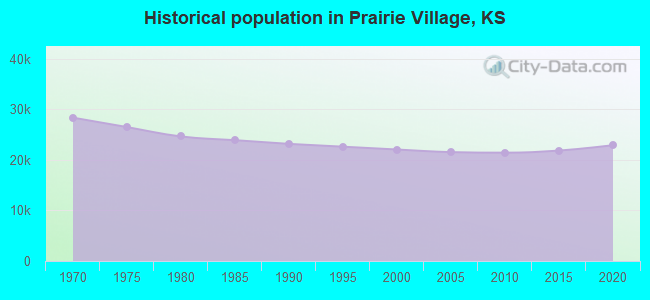
Population change since 2000: +4.0%
 |
| Males: 10,449 | |
| Females: 12,498 |
| Median resident age: | 40.7 years |
| Kansas median age: | 37.6 years |
Zip codes: 66208.
| Prairie Village: | $94,765 |
| KS: | $68,925 |
Estimated per capita income in 2022: $63,564 (it was $34,677 in 2000)
Prairie Village city income, earnings, and wages data
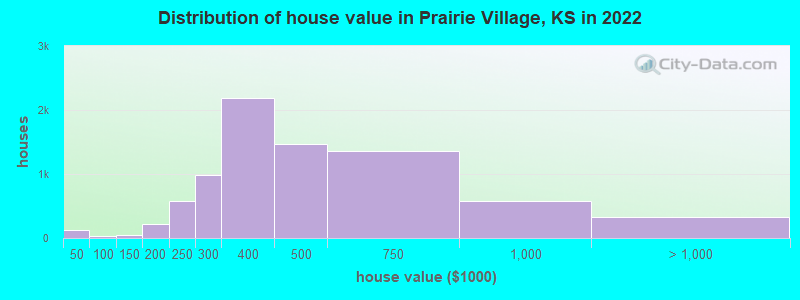
Estimated median house or condo value in 2022: $401,681 (it was $140,700 in 2000)
| Prairie Village: | $401,681 |
| KS: | $206,600 |
Mean prices in 2022: all housing units: $418,342; detached houses: $434,193; townhouses or other attached units: $276,170; in 2-unit structures: $212,015; in 3-to-4-unit structures: $223,304; in 5-or-more-unit structures: $279,112; mobile homes: $49,722
Median gross rent in 2022: $1,550.
Prairie Village, KS residents, houses, and apartments details
(4.3% for White Non-Hispanic residents, 6.7% for Black residents, 4.1% for Hispanic or Latino residents, 11.1% for two or more races residents)
Detailed information about poverty and poor residents in Prairie Village, KS


Compare current foreclosures near Prairie Village, KS:
| Photo | Address | Area | Beds / Baths | Price | Details |
|---|---|---|---|---|---|

|
#1
Nall Ave
Prairie Village, KS 66208
|
1,196 sq. feet
|
1 baths 3 beds |
show details | |

|
#2
Falmouth St
Prairie Village, KS 66208
|
886 sq. feet
|
1 baths 2 beds |
show details | |

|
#3
Rosewood Dr
Prairie Village, KS 66208
|
1,414 sq. feet
|
1 baths 3 beds |
show details | |

|
#4
W 78th St
Prairie Village, KS 66208
|
1,360 sq. feet
|
1 baths 3 beds |
show details | |

|
#5
Briar St
Prairie Village, KS 66208
|
1,274 sq. feet
|
2 baths 3 beds |
show details | |

|
#6
Ash St
Prairie Village, KS 66208
|
2,267 sq. feet
|
3 baths 4 beds |
show details | |

|
#7
W 69th Ter
Prairie Village, KS 66208
|
1,419 sq. feet
|
2 baths 4 beds |
show details | |

|
#8
W 79th St
Prairie Village, KS 66208
|
1,557 sq. feet
|
2 baths 3 beds |
show details | |

|
#9
Indian Ln
Prairie Village, KS 66208
|
1,934 sq. feet
|
2 baths 4 beds |
show details | |

|
#10
Tomahawk Rd
Prairie Village, KS 66208
|
1,100 sq. feet
|
1 baths 3 beds |
show details |
| Photo | Address | Area | Beds / Baths | Price | Details |
|---|---|---|---|---|---|

|
#11
W 75th St
Prairie Village, KS 66208
|
950 sq. feet
|
1 baths 2 beds |
show details | |

|
#12
W 75th St
Prairie Village, KS 66208
|
987 sq. feet
|
2 baths 2 beds |
show details | |

|
#13
Ash St
Prairie Village, KS 66208
|
3,054 sq. feet
|
2 baths 3 beds |
show details | |

|
#14
W 75th Ter
Prairie Village, KS 66208
|
- sq. feet
|
- baths - beds |
show details | |

|
#15
Juniper Dr
Prairie Village, KS 66208
|
- sq. feet
|
- baths - beds |
show details | |

|
#16
Lewis Ave
Kansas City, MO 64138
|
1,073 sq. feet
|
1 baths 3 beds |
$149,900
|
show details |

|
#17
Admiral Blvd Apt 1006
Kansas City, MO 64106
|
752 sq. feet
|
1 baths 1 beds |
$187,000
|
show details |

|
#18
E 118th St
Kansas City, MO 64134
|
1,450 sq. feet
|
2 baths 3 beds |
$265,000
|
show details |

|
#19
Walker Ave
Kansas City, KS 66104
|
1,540 sq. feet
|
2 baths 3 beds |
$129,900
|
show details |

|
#20
Indiana Ave
Kansas City, MO 64130
|
916 sq. feet
|
1 baths 2 beds |
$125,000
|
show details |
| Photo | Address | Area | Beds / Baths | Price | Details |
|---|---|---|---|---|---|

|
#21
N 46th St
Kansas City, KS 66102
|
980 sq. feet
|
1 baths 2 beds |
$78,500
|
show details |

|
#22
E 34th St S
Independence, MO 64052
|
1,656 sq. feet
|
1 baths 3 beds |
$235,000
|
show details |

|
#23
E 41st St
Kansas City, MO 64111
|
801 sq. feet
|
1 baths 1 beds |
$135,000
|
show details |

|
#24
S Benton Ave
Kansas City, MO 64130
|
1,804 sq. feet
|
2 baths 3 beds |
$89,900
|
show details |

|
#25
E 68th Ter
Kansas City, MO 64132
|
720 sq. feet
|
1 baths 2 beds |
$64,050
|
show details |

|
#26
Rockhill Rd
Kansas City, MO 64110
|
1,752 sq. feet
|
2 baths 4 beds |
$334,900
|
show details |

|
#27
Wabash Ave
Kansas City, MO 64130
|
836 sq. feet
|
1 baths 2 beds |
$52,000
|
show details |

|
#28
Lyons Ave
Kansas City, KS 66101
|
586 sq. feet
|
1 baths 2 beds |
$15,900
|
show details |

|
#29
E 40th St
Kansas City, MO 64130
|
- sq. feet
|
1 baths 3 beds |
$19,900
|
show details |

|
#30
W 104th St Apt A
Kansas City, MO 64114
|
1,034 sq. feet
|
2 baths 2 beds |
show details |
| Photo | Address | Area | Beds / Baths | Price | Details |
|---|---|---|---|---|---|

|
#31
E Susquehanna Dr
Independence, MO 64056
|
6,462 sq. feet
|
10 baths 12 beds |
show details | |

|
#32
Paseo Blvd
Kansas City, MO 64110
|
2,608 sq. feet
|
2 baths 6 beds |
show details | |

|
#33
Sortor Dr
Kansas City, KS 66104
|
1,768 sq. feet
|
1 baths 3 beds |
show details | |

|
#34
E 75th St
Kansas City, MO 64138
|
1,440 sq. feet
|
1 baths 3 beds |
show details | |

|
#35
E 57th St
Kansas City, MO 64133
|
840 sq. feet
|
1 baths 3 beds |
show details | |

|
#36
Central St
Kansas City, MO 64114
|
1,200 sq. feet
|
1 baths 2 beds |
show details | |

|
#37
E 109th Ter
Kansas City, MO 64137
|
988 sq. feet
|
1 baths 2 beds |
show details | |

|
#38
E 47th Ter S
Independence, MO 64055
|
950 sq. feet
|
1 baths 2 beds |
show details | |

|
#39
NW Valley Ln
Riverside, MO 64150
|
1,541 sq. feet
|
1 baths 2 beds |
show details | |

|
#40
N 73rd St
Kansas City, KS 66109
|
1,314 sq. feet
|
1 baths 3 beds |
show details |
| Photo | Address | Area | Beds / Baths | Price | Details |
|---|---|---|---|---|---|

|
#41
Georgia Ave
Kansas City, KS 66104
|
- sq. feet
|
1 baths 2 beds |
show details | |

|
#42
Metcalf Ct # 41
Mission, KS 66202
|
1,260 sq. feet
|
2 baths 2 beds |
show details | |

|
#43
N Union St
Independence, MO 64050
|
912 sq. feet
|
2 baths 3 beds |
show details | |

|
#44
S Greenwich Ln
Independence, MO 64055
|
1,000 sq. feet
|
1 baths 3 beds |
show details | |

|
#45
N Winchester Ave
Kansas City, MO 64119
|
960 sq. feet
|
2 baths 4 beds |
show details | |

|
#46
W 42nd Ave
Kansas City, KS 66103
|
1,816 sq. feet
|
1 baths 3 beds |
show details | |

|
#47
E 59th Terrace Cir
Kansas City, MO 64133
|
1,380 sq. feet
|
2 baths 2 beds |
show details | |

|
#48
N Flora Ave
Kansas City, MO 64118
|
1,840 sq. feet
|
1 baths 4 beds |
show details | |

|
#49
S 23rd St
Kansas City, KS 66102
|
1,494 sq. feet
|
2 baths 3 beds |
show details | |

|
Check over 1 million property listings on Foreclosure.com!
|
browse all offers | |||


- 20,43287.9%White alone
- 1,2335.3%Hispanic
- 9103.9%Two or more races
- 2841.2%Asian alone
- 2331.0%Black alone
- 170.07%American Indian alone
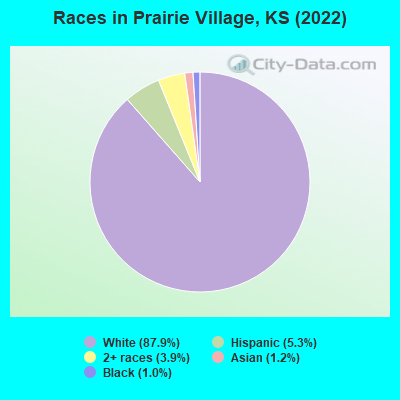
Races in Prairie Village detailed stats: ancestries, foreign born residents, place of birth
According to our research of Kansas and other state lists, there were 10 registered sex offenders living in Prairie Village, Kansas as of April 27, 2024.
The ratio of all residents to sex offenders in Prairie Village is 2,228 to 1.
The ratio of registered sex offenders to all residents in this city is much lower than the state average.
Type |
2009 |
2010 |
2011 |
2012 |
2013 |
2014 |
2015 |
2016 |
2017 |
2018 |
2019 |
2020 |
2021 |
2022 |
|---|---|---|---|---|---|---|---|---|---|---|---|---|---|---|
| Murders (per 100,000) | 0 (0.0) | 0 (0.0) | 0 (0.0) | 0 (0.0) | 0 (0.0) | 0 (0.0) | 0 (0.0) | 0 (0.0) | 0 (0.0) | 1 (4.4) | 0 (0.0) | 1 (4.5) | 0 (0.0) | 0 (0.0) |
| Rapes (per 100,000) | 1 (4.7) | 5 (23.3) | 6 (27.8) | 3 (13.7) | 1 (4.6) | 3 (13.6) | 2 (9.1) | 1 (4.6) | 2 (9.1) | 6 (26.7) | 3 (13.3) | 2 (8.9) | 6 (26.8) | 5 (21.9) |
| Robberies (per 100,000) | 7 (32.7) | 1 (4.7) | 5 (23.2) | 3 (13.7) | 2 (9.1) | 3 (13.6) | 2 (9.1) | 1 (4.6) | 3 (13.7) | 1 (4.4) | 3 (13.3) | 3 (13.4) | 3 (13.4) | 3 (13.1) |
| Assaults (per 100,000) | 12 (56.0) | 45 (209.8) | 13 (60.2) | 7 (32.0) | 7 (32.0) | 5 (22.7) | 3 (13.6) | 9 (41.0) | 5 (22.9) | 9 (40.0) | 24 (106.6) | 10 (44.7) | 21 (93.7) | 25 (109.5) |
| Burglaries (per 100,000) | 104 (485.6) | 75 (349.7) | 64 (296.5) | 50 (228.2) | 51 (233.2) | 36 (163.6) | 41 (186.5) | 35 (159.4) | 27 (123.5) | 38 (168.9) | 33 (146.6) | 26 (116.1) | 41 (183.0) | 23 (100.7) |
| Thefts (per 100,000) | 215 (1,004) | 239 (1,114) | 200 (926.7) | 181 (826.3) | 150 (685.9) | 176 (800.0) | 162 (737.0) | 163 (742.3) | 144 (658.7) | 217 (964.4) | 183 (813.0) | 188 (839.7) | 195 (870.5) | 218 (954.7) |
| Auto thefts (per 100,000) | 20 (93.4) | 17 (79.3) | 14 (64.9) | 14 (63.9) | 23 (105.2) | 16 (72.7) | 25 (113.7) | 26 (118.4) | 19 (86.9) | 23 (102.2) | 28 (124.4) | 44 (196.5) | 49 (218.7) | 63 (275.9) |
| Arson (per 100,000) | 2 (9.3) | 5 (23.3) | 5 (23.2) | 2 (9.1) | 0 (0.0) | 0 (0.0) | 1 (4.5) | 0 (0.0) | 1 (4.6) | 3 (13.3) | 0 (0.0) | 0 (0.0) | 0 (0.0) | 1 (4.4) |
| City-Data.com crime index | 106.4 | 137.4 | 104.2 | 75.6 | 65.0 | 68.8 | 64.4 | 63.5 | 58.0 | 98.1 | 88.7 | 86.5 | 109.3 | 110.7 |
The City-Data.com crime index weighs serious crimes and violent crimes more heavily. Higher means more crime, U.S. average is 246.1. It adjusts for the number of visitors and daily workers commuting into cities.
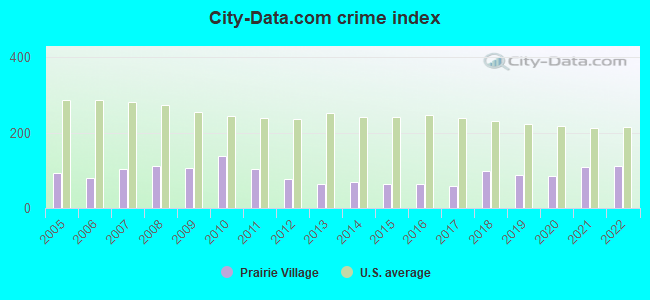
Crime rate in Prairie Village detailed stats: murders, rapes, robberies, assaults, burglaries, thefts, arson
Full-time law enforcement employees in 2021, including police officers: 51 (41 officers - 38 male; 3 female).
| Officers per 1,000 residents here: | 1.83 |
| Kansas average: | 2.70 |
 Recent articles from our blog. Our writers, many of them Ph.D. graduates or candidates, create easy-to-read articles on a wide variety of topics.

 | Kansas Passes New Budget With Tax Increases (88 replies) |
| Does Eastern Kansas have a lot of trees? (35 replies) |
| Kansas Job Losses (390 replies) |
| Best Major City in Kansas (58 replies) |
| Kansas: an economic disaster area (161 replies) |
| Non-KC Area Kansans Perspectives (41 replies) |
Latest news from Prairie Village, KS collected exclusively by city-data.com from local newspapers, TV, and radio stations
Ancestries: German (16.7%), English (15.1%), Irish (10.5%), American (8.5%), European (8.1%), Polish (3.0%).
Current Local Time: CST time zone
Elevation: 1050 feet
Land area: 6.22 square miles.
Population density: 3,688 people per square mile (average).
654 residents are foreign born (1.1% Asia, 0.8% Europe, 0.7% Latin America).
| This city: | 2.8% |
| Kansas: | 7.1% |
Median real estate property taxes paid for housing units with mortgages in 2022: $4,611 (1.1%)
Median real estate property taxes paid for housing units with no mortgage in 2022: $4,647 (1.2%)
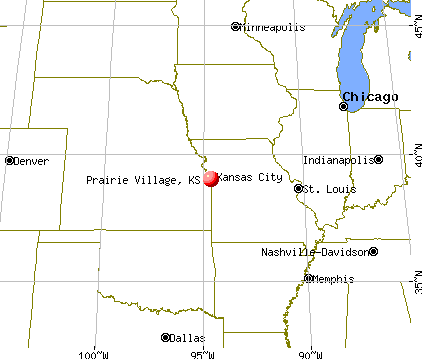
Nearest city with pop. 50,000+: Overland Park, KS  (4.2 miles , pop. 149,080).
Nearest city with pop. 200,000+: Kansas City, MO (7.4 miles , pop. 441,545).
Nearest city with pop. 1,000,000+: Chicago, IL (415.9 miles , pop. 2,896,016).
Nearest cities:
), ), ), Latitude: 38.99 N, Longitude: 94.64 W
Daytime population change due to commuting: -3,717 (-16.0%)
Workers who live and work in this city: 3,663 (29.4%)
Property values in Prairie Village, KS
Prairie Village, Kansas accommodation & food services, waste management - Economy and Business Data
| Here: | 1.8% |
| Kansas: | 2.0% |
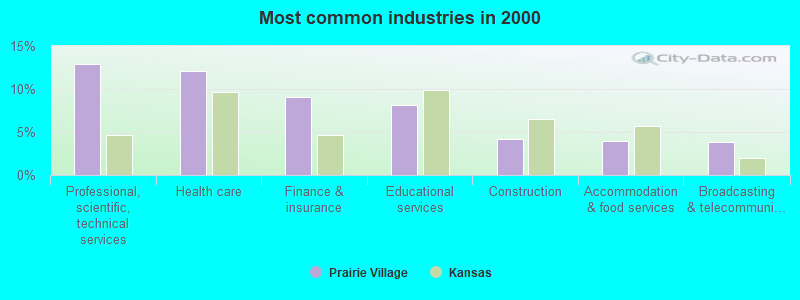
- Professional, scientific, technical services (12.9%)
- Health care (12.1%)
- Finance & insurance (9.1%)
- Educational services (8.1%)
- Construction (4.2%)
- Accommodation & food services (4.0%)
- Broadcasting & telecommunications (3.9%)
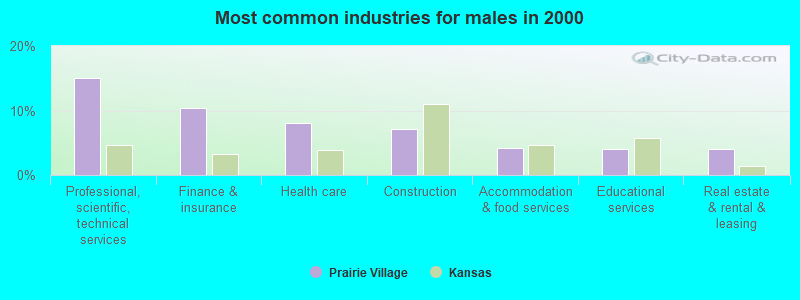
- Professional, scientific, technical services (15.0%)
- Finance & insurance (10.4%)
- Health care (8.0%)
- Construction (7.2%)
- Accommodation & food services (4.2%)
- Educational services (4.1%)
- Real estate & rental & leasing (4.1%)
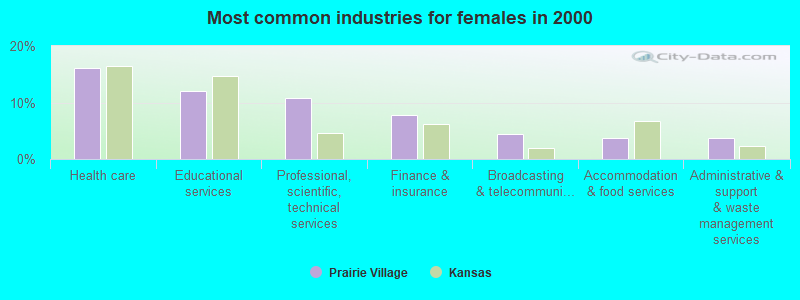
- Health care (16.2%)
- Educational services (12.0%)
- Professional, scientific, technical services (10.8%)
- Finance & insurance (7.8%)
- Broadcasting & telecommunications (4.4%)
- Accommodation & food services (3.8%)
- Administrative & support & waste management services (3.7%)
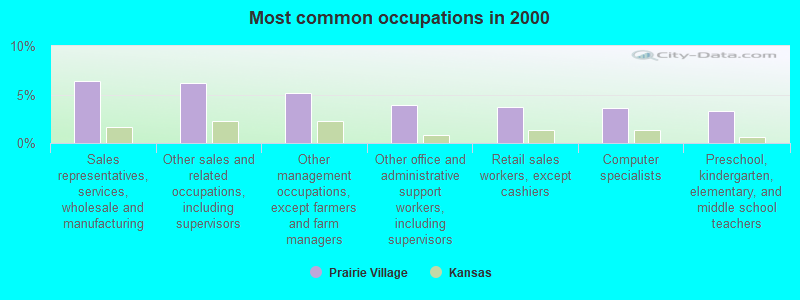
- Sales representatives, services, wholesale and manufacturing (6.4%)
- Other sales and related occupations, including supervisors (6.2%)
- Other management occupations, except farmers and farm managers (5.2%)
- Other office and administrative support workers, including supervisors (3.9%)
- Retail sales workers, except cashiers (3.7%)
- Computer specialists (3.6%)
- Preschool, kindergarten, elementary, and middle school teachers (3.3%)
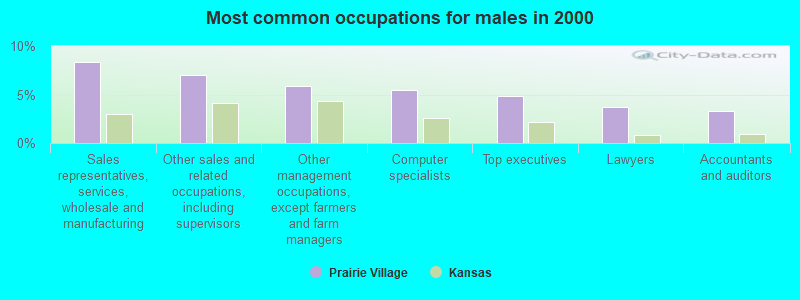
- Sales representatives, services, wholesale and manufacturing (8.4%)
- Other sales and related occupations, including supervisors (7.0%)
- Other management occupations, except farmers and farm managers (5.9%)
- Computer specialists (5.4%)
- Top executives (4.9%)
- Lawyers (3.7%)
- Accountants and auditors (3.3%)
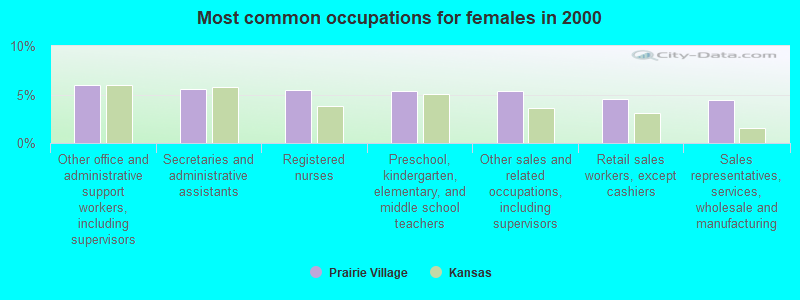
- Other office and administrative support workers, including supervisors (6.0%)
- Secretaries and administrative assistants (5.5%)
- Registered nurses (5.4%)
- Preschool, kindergarten, elementary, and middle school teachers (5.4%)
- Other sales and related occupations, including supervisors (5.4%)
- Retail sales workers, except cashiers (4.6%)
- Sales representatives, services, wholesale and manufacturing (4.5%)
Average climate in Prairie Village, Kansas
Based on data reported by over 4,000 weather stations


|
|


(lower is better)
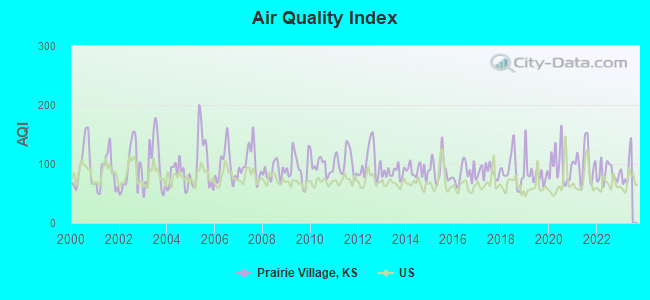
Air Quality Index (AQI) level in 2022 was 83.6. This is about average.
| City: | 83.6 |
| U.S.: | 72.6 |
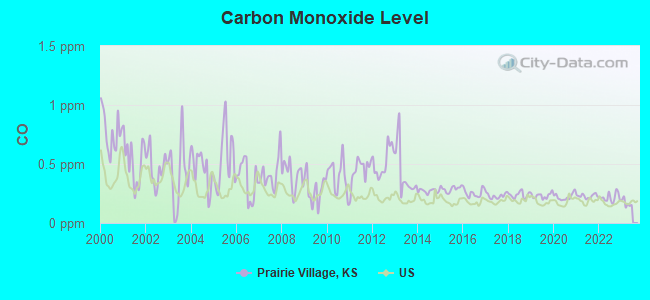
Carbon Monoxide (CO) [ppm] level in 2022 was 0.217. This is about average. Closest monitor was 2.9 miles away from the city center.
| City: | 0.217 |
| U.S.: | 0.251 |
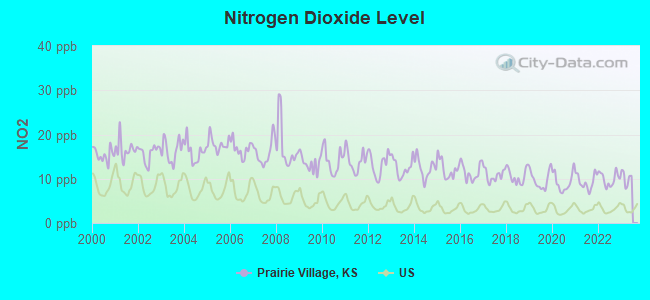
Nitrogen Dioxide (NO2) [ppb] level in 2022 was 9.92. This is significantly worse than average. Closest monitor was 3.6 miles away from the city center.
| City: | 9.92 |
| U.S.: | 5.11 |
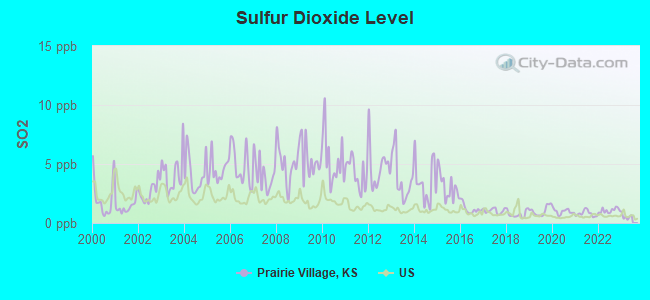
Sulfur Dioxide (SO2) [ppb] level in 2022 was 1.06. This is significantly better than average. Closest monitor was 3.6 miles away from the city center.
| City: | 1.06 |
| U.S.: | 1.51 |
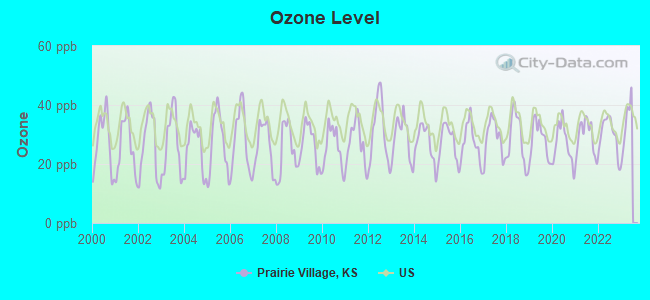
Ozone [ppb] level in 2022 was 29.9. This is about average. Closest monitor was 8.6 miles away from the city center.
| City: | 29.9 |
| U.S.: | 33.3 |
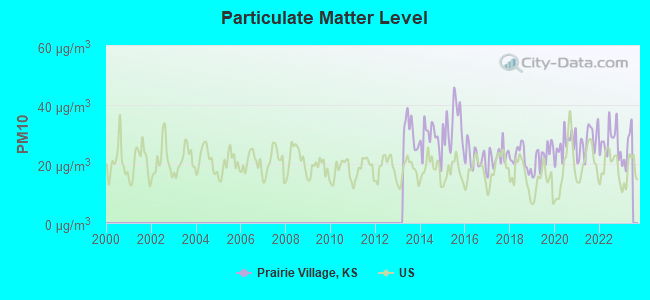
Particulate Matter (PM10) [µg/m3] level in 2022 was 27.8. This is significantly worse than average. Closest monitor was 2.0 miles away from the city center.
| City: | 27.8 |
| U.S.: | 19.2 |
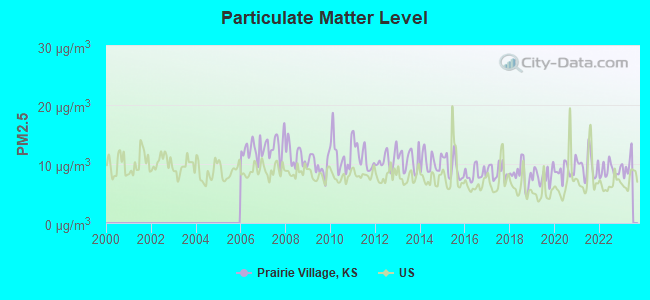
Particulate Matter (PM2.5) [µg/m3] level in 2022 was 8.89. This is about average. Closest monitor was 2.9 miles away from the city center.
| City: | 8.89 |
| U.S.: | 8.11 |
Tornado activity:
Prairie Village-area historical tornado activity is near Kansas state average. It is 102% greater than the overall U.S. average.
On 5/20/1957, a category F5 (max. wind speeds 261-318 mph) tornado 12.7 miles away from the Prairie Village city center killed 44 people and injured 207 people and caused between $500,000 and $5,000,000 in damages.
On 5/22/1952, a category F4 (max. wind speeds 207-260 mph) tornado 7.2 miles away from the city center injured 3 people and caused between $50,000 and $500,000 in damages.
Earthquake activity:
Prairie Village-area historical earthquake activity is significantly above Kansas state average. It is 512% greater than the overall U.S. average.On 9/3/2016 at 12:02:44, a magnitude 5.8 (5.8 MW, Depth: 3.5 mi, Class: Moderate, Intensity: VI - VII) earthquake occurred 217.3 miles away from Prairie Village center
On 11/6/2011 at 03:53:10, a magnitude 5.7 (5.7 MW, Depth: 3.2 mi) earthquake occurred 266.3 miles away from the city center
On 11/12/2014 at 21:40:00, a magnitude 4.9 (4.9 MW, Depth: 2.5 mi, Class: Light, Intensity: IV - V) earthquake occurred 201.2 miles away from the city center
On 11/7/2016 at 01:44:24, a magnitude 5.0 (5.0 MW, Depth: 2.8 mi) earthquake occurred 239.1 miles away from Prairie Village center
On 2/13/2016 at 17:07:06, a magnitude 5.1 (5.1 MW, Depth: 5.2 mi) earthquake occurred 281.9 miles away from the city center
On 1/19/2020 at 19:08:42, a magnitude 4.5 (4.5 MW, Depth: 3.1 mi) earthquake occurred 192.5 miles away from the city center
Magnitude types: moment magnitude (MW)
Natural disasters:
The number of natural disasters in Johnson County (10) is smaller than the US average (15).Major Disasters (Presidential) Declared: 6
Emergencies Declared: 2
Causes of natural disasters: Floods: 6, Storms: 6, Tornadoes: 2, Hurricane: 1, Ice Storm: 1, Wind: 1, Winter Storm: 1, Other: 1 (Note: some incidents may be assigned to more than one category).
Hospitals and medical centers in Prairie Village:
Amtrak stations near Prairie Village:
- 8 miles: KANSAS CITY (2200 MAIN ST.) . Services: ticket office, fully wheelchair accessible, enclosed waiting area, public restrooms, public payphones, snack bar, free short-term parking, paid long-term parking, call for car rental service, taxi stand, public transit connection.
- 13 miles: INDEPENDENCE (600 S. GRAND AVE.) . Services: free short-term parking, call for taxi service.
- 15 miles: LEE'S SUMMIT (220 S. MAIN ST.) . Services: enclosed waiting area, public payphones, free short-term parking, free long-term parking, call for taxi service.
Colleges/universities with over 2000 students nearest to Prairie Village:
- Wright Career College (about 5 miles; Overland Park, KS; Full-time enrollment: 3,107)
- University of Missouri-Kansas City (about 5 miles; Kansas City, MO; FT enrollment: 10,544)
- Rockhurst University (about 5 miles; Kansas City, MO; FT enrollment: 2,013)
- Metropolitan Community College-Kansas City (about 6 miles; Kansas City, MO; FT enrollment: 12,834)
- Johnson County Community College (about 7 miles; Overland Park, KS; FT enrollment: 11,976)
- Kansas City Kansas Community College (about 11 miles; Kansas City, KS; FT enrollment: 4,718)
- MidAmerica Nazarene University (about 12 miles; Olathe, KS; FT enrollment: 2,158)
Private high school in Prairie Village:
Points of interest:
Notable locations in Prairie Village: Meadow Lake Country Club (A), Meadowbrook Country Club (B), Homestead Country Club (C), Roe 89 Shops (D), Somerset Plaza Shops (E), Southgate Financial Center (F), Greenview Place (G), Somerset Plaza (H), Prairie Village Municipal Office Complex (I), Meadowbrook Executive Building (J), Corinth Square (K), Corinth Library (L), Prairie Village City Hall (M), KCSP - AM (Mission) (N), Claridge Court Assisted Living Facility (O), Brighton Gardens of Prairie Village Assisted Living Facility and Nursing Home (P), Johnson County Medical Action Station 33 (Q), Johnson County Medical Action Station 23 (R), Consolidated Fire District 2 Station 3 (S), Prairie Village Police Department (T). Display/hide their locations on the map
Shopping Centers: Jimmys Block Shopping Center (1), Trailwood Shopping Center (2), Highland Village Shopping Center (3), Nall Hills Shopping Center (4). Display/hide their locations on the map
Churches in Prairie Village include: Hillcrest Covenant Church (A), Unitarian Universalist Fellowship (B), Village Presbyterian Church (C), Trinity Baptist Church (D), Zion Lutheran Church (E), Southminster Presbyterian Church (F), Southwest Bible Church (G), Pathway Church (H), Prairie Baptist Church (I). Display/hide their locations on the map
Cemeteries: Corinth Cemetery (1), Highland Cemetery (2), Woolford Farm Horse Cemetery (3). Display/hide their locations on the map
Parks in Prairie Village include: Porter Park (1), Austin Harmon Park (2), Bennett Park (3), Austin Harmon Park Pool (4), Franklin Park (5), McCrum Park (6), Meadow Lake Park (7), Santa Fe Trail Park (8), Windsor Park (9). Display/hide their locations on the map
Birthplace of: Joyce DiDonato - Opera mezzo-soprano, Jim Roth - Politician, Marci Francisco - Politician, Nancy Opel - Actress.
Drinking water stations with addresses in Prairie Village that have no violations reported:
- CRYSTAL BEACH SUBD (Serves MO, Population served: 91, Primary Water Source Type: Groundwater)
| This city: | 2.2 people |
| Kansas: | 2.5 people |
| This city: | 59.5% |
| Whole state: | 66.0% |
| This city: | 4.3% |
| Whole state: | 5.8% |
Likely homosexual households (counted as self-reported same-sex unmarried-partner households)
- Lesbian couples: 0.4% of all households
- Gay men: 0.3% of all households
8 people in group homes intended for adults in 2010
People in group quarters in Prairie Village in 2000:
- 150 people in nursing homes
- 31 people in hospitals/wards and hospices for chronically ill
- 31 people in hospices or homes for chronically ill
- 6 people in homes or halfway houses for drug/alcohol abuse
- 3 people in other nonhousehold living situations
Banks with most branches in Prairie Village (2011 data):
- Capitol Federal Savings Bank: State Line Branch at 1900 W 75th St, branch established on 1893/01/01; Corinth Hen House Branch at 4050 W 83rd St, branch established on 2004/06/04. Info updated 2011/07/21: Bank assets: $9,167.4 mil, Deposits: $4,742.9 mil, headquarters in Topeka, KS, positive income, Mortgage Lending Specialization, 46 total offices
- U.S. Bank National Association: Mission Road Branch at 6940 Mission Road, branch established on 1939/07/05; 95th Street Branch at 5100 West 95th Street, branch established on 1975/01/15. Info updated 2012/01/30: Bank assets: $330,470.8 mil, Deposits: $236,091.5 mil, headquarters in Cincinnati, OH, positive income, 3121 total offices, Holding Company: U.S. Bancorp
- Great Southern Bank: Prairie Village Branch at 5206 West 95th Street, branch established on 1989/06/30. Info updated 2012/02/03: Bank assets: $3,788.7 mil, Deposits: $2,986.3 mil, headquarters in Reeds Spring, MO, positive income, Commercial Lending Specialization, 109 total offices, Holding Company: Great Southern Bancorp, Inc.
- Bank of Prairie Village: Bank Of Prairie Village at 3515 W. 75th Street, branch established on 1931/02/27. Info updated 2008/01/02: Bank assets: $100.2 mil, Deposits: $91.0 mil, local headquarters, positive income, Commercial Lending Specialization, 1 total offices, Holding Company: Blue Lion Bancshares, Inc.
- Inter-State Federal Savings and Loan Association of Kansas City: 8000 State Line Branch at 8000 State Line Rd, branch established on 1889/01/01. Info updated 2011/07/21: Bank assets: $250.8 mil, Deposits: $158.2 mil, headquarters in Kansas City, KS, positive income, Mortgage Lending Specialization, 5 total offices
- The Mission Bank: Prairie Village Branch at 8201 Mission Road, branch established on 2000/10/11. Info updated 2008/02/19: Bank assets: $555.4 mil, Deposits: $380.7 mil, headquarters in Mission, KS, positive income, Commercial Lending Specialization, 7 total offices, Holding Company: Valley View Bancshares, Inc.
- Intrust Bank, National Association: 4000 Somerset Drive Branch at 4000 Somerset Drive, branch established on 1990/08/10. Info updated 2007/03/28: Bank assets: $4,066.0 mil, Deposits: $3,310.3 mil, headquarters in Wichita, KS, positive income, Commercial Lending Specialization, 48 total offices, Holding Company: Intrust Financial Corporation
- UMB Bank, National Association: Village Branch at 6900 Mission Road, branch established on 2011/10/22. Info updated 2007/12/13: Bank assets: $11,205.9 mil, Deposits: $8,538.8 mil, headquarters in Kansas City, MO, positive income, 107 total offices, Holding Company: Umb Financial Corporation
- Missouri Bank and Trust Company of Kansas City: Prairie Village Branch at 4140 West 71st Street, branch established on 2000/11/21. Info updated 2010/08/12: Bank assets: $465.9 mil, Deposits: $421.3 mil, headquarters in Kansas City, MO, positive income, Commercial Lending Specialization, 4 total offices, Holding Company: Mbt Bancshares, Inc.
- 2 other banks with 2 local branches
For population 15 years and over in Prairie Village:
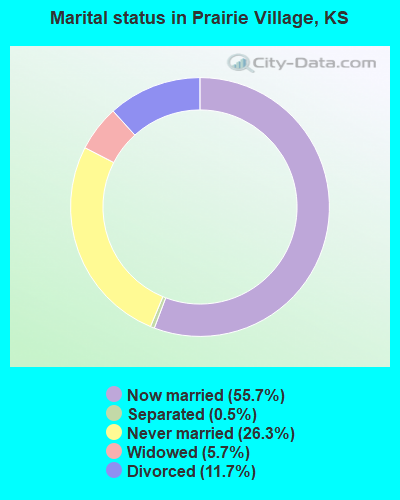
- Never married: 26.3%
- Now married: 55.7%
- Separated: 0.5%
- Widowed: 5.7%
- Divorced: 11.7%
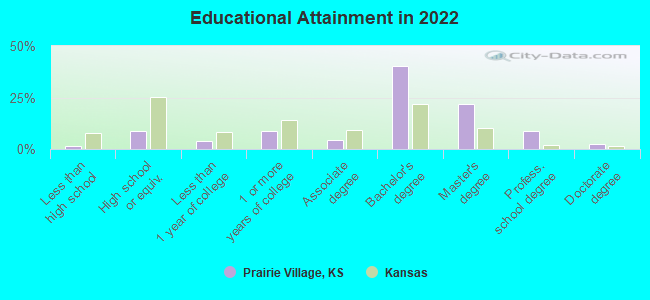
For population 25 years and over in Prairie Village:
- High school or higher: 98.4%
- Bachelor's degree or higher: 71.9%
- Graduate or professional degree: 31.1%
- Unemployed: 2.1%
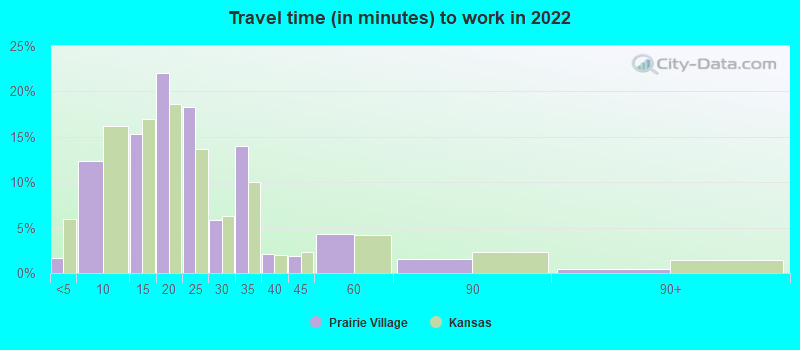
- Mean travel time to work (commute): 15.3 minutes
| Here: | 8.3 |
| Kansas average: | 11.5 |
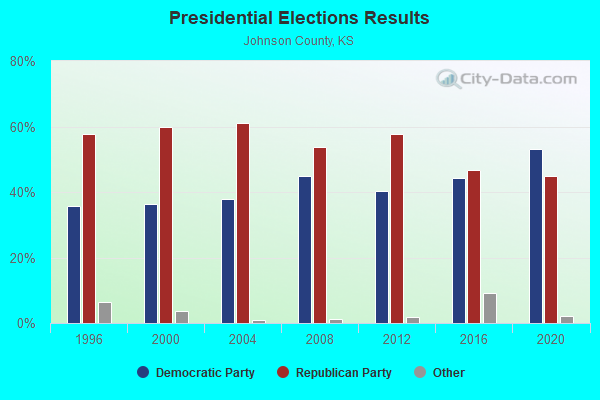
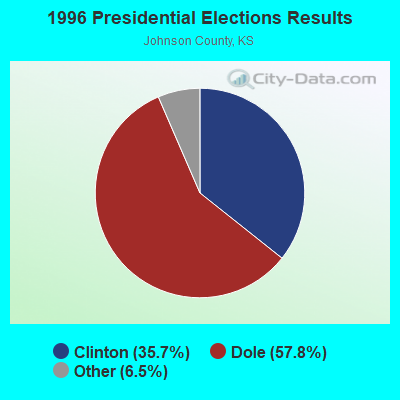
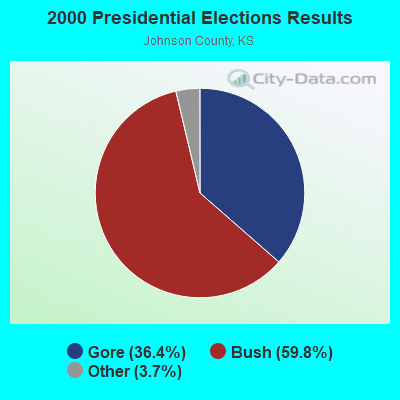
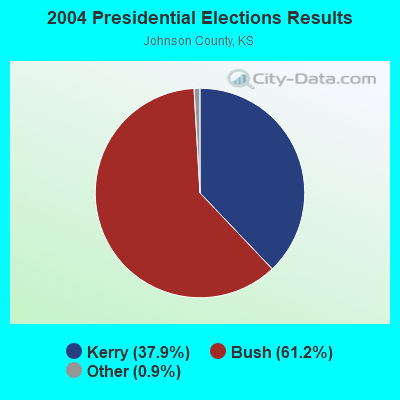
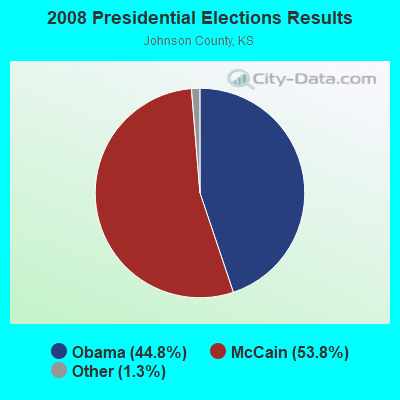

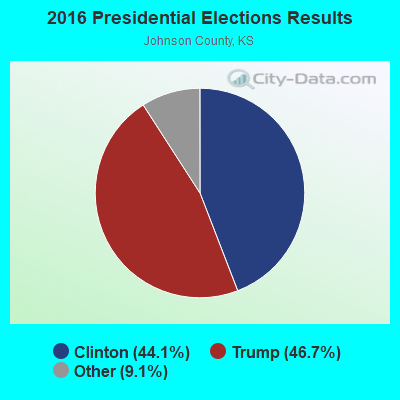
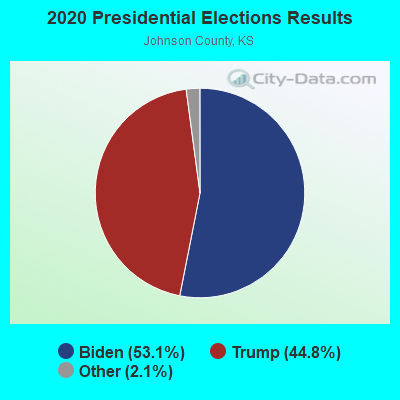
Graphs represent county-level data. Detailed 2008 Election Results
Political contributions by individuals in Prairie Village, KS
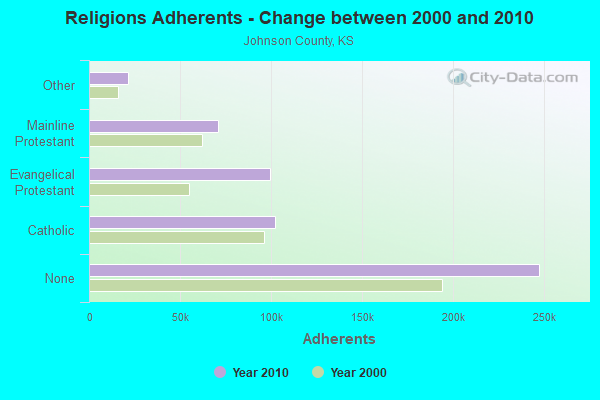
Religion statistics for Prairie Village, KS (based on Johnson County data)
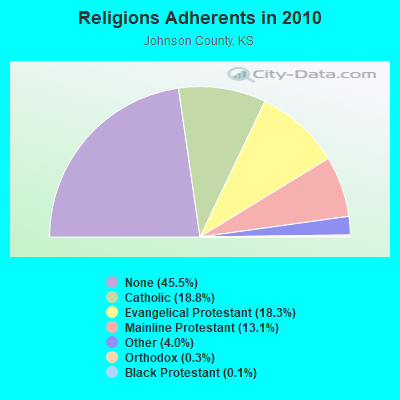
| Religion | Adherents | Congregations |
|---|---|---|
| Catholic | 102,131 | 18 |
| Evangelical Protestant | 99,699 | 190 |
| Mainline Protestant | 71,068 | 87 |
| Other | 21,644 | 46 |
| Orthodox | 1,505 | 5 |
| Black Protestant | 642 | 4 |
| None | 247,490 | - |
Food Environment Statistics:
| Johnson County: | 1.37 / 10,000 pop. |
| Kansas: | 1.96 / 10,000 pop. |
| Johnson County: | 0.19 / 10,000 pop. |
| State: | 0.20 / 10,000 pop. |
| Johnson County: | 0.25 / 10,000 pop. |
| Kansas: | 0.51 / 10,000 pop. |
| Johnson County: | 2.29 / 10,000 pop. |
| State: | 3.84 / 10,000 pop. |
| Johnson County: | 7.39 / 10,000 pop. |
| Kansas: | 7.33 / 10,000 pop. |
| This county: | 6.0% |
| Kansas: | 8.1% |
| Johnson County: | 23.0% |
| Kansas: | 27.9% |
| This county: | 12.6% |
| State: | 13.4% |
Health and Nutrition:
| This city: | 57.8% |
| State: | 49.2% |
| This city: | 58.0% |
| Kansas: | 46.3% |
| This city: | 28.0 |
| Kansas: | 28.6 |
| Prairie Village: | 17.4% |
| State: | 21.2% |
| Prairie Village: | 8.4% |
| Kansas: | 10.5% |
| Here: | 7.0 |
| State: | 6.8 |
| This city: | 35.0% |
| Kansas: | 33.5% |
| Prairie Village: | 63.1% |
| Kansas: | 56.0% |
| Prairie Village: | 80.3% |
| Kansas: | 78.6% |
More about Health and Nutrition of Prairie Village, KS Residents
| Local government employment and payroll (March 2022) | |||||
| Function | Full-time employees | Monthly full-time payroll | Average yearly full-time wage | Part-time employees | Monthly part-time payroll |
|---|---|---|---|---|---|
| Police Protection - Officers | 47 | $275,395 | $70,314 | 1 | $1,355 |
| Streets and Highways | 12 | $74,024 | $74,024 | 0 | $0 |
| Other and Unallocable | 10 | $58,136 | $69,763 | 1 | $962 |
| Other Government Administration | 9 | $73,036 | $97,381 | 0 | $0 |
| Parks and Recreation | 6 | $27,333 | $54,666 | 4 | $7,546 |
| Sewerage | 6 | $29,822 | $59,644 | 0 | $0 |
| Judicial and Legal | 5 | $22,234 | $53,362 | 0 | $0 |
| Financial Administration | 4 | $28,987 | $86,961 | 1 | $400 |
| Police - Other | 1 | $5,888 | $70,656 | 0 | $0 |
| Natural Resources | 1 | $4,406 | $52,872 | 0 | $0 |
| Totals for Government | 101 | $599,261 | $71,199 | 7 | $10,263 |
Prairie Village government finances - Expenditure in 2021 (per resident):
- Construction - General - Other: $5,920,000 ($257.99)
General Public Buildings: $3,591,000 ($156.49)
Parks and Recreation: $789,000 ($34.38)
- Current Operations - Police Protection: $7,197,000 ($313.64)
General - Other: $5,705,000 ($248.62)
Solid Waste Management: $1,852,000 ($80.71)
Central Staff Services: $1,266,000 ($55.17)
Judicial and Legal Services: $456,000 ($19.87)
Financial Administration: $347,000 ($15.12)
General Public Buildings: $304,000 ($13.25)
Parks and Recreation: $287,000 ($12.51)
- General - Interest on Debt: $86,000 ($3.75)
- Other Capital Outlay - Police Protection: $188,000 ($8.19)
- Total Salaries and Wages: $7,548,000 ($328.93)
Prairie Village government finances - Revenue in 2021 (per resident):
- Charges - Solid Waste Management: $1,963,000 ($85.54)
Parks and Recreation: $30,000 ($1.31)
- Local Intergovernmental - Highways: $5,422,000 ($236.28)
Other: $689,000 ($30.03)
General Local Government Support: $73,000 ($3.18)
- Miscellaneous - General Revenue - Other: $1,657,000 ($72.21)
Fines and Forfeits: $698,000 ($30.42)
Interest Earnings: $434,000 ($18.91)
Sale of Property: $89,000 ($3.88)
- State Intergovernmental - Highways: $585,000 ($25.49)
General Local Government Support: $329,000 ($14.34)
- Tax - Property: $9,738,000 ($424.37)
General Sales and Gross Receipts: $4,678,000 ($203.86)
Occupation and Business License - Other: $2,158,000 ($94.04)
Alcoholic Beverage License: $6,000 ($0.26)
Prairie Village government finances - Debt in 2021 (per resident):
- Long Term Debt - Beginning Outstanding - Public Debt for Private Purpose: $40,045,000 ($1745.11)
Outstanding Nonguaranteed - Industrial Revenue: $40,045,000 ($1745.11)
Beginning Outstanding - Unspecified Public Purpose: $24,630,000 ($1073.34)
Outstanding Unspecified Public Purpose: $23,295,000 ($1015.17)
Retired Unspecified Public Purpose: $1,335,000 ($58.18)
Prairie Village government finances - Cash and Securities in 2021 (per resident):
- Other Funds - Cash and Securities: $20,631,000 ($899.07)
- Sinking Funds - Cash and Securities: $40,045,000 ($1745.11)
7.16% of this county's 2021 resident taxpayers lived in other counties in 2020 ($81,232 average adjusted gross income)
| Here: | 7.16% |
| Kansas average: | 6.64% |
0.01% of residents moved from foreign countries ($131 average AGI)
Johnson County: 0.01% Kansas average: 0.04%
Top counties from which taxpayers relocated into this county between 2020 and 2021:
| from Jackson County, MO | |
| from Wyandotte County, KS | |
| from Douglas County, KS |
6.77% of this county's 2020 resident taxpayers moved to other counties in 2021 ($90,064 average adjusted gross income)
| Here: | 6.77% |
| Kansas average: | 6.88% |
0.01% of residents moved to foreign countries ($58 average AGI)
Johnson County: 0.01% Kansas average: 0.03%
Top counties to which taxpayers relocated from this county between 2020 and 2021:
| to Jackson County, MO | |
| to Wyandotte County, KS | |
| to Douglas County, KS |
| Businesses in Prairie Village, KS | ||||
| Name | Count | Name | Count | |
|---|---|---|---|---|
| Ace Hardware | 1 | Motherhood Maternity | 1 | |
| Arby's | 1 | New Balance | 2 | |
| Baskin-Robbins | 1 | Panda Express | 1 | |
| Blockbuster | 1 | Panera Bread | 1 | |
| CVS | 1 | Starbucks | 1 | |
| Chico's | 1 | Subway | 1 | |
| Curves | 1 | UPS | 7 | |
| FedEx | 1 | Walgreens | 1 | |
| JoS. A. Bank | 1 | YMCA | 1 | |
| Macy's | 1 | |||
Strongest AM radio stations in Prairie Village:
- KCSP (610 AM; 5 kW; KANSAS CITY, MO; Owner: ENTERCOM KANSAS CITY LICENSE, LLC)
- KXTR (1660 AM; 10 kW; KANSAS CITY, KS; Owner: ENTERCOM KANSAS CITY LICENSE, LLC)
- KMBZ (980 AM; 5 kW; KANSAS CITY, MO; Owner: ENTERCOM KANSAS CITY LICENSE, LLC)
- KCCV (760 AM; daytime; 6 kW; OVERLAND PARK, KS; Owner: BOTT BROADCASTING COMPANY)
- WHB (810 AM; 50 kW; KANSAS CITY, MO; Owner: UNION BROADCASTING, INC.)
- KKHK (1250 AM; 25 kW; KANSAS CITY, KS)
- KPHN (1190 AM; 5 kW; KANSAS CITY, MO; Owner: ABC, INC.)
- KCTE (1510 AM; daytime; 10 kW; INDEPENDENCE, MO; Owner: UNION BROADCASTING, INC.)
- KCNW (1380 AM; 2 kW; FAIRWAY, KS; Owner: KANSAS CITY RADIO, INC.)
- KCMO (710 AM; 10 kW; KANSAS CITY, MO; Owner: SUSQUEHANNA KANSAS CITY PARTNERSHIP)
- KCZZ (1480 AM; 1 kW; MISSION, KS; Owner: HMEB COMMUNICATIONS, L.L.C.)
- KPRT (1590 AM; 1 kW; KANSAS CITY, MO; Owner: CARTER BROADCAST GROUP, INC.)
- KCKN (1340 AM; 1 kW; KANSAS CITY, KS; Owner: CARTER BROADCAST GROUP, INC.)
Strongest FM radio stations in Prairie Village:
- KZPL (97.3 FM; LEE'S SUMMIT, MO; Owner: UNION FIRST BROADCASTING, LLC)
- KCMO-FM (94.9 FM; KANSAS CITY, MO; Owner: SUSQUEHANNA KANSAS CITY PARTNERSHIP)
- KQRC-FM (98.9 FM; LEAVENWORTH, KS; Owner: ENTERCOM KANSAS CITY LICENSE, LLC)
- KRBZ (96.5 FM; KANSAS CITY, MO; Owner: ENTERCOM KANSAS CITY LICENSE, LLC)
- KYYS (99.7 FM; KANSAS CITY, MO; Owner: ENTERCOM KANSAS CITY LICENSE, LLC)
- KMXV (93.3 FM; KANSAS CITY, MO; Owner: INFINITY RADIO OPERATIONS INC.)
- KPRS (103.3 FM; KANSAS CITY, MO; Owner: CARTER BROADCAST GROUP, INC.)
- KFKF-FM (94.1 FM; KANSAS CITY, KS; Owner: INFINITY RADIO SUBSIDIARY OPERATIONS INC.)
- WDAF-FM (106.5 FM; LIBERTY, MO; Owner: ENTERCOM KANSAS CITY LICENSE, LLC)
- KUDL (98.1 FM; KANSAS CITY, KS; Owner: ENTERCOM KANSAS CITY LICENSE, LLC)
- KSRC (102.1 FM; KANSAS CITY, MO; Owner: INFINITY RADIO OPERATIONS INC.)
- KBEQ-FM (104.3 FM; KANSAS CITY, MO; Owner: INFINITY RADIO SUBSIDIARY OPERATIONS INC.)
- KCUR-FM (89.3 FM; KANSAS CITY, MO; Owner: CURATORS OF UNIVERSITY OF MISSOURI)
- KLJC (88.5 FM; KANSAS CITY, MO; Owner: CALVARY BIBLE COLLEGE)
- KKFI (90.1 FM; KANSAS CITY, MO; Owner: MID-COAST RADIO PROJECT, INC.)
- KCFX (101.1 FM; HARRISONVILLE, MO; Owner: SUSQUEHANNA KANSAS CITY PARTNERSHIP)
- KCCV-FM (92.3 FM; OLATHE, KS; Owner: BOTT BROADCASTING COMPANY)
- KMJK (107.3 FM; LEXINGTON, MO; Owner: ALLUR-KANSAS CITY, INC.)
- KANU (91.5 FM; LAWRENCE, KS; Owner: UNIVERSITY OF KANSAS)
TV broadcast stations around Prairie Village:
- KMCI (Channel 38; LAWRENCE, KS; Owner: SCRIPPS HOWARD BROADCASTING COMPANY)
- KCTV (Channel 5; KANSAS CITY, MO; Owner: MEREDITH CORPORATION)
- KSHB-TV (Channel 41; KANSAS CITY, MO; Owner: SCRIPPS HOWARD BROADCASTING COMPANY)
- WDAF-TV (Channel 4; KANSAS CITY, MO; Owner: WDAF LICENSE, INC.)
- KPXE (Channel 50; KANSAS CITY, MO; Owner: PAXSON KANSAS CITY LICENSE, INC.)
- KMBC-TV (Channel 9; KANSAS CITY, MO; Owner: KMBC HEARST-ARGYLE TELEVISION, INC.)
- K35CT (Channel 35; KANSAS CITY, MO; Owner: WORD OF GOD FELLOWSHIP, INC.)
- KCWE (Channel 29; KANSAS CITY, MO; Owner: KCWE-TV, INC.)
- KCPT (Channel 19; KANSAS CITY, MO; Owner: PUBLIC TELEVISION 19, INC.)
- KSMO-TV (Channel 62; KANSAS CITY, MO; Owner: KSMO LICENSEE, INC.)
- K48FS (Channel 48; KANSAS CITY, MO; Owner: WORD OF GOD FELLOWSHIP, INC.)
- K26CR (Channel 26; KANSAS CITY, MO; Owner: VENTANA TELEVISION, INC.)
- K27FR (Channel 27; OVERLAND PARK, KS; Owner: UNIVERSITY OF KANSAS)
- KTAJ (Channel 16; ST. JOSEPH, MO; Owner: TRINITY BROADCASTING NETWORK)
- National Bridge Inventory (NBI) Statistics
- 5Number of bridges
- 36ft / 10.5mTotal length
- $6,000Total costs
- 60,346Total average daily traffic
- 2,418Total average daily truck traffic
- 80,162Total future (year 2040) average daily traffic
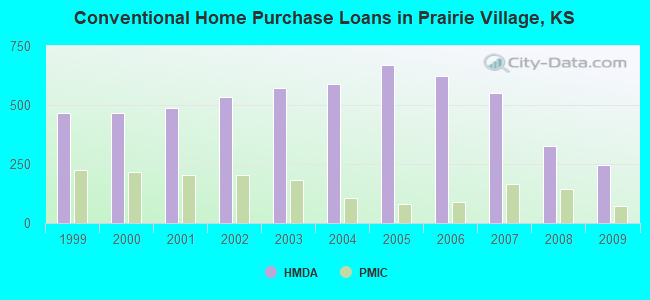
| Home Mortgage Disclosure Act Aggregated Statistics For Year 2009 (Based on 4 full and 3 partial tracts) | ||||||||||||||
| A) FHA, FSA/RHS & VA Home Purchase Loans | B) Conventional Home Purchase Loans | C) Refinancings | D) Home Improvement Loans | E) Loans on Dwellings For 5+ Families | F) Non-occupant Loans on < 5 Family Dwellings (A B C & D) | G) Loans On Manufactured Home Dwelling (A B C & D) | ||||||||
|---|---|---|---|---|---|---|---|---|---|---|---|---|---|---|
| Number | Average Value | Number | Average Value | Number | Average Value | Number | Average Value | Number | Average Value | Number | Average Value | Number | Average Value | |
| LOANS ORIGINATED | 179 | $158,705 | 245 | $190,579 | 893 | $199,599 | 30 | $59,365 | 1 | $557,270 | 42 | $144,662 | 3 | $187,113 |
| APPLICATIONS APPROVED, NOT ACCEPTED | 12 | $178,876 | 16 | $163,753 | 56 | $221,264 | 4 | $8,000 | 0 | $0 | 3 | $81,807 | 0 | $0 |
| APPLICATIONS DENIED | 13 | $176,515 | 13 | $153,525 | 147 | $215,279 | 18 | $56,326 | 0 | $0 | 9 | $147,567 | 0 | $0 |
| APPLICATIONS WITHDRAWN | 19 | $173,092 | 23 | $197,063 | 142 | $193,646 | 6 | $106,100 | 0 | $0 | 5 | $129,004 | 0 | $0 |
| FILES CLOSED FOR INCOMPLETENESS | 0 | $0 | 5 | $323,094 | 24 | $220,266 | 3 | $102,903 | 0 | $0 | 1 | $76,420 | 1 | $76,420 |
Detailed HMDA statistics for the following Tracts: 0507.00 , 0509.00, 0510.00, 0513.00, 0514.00, 0515.00, 0518.01
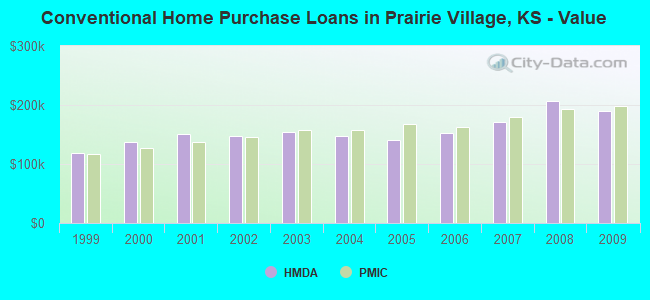
| Private Mortgage Insurance Companies Aggregated Statistics For Year 2009 (Based on 4 full and 3 partial tracts) | ||||
| A) Conventional Home Purchase Loans | B) Refinancings | |||
|---|---|---|---|---|
| Number | Average Value | Number | Average Value | |
| LOANS ORIGINATED | 72 | $198,072 | 53 | $215,412 |
| APPLICATIONS APPROVED, NOT ACCEPTED | 6 | $223,707 | 8 | $197,449 |
| APPLICATIONS DENIED | 5 | $232,604 | 8 | $224,226 |
| APPLICATIONS WITHDRAWN | 2 | $154,805 | 6 | $257,988 |
| FILES CLOSED FOR INCOMPLETENESS | 0 | $0 | 1 | $334,000 |
Detailed PMIC statistics for the following Tracts: 0507.00 , 0509.00, 0510.00, 0513.00, 0514.00, 0515.00, 0518.01
2002 - 2018 National Fire Incident Reporting System (NFIRS) incidents
- Fire incident types reported to NFIRS in Prairie Village, KS
- 28958.9%Structure Fires
- 14629.7%Outside Fires
- 469.4%Mobile Property/Vehicle Fires
- 102.0%Other
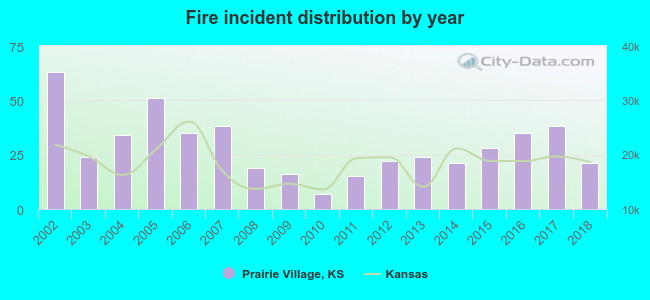 Based on the data from the years 2002 - 2018 the average number of fires per year is 29. The highest number of fire incidents - 63 took place in 2002, and the least - 7 in 2010. The data has a dropping trend.
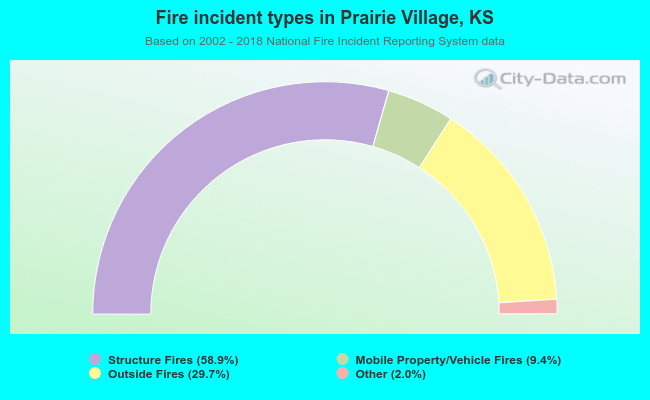 When looking into fire subcategories, the most incidents belonged to: Structure Fires (58.9%), and Outside Fires (29.7%).
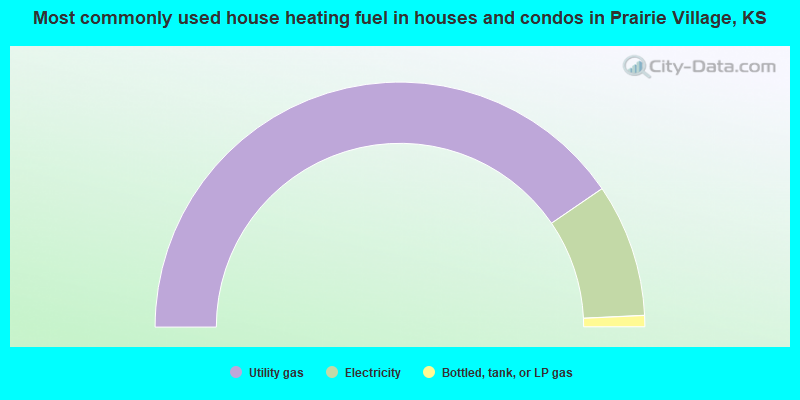
- 80.9%Utility gas
- 17.6%Electricity
- 1.5%Bottled, tank, or LP gas
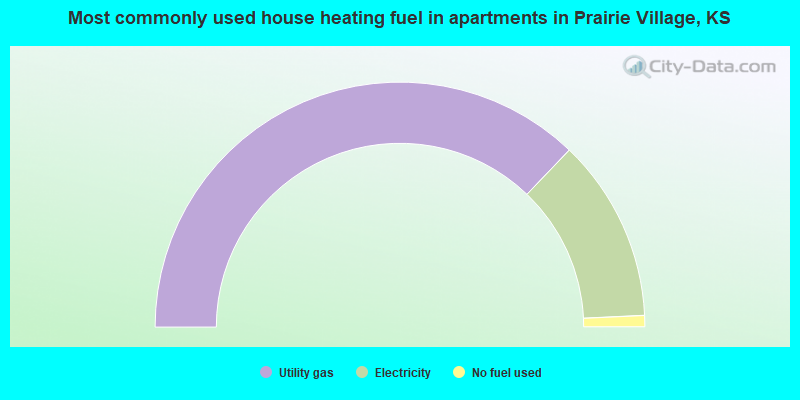
- 74.3%Utility gas
- 24.2%Electricity
- 1.5%No fuel used
Prairie Village compared to Kansas state average:
- Median house value above state average.
- Unemployed percentage significantly below state average.
- Black race population percentage significantly below state average.
- Hispanic race population percentage below state average.
- Median age significantly above state average.
- Foreign-born population percentage significantly below state average.
- Renting percentage below state average.
- Length of stay since moving in significantly above state average.
- Percentage of population with a bachelor's degree or higher significantly above state average.
Prairie Village on our top lists:
- #52 on the list of "Top 101 cities with the largest percentage of people in hospices or homes for chronically ill (population 1,000+)"
- #9 on the list of "Top 101 counties with the best general health status score of residents (1-5), 3 years of data"
- #11 on the list of "Top 101 counties with the highest percentage of residents that visited a dentist within the past year"
- #31 on the list of "Top 101 counties with the largest number of people without health insurance coverage in 2000 (pop. 50,000+)"
- #33 on the list of "Top 101 counties with the largest number of children under 18 without health insurance coverage in 2000 (pop. 50,000+)"
- #36 on the list of "Top 101 counties with the highest percentage of residents that exercised in the past month"

|
|
Total of 402 patent applications in 2008-2024.