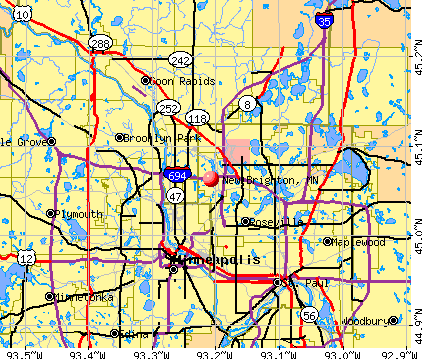
New Brighton, Minnesota
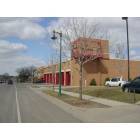
New Brighton: Fire Station

New Brighton: Wildlife on the Long Lake New Brighton

New Brighton: Wildlife on the shores of Long Lake New Brighton
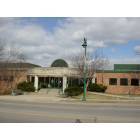
New Brighton: City Hall
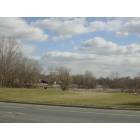
New Brighton: Hanson Park
- add
your
Submit your own pictures of this city and show them to the world
- OSM Map
- General Map
- Google Map
- MSN Map
Population change since 2000: +0.9%
 |
| Males: 10,793 | |
| Females: 11,620 |
| Median resident age: | 38.0 years |
| Minnesota median age: | 39.0 years |
Zip codes: 55112.
| New Brighton: | $81,459 |
| MN: | $82,338 |
Estimated per capita income in 2022: $44,158 (it was $27,574 in 2000)
New Brighton city income, earnings, and wages data
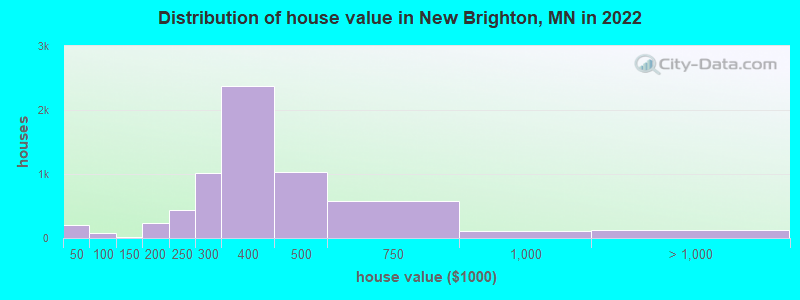
Estimated median house or condo value in 2022: $361,641 (it was $141,000 in 2000)
| New Brighton: | $361,641 |
| MN: | $314,600 |
Mean prices in 2022: all housing units: $358,760; detached houses: $383,949; townhouses or other attached units: $290,037; in 2-unit structures: $364,962; in 3-to-4-unit structures: $275,757; in 5-or-more-unit structures: $217,208; mobile homes: $33,711
Median gross rent in 2022: $1,273.
(5.7% for White Non-Hispanic residents, 37.7% for Black residents, 8.3% for Hispanic or Latino residents, 16.1% for other race residents, 8.8% for two or more races residents)
Detailed information about poverty and poor residents in New Brighton, MN

Compare current foreclosures near New Brighton, MN:
| Photo | Address | Area | Beds / Baths | Price | Details |
|---|---|---|---|---|---|

|
#1
Bedford Ave
Minneapolis, MN 55436
|
1,726 sq. feet
|
1 baths 3 beds |
$299,900
|
show details |

|
#2
W 44th St Apt 7
Minneapolis, MN 55410
|
710 sq. feet
|
1 baths 2 beds |
$169,900
|
show details |

|
#3
Granite St
Saint Paul, MN 55117
|
2,136 sq. feet
|
2 baths 4 beds |
$172,000
|
show details |

|
#4
Harriet Ave Apt 111
Minneapolis, MN 55408
|
602 sq. feet
|
1 baths 1 beds |
$83,125
|
show details |

|
#5
Parklawn Ave Apt 109
Minneapolis, MN 55435
|
1,121 sq. feet
|
2 baths 2 beds |
$105,000
|
show details |

|
#6
Lakeview Point Dr NE
Wyoming, MN 55092
|
2,269 sq. feet
|
2 baths 4 beds |
$379,900
|
show details |

|
#7
Quebec Ave N
Minneapolis, MN 55428
|
1,226 sq. feet
|
1 baths 2 beds |
$334,500
|
show details |

|
#8
1st Ave S
Minneapolis, MN 55408
|
1,932 sq. feet
|
2 baths 3 beds |
$369,900
|
show details |

|
#9
Groveland Ave Apt 1708
Minneapolis, MN 55403
|
739 sq. feet
|
1 baths 1 beds |
$98,000
|
show details |

|
#10
Portland Ave # 1412
Minneapolis, MN 55415
|
1,333 sq. feet
|
2 baths 2 beds |
$424,900
|
show details |
| Photo | Address | Area | Beds / Baths | Price | Details |
|---|---|---|---|---|---|

|
#11
Wacouta St Unit Unit Gl-D
Saint Paul, MN 55101
|
- sq. feet
|
1 baths 1 beds |
$179,900
|
show details |

|
#12
Rice Creek Ter
Saint Paul, MN 55112
|
2,248 sq. feet
|
2 baths 4 beds |
show details | |

|
#13
102nd Ave NE
Minneapolis, MN 55434
|
1,101 sq. feet
|
2 baths 3 beds |
show details | |

|
#14
Girard Ave N
Minneapolis, MN 55411
|
768 sq. feet
|
1 baths 2 beds |
show details | |

|
#15
Belmont Ln W
Saint Paul, MN 55113
|
978 sq. feet
|
1 baths 3 beds |
show details | |

|
#16
Emerald Dr
Saint Paul, MN 55110
|
1,787 sq. feet
|
2 baths 5 beds |
show details | |

|
#17
45th Ave S
Minneapolis, MN 55417
|
998 sq. feet
|
2 baths 3 beds |
show details | |

|
#18
Dupont Ave N
Minneapolis, MN 55430
|
720 sq. feet
|
1 baths 2 beds |
show details | |

|
#19
5th St NE
Minneapolis, MN 55432
|
1,820 sq. feet
|
2 baths 3 beds |
show details | |

|
#20
Flanders Rd
Saint Paul, MN 55109
|
1,640 sq. feet
|
2 baths 4 beds |
show details |
| Photo | Address | Area | Beds / Baths | Price | Details |
|---|---|---|---|---|---|

|
#21
8th Ave S
South Saint Paul, MN 55075
|
761 sq. feet
|
1 baths 2 beds |
show details | |

|
#22
Geranium Ave E
Saint Paul, MN 55130
|
2,112 sq. feet
|
2 baths 6 beds |
show details | |

|
#23
13th Ave S
Minneapolis, MN 55417
|
849 sq. feet
|
1 baths 2 beds |
show details | |

|
#24
Rose Ave E
Saint Paul, MN 55106
|
1,565 sq. feet
|
1 baths 4 beds |
show details | |

|
#25
Dogwood St NW
Minneapolis, MN 55448
|
1,092 sq. feet
|
1 baths 3 beds |
show details | |

|
#26
Jackson St
Saint Paul, MN 55117
|
1,362 sq. feet
|
2 baths 3 beds |
show details | |

|
#27
Queen Ave N
Minneapolis, MN 55411
|
1,494 sq. feet
|
2 baths 3 beds |
show details | |

|
#28
48th St N
Saint Paul, MN 55128
|
1,323 sq. feet
|
2 baths 2 beds |
show details | |

|
#29
Ash St
Saint Paul, MN 55126
|
1,353 sq. feet
|
1 baths 3 beds |
show details | |

|
#30
Florida Ave N
Champlin, MN 55316
|
1,976 sq. feet
|
2 baths 3 beds |
show details |
| Photo | Address | Area | Beds / Baths | Price | Details |
|---|---|---|---|---|---|

|
#31
Payne Ave
Saint Paul, MN 55130
|
962 sq. feet
|
1 baths 2 beds |
show details | |

|
#32
Girard Ave N
Minneapolis, MN 55430
|
1,058 sq. feet
|
1 baths 2 beds |
show details | |

|
#33
Irving Ave N
Minneapolis, MN 55411
|
1,456 sq. feet
|
1 baths 3 beds |
show details | |

|
#34
7th St N
Saint Paul, MN 55128
|
874 sq. feet
|
1 baths 3 beds |
show details | |

|
#35
Galtier St
Saint Paul, MN 55117
|
816 sq. feet
|
1 baths 2 beds |
show details | |

|
#36
Beard Rd
Minneapolis, MN 55431
|
1,115 sq. feet
|
1 baths 3 beds |
show details | |

|
#37
72nd Ln N Apt 202
Minneapolis, MN 55428
|
892 sq. feet
|
1 baths 2 beds |
show details | |

|
#38
84th Ct N
Minneapolis, MN 55445
|
850 sq. feet
|
1 baths 2 beds |
show details | |

|
#39
Bidwell St
Saint Paul, MN 55107
|
1,108 sq. feet
|
2 baths 2 beds |
show details | |

|
#40
Chasewood Pkwy Apt 104
Hopkins, MN 55343
|
1,096 sq. feet
|
2 baths 2 beds |
show details |
| Photo | Address | Area | Beds / Baths | Price | Details |
|---|---|---|---|---|---|

|
#41
18th Ave N
Hopkins, MN 55343
|
900 sq. feet
|
1 baths 3 beds |
show details | |

|
#42
78th Ave NE
Minneapolis, MN 55432
|
919 sq. feet
|
1 baths 2 beds |
show details | |

|
#43
Penn Ave N
Minneapolis, MN 55411
|
1,089 sq. feet
|
1 baths 3 beds |
show details | |

|
#44
Burma Ln
South Saint Paul, MN 55075
|
1,133 sq. feet
|
1 baths 3 beds |
show details | |

|
#45
Goodrich Ave
Saint Paul, MN 55102
|
1,350 sq. feet
|
1 baths 2 beds |
show details | |

|
#46
Clinton Ave
Minneapolis, MN 55409
|
854 sq. feet
|
1 baths 3 beds |
show details | |

|
#47
Aldrich Ave S Apt 4
Minneapolis, MN 55409
|
355 sq. feet
|
1 baths 1 beds |
show details | |

|
#48
Cedar St
Saint Paul, MN 55110
|
2,079 sq. feet
|
2 baths 4 beds |
show details | |

|
#49
Wilson Ave
Saint Paul, MN 55106
|
833 sq. feet
|
2 baths 2 beds |
show details | |

|
Check over 1 million property listings on Foreclosure.com!
|
browse all offers | |||


- 14,54964.1%White alone
- 3,71416.4%Black alone
- 1,7427.7%Hispanic
- 1,5276.7%Asian alone
- 9004.0%Two or more races
- 1730.8%Other race alone
- 320.1%American Indian alone
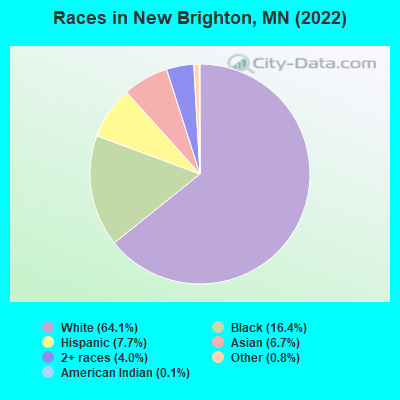
Races in New Brighton detailed stats: ancestries, foreign born residents, place of birth
Type |
2009 |
2010 |
2011 |
2012 |
2013 |
2014 |
2015 |
2016 |
2017 |
2018 |
2019 |
2020 |
2021 |
2022 |
|---|---|---|---|---|---|---|---|---|---|---|---|---|---|---|
| Murders (per 100,000) | 0 (0.0) | 0 (0.0) | 0 (0.0) | 0 (0.0) | 0 (0.0) | 1 (4.5) | 0 (0.0) | 0 (0.0) | 1 (4.4) | 0 (0.0) | 1 (4.3) | 0 (0.0) | 0 (0.0) | 0 (0.0) |
| Rapes (per 100,000) | 2 (9.3) | 2 (9.3) | 2 (9.2) | 4 (18.3) | 2 (9.1) | 2 (9.0) | 0 (0.0) | 3 (13.3) | 5 (22.0) | 6 (26.1) | 2 (8.7) | 4 (17.5) | 8 (34.8) | 6 (22.7) |
| Robberies (per 100,000) | 7 (32.6) | 12 (55.9) | 10 (46.2) | 10 (45.8) | 6 (27.3) | 5 (22.4) | 4 (17.8) | 7 (31.1) | 9 (39.5) | 9 (39.2) | 7 (30.4) | 12 (52.5) | 5 (21.7) | 6 (22.7) |
| Assaults (per 100,000) | 10 (46.5) | 10 (46.6) | 17 (78.6) | 14 (64.1) | 9 (40.9) | 2 (9.0) | 11 (49.0) | 17 (75.5) | 13 (57.1) | 10 (43.5) | 20 (86.7) | 20 (87.6) | 18 (78.2) | 26 (98.5) |
| Burglaries (per 100,000) | 107 (497.8) | 79 (368.2) | 72 (333.0) | 104 (475.9) | 76 (345.5) | 88 (395.0) | 68 (302.7) | 83 (368.5) | 60 (263.5) | 69 (300.3) | 49 (212.5) | 77 (337.1) | 74 (321.6) | 52 (196.9) |
| Thefts (per 100,000) | 403 (1,875) | 462 (2,153) | 383 (1,771) | 441 (2,018) | 436 (1,982) | 429 (1,926) | 391 (1,741) | 404 (1,794) | 486 (2,134) | 461 (2,006) | 361 (1,566) | 490 (2,145) | 557 (2,420) | 376 (1,424) |
| Auto thefts (per 100,000) | 33 (153.5) | 40 (186.4) | 46 (212.7) | 39 (178.5) | 36 (163.7) | 31 (139.2) | 38 (169.2) | 27 (119.9) | 47 (206.4) | 35 (152.3) | 34 (147.5) | 50 (218.9) | 55 (239.0) | 63 (238.6) |
| Arson (per 100,000) | 5 (23.3) | 6 (28.0) | 1 (4.6) | 3 (13.7) | 2 (9.1) | 1 (4.5) | 4 (17.8) | 4 (17.8) | 3 (13.2) | 0 (0.0) | 2 (8.7) | 0 (0.0) | 2 (8.7) | 0 (0.0) |
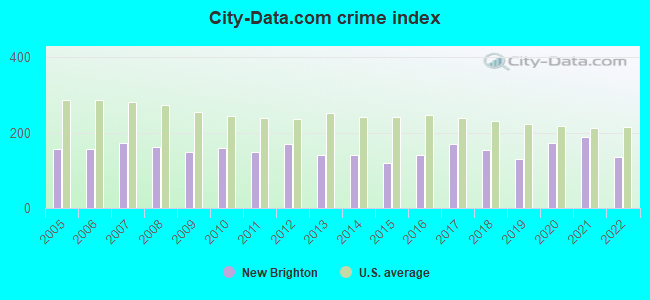
| City-Data.com crime index | 148.6 | 160.4 | 148.2 | 169.5 | 140.2 | 140.5 | 119.5 | 142.2 | 169.9 | 154.8 | 131.4 | 174.2 | 188.4 | 134.5 |
The City-Data.com crime index weighs serious crimes and violent crimes more heavily. Higher means more crime, U.S. average is 246.1. It adjusts for the number of visitors and daily workers commuting into cities.
Crime rate in New Brighton detailed stats: murders, rapes, robberies, assaults, burglaries, thefts, arson
Full-time law enforcement employees in 2021, including police officers: 34 (27 officers - 24 male; 3 female).
| Officers per 1,000 residents here: | 1.17 |
| Minnesota average: | 1.76 |
 Recent articles from our blog. Our writers, many of them Ph.D. graduates or candidates, create easy-to-read articles on a wide variety of topics.


Latest news from New Brighton, MN collected exclusively by city-data.com from local newspapers, TV, and radio stations
New Brighton, MN City Guides:
Ancestries: German (14.2%), Norwegian (6.4%), European (4.4%), Sierra Leonean (3.4%), Kenyan (2.9%), English (2.9%).
Current Local Time: CST time zone
Land area: 6.64 square miles.
Population density: 3,375 people per square mile (average).
3,241 residents are foreign born (6.4% Africa, 3.7% Asia, 2.7% Latin America).
| This city: | 14.3% |
| Minnesota: | 8.5% |
Median real estate property taxes paid for housing units with mortgages in 2022: $4,043 (1.1%)
Median real estate property taxes paid for housing units with no mortgage in 2022: $4,137 (1.2%)
Nearest city with pop. 50,000+: Brooklyn Park, MN  (7.3 miles , pop. 67,388).
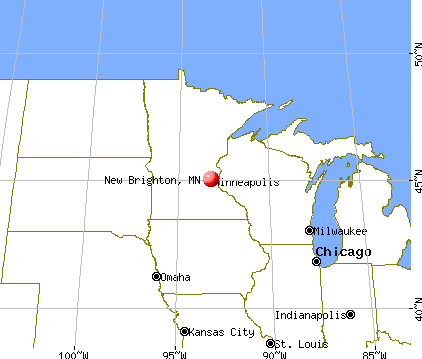
Nearest city with pop. 200,000+: Minneapolis, MN (7.4 miles , pop. 382,618).
Nearest city with pop. 1,000,000+: Chicago, IL (355.8 miles , pop. 2,896,016).
Nearest cities:
), ), ), )Latitude: 45.06 N, Longitude: 93.21 W
Daytime population change due to commuting: -226 (-1.0%)
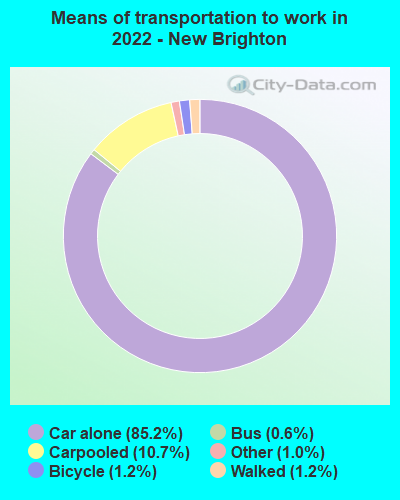
Workers who live and work in this city: 3,002 (25.5%)
Property values in New Brighton, MN
New Brighton, Minnesota accommodation & food services, waste management - Economy and Business Data
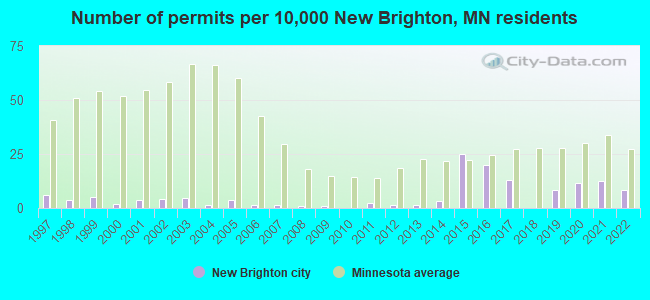
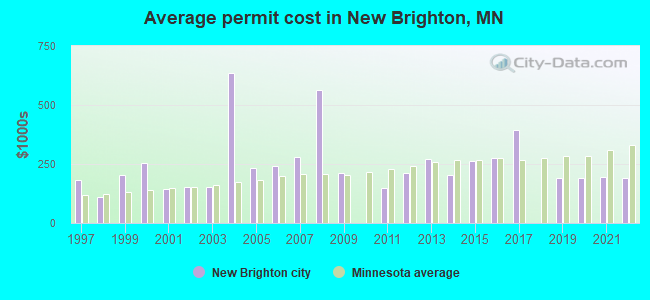
Single-family new house construction building permits:
- 2022: 19 buildings, average cost: $191,900
- 2021: 28 buildings, average cost: $192,700
- 2020: 26 buildings, average cost: $190,300
- 2019: 18 buildings, average cost: $191,200
- 2017: 29 buildings, average cost: $394,700
- 2016: 44 buildings, average cost: $277,300
- 2015: 55 buildings, average cost: $262,500
- 2014: 7 buildings, average cost: $202,200
- 2013: 3 buildings, average cost: $271,400
- 2012: 3 buildings, average cost: $213,300
- 2011: 5 buildings, average cost: $147,600
- 2009: 2 buildings, average cost: $210,000
- 2008: 2 buildings, average cost: $562,500
- 2007: 3 buildings, average cost: $278,300
- 2006: 3 buildings, average cost: $241,000
- 2005: 8 buildings, average cost: $235,100
- 2004: 3 buildings, average cost: $633,700
- 2003: 10 buildings, average cost: $151,800
- 2002: 9 buildings, average cost: $154,300
- 2001: 8 buildings, average cost: $141,700
- 2000: 4 buildings, average cost: $254,800
- 1999: 11 buildings, average cost: $203,200
- 1998: 8 buildings, average cost: $111,900
- 1997: 13 buildings, average cost: $181,600
| Here: | 2.3% |
| Minnesota: | 2.6% |
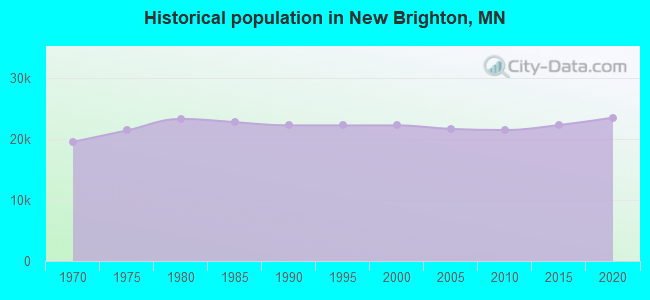
Population change in the 1990s: +332 (+1.5%).
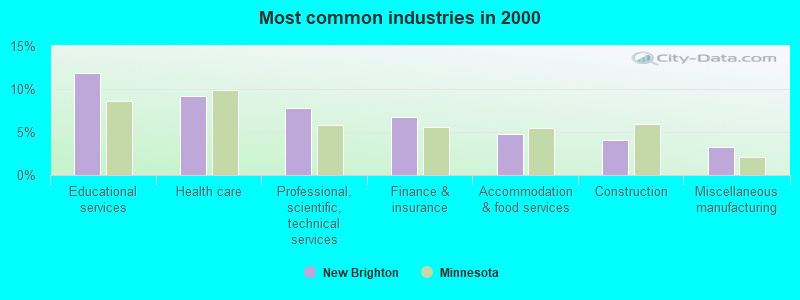
- Educational services (11.9%)
- Health care (9.2%)
- Professional, scientific, technical services (7.8%)
- Finance & insurance (6.7%)
- Accommodation & food services (4.8%)
- Construction (4.1%)
- Miscellaneous manufacturing (3.2%)
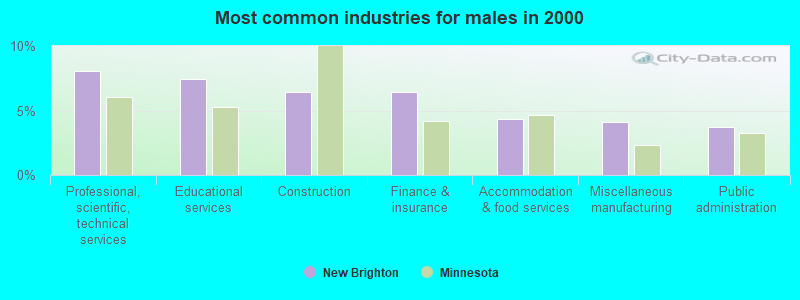
- Professional, scientific, technical services (8.1%)
- Educational services (7.5%)
- Construction (6.4%)
- Finance & insurance (6.4%)
- Accommodation & food services (4.4%)
- Miscellaneous manufacturing (4.1%)
- Public administration (3.7%)

- Educational services (16.8%)
- Health care (15.9%)
- Professional, scientific, technical services (7.5%)
- Finance & insurance (7.1%)
- Accommodation & food services (5.2%)
- Social assistance (4.2%)
- Administrative & support & waste management services (3.3%)

- Other office and administrative support workers, including supervisors (4.7%)
- Computer specialists (4.4%)
- Other management occupations, except farmers and farm managers (4.1%)
- Sales representatives, services, wholesale and manufacturing (3.7%)
- Retail sales workers, except cashiers (3.4%)
- Other sales and related occupations, including supervisors (3.4%)
- Secretaries and administrative assistants (3.0%)

- Computer specialists (6.1%)
- Sales representatives, services, wholesale and manufacturing (4.9%)
- Engineers (4.6%)
- Other management occupations, except farmers and farm managers (4.4%)
- Driver/sales workers and truck drivers (4.0%)
- Other sales and related occupations, including supervisors (3.9%)
- Retail sales workers, except cashiers (3.8%)

- Other office and administrative support workers, including supervisors (7.8%)
- Secretaries and administrative assistants (6.1%)
- Registered nurses (5.8%)
- Preschool, kindergarten, elementary, and middle school teachers (5.4%)
- Other management occupations, except farmers and farm managers (3.8%)
- Information and record clerks, except customer service representatives (3.6%)
- Customer service representatives (3.1%)
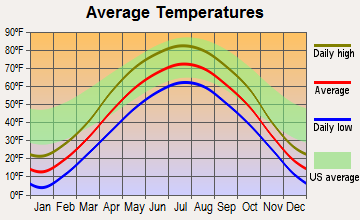
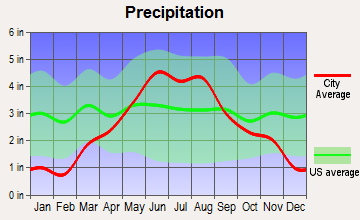
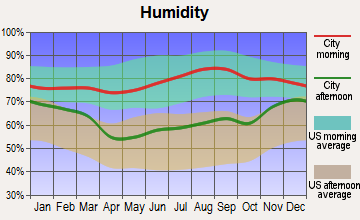
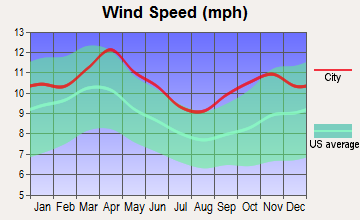
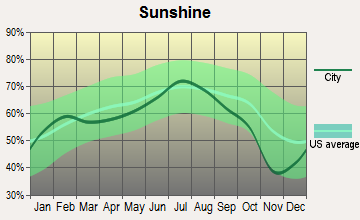
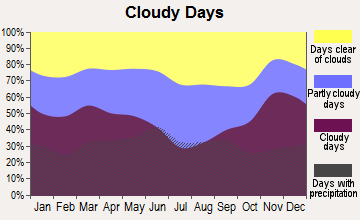
Average climate in New Brighton, Minnesota
Based on data reported by over 4,000 weather stations

|
|

(lower is better)
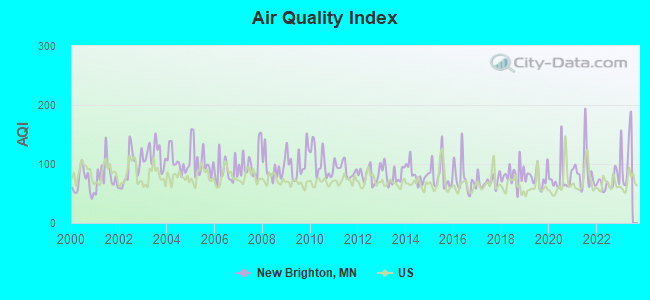
Air Quality Index (AQI) level in 2022 was 68.7. This is about average.
| City: | 68.7 |
| U.S.: | 72.6 |
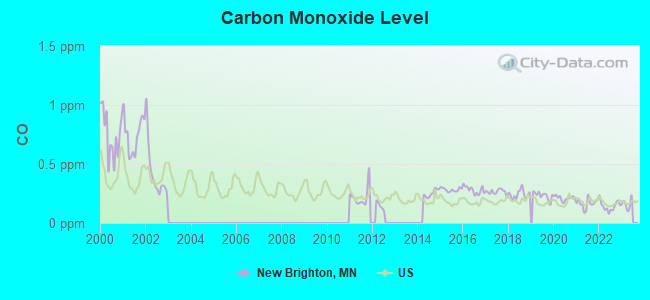
Carbon Monoxide (CO) [ppm] level in 2022 was 0.144. This is significantly better than average. Closest monitor was 3.4 miles away from the city center.
| City: | 0.144 |
| U.S.: | 0.251 |
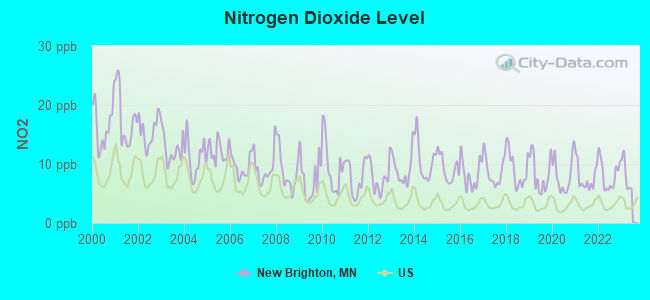
Nitrogen Dioxide (NO2) [ppb] level in 2022 was 8.14. This is significantly worse than average. Closest monitor was 4.7 miles away from the city center.
| City: | 8.14 |
| U.S.: | 5.11 |
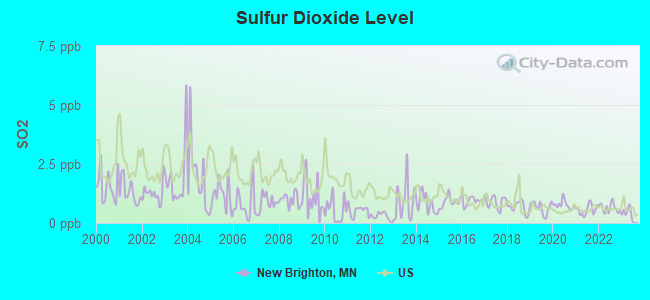
Sulfur Dioxide (SO2) [ppb] level in 2022 was 0.641. This is significantly better than average. Closest monitor was 3.4 miles away from the city center.
| City: | 0.641 |
| U.S.: | 1.515 |
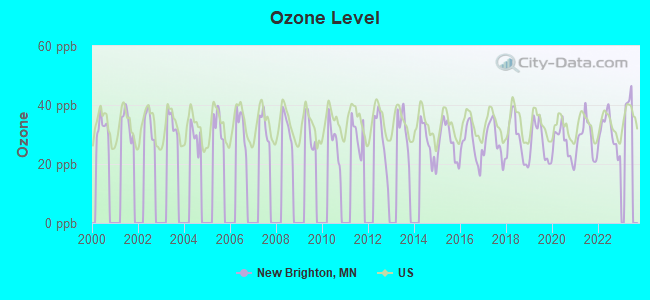
Ozone [ppb] level in 2022 was 30.7. This is about average. Closest monitor was 2.4 miles away from the city center.
| City: | 30.7 |
| U.S.: | 33.3 |
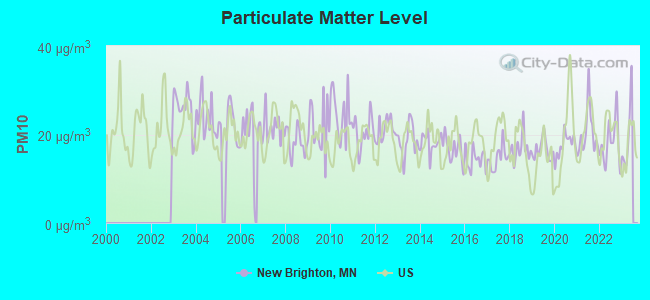
Particulate Matter (PM10) [µg/m3] level in 2022 was 18.1. This is about average. Closest monitor was 3.4 miles away from the city center.
| City: | 18.1 |
| U.S.: | 19.2 |
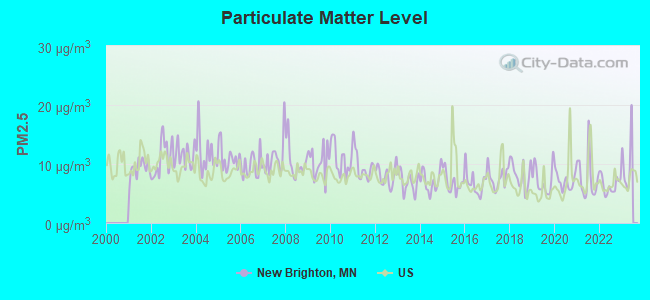
Particulate Matter (PM2.5) [µg/m3] level in 2022 was 6.44. This is better than average. Closest monitor was 4.3 miles away from the city center.
| City: | 6.44 |
| U.S.: | 8.11 |
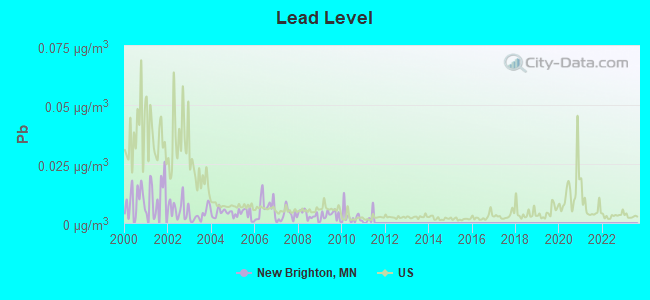
Lead (Pb) [µg/m3] level in 2010 was 0.00259. This is significantly better than average. Closest monitor was 3.4 miles away from the city center.
| City: | 0.00259 |
| U.S.: | 0.00931 |
Tornado activity:
New Brighton-area historical tornado activity is slightly above Minnesota state average. It is 27% greater than the overall U.S. average.
On 5/6/1965, a category F4 (max. wind speeds 207-260 mph) tornado 4.2 miles away from the New Brighton city center killed 3 people and injured 175 people and caused between $5,000,000 and $50,000,000 in damages.
On 5/6/1965, a category F4 tornado 9.7 miles away from the city center killed 6 people and injured 158 people and caused between $5,000,000 and $50,000,000 in damages.
Earthquake activity:
New Brighton-area historical earthquake activity is significantly above Minnesota state average. It is 56% smaller than the overall U.S. average.On 7/9/1975 at 14:54:15, a magnitude 4.6 (4.6 MB, Class: Light, Intensity: IV - V) earthquake occurred 143.9 miles away from New Brighton center
On 6/5/1993 at 01:24:53, a magnitude 4.1 (4.1 LG, Depth: 6.2 mi) earthquake occurred 155.8 miles away from New Brighton center
On 3/4/1983 at 06:32:18, a magnitude 4.6 (4.4 MB, 4.6 LG, 4.4 ML) earthquake occurred 310.7 miles away from New Brighton center
On 10/20/1995 at 15:57:18, a magnitude 3.7 (3.7 LG, Depth: 3.1 mi, Class: Light, Intensity: II - III) earthquake occurred 184.4 miles away from New Brighton center
On 2/9/1994 at 08:45:35, a magnitude 3.1 (3.1 LG, Depth: 3.1 mi) earthquake occurred 87.7 miles away from New Brighton center
On 11/3/2002 at 20:41:56, a magnitude 4.3 (4.3 MB, Depth: 3.1 mi) earthquake occurred 324.7 miles away from the city center
Magnitude types: regional Lg-wave magnitude (LG), body-wave magnitude (MB), local magnitude (ML)
Natural disasters:
The number of natural disasters in Ramsey County (18) is near the US average (15).Major Disasters (Presidential) Declared: 13
Emergencies Declared: 3
Causes of natural disasters: Floods: 14, Storms: 8, Tornadoes: 5, Winds: 3, Drought: 1, Hurricane: 1, Landslide: 1, Mudslide: 1, Winter Storm: 1, Other: 1 (Note: some incidents may be assigned to more than one category).

Main business address for: COMPEX TECHNOLOGIES INC (ELECTROMEDICAL & ELECTROTHERAPEUTIC APPARATUS).
Hospitals and medical centers in New Brighton:
- SILVER OAKS (3277 RICE CREEK ROAD)
- BENEDICTINE HEALTH CENTER INNSBRUCK (1101 BLACK OAK DRIVE)
- HEALTH AND REHABILITATION OF NEW BRIGHTON (825 FIRST AVENUE NORTHWEST)
- INNSBRUCK HEALTHCARE CTR (2800 HIGHWAY 694)
- NEW BRIGHTON CARE CENTER (805 SIXTH AVENUE NORTHWEST)
- NEW BRIGHTON NURSING HOME (550 8TH ST NW)
- TREVILLA OF NEW BRIGHTON (825 1ST AVE NW)
- FMC DIALYSIS - NEW BRIGHTON (550 COUNTY RD D, SUITE 7)
located in New Brighton:
Amtrak station near New Brighton:
College/University in New Brighton:
Colleges/universities with over 2000 students nearest to New Brighton:
- Bethel University (about 3 miles; Saint Paul, MN; Full-time enrollment: 4,061)
- University of Northwestern-St Paul (about 3 miles; Saint Paul, MN; FT enrollment: 2,680)
- University of Minnesota-Twin Cities (about 7 miles; Minneapolis, MN; FT enrollment: 43,506)
- Walden University (about 7 miles; Minneapolis, MN; FT enrollment: 62,473)
- Capella University (about 7 miles; Minneapolis, MN; FT enrollment: 21,718)
- Augsburg College (about 7 miles; Minneapolis, MN; FT enrollment: 2,954)
- Hamline University (about 8 miles; Saint Paul, MN; FT enrollment: 3,818)
Public high school in New Brighton:
- IRONDALE SENIOR HIGH (Location: 2425 LONG LAKE RD, Grades: 9-12)
Public elementary/middle schools in New Brighton:
- BEL AIR ELEMENTARY (Location: 1800 - 5TH ST NW, Grades: KG-5)
- HIGHVIEW MIDDLE SCHOOL (Location: 2300 - 7TH ST NW, Grades: 6-8)
- SUNNYSIDE ELEMENTARY (Location: 2070 COUNTY RD H, Grades: KG-5)
Private elementary/middle school in New Brighton:
- ST JOHN THE BAPTIST SCHOOL (Students: 373, Location: 845 2ND AVE NW, Grades: KG-8)
User-submitted facts and corrections:
- Churches in New Brighton include the United Church of Christ in New Brighton (UCC NB), 1000 Long Lake Road. The United CHurch of Christ in New Brighton.
- Pike Lake School is now closed
Points of interest:
Notable locations in New Brighton: Brightwood Hills Golf Course (A), New Brighton Fire Department (B). Display/hide their locations on the map
Shopping Centers: Brighton Village Shopping Center (1), Rice Creek Plaza Shopping Center (2). Display/hide their locations on the map
Main business address in New Brighton: COMPEX TECHNOLOGIES INC (A). Display/hide its location on the map
Churches in New Brighton include: Salem Baptist Church (A), New Brighton Christian Church (B), Korean United Methodist Church of Minnesota (C), Fridley United Methodist Church (D). Display/hide their locations on the map
Cemetery: Saint John the Baptist Catholic Cemetery (1). Display/hide its location on the map
Lakes: Stony Lake (A), Rush Lake (B), Poplar Lake (C), Pike Lake (D), Long Lake (E), Lake Jones (F). Display/hide their locations on the map
Parks in New Brighton include: Long Lake Park (1), Silver Oaks Park (2), Totem Pole Park (3), Long Lake Regional Park (4), Hansen Park (5), Freedom Park (6), Creekview Park (7), Sunnyside Park (8). Display/hide their locations on the map
Birthplace of: Chris McKelvie - Ice hockey player, Zach McKelvie - Ice hockey player.
| This city: | 2.4 people |
| Minnesota: | 2.5 people |
| This city: | 64.3% |
| Whole state: | 64.6% |
| This city: | 5.6% |
| Whole state: | 6.9% |
Likely homosexual households (counted as self-reported same-sex unmarried-partner households)
- Lesbian couples: 0.3% of all households
- Gay men: 0.2% of all households
People in group quarters in New Brighton in 2010:
- 239 people in nursing facilities/skilled-nursing facilities
- 196 people in college/university student housing
- 54 people in group homes intended for adults
- 4 people in residential treatment centers for adults
- 2 people in group homes for juveniles (non-correctional)
People in group quarters in New Brighton in 2000:
- 315 people in nursing homes
- 214 people in college dormitories (includes college quarters off campus)
- 70 people in homes for the mentally retarded
- 5 people in homes or halfway houses for drug/alcohol abuse
- 3 people in religious group quarters
Banks with branches in New Brighton (2011 data):
- Wells Fargo Bank, National Association: New Brighton Branch at 1200 Silver Lake Road Nw, branch established on 1985/12/31. Info updated 2011/04/05: Bank assets: $1,161,490.0 mil, Deposits: $905,653.0 mil, headquarters in Sioux Falls, SD, positive income, 6395 total offices, Holding Company: Wells Fargo & Company
- U.S. Bank National Association: New Brighton Branch at 2299 Palmer Drive, branch established on 1912/06/13. Info updated 2012/01/30: Bank assets: $330,470.8 mil, Deposits: $236,091.5 mil, headquarters in Cincinnati, OH, positive income, 3121 total offices, Holding Company: U.S. Bancorp
For population 15 years and over in New Brighton:
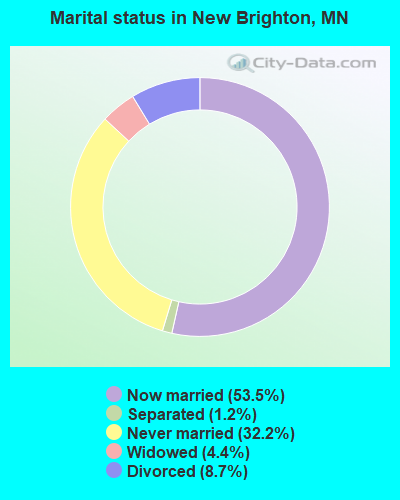
- Never married: 32.2%
- Now married: 53.5%
- Separated: 1.2%
- Widowed: 4.4%
- Divorced: 8.7%
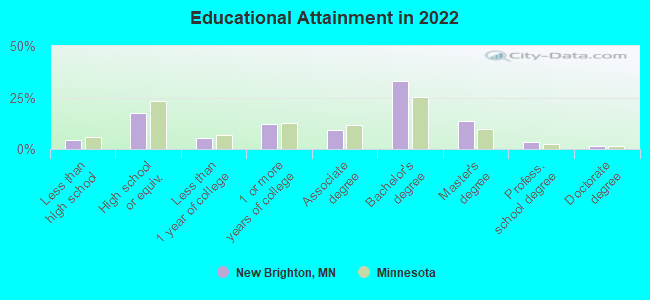
For population 25 years and over in New Brighton:
- High school or higher: 95.4%
- Bachelor's degree or higher: 48.8%
- Graduate or professional degree: 17.0%
- Unemployed: 2.1%
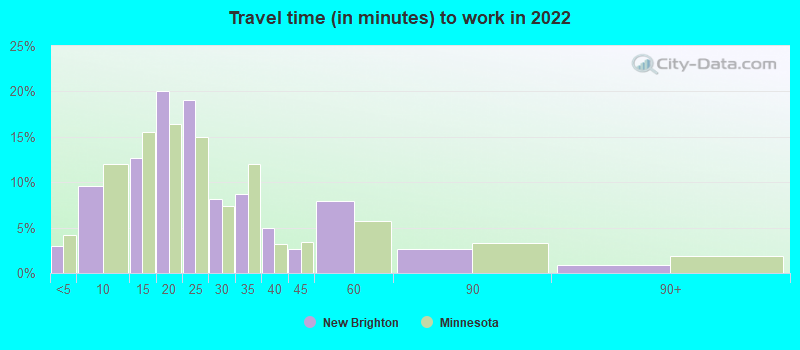
- Mean travel time to work (commute): 16.0 minutes
| Here: | 9.7 |
| Minnesota average: | 10.9 |
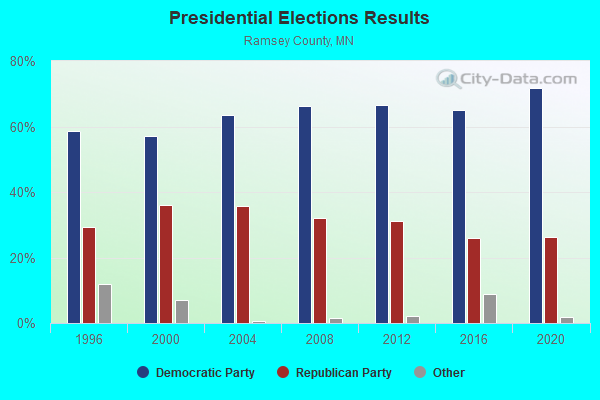
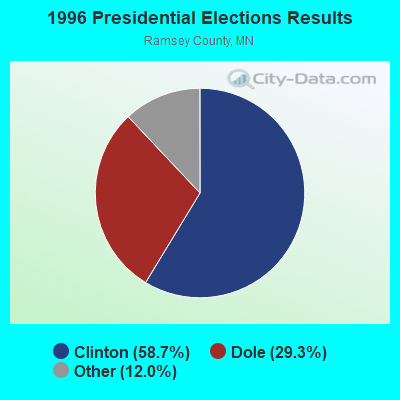
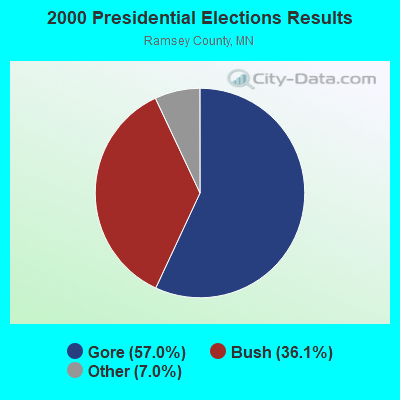
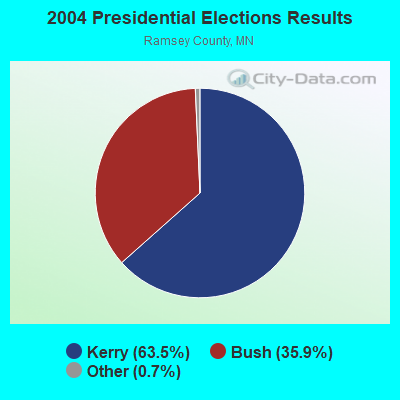
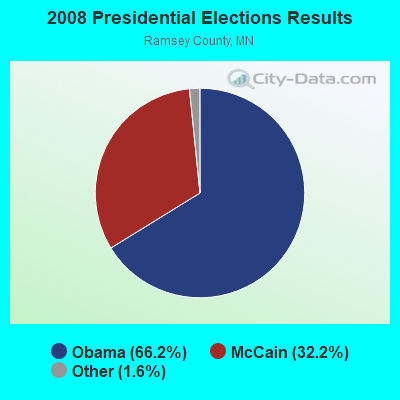
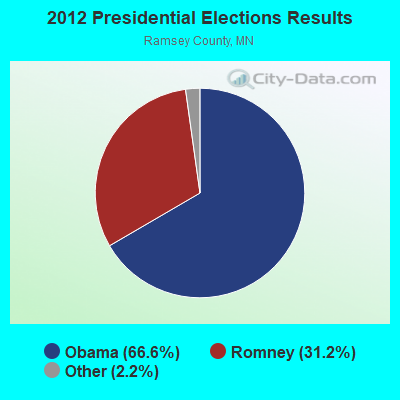
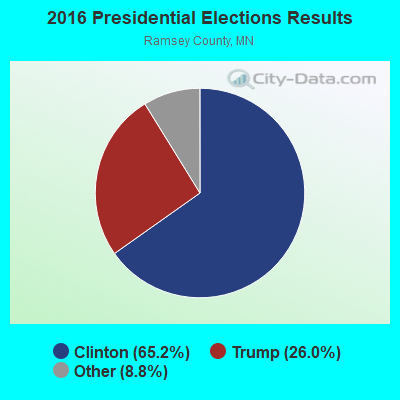
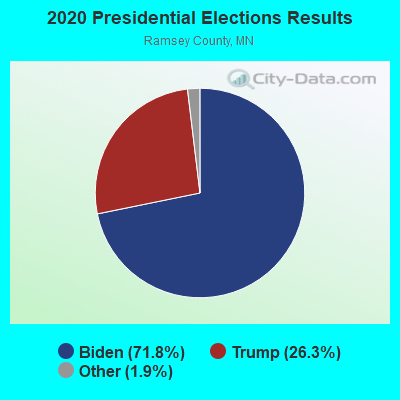
Graphs represent county-level data. Detailed 2008 Election Results
Religion statistics for New Brighton, MN (based on Ramsey County data)
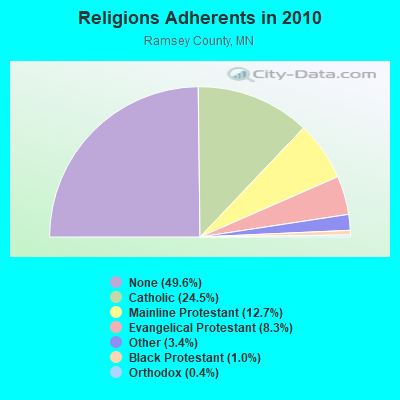
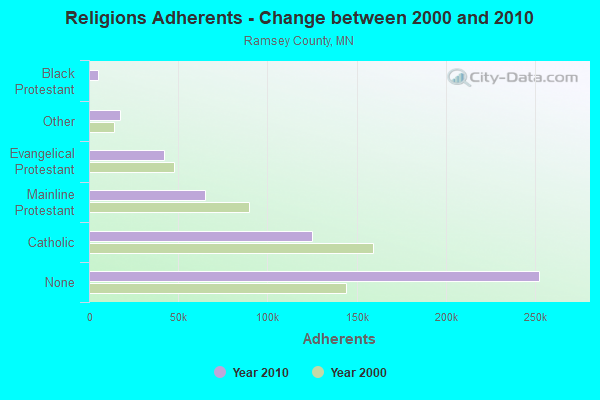
| Religion | Adherents | Congregations |
|---|---|---|
| Catholic | 124,823 | 44 |
| Mainline Protestant | 64,738 | 123 |
| Evangelical Protestant | 42,137 | 154 |
| Other | 17,440 | 38 |
| Black Protestant | 5,032 | 13 |
| Orthodox | 2,070 | 9 |
| None | 252,400 | - |
Food Environment Statistics:
| Ramsey County: | 1.83 / 10,000 pop. |
| Minnesota: | 1.83 / 10,000 pop. |
| Ramsey County: | 0.06 / 10,000 pop. |
| Minnesota: | 0.13 / 10,000 pop. |
| Ramsey County: | 0.54 / 10,000 pop. |
| Minnesota: | 0.49 / 10,000 pop. |
| Ramsey County: | 2.77 / 10,000 pop. |
| Minnesota: | 3.90 / 10,000 pop. |
| Here: | 6.76 / 10,000 pop. |
| State: | 6.98 / 10,000 pop. |
| Ramsey County: | 7.3% |
| State: | 6.5% |
| This county: | 25.5% |
| State: | 25.9% |
| This county: | 14.7% |
| State: | 13.0% |
Health and Nutrition:
| This city: | 51.8% |
| State: | 50.6% |
| Here: | 49.7% |
| Minnesota: | 48.4% |
| New Brighton: | 28.4 |
| Minnesota: | 28.5 |
| New Brighton: | 20.3% |
| Minnesota: | 21.0% |
| New Brighton: | 10.6% |
| Minnesota: | 9.8% |
| New Brighton: | 6.9 |
| State: | 6.8 |
| Here: | 32.9% |
| Minnesota: | 33.5% |
| New Brighton: | 58.7% |
| Minnesota: | 57.7% |
| This city: | 79.2% |
| Minnesota: | 79.3% |
More about Health and Nutrition of New Brighton, MN Residents
| Local government employment and payroll (March 2022) | |||||
| Function | Full-time employees | Monthly full-time payroll | Average yearly full-time wage | Part-time employees | Monthly part-time payroll |
|---|---|---|---|---|---|
| Police Protection - Officers | 28 | $260,730 | $111,741 | 0 | $0 |
| Parks and Recreation | 22 | $132,841 | $72,459 | 62 | $35,174 |
| Financial Administration | 14 | $93,663 | $80,283 | 7 | $22,668 |
| Streets and Highways | 11 | $74,616 | $81,399 | 0 | $0 |
| Water Supply | 6 | $45,450 | $90,900 | 0 | $0 |
| Housing and Community Development (Local) | 6 | $45,411 | $90,822 | 0 | $0 |
| Police - Other | 6 | $31,076 | $62,152 | 1 | $1,776 |
| Other Government Administration | 5 | $40,128 | $96,307 | 0 | $0 |
| Other and Unallocable | 2 | $12,010 | $72,060 | 0 | $0 |
| Sewerage | 2 | $14,264 | $85,584 | 0 | $0 |
| Firefighters | 1 | $7,914 | $94,968 | 41 | $18,083 |
| Totals for Government | 103 | $758,103 | $88,323 | 111 | $77,701 |
New Brighton government finances - Expenditure in 2021 (per resident):
- Construction - Regular Highways: $2,134,000 ($95.21)
- Current Operations - Police Protection: $5,657,000 ($252.40)
General - Other: $5,066,000 ($226.03)
Parks and Recreation: $4,268,000 ($190.43)
Natural Resources - Other: $3,354,000 ($149.65)
Sewerage: $3,194,000 ($142.51)
Water Utilities: $2,114,000 ($94.32)
Regular Highways: $1,796,000 ($80.13)
Financial Administration: $1,500,000 ($66.93)
Housing and Community Development: $1,172,000 ($52.29)
Local Fire Protection: $1,069,000 ($47.70)
Solid Waste Management: $254,000 ($11.33)
Central Staff Services: $53,000 ($2.36)
- General - Interest on Debt: $1,651,000 ($73.66)
- Other Capital Outlay - Water Utilities: $1,546,000 ($68.98)
Regular Highways: $1,364,000 ($60.86)
Sewerage: $553,000 ($24.67)
Natural Resources - Other: $488,000 ($21.77)
General - Other: $133,000 ($5.93)
Police Protection: $75,000 ($3.35)
- Water Utilities - Interest on Debt: $73,000 ($3.26)
New Brighton government finances - Revenue in 2021 (per resident):
- Charges - Sewerage: $4,207,000 ($187.70)
Other: $4,145,000 ($184.94)
Regular Highways: $2,607,000 ($116.32)
Parks and Recreation: $1,305,000 ($58.23)
Solid Waste Management: $231,000 ($10.31)
- Federal Intergovernmental - Health and Hospitals: $1,742,000 ($77.72)
Other: $4,000 ($0.18)
- Local Intergovernmental - Other: $764,000 ($34.09)
- Miscellaneous - General Revenue - Other: $1,748,000 ($77.99)
Interest Earnings: $1,534,000 ($68.44)
Special Assessments: $417,000 ($18.61)
Fines and Forfeits: $48,000 ($2.14)
- Revenue - Water Utilities: $4,406,000 ($196.58)
- State Intergovernmental - Highways: $775,000 ($34.58)
General Local Government Support: $738,000 ($32.93)
Other: $491,000 ($21.91)
Water Utilities: $2,000 ($0.09)
Sewerage: $1,000 ($0.04)
- Tax - Property: $10,371,000 ($462.72)
Public Utilities Sales: $1,207,000 ($53.85)
Other License: $1,027,000 ($45.82)
New Brighton government finances - Debt in 2021 (per resident):
- Long Term Debt - Beginning Outstanding - Unspecified Public Purpose: $32,255,000 ($1439.12)
Outstanding Unspecified Public Purpose: $30,445,000 ($1358.36)
Retired Unspecified Public Purpose: $1,810,000 ($80.76)
8.61% of this county's 2021 resident taxpayers lived in other counties in 2020 ($57,378 average adjusted gross income)
| Here: | 8.61% |
| Minnesota average: | 7.43% |
0.01% of residents moved from foreign countries ($84 average AGI)
Ramsey County: 0.01% Minnesota average: 0.00%
Top counties from which taxpayers relocated into this county between 2020 and 2021:
| from Hennepin County, MN | |
| from Washington County, MN | |
| from Dakota County, MN |
| Businesses in New Brighton, MN | ||||
| Name | Count | Name | Count | |
|---|---|---|---|---|
| Circle K | 2 | LA Fitness | 1 | |
| Dairy Queen | 2 | McDonald's | 2 | |
| Domino's Pizza | 1 | Nike | 1 | |
| FedEx | 4 | U-Haul | 1 | |
| Ford | 1 | UPS | 2 | |
| Jimmy John's | 1 | |||
Strongest AM radio stations in New Brighton:
- WCCO (830 AM; 50 kW; MINNEAPOLIS, MN; Owner: INFINITY MEDIA CORPORATION)
- KSTP (1500 AM; 50 kW; ST. PAUL, MN; Owner: KSTP-AM, LLC (DELAWARE))
- KUOM (770 AM; daytime; 5 kW; MINNEAPOLIS, MN)
- KTIS (900 AM; 25 kW; MINNEAPOLIS, MN; Owner: NORTHWESTERN COLLEGE)
- WCTS (1030 AM; 50 kW; MAPLEWOOD, MN; Owner: CNTL. BAPT. THEO/AL SEMI MINNEAPOLIS)
- KFAN (1130 AM; 50 kW; MINNEAPOLIS, MN; Owner: AMFM RADIO LICENSES, L.L.C.)
- KDIZ (1440 AM; 5 kW; GOLDEN VALLEY, MN; Owner: KQRS, INC.)
- KLBP (1470 AM; 5 kW; BROOKLYN PARK, MN; Owner: 1400, INC.)
- WWTC (1280 AM; 5 kW; MINNEAPOLIS, MN; Owner: SCA LICENSE CORPORATION)
- KYCR (1570 AM; 4 kW; GOLDEN VALLEY, MN; Owner: COMMON GROUND BROADCASTING COMPANY,)
- WMNN (1330 AM; 10 kW; MINNEAPOLIS, MN; Owner: MINNESOTA PUBLIC RADIO.)
- WDGY (630 AM; 8 kW; HUDSON, WI; Owner: 630 RADIO, INCORPORATED)
- KKMS (980 AM; 5 kW; RICHFIELD, MN)
Strongest FM radio stations in New Brighton:
- KNOW-FM (91.1 FM; MINNEAPOLIS-ST. PAUL, MN; Owner: MINNESOTA PUBLIC RADIO)
- WLTE (102.9 FM; MINNEAPOLIS, MN; Owner: INFINITY MEDIA CORPORATION)
- KSTP-FM (94.5 FM; ST. PAUL, MN; Owner: KSTP-FM, LLC, A DELAWARE LLC)
- KEEY-FM (102.1 FM; ST. PAUL, MN; Owner: AMFM RADIO LICENSES, L.L.C.)
- KTIS-FM (98.5 FM; MINNEAPOLIS, MN; Owner: NORTHWESTERN COLLEGE)
- KDWB-FM (101.3 FM; RICHFIELD, MN; Owner: AMFM RADIO LICENSES, L.L.C.)
- KQRS-FM (92.5 FM; GOLDEN VALLEY, MN; Owner: KQRS, Inc.)
- KSJN (99.5 FM; MINNEAPOLIS, MN; Owner: MINNESOTA PUBLIC RADIO)
- KXXR (93.7 FM; MINNEAPOLIS, MN; Owner: KQRS, INC.)
- KBEM-FM (88.5 FM; MINNEAPOLIS, MN; Owner: BD. OF EDUCATION, S.S.D. NO. 1)
- KTCZ-FM (97.1 FM; MINNEAPOLIS, MN; Owner: AMFM RADIO LICENSES, L.L.C.)
- K214DF (90.7 FM; GOLDEN VALLEY, MN; Owner: EDUCATIONAL MEDIA FOUNDATION)
- KFAI (90.3 FM; MINNEAPOLIS, MN; Owner: FRESH AIR, INC.)
- KQQL (107.9 FM; ANOKA, MN; Owner: AMFM RADIO LICENSES, L.L.C.)
- WFMP (107.1 FM; COON RAPIDS, MN; Owner: WFMP-FM, LLC)
- KNOF (95.3 FM; ST. PAUL, MN; Owner: SELBY GOSPEL BROADCASTING CORPORATION)
- KJZI (100.3 FM; MINNEAPOLIS, MN; Owner: AMFM RADIO LICENSES, L.L.C.)
- WXPT (104.1 FM; ST. LOUIS PARK, MN; Owner: THE AUDIO HOUSE, INC.)
- K294AM (106.7 FM; WEST ST. PAUL, MN; Owner: FRESH AIR, INCORPORATED)
- WCAL (89.3 FM; NORTHFIELD, MN; Owner: ST. OLAF COLLEGE)
TV broadcast stations around New Brighton:
- KARE (Channel 11; MINNEAPOLIS, MN; Owner: MULTIMEDIA HOLDINGS CORPORATION)
- KSTP-TV (Channel 5; ST. PAUL, MN; Owner: HUBBARD BROADCASTING, INC.)
- KMSP-TV (Channel 9; MINNEAPOLIS, MN; Owner: FOX TELEVISION STATIONS, INC.)
- WCCO-TV (Channel 4; MINNEAPOLIS, MN; Owner: CBS BROADCASTING INC.)
- KTCA-TV (Channel 2; ST. PAUL, MN; Owner: TWIN CITIES PUBLIC TELEVISION, INC.)
- KSTC-TV (Channel 45; MINNEAPOLIS, MN; Owner: HUBBARD BROADCASTING, INC.)
- KTCI-TV (Channel 17; ST. PAUL, MN; Owner: TWIN CITIES PUBLIC TELEVISION, INC.)
- KMWB (Channel 23; MINNEAPOLIS, MN; Owner: KLGT LICENSEE, LLC)
- WFTC (Channel 29; MINNEAPOLIS, MN; Owner: FOX TELEVISION STATIONS, INC.)
- K07UI (Channel 7; MINNEAPOLIS, ETC., MN; Owner: WORD OF GOD FELLOWSHIP, INC.)
- K58BS (Channel 58; MINNEAPOLIS, MN; Owner: TRINITY BROADCASTING NETWORK)
- K67HG (Channel 67; MINNEAPOLIS, MN; Owner: VENTANA TELEVISION, INC.)
- K19ER (Channel 19; ST. PAUL, MN; Owner: CATHOLIC VIEWS BROADCASTS, INC.)
- W62BD (Channel 62; MINNEAPOLIS, MN; Owner: WORD OF GOD FELLOWSHIP, INC.)
- K14KH (Channel 14; MINNEAPOLIS, MN; Owner: THREE ANGELS BROADCASTING NETWORK)
- WBWX-CA (Channel 13; MINNEAPOLIS, MN; Owner: THE BOX WORLDWIDE LLC)
- KPXM (Channel 41; ST. CLOUD, MN; Owner: PAXSON MINNEAPOLIS LICENSE, INC.)
- National Bridge Inventory (NBI) Statistics
- 22Number of bridges
- 226ft / 69.5mTotal length
- $2,871,998,000Total costs
- 774,569Total average daily traffic
- 51,224Total average daily truck traffic
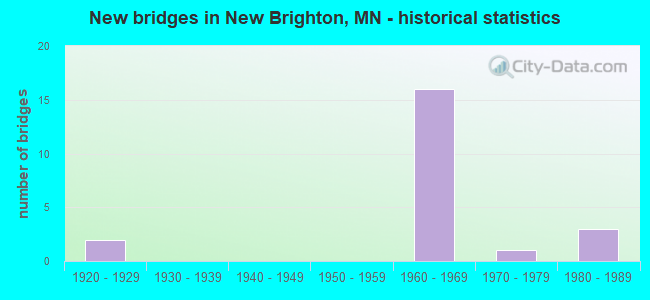
- New bridges - historical statistics
- 21920-1929
- 161960-1969
- 11970-1979
- 31980-1989
FCC Registered Broadcast Land Mobile Towers:
8 (See the full list of FCC Registered Broadcast Land Mobile Towers in New Brighton, MN)FCC Registered Microwave Towers:
5- 3001 5th St Nw (Lat: 45.056056 Lon: -93.225222), Structure height: 29 m, Overall height: 32 m, Call Sign: WNTY267,
Assigned Frequencies: 952.318 MHz, 928.318 MHz, Grant Date: 03/03/2010, Expiration Date: 05/18/2020, Cancellation Date: 07/18/2020, Registrant: City Of New Brighton, 803 Old Hwy 8 Nw, New Brighton, MN 55112, Phone: (651) 638-2100, Fax: (651) 638-2044, Email:
- MSPKF3, 1415-1st Ave Nw (Lat: 45.072778 Lon: -93.186083), Type: Pole, Structure height: 27.4 m, Call Sign: WQKK577,
Assigned Frequencies: 19550.0 MHz, Grant Date: 06/24/2009, Expiration Date: 06/24/2019, Cancellation Date: 08/24/2019, Certifier: Alan Macdonald, Registrant: Telecom Transport Management, Inc., 146 N. Canal Street, Suite 210, Seattle, WA 98103, Phone: (206) 816-6907, Fax: (206) 545-9585, Email:
- MN-MSP0447A, 2121 14th Street (Lat: 45.070694 Lon: -93.217111), Type: Pole, Structure height: 30.5 m, Call Sign: WQLZ579,
Assigned Frequencies: 17865.0 MHz, Grant Date: 07/21/2020, Expiration Date: 06/07/2030, Cancellation Date: 08/11/2020, Certifier: Nadja S Sodos-Wallace, Registrant: Sprint Corporation, 12502 Sunrise Valley Drive, M/S: Varesa0209, Reston, VA 20196, Phone: (800) 572-8256, Fax: (703) 433-4483, Email:
- MN-MSP0103A, 660 5th Street Sw (Lat: 45.041889 Lon: -93.195194), Type: Tank, Structure height: 53.3 m, Call Sign: WQLZ706,
Assigned Frequencies: 19575.0 MHz, 19575.0 MHz, 21825.0 MHz, 19675.0 MHz, 19675.0 MHz, Grant Date: 07/28/2020, Expiration Date: 06/07/2030, Cancellation Date: 09/13/2021, Certifier: Nadja S Sodos-Wallace, Registrant: T-Mobile Usa, Inc., 12920 Se 38th Street, Bellevue, WA 98006, Phone: (425) 383-8402, Fax: (425) 383-4840, Email:
- MSP1ST, 348 1st St Sw (Lat: 45.049389 Lon: -93.190306), Type: Pole, Structure height: 30.5 m, Call Sign: WQMP344,
Assigned Frequencies: 19310.0 MHz, Grant Date: 10/12/2010, Expiration Date: 10/12/2020, Cancellation Date: 12/12/2020, Certifier: Alexis Diaz, Registrant: Telecom Transport Management, Inc., 146 N. Canal Street, Suite 210, Seattle, WA 98103, Phone: (206) 816-6907, Fax: (206) 545-9585, Email:
FCC Registered Amateur Radio Licenses:
82 (See the full list of FCC Registered Amateur Radio Licenses in New Brighton)FAA Registered Aircraft:
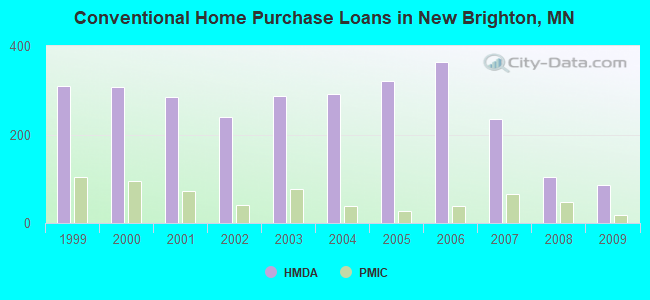
11 (See the full list of FAA Registered Aircraft in New Brighton)| Home Mortgage Disclosure Act Aggregated Statistics For Year 2009 (Based on 5 full tracts) | ||||||||||||||
| A) FHA, FSA/RHS & VA Home Purchase Loans | B) Conventional Home Purchase Loans | C) Refinancings | D) Home Improvement Loans | E) Loans on Dwellings For 5+ Families | F) Non-occupant Loans on < 5 Family Dwellings (A B C & D) | G) Loans On Manufactured Home Dwelling (A B C & D) | ||||||||
|---|---|---|---|---|---|---|---|---|---|---|---|---|---|---|
| Number | Average Value | Number | Average Value | Number | Average Value | Number | Average Value | Number | Average Value | Number | Average Value | Number | Average Value | |
| LOANS ORIGINATED | 87 | $178,287 | 86 | $171,744 | 481 | $181,372 | 34 | $85,176 | 2 | $7,615,000 | 9 | $131,556 | 2 | $28,000 |
| APPLICATIONS APPROVED, NOT ACCEPTED | 6 | $167,167 | 8 | $102,375 | 39 | $164,077 | 3 | $74,333 | 0 | $0 | 1 | $81,000 | 4 | $53,500 |
| APPLICATIONS DENIED | 7 | $176,571 | 12 | $156,500 | 141 | $205,475 | 14 | $52,786 | 0 | $0 | 7 | $161,429 | 4 | $35,000 |
| APPLICATIONS WITHDRAWN | 5 | $214,800 | 7 | $210,571 | 99 | $187,444 | 11 | $90,000 | 0 | $0 | 3 | $221,667 | 0 | $0 |
| FILES CLOSED FOR INCOMPLETENESS | 2 | $157,500 | 3 | $179,667 | 41 | $155,439 | 3 | $97,333 | 0 | $0 | 0 | $0 | 0 | $0 |
Detailed HMDA statistics for the following Tracts: 0411.04 , 0411.05, 0411.06, 0411.07, 0412.00
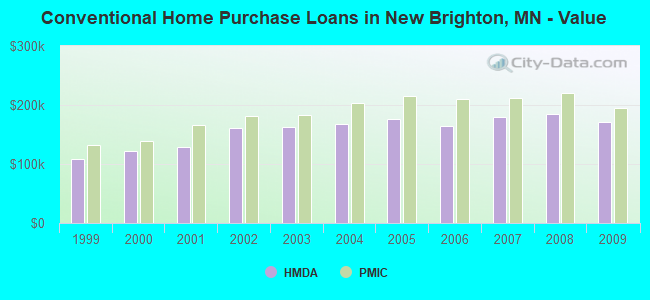
| Private Mortgage Insurance Companies Aggregated Statistics For Year 2009 (Based on 5 full tracts) | ||||
| A) Conventional Home Purchase Loans | B) Refinancings | |||
|---|---|---|---|---|
| Number | Average Value | Number | Average Value | |
| LOANS ORIGINATED | 18 | $194,111 | 10 | $205,300 |
| APPLICATIONS APPROVED, NOT ACCEPTED | 1 | $256,000 | 2 | $215,500 |
| APPLICATIONS DENIED | 5 | $157,800 | 2 | $253,500 |
| APPLICATIONS WITHDRAWN | 0 | $0 | 1 | $242,000 |
| FILES CLOSED FOR INCOMPLETENESS | 1 | $417,000 | 1 | $227,000 |
Detailed PMIC statistics for the following Tracts: 0411.04 , 0411.05, 0411.06, 0411.07, 0412.00
2002 - 2018 National Fire Incident Reporting System (NFIRS) incidents
- Fire incident types reported to NFIRS in New Brighton, MN
- 74259.9%Structure Fires
- 24820.0%Outside Fires
- 23318.8%Mobile Property/Vehicle Fires
- 161.3%Other
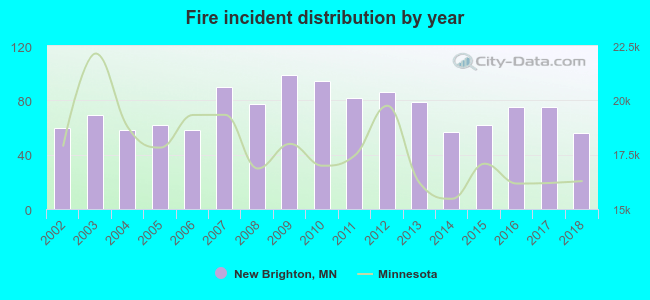 Based on the data from the years 2002 - 2018 the average number of fire incidents per year is 73. The highest number of reported fire incidents - 99 took place in 2009, and the least - 56 in 2018. The data has a decreasing trend.
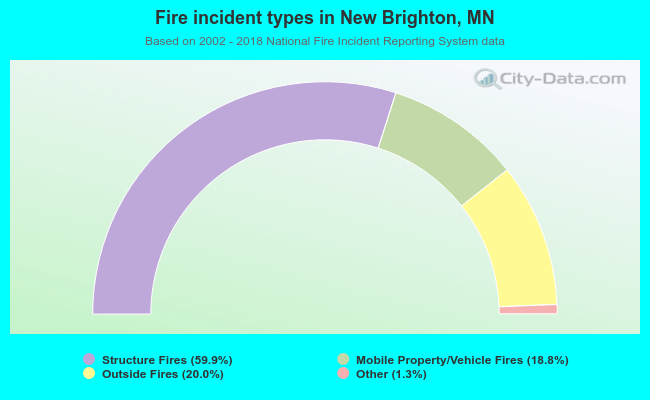 When looking into fire subcategories, the most incidents belonged to: Structure Fires (59.9%), and Outside Fires (20.0%).
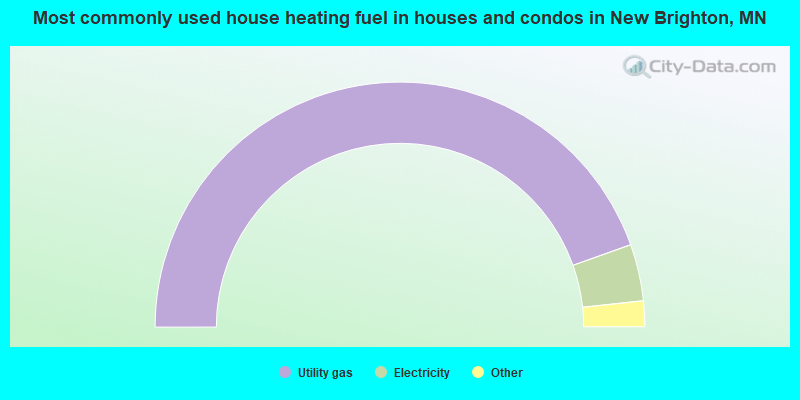
- 89.1%Utility gas
- 7.5%Electricity
- 2.5%Bottled, tank, or LP gas
- 0.8%Wood
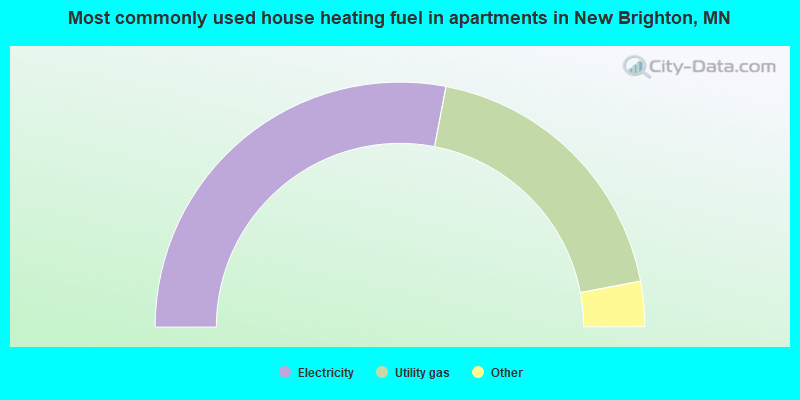
- 56.1%Electricity
- 38.0%Utility gas
- 3.1%Other fuel
- 2.0%No fuel used
- 0.9%Bottled, tank, or LP gas
New Brighton compared to Minnesota state average:
- Unemployed percentage significantly below state average.
- Black race population percentage above state average.
- Foreign-born population percentage above state average.
- Length of stay since moving in significantly above state average.
- Percentage of population with a bachelor's degree or higher above state average.
New Brighton on our top lists:
- #66 on the list of "Top 101 cities with the most residents born in Eastern Africa (population 500+)"
- #78 on the list of "Top 101 cities with the most residents born in Ethiopia (population 500+)"
- #82 (55112) on the list of "Top 101 zip codes with the largest percentage of Swedish first ancestries (pop 5,000+)"
- #13 on the list of "Top 101 counties with the highest percentage of residents that exercised in the past month"
- #14 on the list of "Top 101 counties with the highest carbon monoxide air pollution readings in 2012 (ppm)"
- #34 on the list of "Top 101 counties with the highest percentage of residents that visited a dentist within the past year"
- #34 on the list of "Top 101 counties with the largest increase in the number of births per 1000 residents 2000-2006 to 2007-2013 (pop 50,000+)"
- #38 on the list of "Top 101 counties with the largest increase in the number of infant deaths per 1000 residents 2000-2006 to 2007-2013 (pop. 50,000+)"

|
|
Total of 774 patent applications in 2008-2024.