Newport, Rhode Island

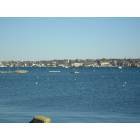
Newport: Newport Harbor
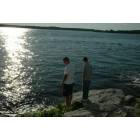
Newport: Newport Waterfront
Newport: newport waterfront
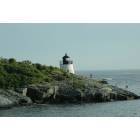
Newport: Lighthouse
Newport: newport rhode island
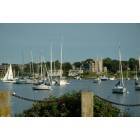
Newport: Newport Harbor

Newport: newport rhode island
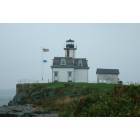
Newport: Rose Island Lighthouse
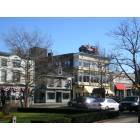
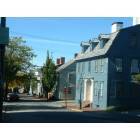
Newport: city center

Newport: Rabbit

Newport: Looking at the Newport Bridge from the War College
- see
52
more - add
your
Submit your own pictures of this city and show them to the world
- OSM Map
- General Map
- Google Map
- MSN Map
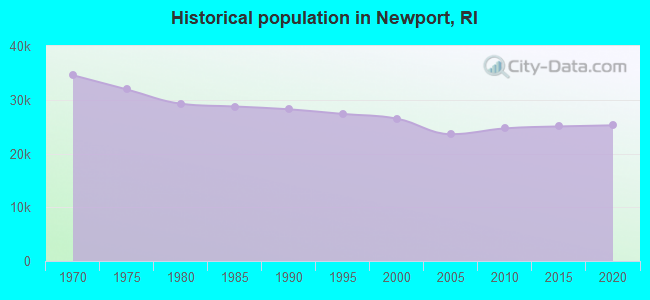
Population change since 2000: -6.8%
 |
| Males: 11,914 | |
| Females: 12,770 |
| Median resident age: | 38.1 years |
| Rhode Island median age: | 40.7 years |
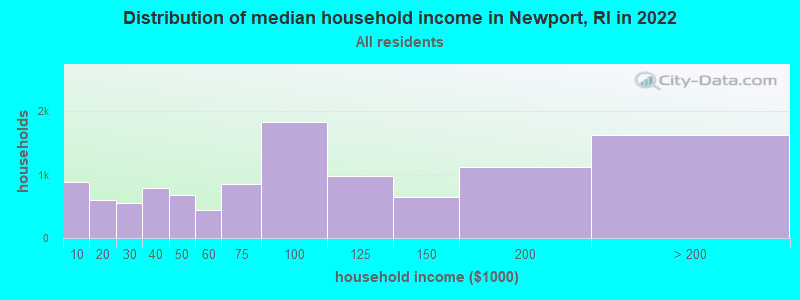
| Newport: | $78,810 |
| RI: | $81,854 |
Estimated per capita income in 2022: $59,034 (it was $25,441 in 2000)
Newport city income, earnings, and wages data
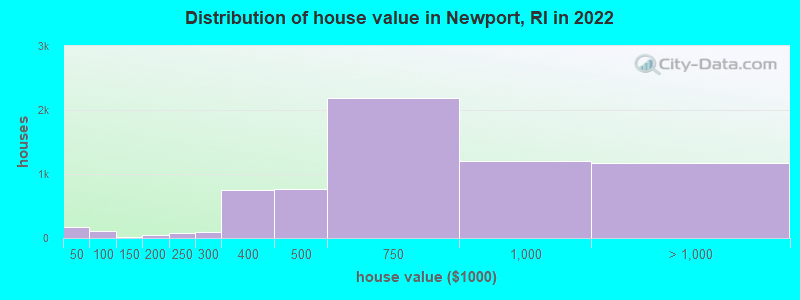
Estimated median house or condo value in 2022: $763,508 (it was $166,600 in 2000)
| Newport: | $763,508 |
| RI: | $383,900 |
Mean prices in 2022: all housing units: $940,545; detached houses: over $1,000,000; townhouses or other attached units: over $1,000,000; in 2-unit structures: $843,537; in 3-to-4-unit structures: $459,570; in 5-or-more-unit structures: over $1,000,000
Median gross rent in 2022: $1,414.
(13.1% for White Non-Hispanic residents, 25.2% for Black residents, 10.9% for Hispanic or Latino residents, 2.0% for American Indian residents, 25.2% for other race residents, 6.4% for two or more races residents)
Detailed information about poverty and poor residents in Newport, RI


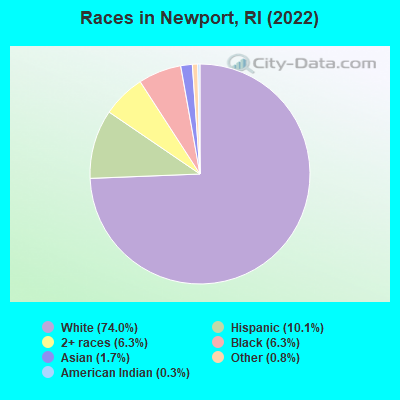
- 18,54774.0%White alone
- 2,52810.1%Hispanic
- 1,5746.3%Black alone
- 1,5806.3%Two or more races
- 4161.7%Asian alone
- 1890.8%Other race alone
- 810.3%American Indian alone
Races in Newport detailed stats: ancestries, foreign born residents, place of birth
According to our research of Rhode Island and other state lists, there were 6 registered sex offenders living in Newport, Rhode Island as of April 26, 2024.
The ratio of all residents to sex offenders in Newport is 4,103 to 1.
The ratio of registered sex offenders to all residents in this city is much lower than the state average.
Type |
2009 |
2010 |
2011 |
2012 |
2013 |
2014 |
2015 |
2016 |
2017 |
2018 |
2019 |
2020 |
2021 |
2022 |
|---|---|---|---|---|---|---|---|---|---|---|---|---|---|---|
| Murders (per 100,000) | 0 (0.0) | 0 (0.0) | 0 (0.0) | 1 (4.1) | 0 (0.0) | 0 (0.0) | 1 (4.2) | 1 (4.2) | 0 (0.0) | 0 (0.0) | 0 (0.0) | 0 (0.0) | 2 (7.9) | 1 (4.0) |
| Rapes (per 100,000) | 11 (47.3) | 11 (44.6) | 11 (44.6) | 11 (44.7) | 19 (79.6) | 15 (62.6) | 21 (87.9) | 14 (58.1) | 20 (80.6) | 22 (88.5) | 19 (77.3) | 14 (57.8) | 12 (47.5) | 22 (87.9) |
| Robberies (per 100,000) | 28 (120.4) | 18 (73.0) | 19 (77.1) | 15 (61.0) | 12 (50.3) | 12 (50.1) | 6 (25.1) | 7 (29.1) | 7 (28.2) | 7 (28.2) | 8 (32.5) | 4 (16.5) | 1 (4.0) | 4 (16.0) |
| Assaults (per 100,000) | 86 (369.7) | 109 (441.8) | 81 (328.7) | 77 (313.1) | 80 (335.1) | 68 (283.8) | 66 (276.3) | 39 (162.0) | 33 (133.0) | 56 (225.2) | 41 (166.8) | 56 (231.4) | 38 (150.6) | 30 (119.8) |
| Burglaries (per 100,000) | 206 (885.6) | 213 (863.3) | 217 (880.6) | 223 (906.7) | 177 (741.4) | 148 (617.7) | 138 (577.7) | 105 (436.1) | 90 (362.7) | 79 (317.7) | 79 (321.3) | 50 (206.6) | 70 (277.3) | 57 (227.6) |
| Thefts (per 100,000) | 761 (3,272) | 758 (3,072) | 837 (3,397) | 742 (3,017) | 779 (3,263) | 792 (3,306) | 549 (2,298) | 554 (2,301) | 670 (2,700) | 495 (1,991) | 437 (1,778) | 295 (1,219) | 333 (1,319) | 317 (1,266) |
| Auto thefts (per 100,000) | 39 (167.7) | 43 (174.3) | 33 (133.9) | 22 (89.4) | 34 (142.4) | 36 (150.3) | 38 (159.1) | 36 (149.5) | 27 (108.8) | 26 (104.6) | 21 (85.4) | 25 (103.3) | 15 (59.4) | 20 (79.9) |
| Arson (per 100,000) | 14 (60.2) | 18 (73.0) | 13 (52.8) | 12 (48.8) | 17 (71.2) | 13 (54.3) | 8 (33.5) | 9 (37.4) | 9 (36.3) | 4 (16.1) | 3 (12.2) | 4 (16.5) | 3 (11.9) | 9 (35.9) |
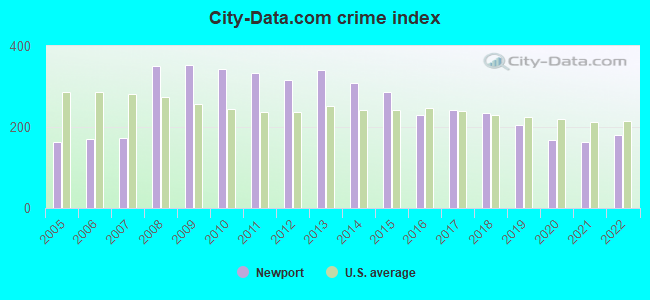
| City-Data.com crime index | 354.2 | 343.2 | 332.8 | 316.1 | 339.6 | 309.4 | 286.6 | 230.5 | 241.7 | 234.5 | 205.4 | 169.0 | 162.1 | 180.0 |
The City-Data.com crime index weighs serious crimes and violent crimes more heavily. Higher means more crime, U.S. average is 246.1. It adjusts for the number of visitors and daily workers commuting into cities.
Crime rate in Newport detailed stats: murders, rapes, robberies, assaults, burglaries, thefts, arson
Full-time law enforcement employees in 2021, including police officers: 101 (77 officers - 69 male; 8 female).
| Officers per 1,000 residents here: | 3.05 |
| Rhode Island average: | 2.27 |
 Recent articles from our blog. Our writers, many of them Ph.D. graduates or candidates, create easy-to-read articles on a wide variety of topics.

 | 2-month-old found dead in the Festival Field Housing Projects in Newport's North End (85 replies) |
| Bridges to/from Newport (112 replies) |
| How liberal/leftist is Newport? (37 replies) |
| How harsh are Newport winters? (11 replies) |
| Newport for a single 30-year-old? (10 replies) |
| What do in Newport (6 replies) |
Latest news from Newport, RI collected exclusively by city-data.com from local newspapers, TV, and radio stations
Ancestries: Irish (17.7%), American (10.5%), English (6.6%), Italian (5.7%), European (3.8%), German (3.6%).
Current Local Time: EST time zone
Incorporated in 1639
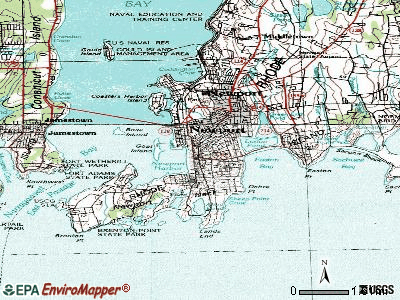
Elevation: 96 feet
Land area: 7.94 square miles.
Population density: 3,111 people per square mile (average).
1,852 residents are foreign born (3.2% Latin America, 2.9% Europe, 0.8% Asia).
| This city: | 7.5% |
| Rhode Island: | 14.4% |
Median real estate property taxes paid for housing units with mortgages in 2022: $5,210 (0.7%)
Median real estate property taxes paid for housing units with no mortgage in 2022: $5,851 (0.8%)
Nearest city with pop. 50,000+: Warwick, RI  (16.8 miles , pop. 85,808).
Nearest city with pop. 200,000+: Boston, MA (58.8 miles , pop. 589,141).
Nearest city with pop. 1,000,000+: Bronx, NY (140.5 miles , pop. 1,332,650).
Nearest cities:
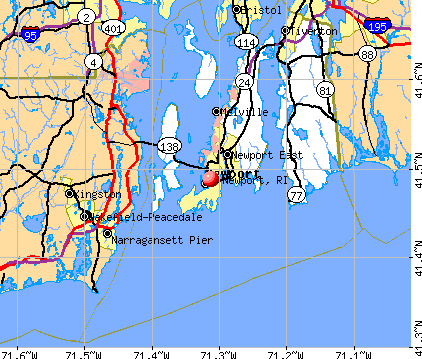
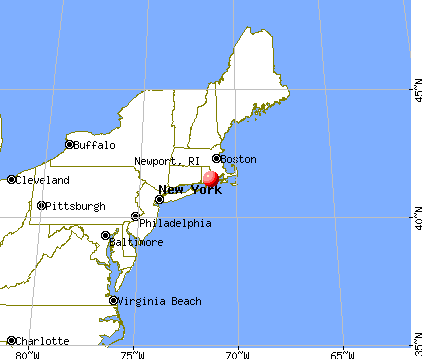
), Latitude: 41.49 N, Longitude: 71.31 W
Daytime population change due to commuting: +9,679 (+39.0%)
Workers who live and work in this city: 8,388 (69.2%)
Area code: 401
Detailed articles:
- Newport: Introduction
- Newport Basic Facts
- Newport: Communications
- Newport: Convention Facilities
- Newport: Economy
- Newport: Education and Research
- Newport: Geography and Climate
- Newport: Health Care
- Newport: History
- Newport: Municipal Government
- Newport: Population Profile
- Newport: Recreation
- Newport: Transportation
Newport tourist attractions:
- Beechwood Mansion, Newport, RI - Newport, Rhode Island - Astor Family Summer Home Provides Theatrical Ambience to Guests
- Castle Hill Inn and Resort, Newport, RI - Newport, Rhode Island Secluded Peninsula Hotel Offers Private Accommodations by the Sea
- Chateau-sur-Mer, Newport, RI - Newport, Rhode Island - Newport's Oldest Gilded Age Mansion Open to the Public
- Cliff Walk, Newport, RI - Newport, Rhode Island - Scenic Sea Cliff Walkway Lies Between Crash of Waves and Mansion Estate Lawns
- Hotel Viking, Newport, RI - Newport, Rhode Island - Downtown Hotel Offers Ample Event Space and Full Fitness and Spa Services
- Hyatt Regency Newport, RI - Newport, Rhode Island - Hyatt Offers Accommodations Surrounded by the Sea in This Resort Town
- International Tennis Hall of Fame, Newport, RI -Newport, Rhode Island Only Open North American Grass Courts Honor Tennis History with Hall of Fame
- Newport Beach Hotel & Suites, RI - Newport, Rhode Island - Renovated Beachside Hotel Just 1 Mile from Downtown Newport
- Newport Harbor Hotel & Marina, RI - Newport, Rhode Island - The Newport: Unique as Only Hotel and Marina in Sea Resort Town
- Newport Marriott, RI - Newport, Rhode Island - Full Fitness Facilities and Spa Offered Near Gilded Age Mansion Area of Southern Newport
- Newport Bay Club & Hotel
- Mill Street Inn
- Newport Beach Hotel and Suites
- Oceancliff Resort
- Belcourt Castle
- Vanderbilt Hall Hotel
- Ocean Drive, Newport, RI - Newport, Rhode Island - Winding Ten Mile Drive Weaves Through Dozens of Seaside Attractions in Resort Town
- Rosecliff, Newport, RI - Newport, Rhode Island - Gilded Age Mansion is Available for Private Events
- Rough Point, Newport, RI - Newport, Rhode Island - Seaside Estate of Duke Heiress Open to the Public
- The Breakers, Newport, RI - Newport, Rhode Island - Vanderbilt Family Mansion Launches New Audio Tour in 2009
- The Chanler at Cliff Walk, Newport, RI - Newport, Rhode Island - Small, Old Style Hotel Amidst Historic Mansions and the Seaside
- The Elms, Newport, RI - Newport, Rhode Island - Collection of Art and Antique Furniture in Turn of the Century Gilded Age Mansion
Newport, Rhode Island accommodation & food services, waste management - Economy and Business Data
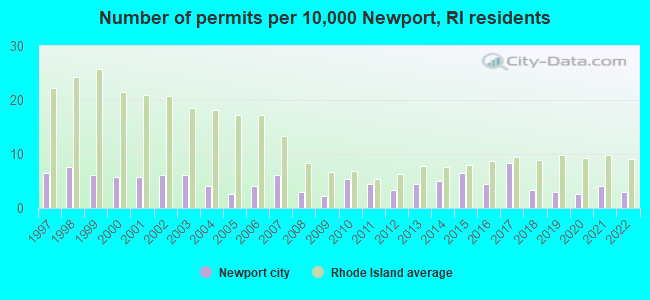
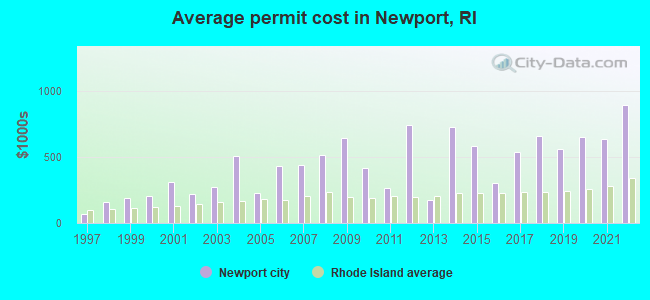
Single-family new house construction building permits:
- 2022: 8 buildings, average cost: $897,100
- 2021: 11 buildings, average cost: $635,600
- 2020: 7 buildings, average cost: $654,300
- 2019: 8 buildings, average cost: $566,400
- 2018: 9 buildings, average cost: $658,900
- 2017: 22 buildings, average cost: $536,900
- 2016: 12 buildings, average cost: $301,100
- 2015: 17 buildings, average cost: $587,100
- 2014: 13 buildings, average cost: $730,300
- 2013: 12 buildings, average cost: $174,200
- 2012: 9 buildings, average cost: $745,900
- 2011: 12 buildings, average cost: $266,800
- 2010: 14 buildings, average cost: $417,000
- 2009: 6 buildings, average cost: $644,000
- 2008: 8 buildings, average cost: $518,300
- 2007: 16 buildings, average cost: $442,700
- 2006: 11 buildings, average cost: $430,100
- 2005: 7 buildings, average cost: $224,600
- 2004: 11 buildings, average cost: $512,200
- 2003: 16 buildings, average cost: $271,300
- 2002: 16 buildings, average cost: $218,400
- 2001: 15 buildings, average cost: $311,600
- 2000: 15 buildings, average cost: $207,500
- 1999: 16 buildings, average cost: $191,100
- 1998: 20 buildings, average cost: $162,500
- 1997: 17 buildings, average cost: $71,300
| Here: | 3.2% |
| Rhode Island: | 3.3% |
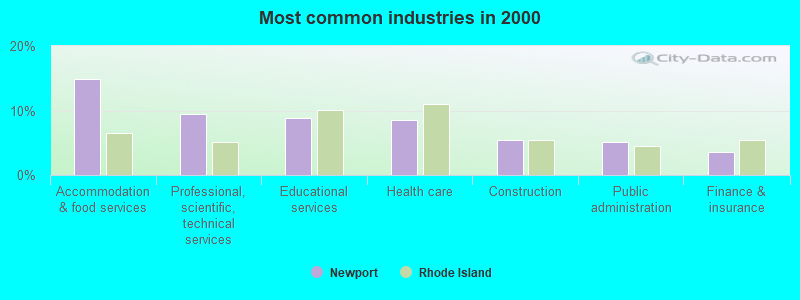
- Accommodation & food services (15.0%)
- Professional, scientific, technical services (9.4%)
- Educational services (8.8%)
- Health care (8.6%)
- Construction (5.5%)
- Public administration (5.0%)
- Finance & insurance (3.6%)
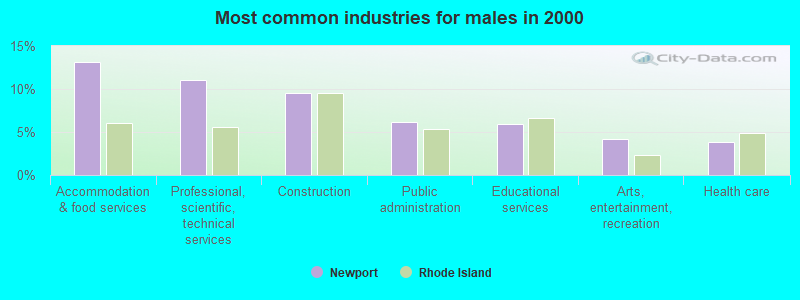
- Accommodation & food services (13.1%)
- Professional, scientific, technical services (11.1%)
- Construction (9.6%)
- Public administration (6.2%)
- Educational services (5.9%)
- Arts, entertainment, recreation (4.2%)
- Health care (3.8%)
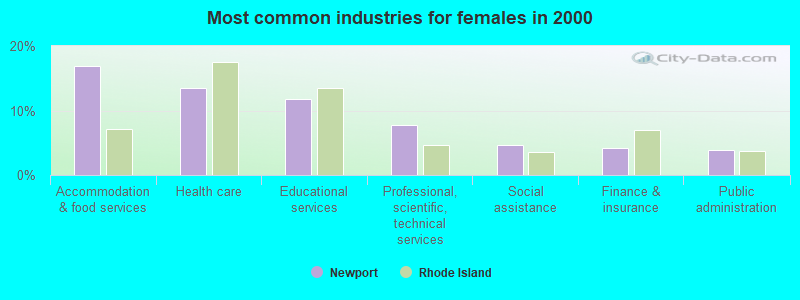
- Accommodation & food services (16.8%)
- Health care (13.5%)
- Educational services (11.8%)
- Professional, scientific, technical services (7.7%)
- Social assistance (4.6%)
- Finance & insurance (4.2%)
- Public administration (3.9%)
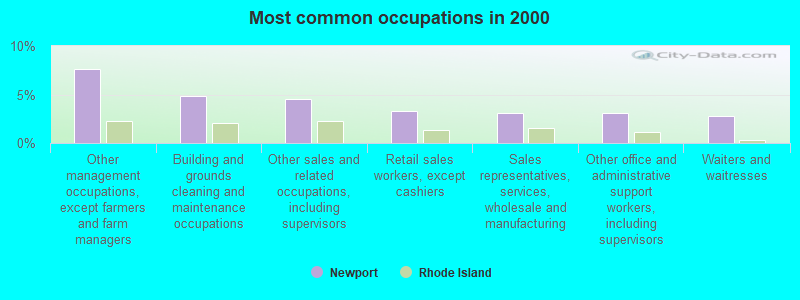
- Other management occupations, except farmers and farm managers (7.6%)
- Building and grounds cleaning and maintenance occupations (4.9%)
- Other sales and related occupations, including supervisors (4.5%)
- Retail sales workers, except cashiers (3.3%)
- Sales representatives, services, wholesale and manufacturing (3.1%)
- Other office and administrative support workers, including supervisors (3.0%)
- Waiters and waitresses (2.8%)
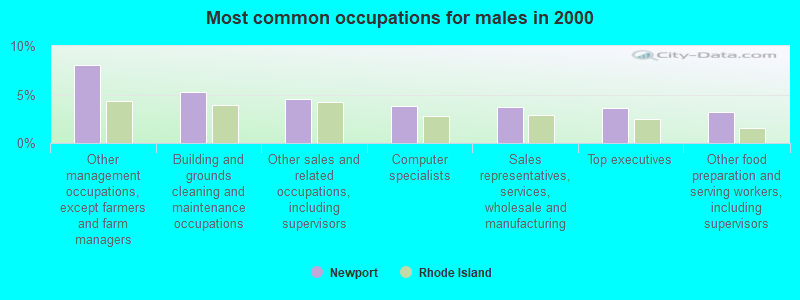
- Other management occupations, except farmers and farm managers (8.0%)
- Building and grounds cleaning and maintenance occupations (5.3%)
- Other sales and related occupations, including supervisors (4.5%)
- Computer specialists (3.8%)
- Sales representatives, services, wholesale and manufacturing (3.7%)
- Top executives (3.6%)
- Other food preparation and serving workers, including supervisors (3.2%)
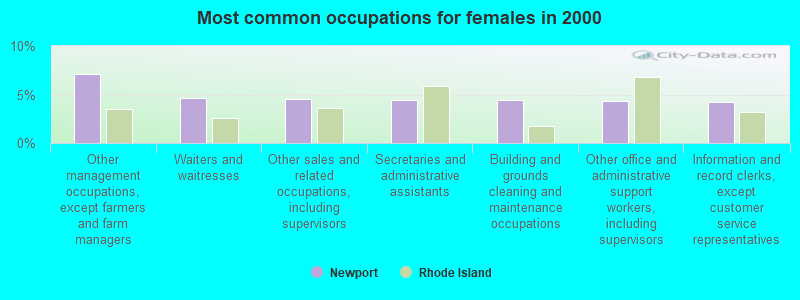
- Other management occupations, except farmers and farm managers (7.1%)
- Waiters and waitresses (4.6%)
- Other sales and related occupations, including supervisors (4.5%)
- Secretaries and administrative assistants (4.5%)
- Building and grounds cleaning and maintenance occupations (4.4%)
- Other office and administrative support workers, including supervisors (4.4%)
- Information and record clerks, except customer service representatives (4.2%)
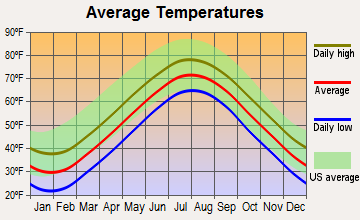
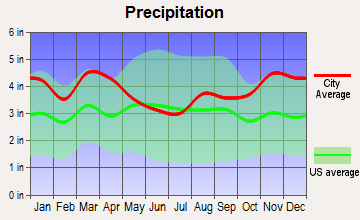
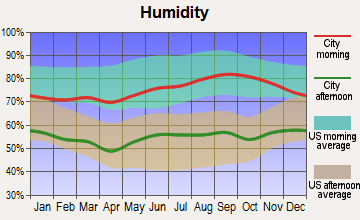
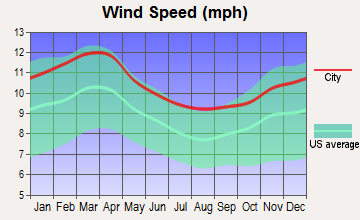
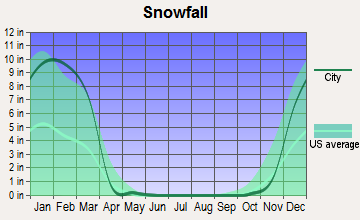
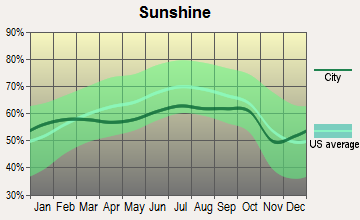
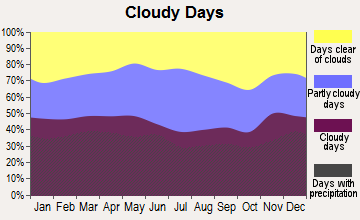
Average climate in Newport, Rhode Island
Based on data reported by over 4,000 weather stations
|
|

(lower is better)
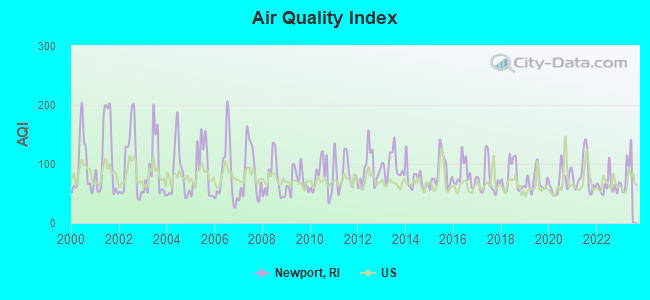
Air Quality Index (AQI) level in 2022 was 63.7. This is about average.
| City: | 63.7 |
| U.S.: | 72.6 |
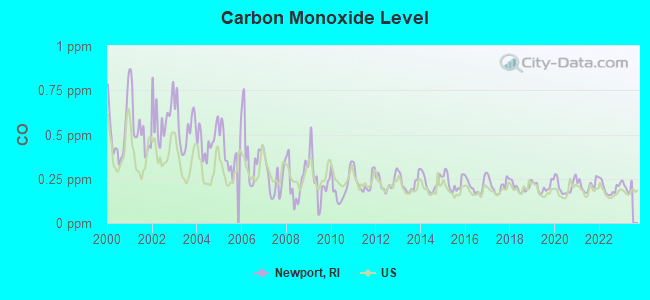
Carbon Monoxide (CO) [ppm] level in 2022 was 0.196. This is better than average. Closest monitor was 23.5 miles away from the city center.
| City: | 0.196 |
| U.S.: | 0.251 |
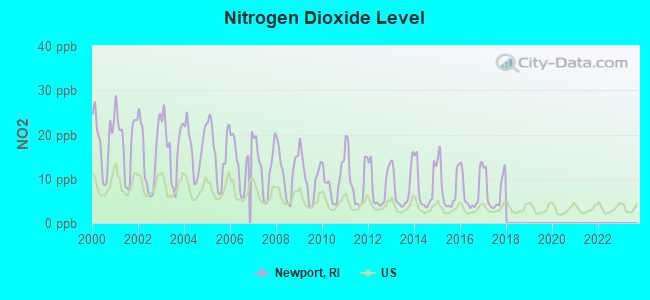
Nitrogen Dioxide (NO2) [ppb] level in 2017 was 7.20. This is significantly worse than average. Closest monitor was 0.2 miles away from the city center.
| City: | 7.20 |
| U.S.: | 5.11 |
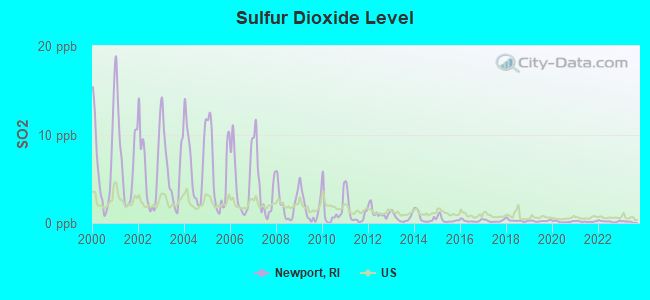
Sulfur Dioxide (SO2) [ppb] level in 2022 was 0.179. This is significantly better than average. Closest monitor was 0.2 miles away from the city center.
| City: | 0.179 |
| U.S.: | 1.515 |
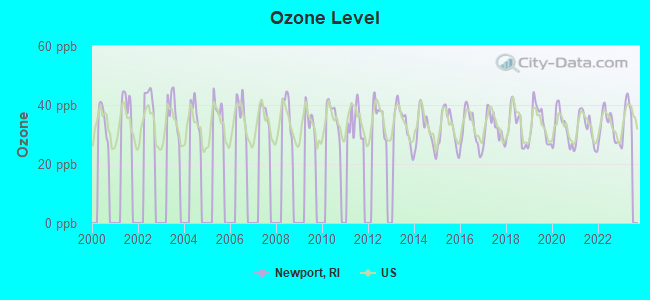
Ozone [ppb] level in 2022 was 32.6. This is about average. Closest monitor was 5.8 miles away from the city center.
| City: | 32.6 |
| U.S.: | 33.3 |
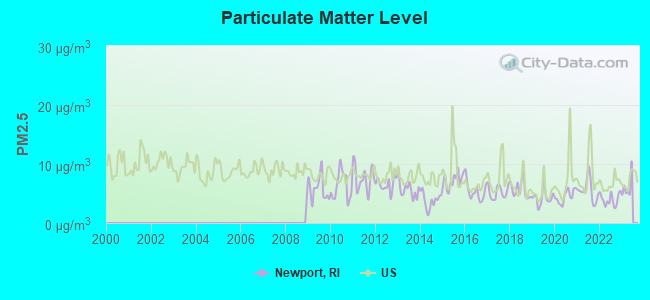
Particulate Matter (PM2.5) [µg/m3] level in 2022 was 3.99. This is significantly better than average. Closest monitor was 5.8 miles away from the city center.
| City: | 3.99 |
| U.S.: | 8.11 |
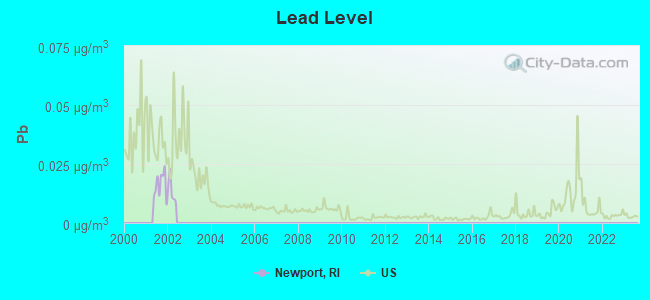
Lead (Pb) [µg/m3] level in 2001 was 0.0160. This is significantly worse than average. Closest monitor was 16.9 miles away from the city center.
| City: | 0.0160 |
| U.S.: | 0.0093 |
Tornado activity:
Newport-area historical tornado activity is below Rhode Island state average. It is 68% smaller than the overall U.S. average.
On 6/9/1953, a category F3 (max. wind speeds 158-206 mph) tornado 39.3 miles away from the Newport city center injured 17 people and caused between $500,000 and $5,000,000 in damages.
On 6/9/1953, a category F4 (max. wind speeds 207-260 mph) tornado 57.2 miles away from the city center killed 90 people and injured 1228 people and caused between $50,000,000 and $500,000,000 in damages.
Earthquake activity:
Newport-area historical earthquake activity is significantly above Rhode Island state average. It is 74% smaller than the overall U.S. average.On 10/7/1983 at 10:18:46, a magnitude 5.3 (5.1 MB, 5.3 LG, 5.1 ML, Class: Moderate, Intensity: VI - VII) earthquake occurred 229.7 miles away from Newport center
On 4/20/2002 at 10:50:47, a magnitude 5.3 (5.3 ML, Depth: 3.0 mi) earthquake occurred 241.4 miles away from Newport center
On 1/19/1982 at 00:14:42, a magnitude 4.7 (4.5 MB, 4.7 MD, 4.5 LG, Class: Light, Intensity: IV - V) earthquake occurred 139.9 miles away from the city center
On 4/20/2002 at 10:50:47, a magnitude 5.2 (5.2 MB, 4.2 MS, 5.2 MW, 5.0 MW) earthquake occurred 240.5 miles away from the city center
On 10/16/2012 at 23:12:25, a magnitude 4.7 (4.7 ML, Depth: 10.0 mi) earthquake occurred 149.7 miles away from the city center
On 8/22/1992 at 12:20:32, a magnitude 4.8 (4.8 MB, 3.8 MS, 4.7 LG, Depth: 6.2 mi) earthquake occurred 172.9 miles away from Newport center
Magnitude types: regional Lg-wave magnitude (LG), body-wave magnitude (MB), duration magnitude (MD), local magnitude (ML), surface-wave magnitude (MS), moment magnitude (MW)
Natural disasters:
The number of natural disasters in Newport County (16) is near the US average (15).Major Disasters (Presidential) Declared: 9
Emergencies Declared: 7
Causes of natural disasters: Hurricanes: 6, Blizzards: 3, Floods: 3, Snowstorms: 3, Storms: 3, Winter Storms: 2, Snow: 1, Snowfall: 1, Tropical Storm: 1, Wind: 1 (Note: some incidents may be assigned to more than one category).
Hospitals and medical centers in Newport:
- NEWPORT HOSPITAL (Voluntary non-profit - Private, FRIENDSHIP STREET)
- CARRIAGE HOUSE NURSING HOME (93 MIANTONOMI AVENUE)
- HEATHERWOOD NURSING AND SUBACUTE CENTER (398 BELLEVUE AVENUE)
- ST CLARE HOME (309 SPRING STREET)
- VANDERBILT REHAB CTR SUBACUTE UNIT (20 POWEL AVENUE)
- VILLAGE HOUSE CONVALESCENT HOME INC (70 HARRISON AVENUE)
Airports and heliports located in Newport:
- Newport State Airport (UUU) (Runways: 2, Air Taxi Ops: 473, Itinerant Ops: 946, Local Ops: 17,279, Military Ops: 10)
- Goat Island Heliport (RI21)
- Hopedene Heliport (75RI)
- Malbone Estate Heliport (2RI7)
Colleges/Universities in Newport:
Other colleges/universities with over 2000 students near Newport:
- University of Rhode Island (about 12 miles; Kingston, RI; Full-time enrollment: 14,656)
- Roger Williams University (about 12 miles; Bristol, RI; FT enrollment: 4,375)
- New England Institute of Technology (about 16 miles; East Greenwich, RI; FT enrollment: 3,183)
- Community College of Rhode Island (about 18 miles; Warwick, RI; FT enrollment: 10,500)
- University of Massachusetts-Dartmouth (about 19 miles; North Dartmouth, MA; FT enrollment: 7,545)
- Bristol Community College (about 19 miles; Fall River, MA; FT enrollment: 5,707)
- Johnson & Wales University-Providence (about 24 miles; Providence, RI; FT enrollment: 10,898)
Public high school in Newport:
- ROGERS HIGH SCHOOL (Students: 634, Location: 15 WICKHAM ROAD, Grades: 9-12)
Public elementary/middle schools in Newport:
- FRANK E. THOMPSON MIDDLE (Students: 512, Location: 55 BROADWAY, Grades: 5-8)
- CLAIBORNE PELL ELEMENTARY (Location: 35 DEXTER STREET, Grades: PK-4)
Private elementary/middle schools in Newport:
User-submitted facts and corrections:
- Rhode Island has many kinds of tourist attractions. There are parks, theaters, and many more. The area code is 401 added by Chris
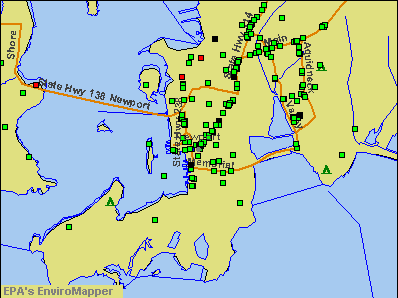
Points of interest:
Notable locations in Newport: Brown Howard Wharf (A), Spring Wharf (B), Mall at Newport (C), Pitts Head Tavern (D), Army and Naval YMCA (E), Hammersmith Farm (F), Newport Country Club (G), Howard Wharf (H), Washington Square (I), Waites Wharf (J), The Point (K), Old Stone Mill (L), Coddington Wharf (M), Castle Hill Coast Guard Station (N), One Mile Corner (O), Friends Meeting House (P), Gateway Visitors Center (Q), Ina Mosher Health Sciences Library (R), International Tennis Hall of Fame (S), International Tennis Hall of Fame Library (T). Display/hide their locations on the map
Shopping Centers: Long Wharf Mall Shopping Center (1), Bellevue Shopping Center (2). Display/hide their locations on the map
Churches in Newport include: First Congregational Church (A), Salvation Army (B), Shiloh Church (C), Saint Peters Lutheran Church (D), Saint Georges Church (E), Newport Congregational Church (F), Hillside Baptist Church (G), Saint Marys Church (H), The Rhode Island Fisherman and Whale Museum (I). Display/hide their locations on the map
Cemeteries: Arnold Burying Ground (1), Braman Cemetery (2), Common Ground Cemetery (3), Governors Graveyard (4), Island Cemetery (5), Saint Marys Cemetery (6), The Jewish Cemetery (7). Display/hide their locations on the map
Lakes and reservoirs: Lily Pond (A), Almy Pond (B), Boat House Gully (C), Easton Pond (D). Display/hide their locations on the map
Parks in Newport include: Morton Park (1), Murphy Field (2), Ocean Drive Historic District (3), Ochre Point-Cliffs Historic District (4), Newport Historic District (5), Touro Park (6), Brick Market Place (7), Washington Square (8), Long Wharf Mill (9). Display/hide their locations on the map
Beaches: Hazard Beach (A), Bailey Beach (B), Gooseberry Beach (C), Collins Beach (D), Easton Beach (E). Display/hide their locations on the map
Tourist attractions: Newport Restoration Foundation (Museums; 51 Touro Street), Rough Point (Museums; 680 Bellevue Avenue), Artillery Company of Newport (Museums; 23 Clarke Street), Newport Exploration Center Aquarium (Museums; 175 Memorial Boulevard), Thames & Kosmos (Museums; 20 Bull Street), Belcourt Castle (Museums; 659 Bellevue Ave), Tennis Hall of Fame - Musuem (Museums; 194 Bellevue Avenue), Coleman for Creative Studies (Museums; 76 Bellevue Avenue), Rose Island Light House Foundation (Museums; 365 Thames Street).
Hotels: Castle Hill Inn & Resort (Ocean Avenue), Bed & Breakfast of Rhode Island (175 Spring Street), Pineapple Inn (372 Coddington Hwy), Inn On Bellevue (30 Bellevue Ave), Jailhouse Inn (13 W Marlborough St), A-1 Reservations of Professional Newport (28 Bellevue Avenue), America's Realty of Newport (8 Fair Street), Francis Malbone House (Ip) (392 Thames St), Eastern Resorts Reservations (115 Long Wharf Drive).
Courts: Rhode Island State - Public Defender- Murray Judicial Complex (Courthouse), Rhode Island State - Courts- Family Court (45 Washington Square), Rhode Island State - Courts- Superior Court (Eisenhower Square), Rhode Island State - District Court- Courts- Probation & Parole- Adult Proba (45 Washington Square), New York Club Sailing Club-Harbour Court (5 Halidon Avenue), Rhode Island State - Courts- District Court (2nd Division).
Birthplace of: Matthew Perry (naval officer), Thomas H. Ince - Cinema pioneer, Samuel Ward (American statesman) - Rhode Island colonial governor, Samuel Cranston - Rhode Island colonial governor, Joseph Wanton - Rhode Island colonial governor, William A. Chanler - Politician, Van Johnson - (born 1916), actor, Mena Suvari - (born 1979), actress, Robert J. Mrazek - Politician, Tanya Donelly - Singer-songwriter.
Drinking water stations with addresses in Newport and their reported violations in the past:
NEWPORT-CITY OF (Population served: 43,809, Surface water):Past health violations:NAVAL STATION, NEWPORT (Population served: 7,871, Purch surface water):Past monitoring violations:
- MCL, Average - Between JAN-2013 and MAR-2013, Contaminant: TTHM. Follow-up actions: St Formal NOV issued (APR-25-2013), St Violation/Reminder Notice (APR-25-2013), St Public Notif requested (APR-25-2013), St Compliance achieved (MAY-16-2013), St Public Notif received (MAY-16-2013)
- MCL, Average - Between JUL-2012 and SEP-2012, Contaminant: TTHM. Follow-up actions: St Formal NOV issued (SEP-04-2012), St Violation/Reminder Notice (SEP-04-2012), St Public Notif received (SEP-04-2012), St Public Notif requested (SEP-04-2012), St Compliance achieved (MAY-13-2013)
- MCL, Average - Between JUL-2009 and SEP-2009, Contaminant: TTHM. Follow-up actions: St BCA signed (FEB-12-2009), St Public Notif requested (JUL-31-2009), St Formal NOV issued (JUL-31-2009), St Violation/Reminder Notice (JUL-31-2009), St Compliance achieved (SEP-01-2009), St Public Notif received (SEP-01-2009)
- MCL, Average - Between APR-2009 and JUN-2009, Contaminant: TTHM. Follow-up actions: St BCA signed (FEB-12-2009), St Formal NOV issued (MAY-07-2009), St Violation/Reminder Notice (MAY-07-2009), St Public Notif requested (MAY-07-2009), St Compliance achieved (JUN-03-2009), St Public Notif received (JUN-03-2009)
- MCL, Average - Between JAN-2009 and MAR-2009, Contaminant: TTHM. Follow-up actions: St Formal NOV issued (FEB-02-2009), St Violation/Reminder Notice (FEB-02-2009), St Public Notif requested (FEB-02-2009), St BCA signed (FEB-12-2009), St Public Notif received (FEB-25-2009), St Compliance achieved (FEB-25-2009)
- MCL, Average - Between OCT-2008 and DEC-2008, Contaminant: TTHM. Follow-up actions: St Public Notif requested (NOV-07-2008), St Formal NOV issued (NOV-07-2008), St Violation/Reminder Notice (NOV-07-2008), St Compliance achieved (NOV-20-2008), St BCA signed (FEB-12-2009), St Public Notif received (NOV-20-2009)
- MCL, Average - Between OCT-2006 and DEC-2006, Contaminant: TTHM. Follow-up actions: St Public Notif requested (NOV-03-2006), St Formal NOV issued (NOV-03-2006), St Violation/Reminder Notice (NOV-03-2006), St Public Notif received (NOV-14-2006), St BCA signed (FEB-06-2008), St Compliance achieved (FEB-06-2008)
- Monitoring and Reporting (DBP) - In AUG-2007, Contaminant: Chlorine dioxide. Follow-up actions: St Public Notif requested (SEP-20-2007), St Formal NOV issued (SEP-20-2007), St Violation/Reminder Notice (SEP-20-2007), St Compliance achieved (JUN-06-2008), St Public Notif received (JUN-06-2008)
Past health violations:UNITED STATES NAVY (FORT ADAMS) (Population served: 318, Purch surface water):Past monitoring violations:
- MCL, Average - Between APR-2012 and JUN-2012, Contaminant: TTHM. Follow-up actions: St Formal NOV issued (JUL-12-2012), St Violation/Reminder Notice (JUL-12-2012), St Public Notif requested (JUL-12-2012), St Compliance achieved (AUG-21-2012), St Public Notif received (AUG-21-2012)
- MCL, Average - Between JAN-2012 and MAR-2012, Contaminant: TTHM. Follow-up actions: St Formal NOV issued (JUL-12-2012), St Violation/Reminder Notice (JUL-12-2012), St Public Notif requested (JUL-12-2012), St Compliance achieved (AUG-21-2012), St Public Notif received (AUG-21-2012)
- MCL, Average - Between OCT-2011 and DEC-2011, Contaminant: TTHM. Follow-up actions: St Formal NOV issued (JAN-17-2012), St Violation/Reminder Notice (JAN-17-2012), St Public Notif requested (JAN-17-2012), St Compliance achieved (FEB-13-2012), St Public Notif received (FEB-13-2012)
- MCL, Average - Between JAN-2007 and MAR-2007, Contaminant: TTHM. Follow-up actions: St Public Notif requested (FEB-16-2007), St Formal NOV issued (FEB-16-2007), St Violation/Reminder Notice (FEB-16-2007), St Public Notif received (FEB-27-2007), St Compliance achieved (APR-01-2007)
- MCL, Average - Between OCT-2006 and DEC-2006, Contaminant: TTHM. Follow-up actions: St Public Notif requested (DEC-20-2006), St Formal NOV issued (DEC-20-2006), St Violation/Reminder Notice (DEC-20-2006), St Compliance achieved (JAN-12-2007), St Public Notif received (JAN-12-2007)
- MCL, Average - Between JUL-2006 and SEP-2006, Contaminant: TTHM. Follow-up actions: St Public Notif requested (OCT-03-2006), St Formal NOV issued (OCT-03-2006), St Violation/Reminder Notice (OCT-03-2006), St Compliance achieved (NOV-08-2006), St Public Notif received (NOV-08-2006)
- 3 other older health violations
- Monitoring, Turbidity (Enhanced SWTR) - In MAY-2014, Contaminant: IESWTR. Follow-up actions: St Violation/Reminder Notice (JUN-16-2014), St Compliance achieved (JUN-16-2014), St Formal NOV issued (JUN-16-2014)
- Follow-up Or Routine LCR Tap M/R - In OCT-01-2011, Contaminant: Lead and Copper Rule. Follow-up actions: St Public Notif requested (MAY-30-2012), St Formal NOV issued (MAY-30-2012), St Violation/Reminder Notice (MAY-30-2012), St Public Notif received (SEP-04-2012), St Compliance achieved (OCT-15-2012)
- 2 routine major monitoring violations
Past health violations:NEWPORT BOYS & GIRLS CLUB CAMP (Population served: 125, Groundwater):Past monitoring violations:
- MCL, Average - Between JUL-2005 and SEP-2005, Contaminant: TTHM. Follow-up actions: St Public Notif requested (SEP-14-2005), St Formal NOV issued (SEP-14-2005), St Violation/Reminder Notice (SEP-14-2005), St Compliance achieved (OCT-21-2005), St Public Notif received (OCT-21-2005)
- Monitoring, Turbidity (Enhanced SWTR) - In MAY-2014, Contaminant: IESWTR. Follow-up actions: St Violation/Reminder Notice (JUN-16-2014), St Compliance achieved (JUN-16-2014), St Formal NOV issued (JUN-16-2014)
- Follow-up Or Routine LCR Tap M/R - In OCT-01-2011, Contaminant: Lead and Copper Rule. Follow-up actions: St Public Notif requested (MAY-30-2012), St Formal NOV issued (MAY-30-2012), St Violation/Reminder Notice (MAY-30-2012), St Public Notif received (JUL-01-2012), St Compliance achieved (OCT-15-2012)
- 2 routine major monitoring violations
- 2 minor monitoring violations
Past monitoring violations:
- 3 routine major monitoring violations
- One minor monitoring violation
| This city: | 2.0 people |
| Rhode Island: | 2.4 people |
| This city: | 46.5% |
| Whole state: | 62.8% |
| This city: | 7.3% |
| Whole state: | 7.6% |
Likely homosexual households (counted as self-reported same-sex unmarried-partner households)
- Lesbian couples: 0.4% of all households
- Gay men: 0.4% of all households
People in group quarters in Newport in 2010:
- 1,385 people in military barracks and dormitories (nondisciplinary)
- 1,081 people in college/university student housing
- 240 people in nursing facilities/skilled-nursing facilities
- 92 people in other noninstitutional facilities
- 28 people in group homes intended for adults
- 20 people in emergency and transitional shelters (with sleeping facilities) for people experiencing homelessness
- 9 people in group homes for juveniles (non-correctional)
- 5 people in workers' group living quarters and job corps centers
People in group quarters in Newport in 2000:
- 893 people in college dormitories (includes college quarters off campus)
- 771 people in military barracks, etc.
- 245 people in nursing homes
- 75 people in military transient quarters for temporary residents
- 55 people in other noninstitutional group quarters
- 29 people in homes for the mentally retarded
- 12 people in religious group quarters
- 2 people in other nonhousehold living situations
Banks with branches in Newport (2011 data):
- RBS Citizens, National Association: Stop & Shop - Newport Branch at 199 Connell Hwy., branch established on 2001/05/29; Newport Branch at 8 Washington Square, branch established on 1903/01/01. Info updated 2007/09/19: Bank assets: $106,940.6 mil, Deposits: $75,690.2 mil, headquarters in Providence, RI, positive income, 1135 total offices, Holding Company: Uk Financial Investments Limited
- BankNewport: Banknewport at 10 Washington Square, branch established on 1819/01/01; Wellington Square Branch at 580 Thames Street, branch established on 1986/03/24. Info updated 2006/11/03: Bank assets: $1,098.1 mil, Deposits: $885.1 mil, local headquarters, positive income, Mortgage Lending Specialization, 13 total offices, Holding Company: Oceanpoint Financial Partners, Mhc
- Bank of America, National Association: Bellevue Branch at 181 Bellevue Avenue, branch established on 1958/11/24. Info updated 2009/11/18: Bank assets: $1,451,969.3 mil, Deposits: $1,077,176.8 mil, headquarters in Charlotte, NC, positive income, 5782 total offices, Holding Company: Bank Of America Corporation
- Sovereign Bank, National Association: Thames Street Branch at 292 Thames St, branch established on 2007/05/07. Info updated 2012/01/31: Bank assets: $78,146.9 mil, Deposits: $48,042.9 mil, headquarters in Wilmington, DE, positive income, Commercial Lending Specialization, 718 total offices, Holding Company: Banco Santander, S.A.
- Newport Federal Savings Bank: at 100 Bellevue Avenue, branch established on 1888/01/01. Info updated 2011/07/21: Bank assets: $453.5 mil, Deposits: $267.0 mil, local headquarters, positive income, Commercial Lending Specialization, 6 total offices
For population 15 years and over in Newport:
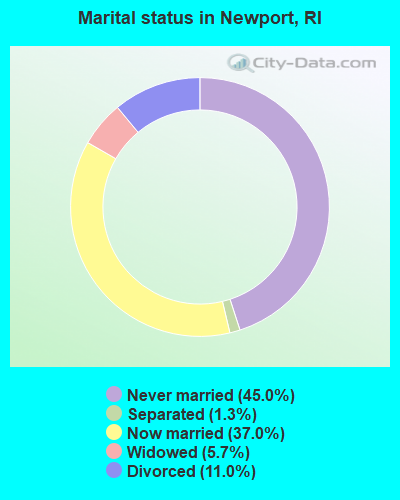
- Never married: 45.0%
- Now married: 37.0%
- Separated: 1.3%
- Widowed: 5.7%
- Divorced: 11.0%
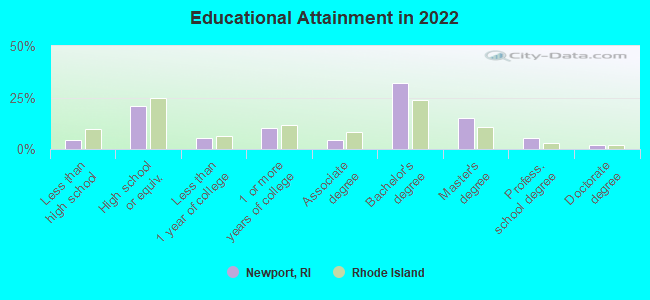
For population 25 years and over in Newport:
- High school or higher: 95.0%
- Bachelor's degree or higher: 51.8%
- Graduate or professional degree: 23.0%
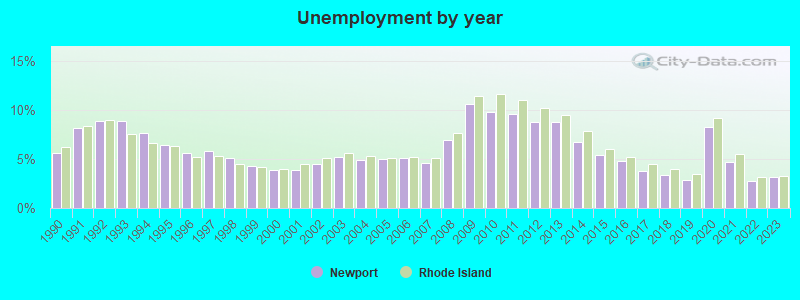
- Unemployed: 10.6%
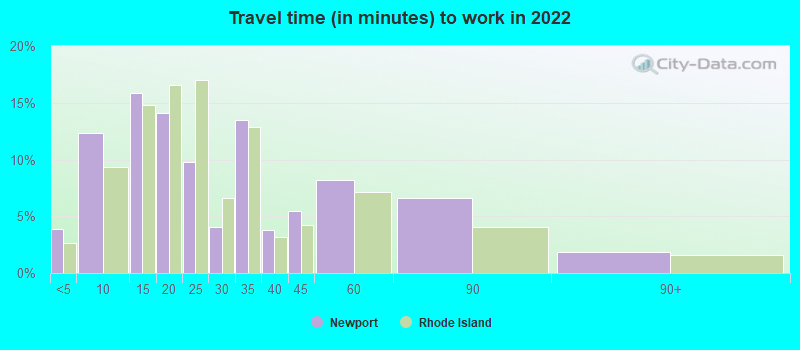
- Mean travel time to work (commute): 14.4 minutes
| Here: | 11.0 |
| Rhode Island average: | 12.8 |
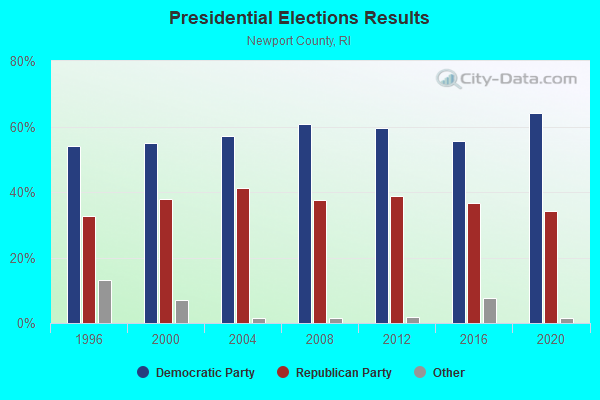
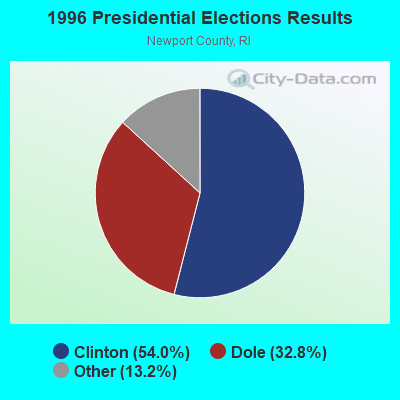
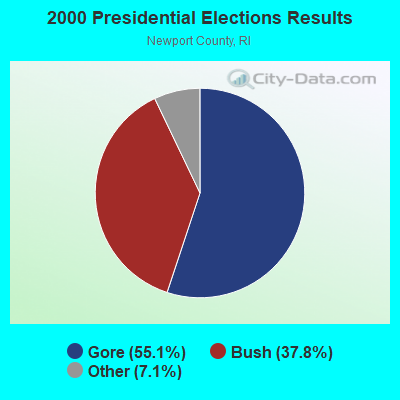
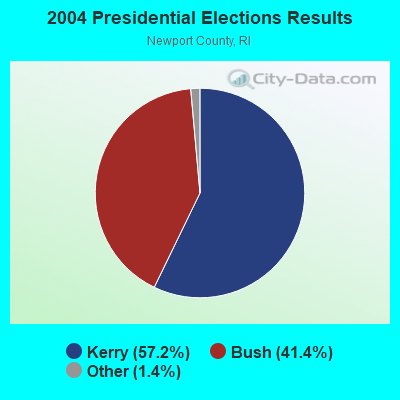
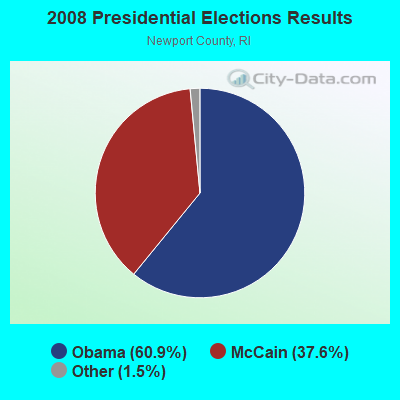
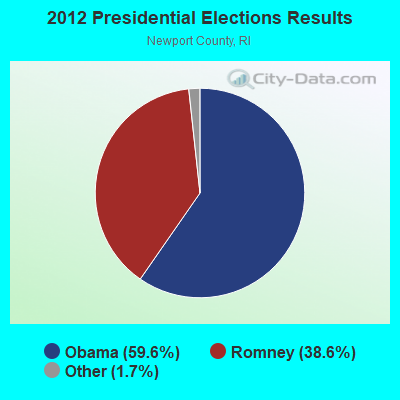
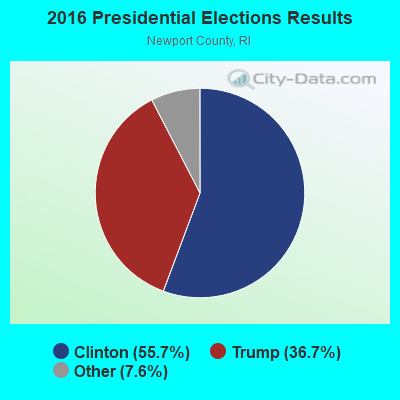
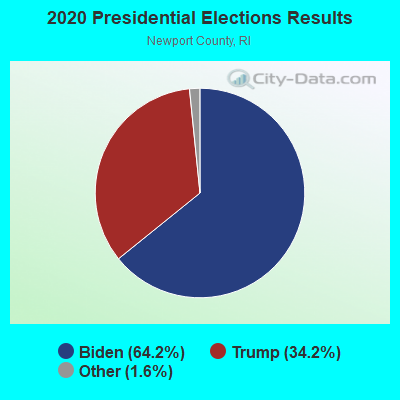
Graphs represent county-level data. Detailed 2008 Election Results
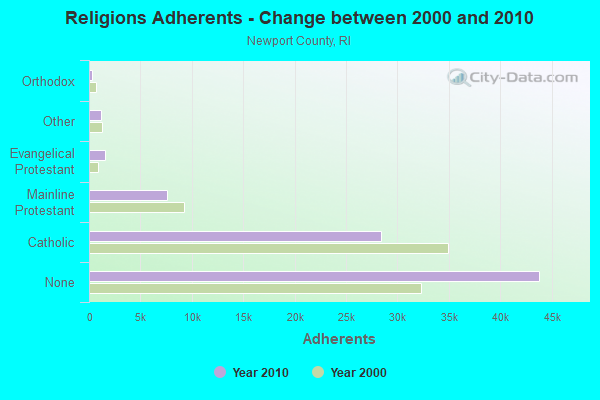
Religion statistics for Newport, RI (based on Newport County data)
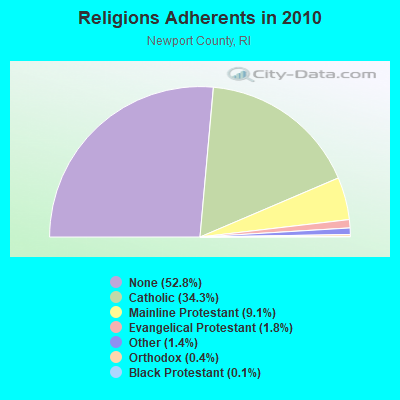
| Religion | Adherents | Congregations |
|---|---|---|
| Catholic | 28,392 | 14 |
| Mainline Protestant | 7,579 | 24 |
| Evangelical Protestant | 1,522 | 15 |
| Other | 1,174 | 9 |
| Orthodox | 300 | 1 |
| Black Protestant | 117 | 1 |
| None | 43,804 | - |
Food Environment Statistics:
| This county: | 1.48 / 10,000 pop. |
| State: | 1.92 / 10,000 pop. |
| Newport County: | 0.12 / 10,000 pop. |
| Rhode Island: | 0.05 / 10,000 pop. |
| Newport County: | 2.22 / 10,000 pop. |
| Rhode Island: | 1.42 / 10,000 pop. |
| Here: | 1.97 / 10,000 pop. |
| Rhode Island: | 2.24 / 10,000 pop. |
| This county: | 17.26 / 10,000 pop. |
| Rhode Island: | 9.75 / 10,000 pop. |
| Newport County: | 7.2% |
| Rhode Island: | 7.9% |
| Newport County: | 18.4% |
| Rhode Island: | 22.6% |
| Newport County: | 15.9% |
| Rhode Island: | 16.3% |
Health and Nutrition:
| Newport: | 50.4% |
| Rhode Island: | 49.4% |
| Here: | 48.5% |
| Rhode Island: | 46.7% |
| Here: | 28.6 |
| Rhode Island: | 28.6 |
| Here: | 20.1% |
| Rhode Island: | 21.3% |
| Here: | 10.6% |
| State: | 10.8% |
| Newport: | 6.8 |
| State: | 6.8 |
| Newport: | 33.1% |
| Rhode Island: | 33.8% |
| Newport: | 57.9% |
| State: | 56.0% |
| Newport: | 79.8% |
| Rhode Island: | 78.5% |
More about Health and Nutrition of Newport, RI Residents
| Local government employment and payroll (March 2022) | |||||
| Function | Full-time employees | Monthly full-time payroll | Average yearly full-time wage | Part-time employees | Monthly part-time payroll |
|---|---|---|---|---|---|
| Elementary and Secondary - Instruction | 249 | $2,209,581 | $106,486 | 65 | $110,120 |
| Firefighters | 90 | $727,594 | $97,013 | 0 | $0 |
| Police Protection - Officers | 79 | $598,239 | $90,872 | 0 | $0 |
| Elementary and Secondary - Other Total | 70 | $284,725 | $48,810 | 61 | $57,042 |
| Water Supply | 58 | $321,027 | $66,419 | 0 | $0 |
| Financial Administration | 21 | $134,257 | $76,718 | 1 | $855 |
| Parks and Recreation | 19 | $101,288 | $63,971 | 26 | $25,655 |
| Other Government Administration | 17 | $116,547 | $82,268 | 4 | $2,884 |
| Streets and Highways | 16 | $93,872 | $70,404 | 0 | $0 |
| Police - Other | 16 | $78,470 | $58,853 | 30 | $42,535 |
| Other and Unallocable | 13 | $62,474 | $57,668 | 0 | $0 |
| Judicial and Legal | 4 | $25,566 | $76,698 | 3 | $7,281 |
| Housing and Community Development (Local) | 4 | $26,403 | $79,209 | 2 | $5,004 |
| Solid Waste Management | 2 | $8,591 | $51,546 | 1 | $2,445 |
| Fire - Other | 1 | $5,591 | $67,092 | 0 | $0 |
| Totals for Government | 659 | $4,794,227 | $87,300 | 193 | $253,819 |
Newport government finances - Expenditure in 2021 (per resident):
- Construction - General - Other: $4,475,000 ($181.29)
Sewerage: $2,009,000 ($81.39)
Water Utilities: $560,000 ($22.69)
Sea and Inland Port Facilities: $266,000 ($10.78)
- Current Operations - Elementary and Secondary Education: $47,806,000 ($1936.72)
Local Fire Protection: $21,035,000 ($852.17)
Police Protection: $19,699,000 ($798.05)
Health - Other: $10,176,000 ($412.25)
Water Utilities: $10,072,000 ($408.04)
Sewerage: $9,788,000 ($396.53)
Financial Administration: $4,500,000 ($182.30)
General - Other: $2,826,000 ($114.49)
Solid Waste Management: $2,245,000 ($90.95)
Central Staff Services: $2,188,000 ($88.64)
Libraries: $1,978,000 ($80.13)
Parking Facilities: $1,298,000 ($52.58)
Protective Inspection and Regulation - Other: $988,000 ($40.03)
Sea and Inland Port Facilities: $793,000 ($32.13)
Public Welfare - Other: $568,000 ($23.01)
Judicial and Legal Services: $517,000 ($20.94)
Housing and Community Development: $296,000 ($11.99)
Regular Highways: $12,000 ($0.49)
- General - Interest on Debt: $2,929,000 ($118.66)
- Intergovernmental to Local - Other - Elementary and Secondary Education: $559,000 ($22.65)
- Other Capital Outlay - Housing and Community Development: $1,081,000 ($43.79)
Elementary and Secondary Education: $604,000 ($24.47)
Parking Facilities: $229,000 ($9.28)
- Total Salaries and Wages: $24,826,000 ($1005.75)
- Water Utilities - Interest on Debt: $2,417,000 ($97.92)
Newport government finances - Revenue in 2021 (per resident):
- Charges - Sewerage: $18,930,000 ($766.89)
Other: $11,153,000 ($451.83)
Parking Facilities: $1,597,000 ($64.70)
Elementary and Secondary Education - Other: $1,203,000 ($48.74)
Sea and Inland Port Facilities: $1,114,000 ($45.13)
Housing and Community Development: $225,000 ($9.12)
Elementary and Secondary Education School Lunch: $142,000 ($5.75)
Parks and Recreation: $127,000 ($5.15)
Solid Waste Management: $56,000 ($2.27)
- Federal Intergovernmental - Education: $852,000 ($34.52)
Housing and Community Development: $434,000 ($17.58)
- Local Intergovernmental - Education: $3,535,000 ($143.21)
- Miscellaneous - Interest Earnings: $1,921,000 ($77.82)
Fines and Forfeits: $1,293,000 ($52.38)
Sale of Property: $1,111,000 ($45.01)
Donations From Private Sources: $908,000 ($36.78)
General Revenue - Other: $319,000 ($12.92)
Rents: $148,000 ($6.00)
- Revenue - Water Utilities: $17,948,000 ($727.11)
- State Intergovernmental - Education: $20,543,000 ($832.24)
General Local Government Support: $4,294,000 ($173.96)
Other: $1,692,000 ($68.55)
- Tax - Property: $79,822,000 ($3233.75)
Other Selective Sales: $4,699,000 ($190.37)
Other License: $1,576,000 ($63.85)
Alcoholic Beverage License: $194,000 ($7.86)
Occupation and Business License - Other: $93,000 ($3.77)
Amusements License: $2,000 ($0.08)
Newport government finances - Debt in 2021 (per resident):
- Long Term Debt - Beginning Outstanding - Unspecified Public Purpose: $167,115,000 ($6770.18)
Outstanding Unspecified Public Purpose: $153,973,000 ($6237.77)
Retired Unspecified Public Purpose: $13,142,000 ($532.41)
Newport government finances - Cash and Securities in 2021 (per resident):
- Bond Funds - Cash and Securities: $16,062,000 ($650.70)
- Other Funds - Cash and Securities: $94,351,000 ($3822.35)
8.14% of this county's 2021 resident taxpayers lived in other counties in 2020 ($131,002 average adjusted gross income)
| Here: | 8.14% |
| Rhode Island average: | 5.99% |
0.15% of residents moved from foreign countries ($1,480 average AGI)
Newport County: 0.15% Rhode Island average: 0.03%
Top counties from which taxpayers relocated into this county between 2020 and 2021:
| from Providence County, RI | |
| from Bristol County, MA | |
| from Bristol County, RI |
8.40% of this county's 2020 resident taxpayers moved to other counties in 2021 ($96,134 average adjusted gross income)
| Here: | 8.40% |
| Rhode Island average: | 5.97% |
0.10% of residents moved to foreign countries ($1,383 average AGI)
Newport County: 0.10% Rhode Island average: 0.02%
Top counties to which taxpayers relocated from this county between 2020 and 2021:
| to Providence County, RI | |
| to Bristol County, MA | |
| to Kent County, RI |
| Businesses in Newport, RI | ||||
| Name | Count | Name | Count | |
|---|---|---|---|---|
| 7-Eleven | 3 | JoS. A. Bank | 1 | |
| Banana Republic | 1 | Lane Furniture | 1 | |
| Ben & Jerry's | 2 | Marriott | 1 | |
| Best Western | 1 | MasterBrand Cabinets | 2 | |
| Brooks Brothers | 1 | Motel 6 | 1 | |
| CVS | 1 | Nike | 4 | |
| Chico's | 1 | Old Navy | 1 | |
| Cold Stone Creamery | 1 | Panera Bread | 1 | |
| Coldwater Creek | 1 | Payless | 1 | |
| Curves | 1 | Pizza Hut | 1 | |
| DressBarn | 1 | RadioShack | 1 | |
| Dressbarn | 1 | Starbucks | 1 | |
| Dunkin Donuts | 4 | Stop & Shop | 2 | |
| Express | 1 | T-Mobile | 2 | |
| Famous Footwear | 1 | T.J.Maxx | 1 | |
| FedEx | 7 | Talbots | 1 | |
| GameStop | 1 | True Value | 1 | |
| Gap | 1 | U-Haul | 1 | |
| H&R Block | 1 | UPS | 3 | |
| Hyatt | 1 | Vans | 2 | |
| J.Crew | 1 | Walmart | 1 | |
Strongest AM radio stations in Newport:
- WADK (1540 AM; 1 kW; NEWPORT, RI; Owner: ASTRO TELE-COMMUNICATIONS CORP.)
- WALE (990 AM; 50 kW; GREENVILLE, RI; Owner: NORTH AMERICAN BROADCASTING CO., INC.)
- WEEI (850 AM; 50 kW; BOSTON, MA; Owner: ENTERCOM BOSTON LICENSE, LLC)
- WPRO (630 AM; 5 kW; PROVIDENCE, RI; Owner: CITADEL BROADCASTING COMPANY)
- WCRN (830 AM; 50 kW; WORCESTER, MA; Owner: CARTER BROADCASTING CORPORATION)
- WRKO (680 AM; 50 kW; BOSTON, MA; Owner: ENTERCOM BOSTON LICENSE, LLC)
- WBZ (1030 AM; 50 kW; BOSTON, MA; Owner: INFINITY BROADCASTING OPERATIONS, INC.)
- WKOX (1200 AM; 50 kW; FRAMINGHAM, MA; Owner: CAPSTAR TX LIMITED PARTNERSHIP)
- WHJJ (920 AM; 5 kW; PROVIDENCE, RI)
- WBIX (1060 AM; 40 kW; NATICK, MA; Owner: LANGER BROADCASTING CORPORATION)
- WRNI (1290 AM; 10 kW; PROVIDENCE, RI; Owner: WRNI FOUNDATION)
- WSAR (1480 AM; 5 kW; FALL RIVER, MA; Owner: BRISTOL COUNTY BROADCASTING, INC.)
- WSKO (790 AM; 5 kW; PROVIDENCE, RI; Owner: CITADEL BROADCASTING COMPANY)
Strongest FM radio stations in Newport:
- W243AI (96.5 FM; NEWPORT, RI; Owner: DAVID P. MAXSON)
- WXHQ-LP (105.9 FM; NEWPORT, RI; Owner: NEWPORT MUSICAL ARTS ASSOCIATION)
- WKKB (100.3 FM; MIDDLETOWN, RI; Owner: CITADEL BROADCASTING COMPANY)
- WRIU (90.3 FM; KINGSTON, RI; Owner: UNIVERSITY OF RHODE ISLAND)
- WWBB (101.5 FM; PROVIDENCE, RI; Owner: CLEAR CHANNEL BROADCASTING LICENSES, INC.)
- WSKO-FM (99.7 FM; WAKEFIELD-PEACEDALE, RI; Owner: CITADEL BROADCASTING COMPANY)
- WAKX (102.7 FM; NARRAGANSETT PIER, RI; Owner: AAA ENTERTAINMENT LICENSING LLC)
- WPRO-FM (92.3 FM; PROVIDENCE, RI; Owner: CITADEL BROADCASTING COMPANY)
- WCTK (98.1 FM; NEW BEDFORD, MA; Owner: HALL COMMUNICATIONS, INC.)
- WSNE-FM (93.3 FM; TAUNTON, MA; Owner: CAPSTAR TX LIMITED PARTNERSHIP)
- WWRX-FM (103.7 FM; WESTERLY, RI; Owner: FNX BROADCASTING OF RHODE ISLAND, LLC)
- WWLI (105.1 FM; PROVIDENCE, RI; Owner: CITADEL BROADCASTING COMPANY)
- WBRU (95.5 FM; PROVIDENCE, RI; Owner: BROWN BROADCASTING SERVICE, INC.)
- WJFD-FM (97.3 FM; NEW BEDFORD, MA; Owner: EDMUND DINIS, TRUSTEE)
- WHJY (94.1 FM; PROVIDENCE, RI; Owner: CAPSTAR TX LIMITED PARTNERSHIP)
- WSMU-FM (91.1 FM; NORTH DARTMOUTH, MA; Owner: UNIVERSITY OF MASSACHUSETTS)
- WFHN (107.1 FM; FAIRHAVEN, MA; Owner: CITADEL BROADCASTING COMPANY)
- WQRI (88.3 FM; BRISTOL, RI; Owner: ROGER WILLIAMS UNIVERSITY)
TV broadcast stations around Newport:
- WPXQ (Channel 69; BLOCK ISLAND, RI; Owner: OCEAN STATE TELEVISION, L.L.C.)
- WLNE-TV (Channel 6; NEW BEDFORD, MA; Owner: FREEDOM BROADCASTING OF SOUTHERN NEW ENGLAND, INC.)
- WNAC-TV (Channel 64; PROVIDENCE, RI; Owner: WNAC, LLC)
- WPRI-TV (Channel 12; PROVIDENCE, RI; Owner: TVL BROADCASTING OF RHODE ISLAND, LLC)
- WJAR (Channel 10; PROVIDENCE, RI; Owner: OUTLET BROADCASTING, INC.)
- WSBE-TV (Channel 36; PROVIDENCE, RI; Owner: RHODE ISLAND PUBLIC TELECOM. AUTHORITY)
- WLWC (Channel 28; NEW BEDFORD, MA; Owner: C-28 FCC LICENSEE SUBSIDIARY, LLC)
- WWDP (Channel 46; NORWELL, MA; Owner: NORWELL TELEVISION, LLC)
- WHPX (Channel 26; NEW LONDON, CT; Owner: PAXSON HARTFORD LICENSE, INC.)
- WRIW-LP (Channel 50; PROVIDENCE, RI; Owner: ZGS PROVIDENCE, INC.)
Medal of Honor Recipients
Medal of Honor Recipients born in Newport: Hazard Stevens, Michael Walsh.
- National Bridge Inventory (NBI) Statistics
- 13Number of bridges
- 289ft / 88.5mTotal length
- $32,284,000Total costs
- 139,527Total average daily traffic
- 10,252Total average daily truck traffic
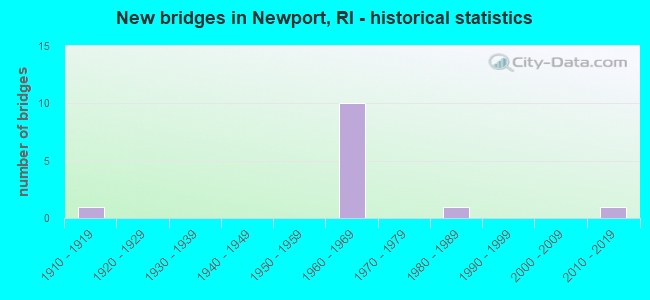
- New bridges - historical statistics
- 11910-1919
- 101960-1969
- 11980-1989
- 12010-2019
FCC Registered Antenna Towers: 14 (See the full list of FCC Registered Antenna Towers)
FCC Registered Commercial Land Mobile Towers: 1 (See the full list of FCC Registered Commercial Land Mobile Towers in Newport, RI)
FCC Registered Private Land Mobile Towers: 2 (See the full list of FCC Registered Private Land Mobile Towers)
FCC Registered Broadcast Land Mobile Towers: 21 (See the full list of FCC Registered Broadcast Land Mobile Towers)
FCC Registered Microwave Towers: 11 (See the full list of FCC Registered Microwave Towers in this town)
FCC Registered Paging Towers: 1 (See the full list of FCC Registered Paging Towers)
FCC Registered Maritime Coast & Aviation Ground Towers: 25 (See the full list of FCC Registered Maritime Coast & Aviation Ground Towers)
FCC Registered Amateur Radio Licenses: 133 (See the full list of FCC Registered Amateur Radio Licenses in Newport)
FAA Registered Aircraft Manufacturers and Dealers: 1 (See the full list of FAA Registered Manufacturers and Dealers in Newport)
FAA Registered Aircraft: 29 (See the full list of FAA Registered Aircraft)
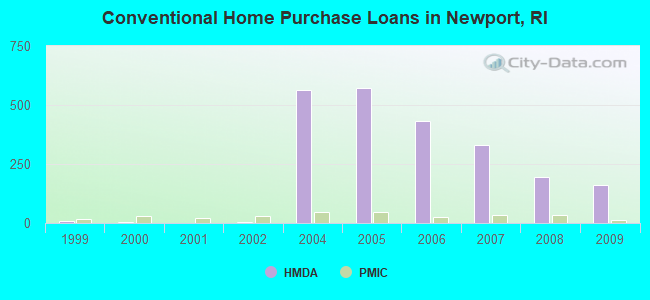
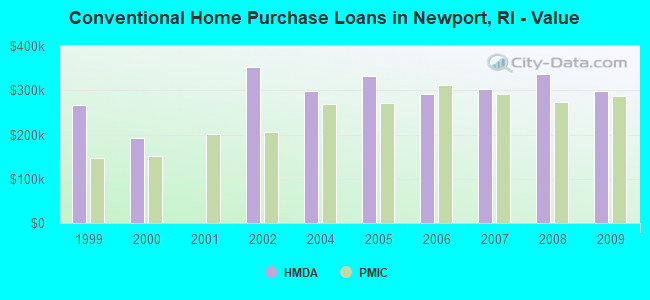
| Home Mortgage Disclosure Act Aggregated Statistics For Year 2009 (Based on 9 full tracts) | ||||||||||||||
| A) FHA, FSA/RHS & VA Home Purchase Loans | B) Conventional Home Purchase Loans | C) Refinancings | D) Home Improvement Loans | E) Loans on Dwellings For 5+ Families | F) Non-occupant Loans on < 5 Family Dwellings (A B C & D) | G) Loans On Manufactured Home Dwelling (A B C & D) | ||||||||
|---|---|---|---|---|---|---|---|---|---|---|---|---|---|---|
| Number | Average Value | Number | Average Value | Number | Average Value | Number | Average Value | Number | Average Value | Number | Average Value | Number | Average Value | |
| LOANS ORIGINATED | 52 | $286,615 | 159 | $297,459 | 618 | $283,977 | 36 | $105,056 | 2 | $381,000 | 224 | $298,174 | 0 | $0 |
| APPLICATIONS APPROVED, NOT ACCEPTED | 3 | $255,000 | 12 | $297,833 | 29 | $227,069 | 1 | $25,000 | 0 | $0 | 14 | $259,500 | 0 | $0 |
| APPLICATIONS DENIED | 11 | $342,727 | 33 | $418,667 | 226 | $323,106 | 14 | $123,643 | 0 | $0 | 104 | $383,375 | 1 | $380,000 |
| APPLICATIONS WITHDRAWN | 12 | $274,667 | 16 | $335,938 | 101 | $255,703 | 2 | $66,500 | 0 | $0 | 22 | $318,545 | 0 | $0 |
| FILES CLOSED FOR INCOMPLETENESS | 2 | $385,500 | 5 | $286,200 | 16 | $245,000 | 1 | $241,000 | 0 | $0 | 7 | $272,143 | 0 | $0 |
Detailed HMDA statistics for the following Tracts: 0405.00 , 0406.00, 0407.00, 0408.00, 0409.00, 0410.00, 0411.00, 0412.00
| Private Mortgage Insurance Companies Aggregated Statistics For Year 2009 (Based on 8 full tracts) | ||||||
| A) Conventional Home Purchase Loans | B) Refinancings | C) Non-occupant Loans on < 5 Family Dwellings (A & B) | ||||
|---|---|---|---|---|---|---|
| Number | Average Value | Number | Average Value | Number | Average Value | |
| LOANS ORIGINATED | 12 | $287,083 | 8 | $299,375 | 3 | $333,333 |
| APPLICATIONS APPROVED, NOT ACCEPTED | 9 | $264,667 | 3 | $188,667 | 2 | $370,000 |
| APPLICATIONS DENIED | 1 | $333,000 | 7 | $312,857 | 3 | $334,000 |
| APPLICATIONS WITHDRAWN | 0 | $0 | 2 | $297,000 | 1 | $347,000 |
| FILES CLOSED FOR INCOMPLETENESS | 0 | $0 | 0 | $0 | 0 | $0 |
Detailed PMIC statistics for the following Tracts: 0405.00 , 0406.00, 0407.00, 0408.00, 0409.00, 0410.00, 0411.00
2008 - 2018 National Fire Incident Reporting System (NFIRS) incidents
- Fire incident types reported to NFIRS in Newport, RI
- 20739.7%Outside Fires
- 18936.2%Structure Fires
- 8917.0%Other
- 377.1%Mobile Property/Vehicle Fires
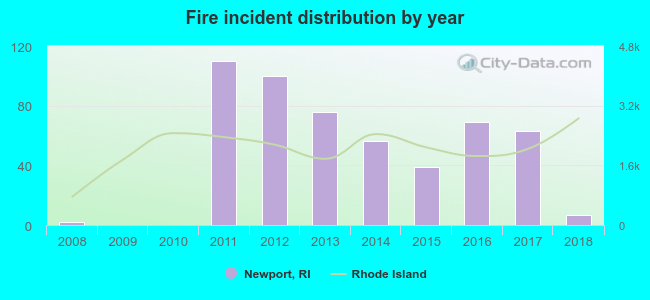 According to the data from the years 2008 - 2018 the average number of fires per year is 47. The highest number of fire incidents - 110 took place in 2011, and the least - 0 in 2009. The data has an increasing trend.
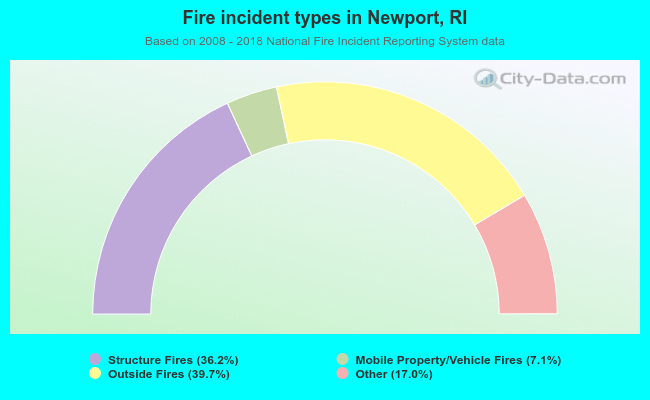 When looking into fire subcategories, the most incidents belonged to: Outside Fires (39.7%), and Structure Fires (36.2%).
Fire-safe hotels and motels in Newport, Rhode Island:
- Pineapple Inn, 372 Coddington Hwy, Newport, Rhode Island 01776 , Phone: (401) 847-2600, Fax: (401) 847-5230
- Cliffside Inn, 2 Seaview Ave, Newport, Rhode Island 02840 , Phone: (401) 847-1811, Fax: (401) 848-5850
- Jailhouse Inn, 13 Marlborough St, Newport, Rhode Island 02840 , Phone: (401) 847-4638, Fax: (401) 849-0405
- Best Western Mainstay Inn, 151 Admiral Kalbfus Rd, Newport, Rhode Island 02840 , Phone: (401) 849-9880, Fax: (401) 847-3215
- Yankee Peddler Inn, 113 Touro St, Newport, Rhode Island 02840 , Phone: (401) 846-1323, Fax: (401) 849-3023
- Newport Susse Chalet Navy Hotel, 1290 Perry Rd, Newport, Rhode Island 02840 , Phone: (401) 841-0800, Fax: (401) 841-0937
- Newport Bay Club & Hotel, 337 Thames St, Newport, Rhode Island 02840 , Phone: (401) 849-8600, Fax: (407) 848-7350
- Vanderbilt Hall Hotel, 41 Mary St, Newport, Rhode Island 02840 , Phone: (401) 846-6200, Fax: (401) 846-0701
- 5 other hotels and motels
| Most common first names in Newport, RI among deceased individuals | ||
| Name | Count | Lived (average) |
|---|---|---|
| Mary | 628 | 81.4 years |
| John | 467 | 74.0 years |
| William | 314 | 74.2 years |
| Joseph | 261 | 73.7 years |
| Margaret | 227 | 79.8 years |
| James | 199 | 75.2 years |
| George | 198 | 74.6 years |
| Charles | 193 | 75.9 years |
| Helen | 172 | 80.5 years |
| Elizabeth | 171 | 81.9 years |
| Most common last names in Newport, RI among deceased individuals | ||
| Last name | Count | Lived (average) |
|---|---|---|
| Sullivan | 220 | 79.4 years |
| Smith | 110 | 75.8 years |
| Murphy | 104 | 78.2 years |
| Silvia | 94 | 73.8 years |
| Shea | 67 | 77.9 years |
| Brown | 59 | 79.7 years |
| Johnson | 43 | 80.7 years |
| Kelly | 43 | 77.9 years |
| Williams | 41 | 76.1 years |
| Peckham | 40 | 78.7 years |
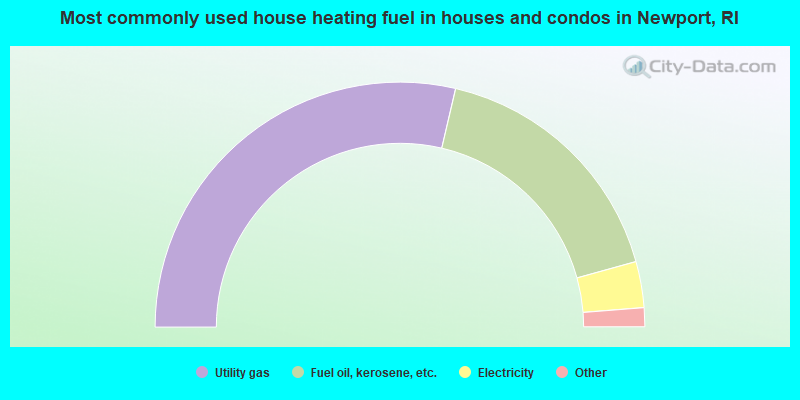
- 57.3%Utility gas
- 34.1%Fuel oil, kerosene, etc.
- 6.1%Electricity
- 1.4%Wood
- 0.8%Bottled, tank, or LP gas
- 0.2%Other fuel
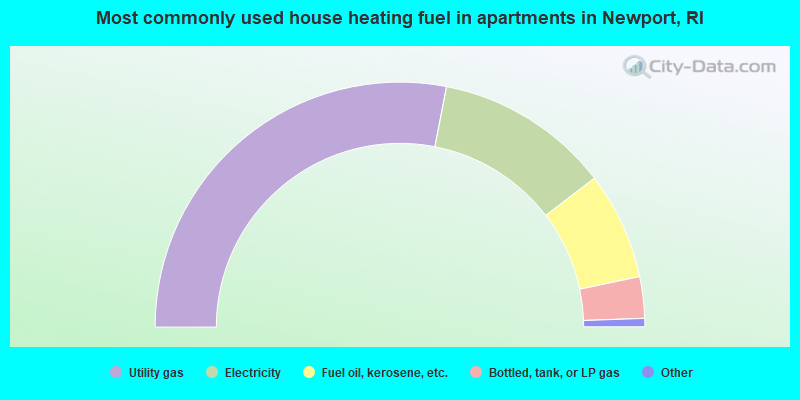
- 56.1%Utility gas
- 23.1%Electricity
- 14.2%Fuel oil, kerosene, etc.
- 5.5%Bottled, tank, or LP gas
- 0.6%No fuel used
- 0.3%Other fuel
- 0.1%Solar energy
Newport compared to Rhode Island state average:
- Median house value above state average.
- Hispanic race population percentage below state average.
- Median age below state average.
- Foreign-born population percentage below state average.
- Length of stay since moving in significantly above state average.
- Percentage of population with a bachelor's degree or higher above state average.
Newport on our top lists:
- #10 on the list of "Top 101 cities with the biggest property tax revenues per resident (population 10,000+)"
- #26 on the list of "Top 101 cities with the most full-time firefighters per 1000 residents (population 5,000+)"
- #33 on the list of "Top 101 cities with the biggest local government total salary and wages expenses per resident (population 10,000+)"
- #41 on the list of "Top 101 cities with the largest percentage of people in military transient quarters for temporary residents (population 1,000+)"
- #59 on the list of "Top 101 cities with the most local government spending on current operations of parking facilities per resident (population 10,000+)"
- #77 on the list of "Top 101 cities with the highest cost per building permit(population 5,000+)"
- #101 on the list of "Top 101 cities with the most residents born in Other Southern Europe (population 500+)"
- #2 (02840) on the list of "Top 101 zip codes with the most museums in 2005"
- #16 on the list of "Top 101 counties with the highest percentage of residents that visited a dentist within the past year"
- #20 on the list of "Top 101 counties with the highest percentage of residents that smoked 100+ cigarettes in their lives"
- #21 on the list of "Top 101 counties with the lowest ground withdrawal of fresh water for public supply (pop. 50,000+)"
- #33 on the list of "Top 101 counties with the best general health status score of residents (1-5), 3 years of data"
- #35 on the list of "Top 101 counties with the lowest percentage of residents that keep firearms around their homes"

|
|
Total of 224 patent applications in 2008-2024.