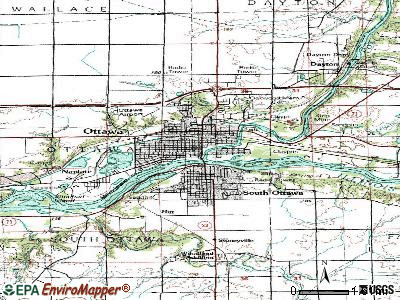
Ottawa, Illinois

Ottawa: Spring has come. Baby geese by the IL. river in Ottawa
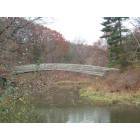
Ottawa: A footbrige at Starved Rock State Park

Ottawa: History's Arch
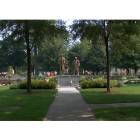
Ottawa: Washington Park - Downtown Ottawa, IL
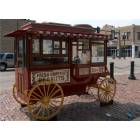
Ottawa: Popcorn Wagon - Ottawa, IL

Ottawa: The bidge on the river near Allen Park
Ottawa: washington park
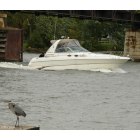
Ottawa: When I'm in Ottawa I love to go to Allen Park and watch all the birds that flock there.
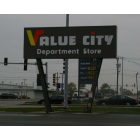
Ottawa: The Old Value City Sign Along With The Old Shell Sign In The Background
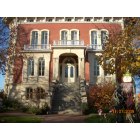
Ottawa: Reddick's Mansion

Ottawa: Down town Ottawa
- see
24
more - add
your
Submit your own pictures of this city and show them to the world
- OSM Map
- General Map
- Google Map
- MSN Map
Population change since 2000: +2.0%
 |
| Males: 8,811 | |
| Females: 9,857 |
| Median resident age: | 40.2 years |
| Illinois median age: | 39.1 years |
Zip codes: 61350.
| Ottawa: | $63,624 |
| IL: | $76,708 |
Estimated per capita income in 2022: $33,126 (it was $19,426 in 2000)
Ottawa city income, earnings, and wages data
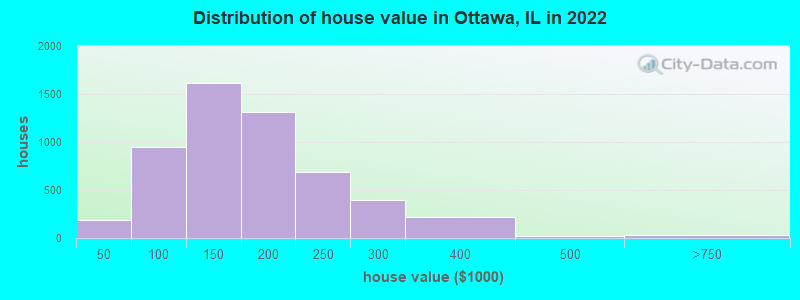
Estimated median house or condo value in 2022: $149,426 (it was $87,800 in 2000)
| Ottawa: | $149,426 |
| IL: | $251,600 |
Mean prices in 2022: all housing units: $191,707; detached houses: $194,136; townhouses or other attached units: $206,119; in 2-unit structures: $150,393; in 3-to-4-unit structures: $228,384; in 5-or-more-unit structures: $154,750; mobile homes: $60,658
Median gross rent in 2022: $896.
(15.8% for White Non-Hispanic residents, 9.5% for Black residents, 33.3% for Hispanic or Latino residents, 37.2% for other race residents, 24.1% for two or more races residents)
Detailed information about poverty and poor residents in Ottawa, IL


- 14,79480.1%White alone
- 2,06511.2%Hispanic
- 8534.6%Two or more races
- 5252.8%Black alone
- 2591.4%Asian alone
- 30.02%American Indian alone
- 30.02%Native Hawaiian and Other
Pacific Islander alone
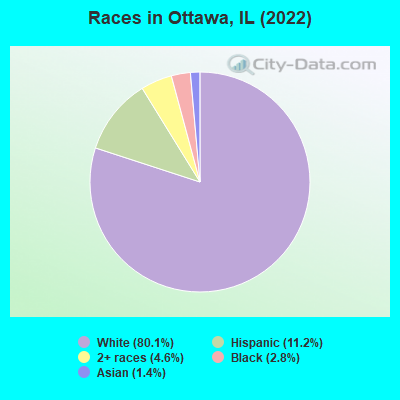
Races in Ottawa detailed stats: ancestries, foreign born residents, place of birth
According to our research of Illinois and other state lists, there were 52 registered sex offenders living in Ottawa, Illinois as of April 26, 2024.
The ratio of all residents to sex offenders in Ottawa is 358 to 1.
Type |
2010 |
2011 |
2012 |
2013 |
2014 |
2015 |
2016 |
2017 |
2018 |
2019 |
2020 |
2021 |
2022 |
|---|---|---|---|---|---|---|---|---|---|---|---|---|---|
| Murders (per 100,000) | 0 (0.0) | 1 (5.3) | 0 (0.0) | 0 (0.0) | 0 (0.0) | 0 (0.0) | 0 (0.0) | 0 (0.0) | 0 (0.0) | 2 (11.1) | 0 (0.0) | 0 (0.0) | 0 (0.0) |
| Rapes (per 100,000) | 0 (0.0) | 0 (0.0) | 0 (0.0) | 0 (0.0) | 1 (5.4) | 2 (10.9) | 1 (5.5) | 1 (5.5) | 1 (5.5) | 0 (0.0) | 2 (11.1) | 3 (16.7) | 11 (58.8) |
| Robberies (per 100,000) | 3 (16.0) | 2 (10.6) | 2 (10.7) | 5 (27.0) | 2 (10.8) | 2 (10.9) | 3 (16.4) | 6 (33.0) | 2 (11.1) | 0 (0.0) | 3 (16.7) | 2 (11.1) | 4 (21.4) |
| Assaults (per 100,000) | 18 (95.9) | 12 (63.7) | 14 (74.8) | 8 (43.2) | 12 (64.8) | 20 (109.0) | 19 (104.0) | 29 (159.3) | 12 (66.3) | 25 (138.5) | 15 (83.4) | 6 (33.3) | 18 (96.3) |
| Burglaries (per 100,000) | 67 (357.0) | 61 (324.1) | 63 (336.8) | 36 (194.5) | 52 (280.8) | 46 (250.7) | 45 (246.4) | 53 (291.1) | 45 (248.7) | 28 (155.2) | 26 (144.6) | 2 (11.1) | 20 (107.0) |
| Thefts (per 100,000) | 390 (2,078) | 338 (1,796) | 363 (1,940) | 350 (1,891) | 427 (2,306) | 399 (2,174) | 333 (1,823) | 292 (1,604) | 259 (1,431) | 240 (1,330) | 245 (1,362) | 31 (172.1) | 104 (556.3) |
| Auto thefts (per 100,000) | 0 (0.0) | 0 (0.0) | 2 (10.7) | 0 (0.0) | 8 (43.2) | 1 (5.4) | 12 (65.7) | 7 (38.4) | 6 (33.2) | 5 (27.7) | 11 (61.2) | 2 (11.1) | 11 (58.8) |
| Arson (per 100,000) | 6 (32.0) | 3 (15.9) | 2 (10.7) | 2 (10.8) | 3 (16.2) | 2 (10.9) | 3 (16.4) | 2 (11.0) | 5 (27.6) | 2 (11.1) | 3 (16.7) | 0 (0.0) | 2 (10.7) |
| City-Data.com crime index | 132.1 | 121.1 | 120.2 | 106.0 | 135.9 | 138.7 | 125.6 | 133.7 | 98.3 | 116.1 | 100.1 | 31.9 | 107.2 |
The City-Data.com crime index weighs serious crimes and violent crimes more heavily. Higher means more crime, U.S. average is 246.1. It adjusts for the number of visitors and daily workers commuting into cities.
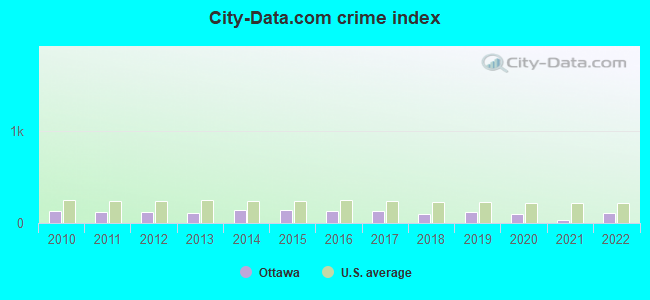
Crime rate in Ottawa detailed stats: murders, rapes, robberies, assaults, burglaries, thefts, arson
Full-time law enforcement employees in 2021, including police officers: 50 (35 officers - 31 male; 4 female).
| Officers per 1,000 residents here: | 1.94 |
| Illinois average: | 2.84 |
 Recent articles from our blog. Our writers, many of them Ph.D. graduates or candidates, create easy-to-read articles on a wide variety of topics.

 | Ottawa Vs. Bloomington: Real Estate Question (8 replies) |
| Why do so many high schools in Illinois have "township" in their name? (11 replies) |
| Ottawa rentals (0 replies) |
| Interesting/quirky/off-the-beaten-path stuff to see in non-Chicagoland IL? (13 replies) |
| H-E-B - Gets top US grocer spot - Can Illinois get them to come? (34 replies) |
| Saint Charles to Rockford? (18 replies) |
Latest news from Ottawa, IL collected exclusively by city-data.com from local newspapers, TV, and radio stations
Ancestries: German (15.1%), Irish (14.0%), American (11.1%), English (7.2%), Italian (4.5%), Norwegian (2.9%).
Current Local Time: CST time zone
Incorporated on 05/13/1882
Elevation: 480 feet
Land area: 7.33 square miles.
Population density: 2,547 people per square mile (average).
626 residents are foreign born (2.0% Latin America, 1.1% Asia).
| This city: | 3.4% |
| Illinois: | 14.1% |
Median real estate property taxes paid for housing units with mortgages in 2022: $3,602 (2.4%)
Median real estate property taxes paid for housing units with no mortgage in 2022: $3,287 (2.3%)
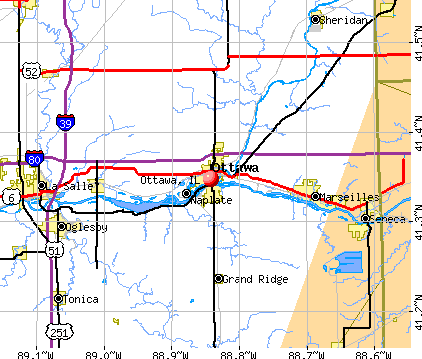
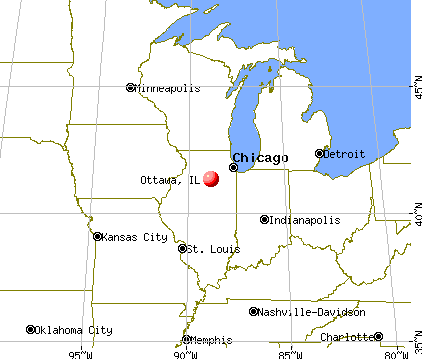
Nearest city with pop. 50,000+: Aurora, IL  (40.1 miles , pop. 142,990).
Nearest city with pop. 200,000+: Chicago, IL (69.2 miles , pop. 2,896,016).
Nearest cities:
), ), ), ), Latitude: 41.35 N, Longitude: 88.84 W
Daytime population change due to commuting: +2,221 (+12.0%)
Workers who live and work in this city: 3,760 (46.6%)
Area code: 815


Ottawa, Illinois accommodation & food services, waste management - Economy and Business Data
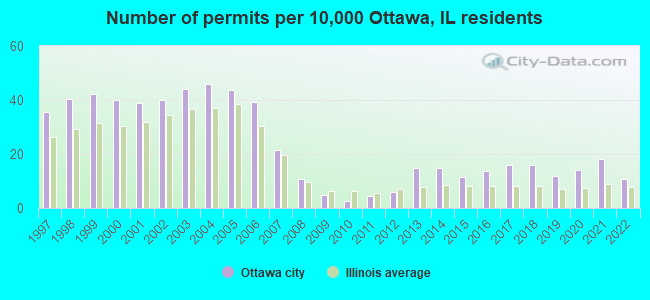
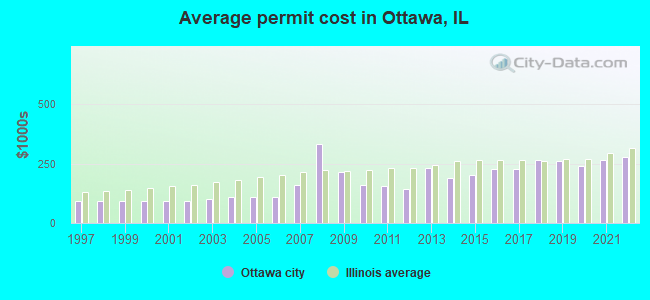
Single-family new house construction building permits:
- 2022: 20 buildings, average cost: $277,300
- 2021: 33 buildings, average cost: $265,400
- 2020: 26 buildings, average cost: $237,500
- 2019: 22 buildings, average cost: $258,500
- 2018: 29 buildings, average cost: $265,200
- 2017: 29 buildings, average cost: $227,100
- 2016: 25 buildings, average cost: $228,100
- 2015: 21 buildings, average cost: $201,100
- 2014: 27 buildings, average cost: $187,600
- 2013: 27 buildings, average cost: $231,900
- 2012: 11 buildings, average cost: $143,200
- 2011: 8 buildings, average cost: $154,000
- 2010: 5 buildings, average cost: $157,800
- 2009: 9 buildings, average cost: $215,900
- 2008: 20 buildings, average cost: $331,400
- 2007: 39 buildings, average cost: $159,100
- 2006: 72 buildings, average cost: $110,700
- 2005: 80 buildings, average cost: $110,700
- 2004: 84 buildings, average cost: $110,700
- 2003: 81 buildings, average cost: $102,600
- 2002: 73 buildings, average cost: $92,100
- 2001: 71 buildings, average cost: $92,100
- 2000: 73 buildings, average cost: $92,100
- 1999: 77 buildings, average cost: $92,100
- 1998: 74 buildings, average cost: $92,100
- 1997: 65 buildings, average cost: $92,100
| Here: | 4.2% |
| Illinois: | 4.2% |
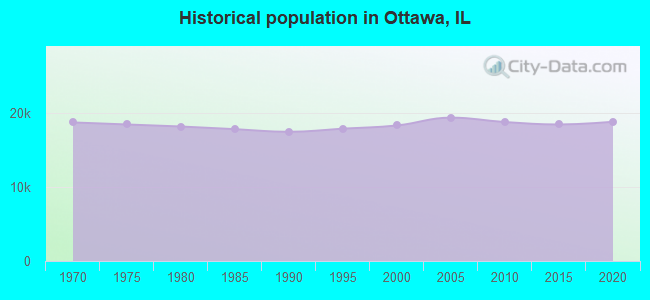
Population change in the 1990s: +507 (+2.8%).
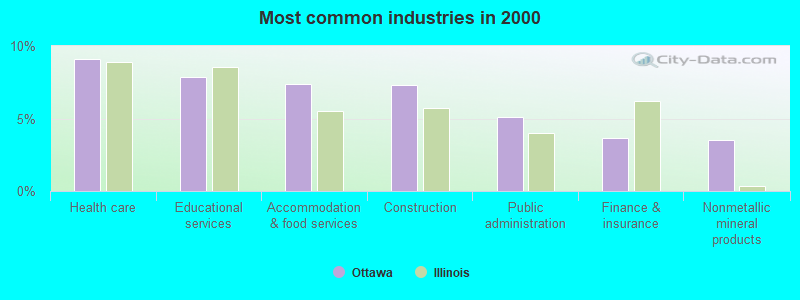
- Health care (9.1%)
- Educational services (7.9%)
- Accommodation & food services (7.4%)
- Construction (7.3%)
- Public administration (5.1%)
- Finance & insurance (3.6%)
- Nonmetallic mineral products (3.5%)

- Construction (12.9%)
- Nonmetallic mineral products (5.8%)
- Public administration (5.6%)
- Utilities (5.1%)
- Plastics & rubber products (4.7%)
- Accommodation & food services (4.3%)
- Machinery (4.2%)
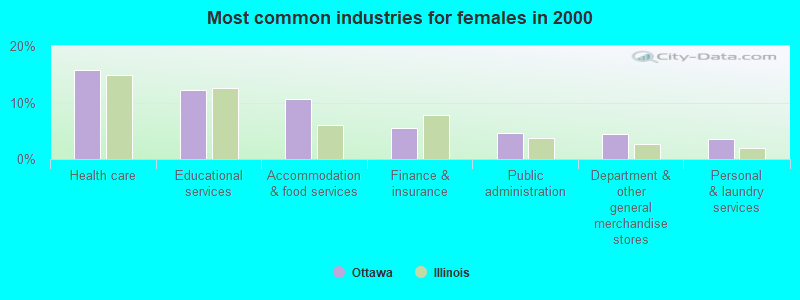
- Health care (15.8%)
- Educational services (12.2%)
- Accommodation & food services (10.6%)
- Finance & insurance (5.5%)
- Public administration (4.5%)
- Department & other general merchandise stores (4.4%)
- Personal & laundry services (3.5%)
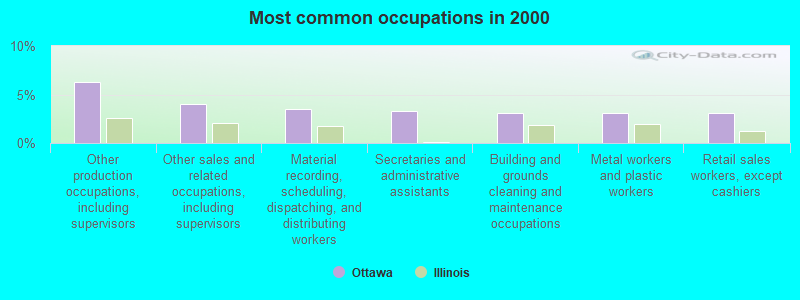
- Other production occupations, including supervisors (6.3%)
- Other sales and related occupations, including supervisors (4.0%)
- Material recording, scheduling, dispatching, and distributing workers (3.5%)
- Secretaries and administrative assistants (3.3%)
- Building and grounds cleaning and maintenance occupations (3.1%)
- Metal workers and plastic workers (3.1%)
- Retail sales workers, except cashiers (3.1%)
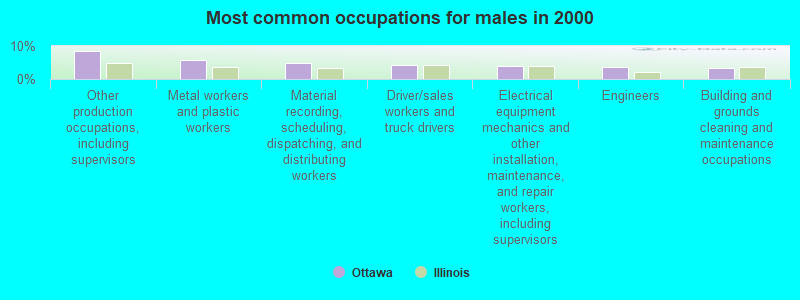
- Other production occupations, including supervisors (8.4%)
- Metal workers and plastic workers (5.9%)
- Material recording, scheduling, dispatching, and distributing workers (4.8%)
- Driver/sales workers and truck drivers (4.1%)
- Electrical equipment mechanics and other installation, maintenance, and repair workers, including supervisors (3.9%)
- Engineers (3.5%)
- Building and grounds cleaning and maintenance occupations (3.4%)
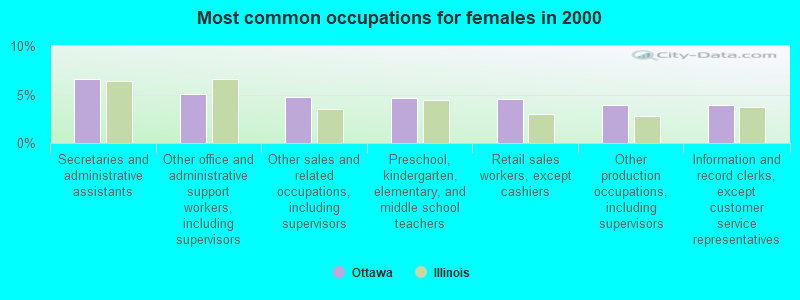
- Secretaries and administrative assistants (6.6%)
- Other office and administrative support workers, including supervisors (5.1%)
- Other sales and related occupations, including supervisors (4.7%)
- Preschool, kindergarten, elementary, and middle school teachers (4.7%)
- Retail sales workers, except cashiers (4.6%)
- Other production occupations, including supervisors (4.0%)
- Information and record clerks, except customer service representatives (3.9%)
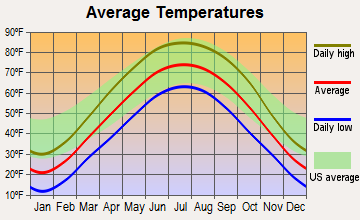
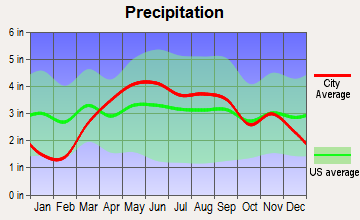
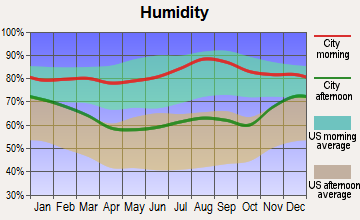
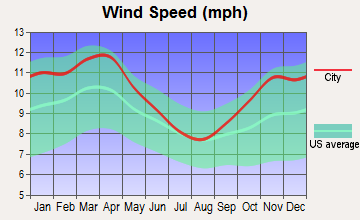
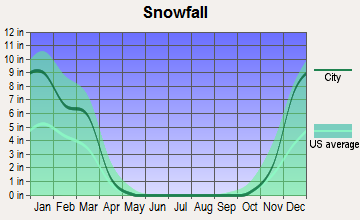
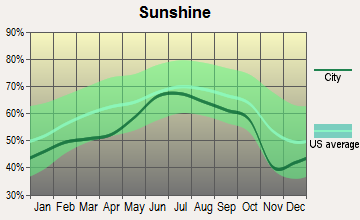
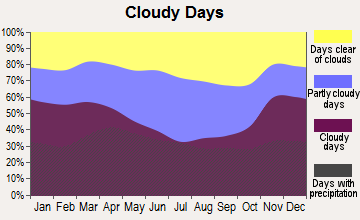
Average climate in Ottawa, Illinois
Based on data reported by over 4,000 weather stations
|
|

(lower is better)
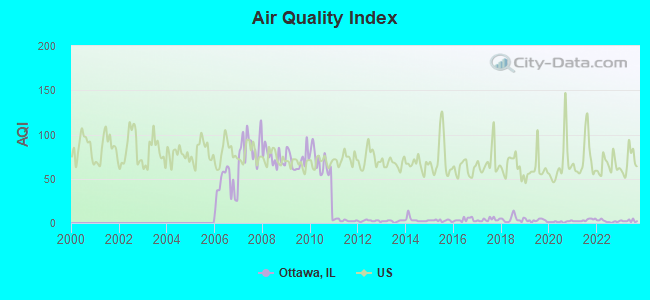
Air Quality Index (AQI) level in 2023 was 2.47. This is significantly better than average.
| City: | 2.47 |
| U.S.: | 72.56 |
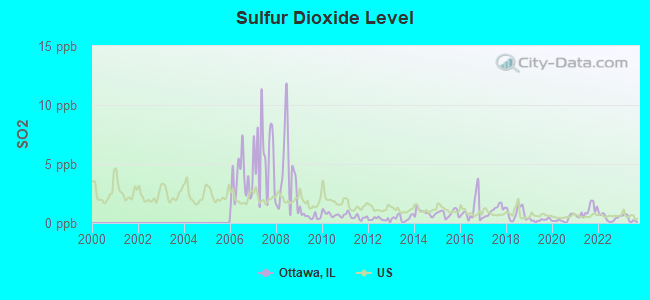
Sulfur Dioxide (SO2) [ppb] level in 2023 was 0.380. This is significantly better than average. Closest monitor was 0.3 miles away from the city center.
| City: | 0.380 |
| U.S.: | 1.515 |
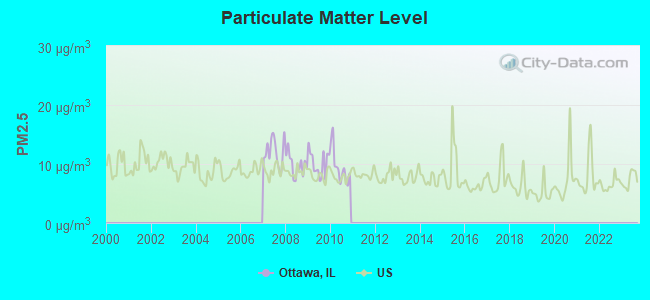
Particulate Matter (PM2.5) [µg/m3] level in 2010 was 9.49. This is about average. Closest monitor was 11.4 miles away from the city center.
| City: | 9.49 |
| U.S.: | 8.11 |
Tornado activity:
Ottawa-area historical tornado activity is near Illinois state average. It is 66% greater than the overall U.S. average.
On 8/28/1990, a category F5 (max. wind speeds 261-318 mph) tornado 34.4 miles away from the Ottawa city center killed 29 people and injured 350 people and caused between $50,000 and $500,000 in damages.
On 4/20/2004, a category F3 (max. wind speeds 158-206 mph) tornado 9.3 miles away from the city center killed 8 people and injured 12 people and caused $8 million in damages.
Earthquake activity:
Ottawa-area historical earthquake activity is significantly above Illinois state average. It is 83% greater than the overall U.S. average.On 4/18/2008 at 09:36:59, a magnitude 5.4 (5.1 MB, 4.8 MS, 5.4 MW, 5.2 MW, Class: Moderate, Intensity: VI - VII) earthquake occurred 206.6 miles away from the city center
On 6/10/1987 at 23:48:54, a magnitude 5.1 (4.9 MB, 4.4 MS, 4.6 MS, 5.1 LG) earthquake occurred 181.9 miles away from Ottawa center
On 4/18/2008 at 09:36:59, a magnitude 5.2 (5.2 MW, Depth: 8.9 mi) earthquake occurred 206.6 miles away from Ottawa center
On 6/28/2004 at 06:10:52, a magnitude 4.2 (4.2 MW, Depth: 6.2 mi, Class: Light, Intensity: IV - V) earthquake occurred 8.4 miles away from the city center
On 6/18/2002 at 17:37:15, a magnitude 5.0 (4.3 MB, 4.6 MW, 5.0 LG) earthquake occurred 239.2 miles away from Ottawa center
On 4/18/2008 at 15:14:16, a magnitude 4.8 (4.5 MB, 4.8 MW, 4.6 MW) earthquake occurred 205.5 miles away from the city center
Magnitude types: regional Lg-wave magnitude (LG), body-wave magnitude (MB), surface-wave magnitude (MS), moment magnitude (MW)
Natural disasters:
The number of natural disasters in La Salle County (19) is greater than the US average (15).Major Disasters (Presidential) Declared: 13
Emergencies Declared: 5
Causes of natural disasters: Storms: 10, Floods: 9, Tornadoes: 3, Snows: 2, Snowstorms: 2, Winds: 2, Winter Storms: 2, Blizzard: 1, Hurricane: 1, Other: 1 (Note: some incidents may be assigned to more than one category).
Main business address for: UNIONBANCORP INC (NATIONAL COMMERCIAL BANKS), FIRST OTTAWA BANCSHARES INC (STATE COMMERCIAL BANKS).
Hospitals and medical centers in Ottawa:
- HOSPICE OF COMMUNITY HOSP OF O (1000 E NORRIS DRIVE)
- KANTHAK HOUSE (724 SECOND AVENUE)
- OTTAWA REGIONAL HOSPITAL & HEALTHCARE CENTER (Voluntary non-profit - Private, provides emergency services, 1100 EAST NORRIS DRIVE)
- SULLIVAN HOUSE (600 EAST GROVER)
- LA SALLE COUNTY NURSING HOME (1380 NORTH 27TH ROAD)
- OTTAWA PAVILION (800 EAST CENTER STREET)
- PLEASANT VIEW LUTHER HOME (505 COLLEGE AVENUE)
- FMC - OTTAWA DIALYSIS (1601 MERCURY CIRCLE, STE 3)
- OTTAWA REGIONAL HOME HEALTH (1601 MERCURY CIRCLE, SUITE #1)
Airports and heliports located in Ottawa:
- Skydive Chicago Airport (8N2) (Runways: 1, Itinerant Ops: 2,000, Local Ops: 8,000)
- Osf St Elizabeth Medical Center Heliport (LL25)
Operable nuclear power plants near Ottawa:
- 13 miles: LaSalle County 1 and 2 in Seneca, IL.
Colleges/universities with over 2000 students nearest to Ottawa:
- Illinois Valley Community College (about 14 miles; Oglesby, IL; Full-time enrollment: 2,747)
- Joliet Junior College (about 36 miles; Joliet, IL; FT enrollment: 11,401)
- Waubonsee Community College (about 37 miles; Sugar Grove, IL; FT enrollment: 7,698)
- Aurora University (about 39 miles; Aurora, IL; FT enrollment: 4,596)
- University of St Francis (about 41 miles; Joliet, IL; FT enrollment: 2,454)
- Northern Illinois University (about 41 miles; Dekalb, IL; FT enrollment: 18,126)
- Kishwaukee College (about 41 miles; Malta, IL; FT enrollment: 3,356)
Public high schools in Ottawa:
- OTTAWA TOWNSHIP HIGH SCHOOL (Students: 1,576, Location: 211 E MAIN ST, Grades: 9-12)
- LASALLE COUNTY DETENTION HOME (Students: 18, Location: 707 E ETNA RD, Grades: 8-11)
- LASALLE ROE TAOEP (Location: 119 W MADISON ST RM 102, Grades: 6-12)
Private high school in Ottawa:
Public elementary/middle schools in Ottawa:
- SHEPHERD MIDDLE SCHOOL (Students: 449, Location: 701 E MCKINLEY RD, Grades: 7-8)
- JEFFERSON ELEM SCHOOL (Students: 346, Location: 1709 COLUMBUS ST, Grades: PK-4)
- WALLACE ELEM SCHOOL (Students: 316, Location: 1463 N 33RD RD, Grades: PK-8)
- RUTLAND ELEM SCHOOL (Students: 85, Location: RR 71 E 3231, Grades: KG-8)
- DEER PARK C C ELEM SCHOOL (Students: 67, Location: 2350 E 1025TH RD, Grades: PK-8)
- CENTRAL INTERMEDIATE SCHOOL (Location: 711 E MCKINLEY RD, Grades: 5-6)
- LINCOLN ELEM SCHOOL (Location: 1110 W MAIN ST, Grades: PK-4)
- MCKINLEY ELEM SCHOOL (Location: 1320 STATE ST, Grades: PK-4)
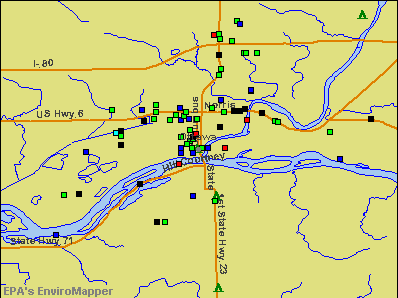
Points of interest:
Notable locations in Ottawa: Ottawa Boat Club (A), Ottawa Fire Department Station 2 (B), Ottawa Fire Department Station 1 (C), Reddick Library (D), La Salle County Jail (E), La Salle County Courthouse (F), Reddick Mansion (G). Display/hide their locations on the map
Shopping Center: South Towne Mall Shopping Center (1). Display/hide its location on the map
Main business address in Ottawa include: UNIONBANCORP INC (A), FIRST OTTAWA BANCSHARES INC (B). Display/hide their locations on the map
Churches in Ottawa include: First Baptist Church (A), First Church of Christ Scientist (B), First Congregational Church (C), First Presbyterian Church (D), First United Methodist Church (E), Grace Baptist Church (F), Pilgrim Holiness Church (G), Pleasant View Lutheran Church (H), Reorganized Church of Jesus Christ of Latter Day Saints (I). Display/hide their locations on the map
Cemeteries: Ottawa Avenue Cemetery (1), Oakwood Memorial Cemetery (2), Summit View Cemetery (3). Display/hide their locations on the map
River: Fox River (A). Display/hide its location on the map
Parks in Ottawa include: Peck Park (1), Rigden Park (2), Walsh Park (3), Lincoln-Douglas Park (4), East Side Park (5), Varland Park (6), Kiwanis Park (7), Allen Park (8), Washington Park Historic District (9). Display/hide their locations on the map
Hotels: Comfort Inn (510 E Etna Rd), Hampton Inn Ottawa- IL (4115 Holiday Lane), Hampton Inn Ottawa-Starved Rock Area (4115 Holiday Ln), Holiday Inn Express Ottawa (120 West Stevenson Road), Fox River Bed and Breakfast (3367 E 2072nd Rd.).
Courts: La Salle County - Courts- Court Services (Courthouse), Illinois State - Appellate Court District No 3- Appellate Research (1007 La Salle Street), Illinois State - Appellate Court District No 3 (1004 Columbus Street).
Birthplace of: Maria Kanellis - Professional wrestler, Terrence Malick - Film director, Jack Clapper - Recipient of the Purple Heart medal, Slip Madigan - Football player and coach of football, Aaron Shea - 2005 NFL player (Cleveland Browns, born: Dec 5, 1976), Bob McGrath - Singer and actor, Emil Lockwood - Politician, George R. Lawrence - Photographer, Harry Kelly (politician) - Judge, Reed G. Landis - World War I flying ace.
Drinking water stations with addresses in Ottawa and their reported violations in the past:
SIP N SNACK (Population served: 400, Groundwater):Past monitoring violations:THE BUSTED PROP (Population served: 150, Groundwater):
- Monitoring, Repeat Major (TCR) - Between JAN-2009 and DEC-2009, Contaminant: Coliform (TCR). Follow-up actions: St Compliance achieved (NOV-18-2009)
Past monitoring violations:MOOSE LODGE 960/DAYTON RIDGE (Population served: 130, Groundwater):
- One regular monitoring violation
Past monitoring violations:DATTIS MHP (Population served: 115, Groundwater):
- One regular monitoring violation
Past health violations:SPRING BROOK MARINA INC (Population served: 100, Groundwater):Past monitoring violations:
- MCL, Monthly (TCR) - In NOV-2008, Contaminant: Coliform. Follow-up actions: St Public Notif requested (DEC-16-2008), St Violation/Reminder Notice (DEC-16-2008), St Public Notif received (JAN-07-2009), St Formal NOV issued (JAN-30-2009), St BCA signed (MAR-26-2009), St Compliance achieved (JUL-01-2009)
- MCL, Acute (TCR) - In NOV-2008, Contaminant: Coliform. Follow-up actions: St Public Notif requested (DEC-01-2008), St Violation/Reminder Notice (DEC-01-2008), St Public Notif received (JAN-07-2009), St Formal NOV issued (JAN-30-2009), St BCA signed (MAR-26-2009), St Compliance achieved (JUL-01-2009)
- Monitoring and Reporting (DBP) - Between APR-2012 and JUN-2012, Contaminant: Chlorine. Follow-up actions: St Public Notif requested (MAY-15-2012), St Violation/Reminder Notice (MAY-15-2012), St Public Notif received (MAY-23-2012), St Compliance achieved (JUN-07-2012)
- 2 minor monitoring violations
Past health violations:THE BOURNE (Population served: 100, Groundwater):
- MCL, Monthly (TCR) - Between JAN-2007 and DEC-2007, Contaminant: Coliform. Follow-up actions: St Public Notif requested (JAN-09-2008), St Formal NOV issued (JAN-09-2008), St Compliance achieved (MAR-24-2008)
Past monitoring violations:NEW CHIAM RESTAURANT (Population served: 100, Groundwater):
- One regular monitoring violation
Past monitoring violations:KNOTTY PINE (Population served: 50, Groundwater):
- One regular monitoring violation
Past monitoring violations:
- One regular monitoring violation
Drinking water stations with addresses in Ottawa that have no violations reported:
- THE GREAT SAUK TRAIL - EAST (Population served: 500, Primary Water Source Type: Groundwater)
- THE GREAT SAUK TRAIL-WEST (Population served: 500, Primary Water Source Type: Groundwater)
- ILLINOIS WATERWAY VISITOR CTR (Population served: 300, Primary Water Source Type: Groundwater)
- GRAND BEAR LODGE LLC # 1 NORTH (Population served: 200, Primary Water Source Type: Groundwater)
- PINE HILLS GOLF COURSE (Population served: 150, Primary Water Source Type: Groundwater)
- GRAND BEAR LODGE LLC # 2 NORTH (Population served: 120, Primary Water Source Type: Groundwater)
- GRAND BEAR LODGE LLC # 3 NORTH (Population served: 120, Primary Water Source Type: Groundwater)
- GRAND BEAR LODGE LLC # 5 NORTH (Population served: 120, Primary Water Source Type: Groundwater)
- GRAND BEAR LODGE LLC # 4 NORTH (Population served: 120, Primary Water Source Type: Groundwater)
- SILVER SLIPPER SALOON (Population served: 100, Primary Water Source Type: Groundwater)
| This city: | 2.4 people |
| Illinois: | 2.6 people |
| This city: | 62.6% |
| Whole state: | 65.8% |
| This city: | 7.2% |
| Whole state: | 6.3% |
Likely homosexual households (counted as self-reported same-sex unmarried-partner households)
- Lesbian couples: 0.3% of all households
- Gay men: 0.1% of all households
People in group quarters in Ottawa in 2010:
- 234 people in nursing facilities/skilled-nursing facilities
- 176 people in local jails and other municipal confinement facilities
- 30 people in group homes intended for adults
- 22 people in emergency and transitional shelters (with sleeping facilities) for people experiencing homelessness
- 10 people in correctional facilities intended for juveniles
- 9 people in other noninstitutional facilities
People in group quarters in Ottawa in 2000:
- 303 people in nursing homes
- 44 people in local jails and other confinement facilities (including police lockups)
- 32 people in homes for the mentally retarded
- 22 people in other noninstitutional group quarters
- 10 people in homes for the mentally ill
- 8 people in other group homes
- 5 people in religious group quarters
Banks with branches in Ottawa (2011 data):
- The First National Bank of Ottawa: Plaza Facility, South Branch, Northfield Branch, The First National Bank Of Ottawa. Info updated 2006/11/03: Bank assets: $270.5 mil, Deposits: $242.3 mil, local headquarters, positive income, 8 total offices, Holding Company: First Ottawa Bancshares, Inc.
- Centrue Bank: Ottawa North Branch, Ottawa Columbus Str Branch, Ottawa Lending Center & Executive Of. Info updated 2007/06/27: Bank assets: $964.9 mil, Deposits: $850.6 mil, headquarters in Streator, IL, negative income in the last year, Commercial Lending Specialization, 28 total offices, Holding Company: Centrue Financial Corporation
- First Federal Savings Bank: at 633 La Salle St, branch established on 1889/01/01; West Main Street Branch at 433 West Main Street, branch established on 1994/07/01. Info updated 2011/07/21: Bank assets: $398.1 mil, Deposits: $355.1 mil, local headquarters, negative income in the last year, Mortgage Lending Specialization, 13 total offices
- First State Bank: Ottawa Branch at 1212 Columbus Avenue, branch established on 2004/11/12. Info updated 2011/02/28: Bank assets: $751.6 mil, Deposits: $619.5 mil, headquarters in Mendota, IL, positive income, 16 total offices, Holding Company: Tri-County Financial Group, Inc.
- Ottawa Savings Bank: at 925 La Salle St, branch established on 1871/01/01. Info updated 2011/07/21: Bank assets: $182.7 mil, Deposits: $160.4 mil, local headquarters, negative income in the last year, Mortgage Lending Specialization, 1 total offices
- Old Second National Bank: Ottawa Branch at 323 East Norris Drive, branch established on 1978/02/01. Info updated 2008/03/03: Bank assets: $1,939.3 mil, Deposits: $1,741.1 mil, headquarters in Aurora, IL, positive income, Commercial Lending Specialization, 27 total offices, Holding Company: Old Second Bancorp, Inc.
For population 15 years and over in Ottawa:
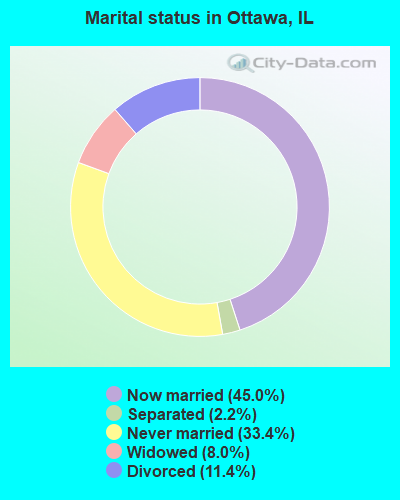
- Never married: 33.4%
- Now married: 45.0%
- Separated: 2.2%
- Widowed: 8.0%
- Divorced: 11.4%
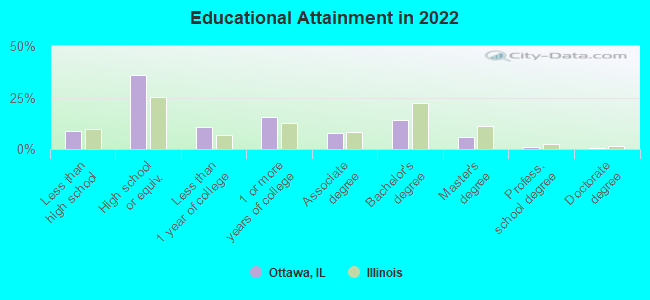
For population 25 years and over in Ottawa:
- High school or higher: 91.5%
- Bachelor's degree or higher: 20.5%
- Graduate or professional degree: 6.9%
- Unemployed: 6.6%
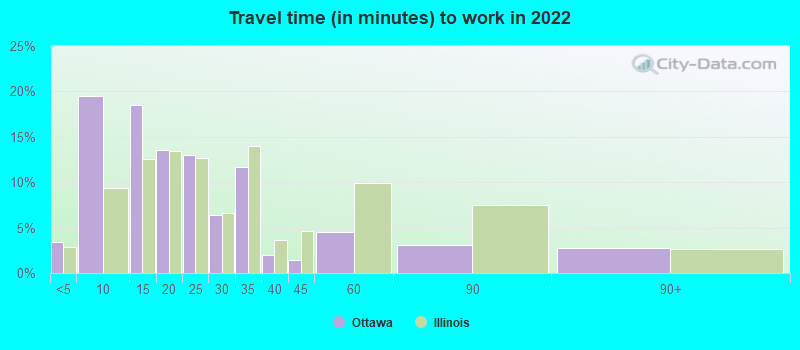
- Mean travel time to work (commute): 20.1 minutes
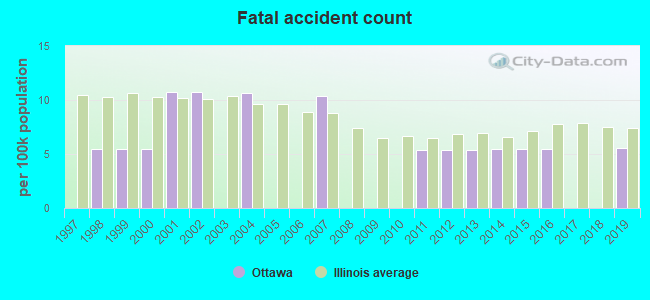
| Here: | 10.0 |
| Illinois average: | 12.5 |
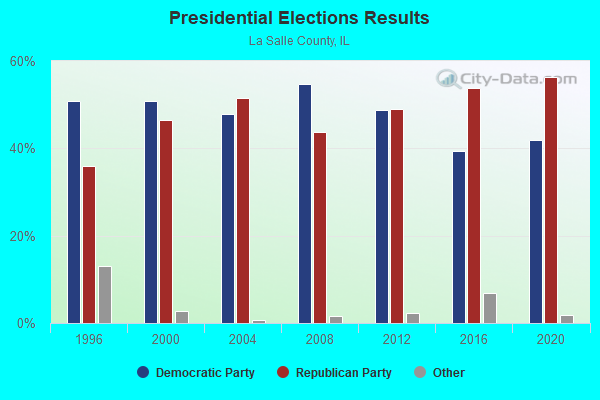
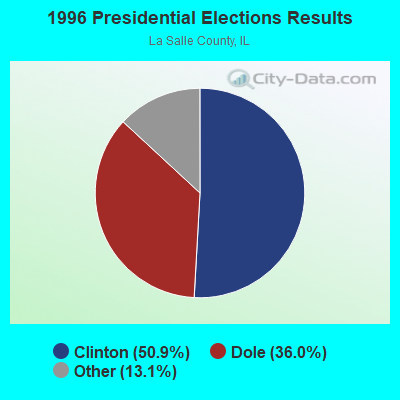
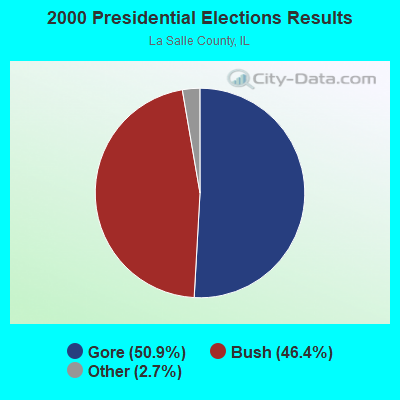
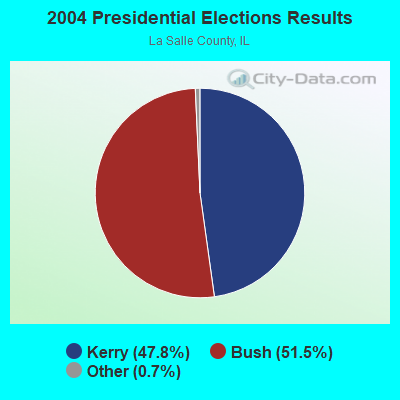
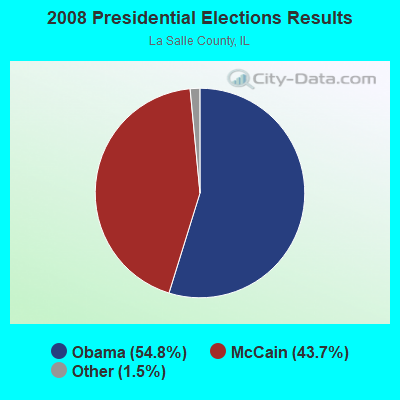
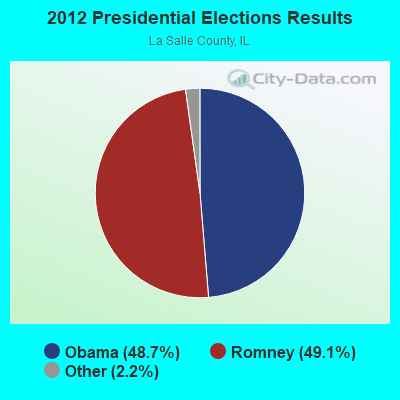
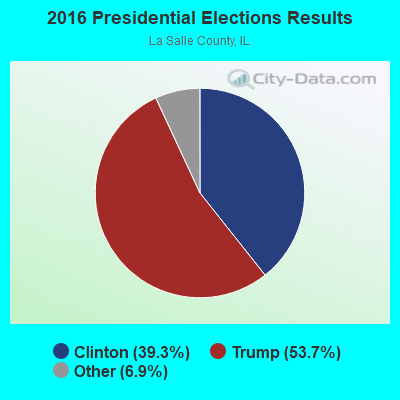
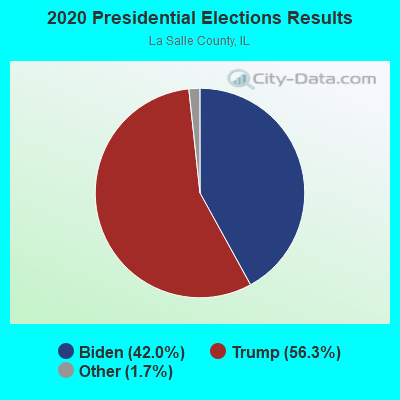
Graphs represent county-level data. Detailed 2008 Election Results
Neighborhoods in Ottawa:
(Ottawa, Illinois Neighborhood Map)Religion statistics for Ottawa, IL (based on La Salle County data)
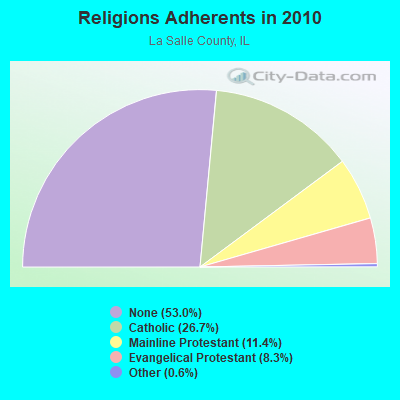
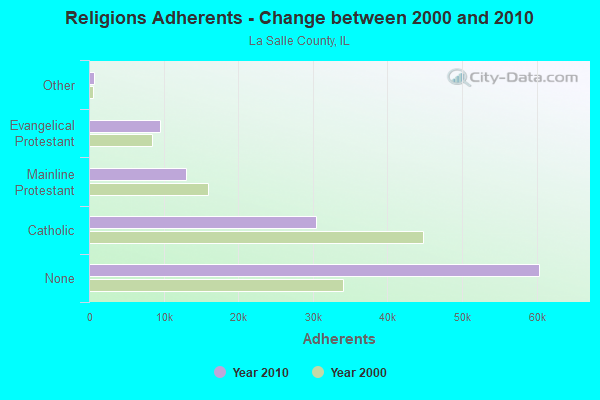
| Religion | Adherents | Congregations |
|---|---|---|
| Catholic | 30,429 | 29 |
| Mainline Protestant | 12,962 | 47 |
| Evangelical Protestant | 9,475 | 69 |
| Other | 689 | 9 |
| None | 60,369 | - |
Food Environment Statistics:
| Here: | 2.23 / 10,000 pop. |
| State: | 2.24 / 10,000 pop. |
| Here: | 0.36 / 10,000 pop. |
| State: | 0.75 / 10,000 pop. |
| This county: | 5.44 / 10,000 pop. |
| Illinois: | 2.61 / 10,000 pop. |
| La Salle County: | 10.35 / 10,000 pop. |
| Illinois: | 6.86 / 10,000 pop. |
| This county: | 8.9% |
| State: | 8.3% |
| This county: | 27.1% |
| Illinois: | 25.2% |
| This county: | 14.3% |
| Illinois: | 14.5% |
Health and Nutrition:
| Ottawa: | 49.4% |
| Illinois: | 49.5% |
| Ottawa: | 45.5% |
| State: | 47.2% |
| Ottawa: | 28.8 |
| State: | 28.6 |
| This city: | 21.9% |
| Illinois: | 20.5% |
| Ottawa: | 11.7% |
| State: | 10.8% |
| This city: | 6.9 |
| Illinois: | 6.8 |
| Here: | 34.0% |
| Illinois: | 33.4% |
| Ottawa: | 55.1% |
| Illinois: | 56.4% |
| Ottawa: | 76.8% |
| Illinois: | 79.9% |
More about Health and Nutrition of Ottawa, IL Residents
| Local government employment and payroll (March 2022) | |||||
| Function | Full-time employees | Monthly full-time payroll | Average yearly full-time wage | Part-time employees | Monthly part-time payroll |
|---|---|---|---|---|---|
| Police Protection - Officers | 34 | $247,489 | $87,349 | 0 | $0 |
| Firefighters | 25 | $201,423 | $96,683 | 0 | $0 |
| Parks and Recreation | 18 | $96,253 | $64,169 | 5 | $1,232 |
| Police - Other | 17 | $105,128 | $74,208 | 1 | $159 |
| Welfare | 15 | $47,678 | $38,142 | 31 | $52,899 |
| Sewerage | 10 | $52,226 | $62,671 | 0 | $0 |
| Water Supply | 9 | $49,751 | $66,335 | 0 | $0 |
| Housing and Community Development (Local) | 7 | $51,343 | $88,017 | 3 | $5,821 |
| Other Government Administration | 5 | $29,091 | $69,818 | 5 | $6,813 |
| Fire - Other | 3 | $25,227 | $100,908 | 0 | $0 |
| Totals for Government | 143 | $905,607 | $75,995 | 45 | $66,925 |
Ottawa government finances - Expenditure in 2018 (per resident):
- Construction - General - Other: $4,248,000 ($227.56)
- Current Operations - General Public Buildings: $4,126,000 ($221.02)
Police Protection: $4,122,000 ($220.81)
General - Other: $4,103,000 ($219.79)
Water Utilities: $3,904,000 ($209.13)
Local Fire Protection: $3,131,000 ($167.72)
Regular Highways: $2,573,000 ($137.83)
Parks and Recreation: $1,230,000 ($65.89)
Sewerage: $272,000 ($14.57)
Financial Administration: $17,000 ($0.91)
- General - Interest on Debt: $475,000 ($25.44)
- Other Capital Outlay - Regular Highways: $1,142,000 ($61.17)
Housing and Community Development: $893,000 ($47.84)
Police Protection: $128,000 ($6.86)
Parks and Recreation: $65,000 ($3.48)
Local Fire Protection: $56,000 ($3.00)
General - Other: $7,000 ($0.37)
Central Staff Services: $7,000 ($0.37)
- Total Salaries and Wages: $10,192,000 ($545.96)
Ottawa government finances - Revenue in 2018 (per resident):
- Charges - Other: $788,000 ($42.21)
Parks and Recreation: $241,000 ($12.91)
- Miscellaneous - General Revenue - Other: $2,642,000 ($141.53)
Fines and Forfeits: $381,000 ($20.41)
Interest Earnings: $76,000 ($4.07)
- Revenue - Water Utilities: $7,001,000 ($375.03)
- State Intergovernmental - General Local Government Support: $8,633,000 ($462.45)
Transit Utilities: $1,105,000 ($59.19)
Highways: $610,000 ($32.68)
Public Welfare: $336,000 ($18.00)
Other: $86,000 ($4.61)
- Tax - Property: $10,022,000 ($536.85)
Public Utilities Sales: $1,232,000 ($66.00)
Other License: $879,000 ($47.09)
Other Selective Sales: $764,000 ($40.93)
General Sales and Gross Receipts: $104,000 ($5.57)
Ottawa government finances - Debt in 2018 (per resident):
- Long Term Debt - Beginning Outstanding - Unspecified Public Purpose: $19,073,000 ($1021.69)
Outstanding Unspecified Public Purpose: $16,708,000 ($895.01)
Retired Unspecified Public Purpose: $2,365,000 ($126.69)
Ottawa government finances - Cash and Securities in 2018 (per resident):
- Other Funds - Cash and Securities: $12,936,000 ($692.95)
| Businesses in Ottawa, IL | ||||
| Name | Count | Name | Count | |
|---|---|---|---|---|
| ALDI | 1 | Lane Furniture | 1 | |
| AT&T | 1 | Long John Silver's | 1 | |
| Advance Auto Parts | 1 | Marriott | 1 | |
| Arby's | 1 | Maurices | 1 | |
| AutoZone | 1 | Mazda | 1 | |
| Burger King | 1 | McDonald's | 2 | |
| Chevrolet | 1 | Papa John's Pizza | 1 | |
| Circle K | 1 | Penske | 1 | |
| Cracker Barrel | 1 | Pizza Hut | 1 | |
| Dunkin Donuts | 1 | RadioShack | 1 | |
| Econo Lodge | 1 | Sears | 1 | |
| Fashion Bug | 1 | Sprint Nextel | 1 | |
| FedEx | 3 | Subway | 2 | |
| Ford | 1 | Super 8 | 1 | |
| GameStop | 1 | T-Mobile | 1 | |
| Goodwill | 2 | Taco Bell | 1 | |
| H&R Block | 1 | Toyota | 1 | |
| Hilton | 1 | U-Haul | 3 | |
| Holiday Inn | 1 | UPS | 4 | |
| Honda | 1 | Volkswagen | 1 | |
| Jimmy John's | 1 | Walgreens | 1 | |
| KFC | 1 | Walmart | 1 | |
| Kroger | 2 | Wendy's | 1 | |
| La-Z-Boy | 1 | YMCA | 1 | |
Strongest AM radio stations in Ottawa:
- WCMY (1430 AM; 0 kW; OTTAWA, IL; Owner: NEWRADIO GROUP, LLC)
- WSCR (670 AM; 50 kW; CHICAGO, IL; Owner: INFINITY BROADCASTING OPERATIONS, INC.)
- WYLL (1160 AM; 50 kW; CHICAGO, IL; Owner: SCA LICENSE CORPORATION)
- WLS (890 AM; 50 kW; CHICAGO, IL; Owner: WLS, INC.)
- WGN (720 AM; 50 kW; CHICAGO, IL; Owner: WGN CONTINENTAL BROADCASTING CO.)
- WBBM (780 AM; 50 kW; CHICAGO, IL; Owner: INFINITY BROADCASTING OPERATIONS, INC.)
- WMVP (1000 AM; 50 kW; CHICAGO, IL; Owner: ABC, INC.)
- WTMJ (620 AM; 50 kW; MILWAUKEE, WI; Owner: JOURNAL BROADCAST CORPORATION)
- WAUR (930 AM; 4 kW; SANDWICH, IL; Owner: CHRISTIAN BROADCASTING SYSTEM, LTD.)
- WLPO (1220 AM; 1 kW; LASALLE, IL; Owner: LASALLE COUNTY BROADCASTING CORP.)
- WISN (1130 AM; 50 kW; MILWAUKEE, WI; Owner: CAPSTAR TX LIMITED PARTNERSHIP)
- WVIV (1200 AM; 20 kW; CHICAGO, IL; Owner: WLXX-AM LICENSE CORP.)
- WSPL (1250 AM; 0 kW; STREATOR, IL; Owner: MENDOTA BROADCASTING, INC.)
Strongest FM radio stations in Ottawa:
- WKOT (96.5 FM; MARSEILLES, IL; Owner: LASALLE COUNTY BROADCASTING CORP.)
- WRKX (95.3 FM; OTTAWA, IL; Owner: NEWRADIO GROUP, LLC)
- WWGN (88.9 FM; OTTAWA, IL; Owner: AMERICAN FAMILY ASSOCIATION, INC.)
- WALS (102.1 FM; OGLESBY, IL; Owner: LACO RADIO, INC.)
- WBZG (100.9 FM; PERU, IL; Owner: MENDOTA BROADCASTING, INC)
- WSTQ (97.7 FM; STREATOR, IL; Owner: MENDOTA BROADCASTING, INC.)
- WYYS (106.1 FM; STREATOR, IL; Owner: MENDOTA BROADCASTING, INC.)
- WCFL (104.7 FM; MORRIS, IL; Owner: ILLINOIS DISTRICT COUNCIL OF ASSEMBL)
- WIVQ (103.3 FM; SPRING VALLEY, IL; Owner: MENDOTA BROADCASTING, INC)
- WAJK (99.3 FM; LA SALLE, IL; Owner: LA SALLE COUNTY BROADCASTING CORP.)
- WSOG (88.1 FM; SPRING VALLEY, IL; Owner: SPIRIT EDUCATION ASSOCIATION, INC.)
- WMKB (102.9 FM; EARLVILLE, IL; Owner: KM RADIO OF EARLVILLE, L.L.C.)
- WJDK-FM (95.7 FM; SENECA, IL; Owner: GRUNDY COUNTY BROADCASTERS, INC)
- WGLC-FM (100.1 FM; MENDOTA, IL; Owner: MENDOTA BROADCASTING, INC.)
- WSPY-FM (107.1 FM; PLANO, IL; Owner: NELSON ENTERPRISES, INC.)
- WJCH (91.9 FM; JOLIET, IL; Owner: FAMILY STATIONS, INC.)
- WRXQ (100.7 FM; COAL CITY, IL; Owner: NM LICENSING, LLC)
- WJEZ (98.9 FM; DWIGHT, IL; Owner: LIVINGSTON COUNTY BROADCASTERS, INC.)
- WNIW (91.3 FM; LA SALLE, IL; Owner: NORTHERN ILLINOIS UNIVERSITY)
TV broadcast stations around Ottawa:
- WWTO-TV (Channel 35; LASALLE, IL; Owner: TRINITY BROADCASTING NETWORK)
- WSPY-LP (Channel 30; PLANO, IL; Owner: WSPY-TV, INC.)
- National Bridge Inventory (NBI) Statistics
- 46Number of bridges
- 554ft / 169mTotal length
- $455,000Total costs
- 267,000Total average daily traffic
- 52,572Total average daily truck traffic
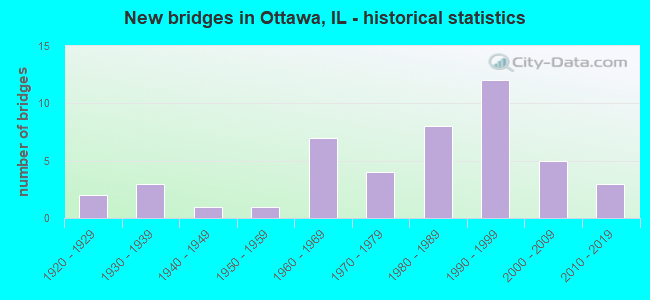
- New bridges - historical statistics
- 21920-1929
- 31930-1939
- 11940-1949
- 11950-1959
- 71960-1969
- 41970-1979
- 81980-1989
- 121990-1999
- 52000-2009
- 32010-2019
FCC Registered Antenna Towers: 157 (See the full list of FCC Registered Antenna Towers)
FCC Registered Commercial Land Mobile Towers: 3 (See the full list of FCC Registered Commercial Land Mobile Towers in Ottawa, IL)
FCC Registered Private Land Mobile Towers: 3 (See the full list of FCC Registered Private Land Mobile Towers)
FCC Registered Broadcast Land Mobile Towers: 35 (See the full list of FCC Registered Broadcast Land Mobile Towers)
FCC Registered Microwave Towers: 82 (See the full list of FCC Registered Microwave Towers in this town)
FCC Registered Paging Towers: 1 (See the full list of FCC Registered Paging Towers)
FCC Registered Maritime Coast & Aviation Ground Towers: 5 (See the full list of FCC Registered Maritime Coast & Aviation Ground Towers)
FCC Registered Amateur Radio Licenses: 126 (See the full list of FCC Registered Amateur Radio Licenses in Ottawa)
FAA Registered Aircraft: 20 (See the full list of FAA Registered Aircraft in Ottawa)
2002 - 2018 National Fire Incident Reporting System (NFIRS) incidents
- Fire incident types reported to NFIRS in Ottawa, IL
- 96644.4%Other
- 54725.1%Outside Fires
- 44720.5%Structure Fires
- 2169.9%Mobile Property/Vehicle Fires
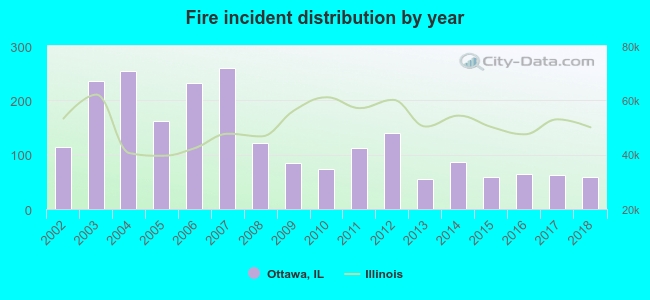 Based on the data from the years 2002 - 2018 the average number of fire incidents per year is 128. The highest number of fires - 260 took place in 2007, and the least - 56 in 2013. The data has a decreasing trend.
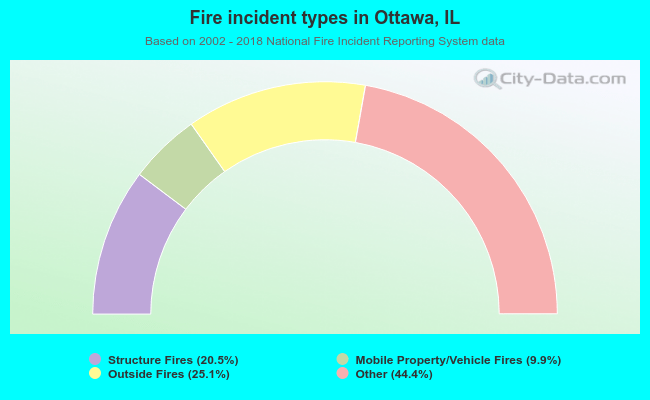 When looking into fire subcategories, the most reports belonged to: Other (44.4%), and Outside Fires (25.1%).
Fire-safe hotels and motels in Ottawa, Illinois:
- Comfort Inn Ottawa, 510 E Etna Rd, Ottawa, Illinois 61350 , Phone: (815) 433-9600, Fax: (815) 433-9696
- Comfort Inn, 120 W Stevenson, Ottawa, Illinois 61350 , Phone: (815) 433-0029, Fax: (815) 433-0382
- Super 8, 500 E Etna Rd, Ottawa, Illinois 61350 , Phone: (815) 434-2888, Fax: (815) 434-2891
- Sands Motel, 1215 Ln Salle St, Ottawa, Illinois 61350 , Phone: (815) 434-6440
- Ottawa Inn Motel, 3000 Columbus St, Ottawa, Illinois 61350 , Phone: (815) 434-3400, Fax: (815) 434-3904
- Hampton Inn Ottawa, 4115 Holiday Ln, Ottawa, Illinois 61350 , Phone: (815) 434-6040, Fax: (815) 434-6045
- Fairfield Inn & Suites, 3000 Fairfield Ln, Ottawa, Illinois 61350 , Phone: (815) 431-8955
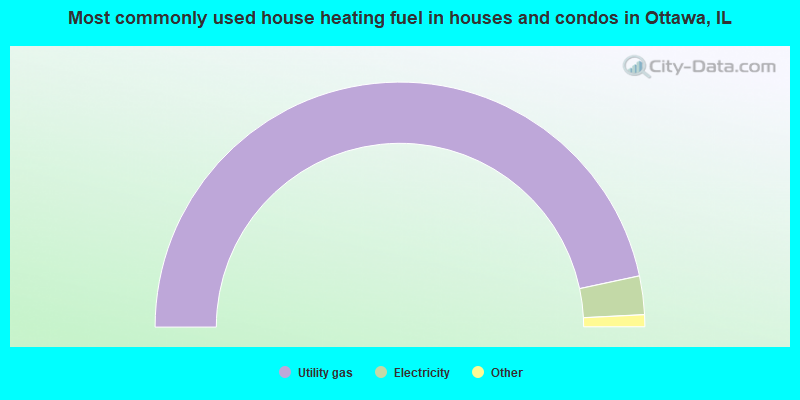
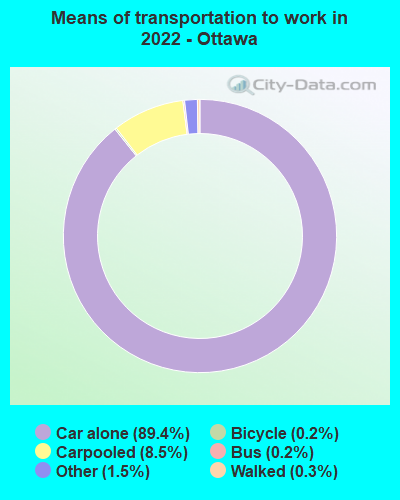
- 93.3%Utility gas
- 5.1%Electricity
- 0.9%Bottled, tank, or LP gas
- 0.5%Wood
- 0.2%No fuel used
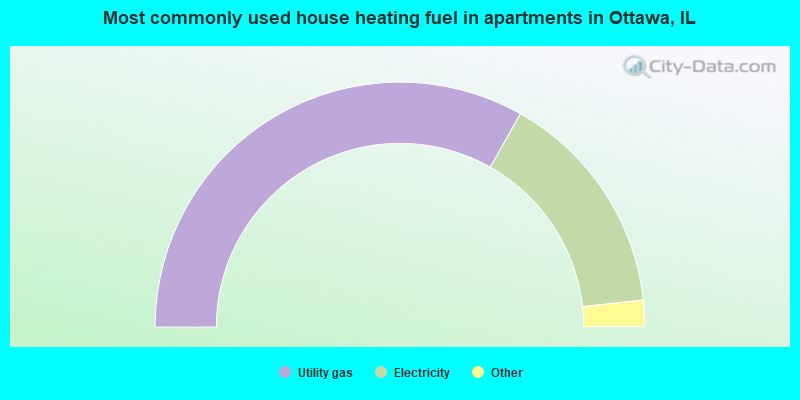
- 66.4%Utility gas
- 30.1%Electricity
- 2.0%Bottled, tank, or LP gas
- 1.4%No fuel used
Ottawa compared to Illinois state average:
- Median house value below state average.
- Unemployed percentage below state average.
- Black race population percentage significantly below state average.
- Foreign-born population percentage significantly below state average.
- Length of stay since moving in significantly above state average.

|
|
Total of 109 patent applications in 2008-2024.