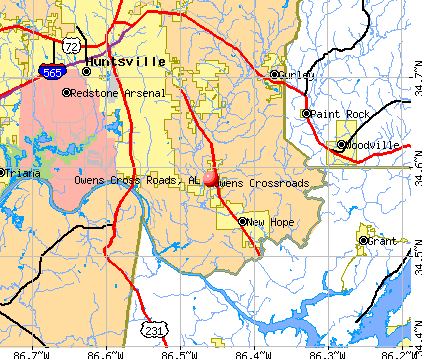
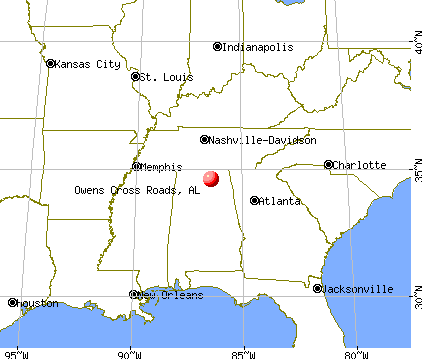
Owens Cross Roads, Alabama
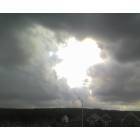
Owens Cross Roads: Right before a big storm.
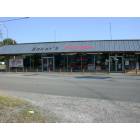
Owens Cross Roads: Bakers Hardware Store

Owens Cross Roads: Beautiful clouds.
- add
your
Submit your own pictures of this town and show them to the world
- OSM Map
- General Map
- Google Map
- MSN Map
Population change since 2000: +135.9%
| Males: 1,262 | |
| Females: 1,390 |
| Median resident age: | 34.1 years |
| Alabama median age: | 39.6 years |
Zip codes: 35763.
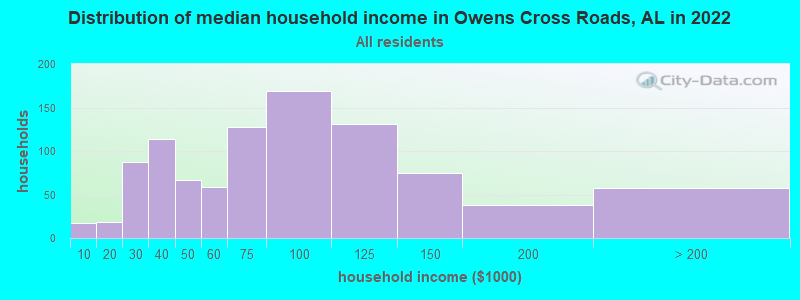
| Owens Cross Roads: | $72,622 |
| AL: | $59,674 |
Estimated per capita income in 2022: $32,628 (it was $17,534 in 2000)
Owens Cross Roads town income, earnings, and wages data
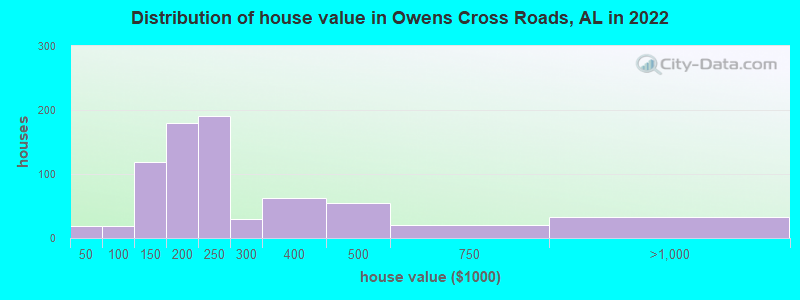
Estimated median house or condo value in 2022: $228,999 (it was $85,900 in 2000)
| Owens Cross Roads: | $228,999 |
| AL: | $200,900 |
Mean prices in 2022: all housing units: $267,888; detached houses: $272,205; mobile homes: $36,150
Median gross rent in 2022: $910.
Owens Cross Roads, AL residents, houses, and apartments details
(11.0% for White Non-Hispanic residents, 10.3% for Black residents, 48.1% for Hispanic or Latino residents, 10.7% for two or more races residents)
Detailed information about poverty and poor residents in Owens Cross Roads, AL


Compare current foreclosures near Owens Cross Roads, AL:
| Photo | Address | Area | Beds / Baths | Price | Details |
|---|---|---|---|---|---|

|
#1
Castle Pines Cir SE
Owens Cross Roads, AL 35763
|
5,211 sq. feet
|
3 baths 4 beds |
$739,900
|
show details |

|
#2
Belle Haven Dr
Owens Cross Roads, AL 35763
|
3,299 sq. feet
|
2 baths 4 beds |
show details | |

|
#3
Jewell Cobb Ct
Owens Cross Roads, AL 35763
|
1,658 sq. feet
|
2 baths - beds |
show details | |

|
#4
Old Highway 431
Owens Cross Roads, AL 35763
|
1,423 sq. feet
|
1 baths - beds |
show details | |

|
#5
Canterwood Dr SE
Owens Cross Roads, AL 35763
|
1,971 sq. feet
|
2 baths - beds |
show details | |

|
#6
Cave Spring Rd
Owens Cross Roads, AL 35763
|
1,088 sq. feet
|
2 baths - beds |
show details | |

|
#7
Cave Spring Rd
Owens Cross Roads, AL 35763
|
1,488 sq. feet
|
2 baths - beds |
show details | |

|
#8
Southcreek Dr SE
Owens Cross Roads, AL 35763
|
3,033 sq. feet
|
3 baths - beds |
show details | |

|
#9
Patriot Park Cir SE
Owens Cross Roads, AL 35763
|
2,051 sq. feet
|
3 baths - beds |
show details | |

|
#10
Creekstone Dr SE
Owens Cross Roads, AL 35763
|
2,598 sq. feet
|
3 baths - beds |
show details |
| Photo | Address | Area | Beds / Baths | Price | Details |
|---|---|---|---|---|---|

|
#11
Rein Dance Ln
Owens Cross Roads, AL 35763
|
930 sq. feet
|
- baths - beds |
show details | |

|
#12
Sedgewick Dr
Owens Cross Roads, AL 35763
|
- sq. feet
|
- baths - beds |
show details | |

|
#13
Woodside Dr SE # 112
Owens Cross Roads, AL 35763
|
- sq. feet
|
- baths - beds |
show details | |

|
#14
Rein Dance Ln
Owens Cross Roads, AL 35763
|
- sq. feet
|
- baths - beds |
show details | |

|
#15
Meeks Dr
Owens Cross Roads, AL 35763
|
1,280 sq. feet
|
- baths - beds |
show details | |

|
#16
Darrow Creek Dr
Owens Cross Roads, AL 35763
|
- sq. feet
|
- baths - beds |
show details | |

|
#17
Winstead Cir
Owens Cross Roads, AL 35763
|
- sq. feet
|
- baths - beds |
show details | |

|
#18
Ed Spears Rd
Owens Cross Roads, AL 35763
|
- sq. feet
|
- baths - beds |
show details | |

|
#19
Blossom Park Dr
Owens Cross Roads, AL 35763
|
- sq. feet
|
- baths - beds |
show details | |

|
#20
Sedgewick Dr
Owens Cross Roads, AL 35763
|
- sq. feet
|
- baths - beds |
show details |
| Photo | Address | Area | Beds / Baths | Price | Details |
|---|---|---|---|---|---|

|
#21
Meeks Dr
Owens Cross Roads, AL 35763
|
- sq. feet
|
- baths - beds |
show details | |

|
#22
Kenwood Dr NW
Huntsville, AL 35810
|
1,089 sq. feet
|
1 baths 3 beds |
show details | |

|
#23
Aztec Trl
Gurley, AL 35748
|
1,604 sq. feet
|
2 baths 3 beds |
show details | |

|
#24
Winged Ct SW
Huntsville, AL 35824
|
5,095 sq. feet
|
4 baths 4 beds |
show details | |

|
#25
Lady Hawk Ln SW
Huntsville, AL 35824
|
- sq. feet
|
2 baths 3 beds |
show details | |

|
#26
Box Canyon Rd SE
Huntsville, AL 35803
|
2,400 sq. feet
|
3 baths 4 beds |
show details | |

|
#27
Greenacres Dr NW
Huntsville, AL 35805
|
955 sq. feet
|
1 baths 3 beds |
show details | |

|
#28
Beirne Ave NE
Huntsville, AL 35801
|
2,166 sq. feet
|
3 baths 4 beds |
show details | |

|
#29
Sam Maples Rd
New Hope, AL 35760
|
1,821 sq. feet
|
2 baths 3 beds |
show details | |

|
#30
Saylor Cir
Arab, AL 35016
|
1,785 sq. feet
|
2 baths - beds |
show details |
| Photo | Address | Area | Beds / Baths | Price | Details |
|---|---|---|---|---|---|

|
#31
Rickwood Dr NW
Huntsville, AL 35810
|
2,043 sq. feet
|
1 baths - beds |
show details | |

|
#32
Cotaco Florette Rd
Somerville, AL 35670
|
3,568 sq. feet
|
1 baths - beds |
show details | |

|
#33
Beirne Ave NE
Huntsville, AL 35801
|
1,260 sq. feet
|
2 baths - beds |
show details | |

|
#34
Sparkman Dr NW
Huntsville, AL 35810
|
1,703 sq. feet
|
2 baths - beds |
show details | |

|
#35
Punkin Dr
Huntsville, AL 35811
|
1,598 sq. feet
|
2 baths - beds |
show details | |

|
#36
Darlene Cir NW
Huntsville, AL 35810
|
1,793 sq. feet
|
2 baths - beds |
show details | |

|
#37
Sparkman Dr NW
Huntsville, AL 35810
|
1,612 sq. feet
|
2 baths - beds |
show details | |

|
#38
Shorewood Ln
Huntsville, AL 35811
|
1,488 sq. feet
|
2 baths - beds |
show details | |

|
#39
Yale Cir NW
Huntsville, AL 35810
|
925 sq. feet
|
1 baths - beds |
show details | |

|
#40
Darlene Cir NW
Huntsville, AL 35810
|
1,887 sq. feet
|
2 baths - beds |
show details |
| Photo | Address | Area | Beds / Baths | Price | Details |
|---|---|---|---|---|---|

|
#41
Willow Ridge Rd NW
Huntsville, AL 35806
|
1,910 sq. feet
|
2 baths - beds |
show details | |

|
#42
Rosewood Dr NW
Huntsville, AL 35810
|
1,360 sq. feet
|
2 baths - beds |
show details | |

|
#43
Carlsbad Dr NW
Huntsville, AL 35810
|
1,646 sq. feet
|
2 baths - beds |
show details | |

|
#44
Sebring St NW
Huntsville, AL 35816
|
1,592 sq. feet
|
2 baths - beds |
show details | |

|
#45
Peterson Pl
Huntsville, AL 35811
|
3,157 sq. feet
|
3 baths - beds |
show details | |

|
#46
Gus Grissom Dr NW
Huntsville, AL 35810
|
2,106 sq. feet
|
1 baths - beds |
show details | |

|
#47
La Salle Rd NW
Huntsville, AL 35810
|
1,774 sq. feet
|
1 baths - beds |
show details | |

|
#48
Club View Dr NW
Huntsville, AL 35816
|
1,464 sq. feet
|
2 baths - beds |
show details | |

|
#49
Viscount Dr NW
Huntsville, AL 35810
|
1,839 sq. feet
|
2 baths - beds |
show details | |

|
Check over 1 million property listings on Foreclosure.com!
|
browse all offers | |||


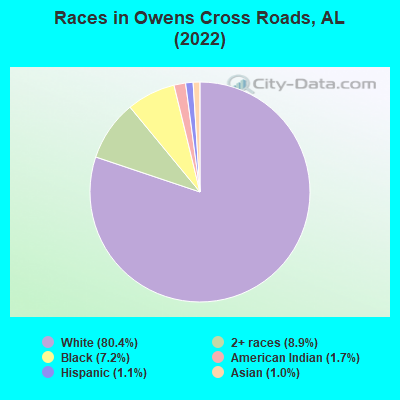
- 2,13680.4%White alone
- 2368.9%Two or more races
- 1917.2%Black alone
- 441.7%American Indian alone
- 291.1%Hispanic
- 271.0%Asian alone
According to our research of Alabama and other state lists, there were 6 registered sex offenders living in Owens Cross Roads, Alabama as of April 28, 2024.
The ratio of all residents to sex offenders in Owens Cross Roads is 306 to 1.
Type |
2009 |
2010 |
2011 |
2012 |
2013 |
2014 |
2015 |
2016 |
2017 |
2018 |
2019 |
2020 |
2021 |
2022 |
|---|---|---|---|---|---|---|---|---|---|---|---|---|---|---|
| Murders (per 100,000) | 0 (0.0) | 0 (0.0) | 0 (0.0) | 0 (0.0) | 0 (0.0) | 0 (0.0) | 0 (0.0) | 0 (0.0) | 0 (0.0) | 0 (0.0) | 0 (0.0) | 1 (45.3) | 0 (0.0) | 0 (0.0) |
| Rapes (per 100,000) | 0 (0.0) | 0 (0.0) | 0 (0.0) | 0 (0.0) | 0 (0.0) | 0 (0.0) | 0 (0.0) | 0 (0.0) | 0 (0.0) | 0 (0.0) | 0 (0.0) | 0 (0.0) | 0 (0.0) | 0 (0.0) |
| Robberies (per 100,000) | 0 (0.0) | 0 (0.0) | 0 (0.0) | 0 (0.0) | 0 (0.0) | 0 (0.0) | 0 (0.0) | 1 (54.5) | 0 (0.0) | 1 (50.0) | 0 (0.0) | 0 (0.0) | 1 (43.2) | 0 (0.0) |
| Assaults (per 100,000) | 0 (0.0) | 1 (65.7) | 0 (0.0) | 3 (193.4) | 1 (56.6) | 1 (56.3) | 2 (109.5) | 1 (54.5) | 5 (262.1) | 5 (249.8) | 4 (192.1) | 2 (90.7) | 5 (215.9) | 4 (151.1) |
| Burglaries (per 100,000) | 0 (0.0) | 1 (65.7) | 3 (196.3) | 5 (322.4) | 3 (169.9) | 3 (168.8) | 5 (273.8) | 7 (381.3) | 8 (419.3) | 5 (249.8) | 6 (288.2) | 0 (0.0) | 1 (43.2) | 1 (37.8) |
| Thefts (per 100,000) | 1 (65.3) | 21 (1,381) | 8 (523.6) | 15 (967.1) | 16 (906.0) | 21 (1,182) | 15 (821.5) | 23 (1,253) | 41 (2,149) | 12 (599.4) | 15 (720.5) | 7 (317.3) | 22 (949.9) | 25 (944.1) |
| Auto thefts (per 100,000) | 0 (0.0) | 4 (263.0) | 0 (0.0) | 0 (0.0) | 2 (113.3) | 2 (112.5) | 1 (54.8) | 3 (163.4) | 4 (209.6) | 3 (149.9) | 4 (192.1) | 3 (136.0) | 3 (129.5) | 6 (226.6) |
| Arson (per 100,000) | 0 (0.0) | 0 (0.0) | 0 (0.0) | 1 (64.5) | 1 (56.6) | 1 (56.3) | 0 (0.0) | 0 (0.0) | 0 (0.0) | 0 (0.0) | 0 (0.0) | 0 (0.0) | 0 (0.0) | 0 (0.0) |
| City-Data.com crime index | 2.6 | 94.0 | 34.7 | 99.9 | 68.5 | 79.3 | 78.3 | 117.1 | 184.5 | 118.4 | 102.8 | 132.4 | 107.5 | 88.7 |
The City-Data.com crime index weighs serious crimes and violent crimes more heavily. Higher means more crime, U.S. average is 246.1. It adjusts for the number of visitors and daily workers commuting into cities.
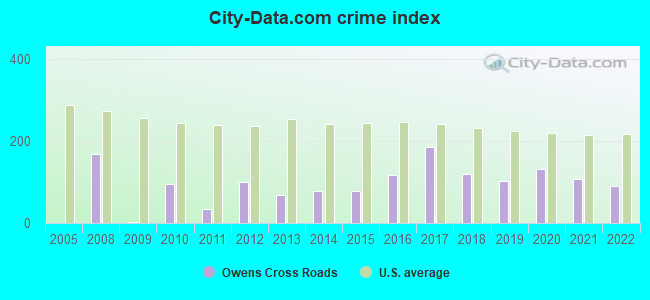
Crime rate in Owens Cross Roads detailed stats: murders, rapes, robberies, assaults, burglaries, thefts, arson
Full-time law enforcement employees in 2021, including police officers: 4 (4 officers - 4 male; 0 female).
| Officers per 1,000 residents here: | 1.73 |
| Alabama average: | 2.40 |
 Recent articles from our blog. Our writers, many of them Ph.D. graduates or candidates, create easy-to-read articles on a wide variety of topics.

 | What are we missing about the Huntsville area? (43 replies) |
| Williams/Columbia School Zone in Madison (31 replies) |
| What should we see? (5 replies) |
| California to Huntsville or (58 replies) |
| Home price question (36 replies) |
| 1960s to 1970s Huntsville (36 replies) |
Latest news from Owens Cross Roads, AL collected exclusively by city-data.com from local newspapers, TV, and radio stations
Ancestries: American (43.2%), English (7.9%), Irish (4.0%), German (2.8%), European (2.7%), Italian (2.3%).
Current Local Time: CST time zone
Elevation: 581 feet
Land area: 7.71 square miles.
Population density: 344 people per square mile (very low).
54 residents are foreign born (1.1% Asia, 0.5% North America, 0.3% Europe).
| This town: | 2.0% |
| Alabama: | 3.5% |
Median real estate property taxes paid for housing units with mortgages in 2022: $786 (0.3%)
Median real estate property taxes paid for housing units with no mortgage in 2022: $544 (0.3%)
Nearest city with pop. 50,000+: Huntsville, AL  (11.7 miles , pop. 158,216).
Nearest city with pop. 200,000+: Birmingham, AL (76.2 miles , pop. 242,820).
Nearest city with pop. 1,000,000+: Chicago, IL (506.1 miles , pop. 2,896,016).
Nearest cities:
), ), ), Latitude: 34.59 N, Longitude: 86.46 W
Area code: 256
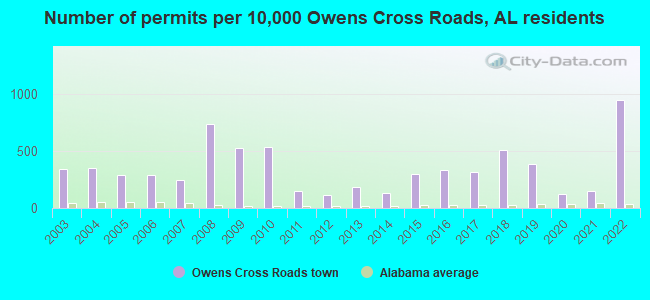
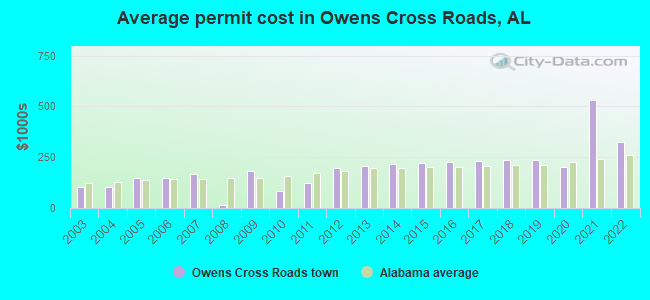
Single-family new house construction building permits:
- 2022: 107 buildings, average cost: $324,500
- 2021: 17 buildings, average cost: $532,400
- 2020: 14 buildings, average cost: $202,800
- 2019: 44 buildings, average cost: $237,000
- 2018: 57 buildings, average cost: $235,000
- 2017: 36 buildings, average cost: $229,900
- 2016: 38 buildings, average cost: $227,500
- 2015: 34 buildings, average cost: $223,900
- 2014: 15 buildings, average cost: $215,600
- 2013: 21 buildings, average cost: $205,200
- 2012: 13 buildings, average cost: $197,800
- 2011: 17 buildings, average cost: $125,000
- 2010: 60 buildings, average cost: $83,300
- 2009: 59 buildings, average cost: $180,100
- 2008: 83 buildings, average cost: $15,000
- 2007: 28 buildings, average cost: $167,600
- 2006: 33 buildings, average cost: $146,200
- 2005: 33 buildings, average cost: $146,200
- 2004: 40 buildings, average cost: $105,000
- 2003: 39 buildings, average cost: $105,000
| Here: | 2.2% |
| Alabama: | 2.6% |
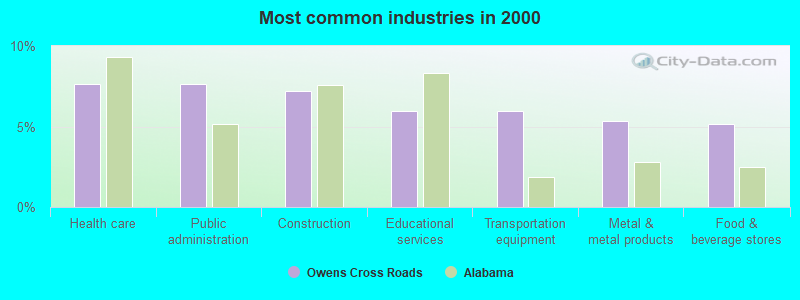
- Health care (7.6%)
- Public administration (7.6%)
- Construction (7.2%)
- Educational services (6.0%)
- Transportation equipment (6.0%)
- Metal & metal products (5.4%)
- Food & beverage stores (5.2%)
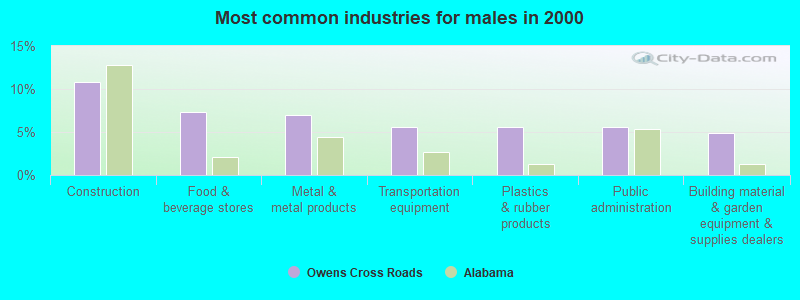
- Construction (10.8%)
- Food & beverage stores (7.3%)
- Metal & metal products (6.9%)
- Transportation equipment (5.6%)
- Plastics & rubber products (5.6%)
- Public administration (5.6%)
- Building material & garden equipment & supplies dealers (4.9%)
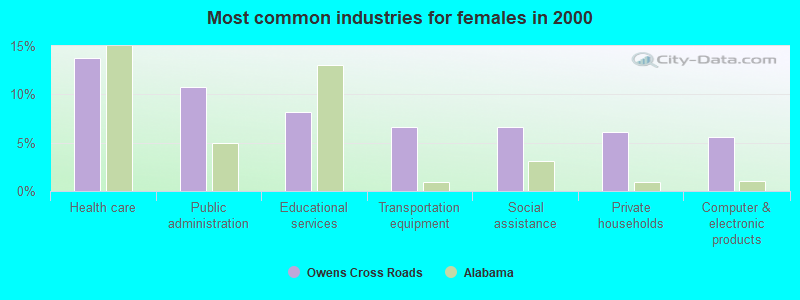
- Health care (13.8%)
- Public administration (10.7%)
- Educational services (8.2%)
- Transportation equipment (6.6%)
- Social assistance (6.6%)
- Private households (6.1%)
- Computer & electronic products (5.6%)
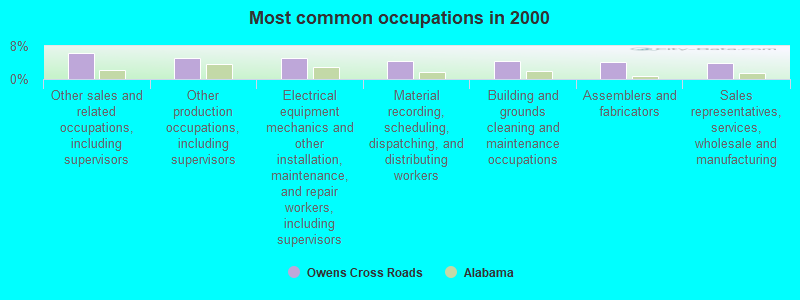
- Other sales and related occupations, including supervisors (6.2%)
- Other production occupations, including supervisors (5.2%)
- Electrical equipment mechanics and other installation, maintenance, and repair workers, including supervisors (5.2%)
- Material recording, scheduling, dispatching, and distributing workers (4.3%)
- Building and grounds cleaning and maintenance occupations (4.3%)
- Assemblers and fabricators (4.1%)
- Sales representatives, services, wholesale and manufacturing (3.9%)
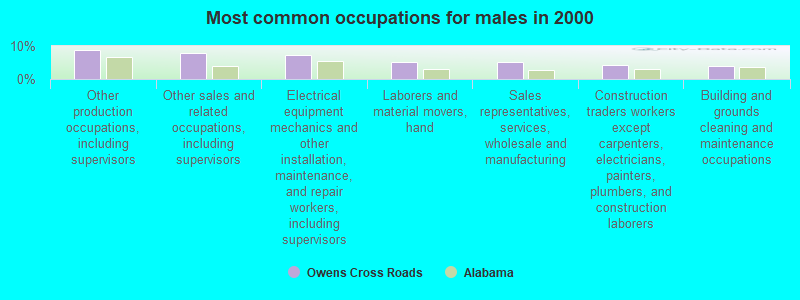
- Other production occupations, including supervisors (8.7%)
- Other sales and related occupations, including supervisors (8.0%)
- Electrical equipment mechanics and other installation, maintenance, and repair workers, including supervisors (7.3%)
- Laborers and material movers, hand (5.2%)
- Sales representatives, services, wholesale and manufacturing (5.2%)
- Construction traders workers except carpenters, electricians, painters, plumbers, and construction laborers (4.2%)
- Building and grounds cleaning and maintenance occupations (3.8%)
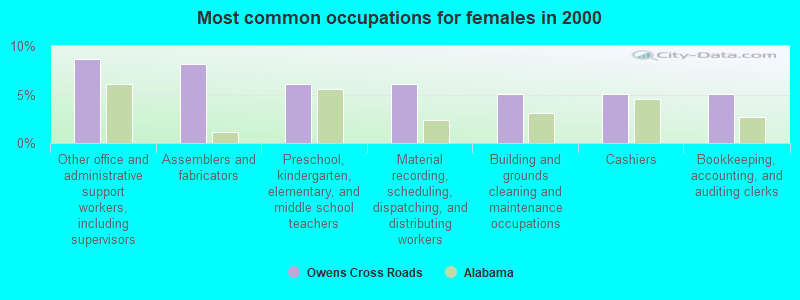
- Other office and administrative support workers, including supervisors (8.7%)
- Assemblers and fabricators (8.2%)
- Preschool, kindergarten, elementary, and middle school teachers (6.1%)
- Material recording, scheduling, dispatching, and distributing workers (6.1%)
- Building and grounds cleaning and maintenance occupations (5.1%)
- Cashiers (5.1%)
- Bookkeeping, accounting, and auditing clerks (5.1%)
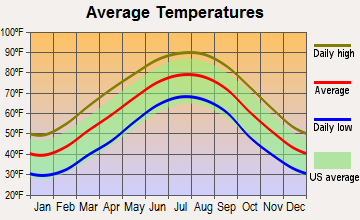
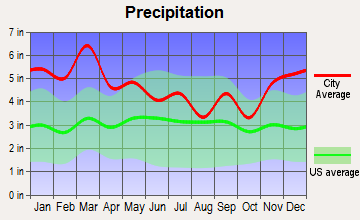
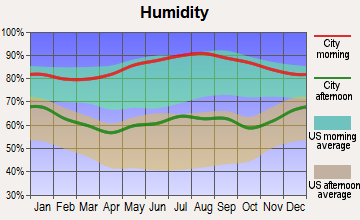
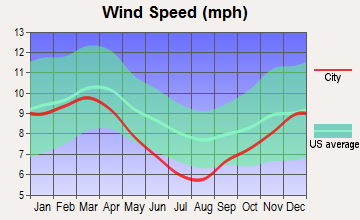
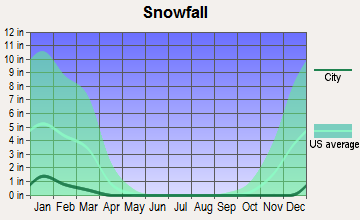
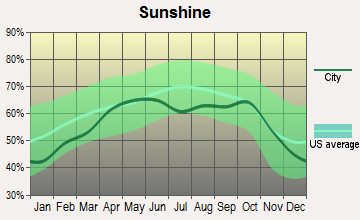
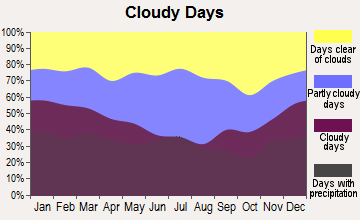
Average climate in Owens Cross Roads, Alabama
Based on data reported by over 4,000 weather stations
(lower is better)
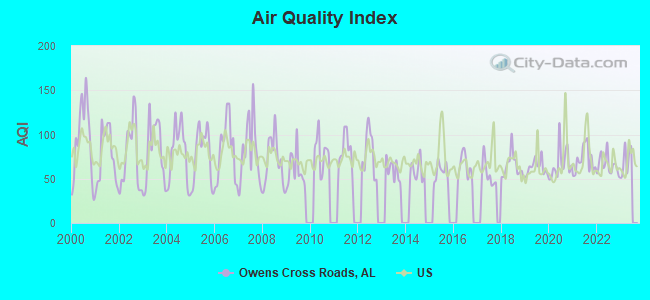
Air Quality Index (AQI) level in 2022 was 65.5. This is about average.
| City: | 65.5 |
| U.S.: | 72.6 |
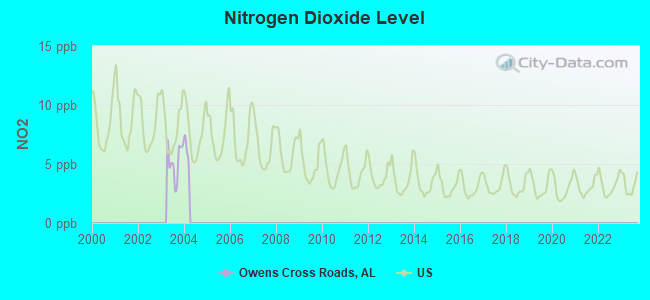
Nitrogen Dioxide (NO2) [ppb] level in 2003 was 5.26. This is about average. Closest monitor was 10.1 miles away from the city center.
| City: | 5.26 |
| U.S.: | 5.11 |
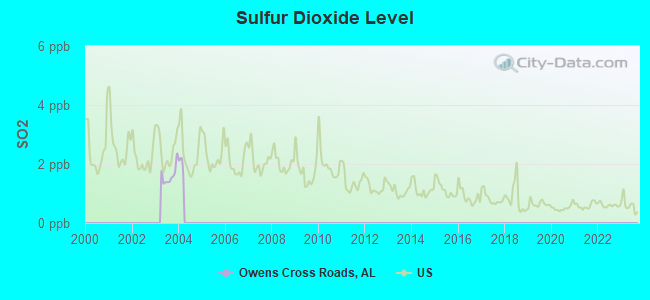
Sulfur Dioxide (SO2) [ppb] level in 2003 was 1.61. This is about average. Closest monitor was 10.1 miles away from the city center.
| City: | 1.61 |
| U.S.: | 1.51 |
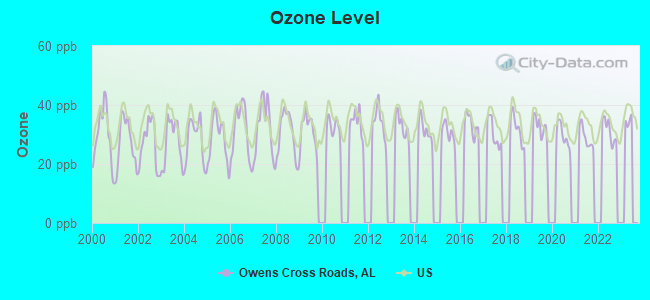
Ozone [ppb] level in 2022 was 31.3. This is about average. Closest monitor was 10.1 miles away from the city center.
| City: | 31.3 |
| U.S.: | 33.3 |
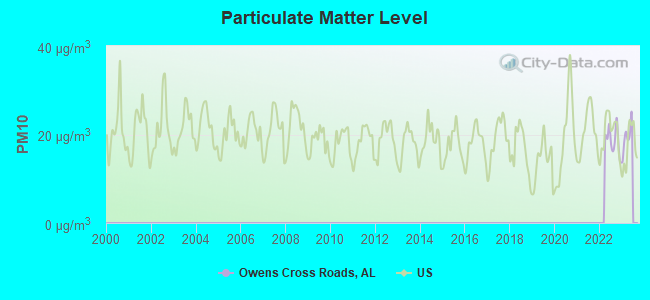
Particulate Matter (PM10) [µg/m3] level in 2022 was 18.7. This is about average. Closest monitor was 10.1 miles away from the city center.
| City: | 18.7 |
| U.S.: | 19.2 |
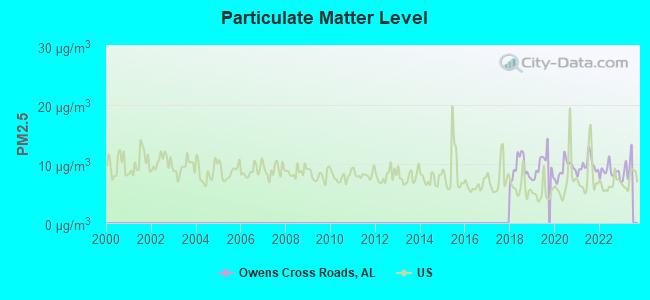
Particulate Matter (PM2.5) [µg/m3] level in 2022 was 8.68. This is about average. Closest monitor was 10.1 miles away from the city center.
| City: | 8.68 |
| U.S.: | 8.11 |
Tornado activity:
Owens Cross Roads-area historical tornado activity is slightly above Alabama state average. It is 153% greater than the overall U.S. average.
On 4/3/1974, a category F5 (max. wind speeds 261-318 mph) tornado 21.8 miles away from the Owens Cross Roads town center killed 28 people and injured 267 people.
On 3/22/1952, a category F4 (max. wind speeds 207-260 mph) tornado 11.7 miles away from the town center killed 4 people and injured 50 people and caused between $5000 and $50,000 in damages.
Earthquake activity:
Owens Cross Roads-area historical earthquake activity is significantly above Alabama state average. It is 152% greater than the overall U.S. average.On 4/29/2003 at 08:59:39, a magnitude 4.9 (4.4 MB, 4.6 MW, 4.9 LG, Class: Light, Intensity: IV - V) earthquake occurred 47.7 miles away from Owens Cross Roads center
On 4/29/2003 at 08:59:39, a magnitude 4.6 (4.6 MW, Depth: 12.3 mi) earthquake occurred 47.6 miles away from Owens Cross Roads center
On 1/18/1999 at 07:00:53, a magnitude 4.8 (4.8 MB, 4.0 LG, Depth: 0.6 mi) earthquake occurred 93.6 miles away from the city center
On 6/24/1975 at 11:11:36, a magnitude 4.5 (4.5 MB) earthquake occurred 99.2 miles away from Owens Cross Roads center
On 4/18/2008 at 09:36:59, a magnitude 5.4 (5.1 MB, 4.8 MS, 5.4 MW, 5.2 MW, Class: Moderate, Intensity: VI - VII) earthquake occurred 278.9 miles away from Owens Cross Roads center
On 11/30/1973 at 07:48:41, a magnitude 4.7 (4.7 MB, 4.6 ML) earthquake occurred 164.2 miles away from Owens Cross Roads center
Magnitude types: regional Lg-wave magnitude (LG), body-wave magnitude (MB), local magnitude (ML), surface-wave magnitude (MS), moment magnitude (MW)
Natural disasters:
The number of natural disasters in Madison County (17) is near the US average (15).Major Disasters (Presidential) Declared: 10
Emergencies Declared: 5
Causes of natural disasters: Storms: 8, Tornadoes: 8, Floods: 6, Hurricanes: 3, Winds: 3, Drought: 1, Freeze: 1, Ice Storm: 1, Snowfall: 1, Winter Storm: 1, Other: 1 (Note: some incidents may be assigned to more than one category).
Hospitals and medical centers in Owens Cross Roads:
Other hospitals and medical centers near Owens Cross Roads:
- HUNTSVILLE HEALTH AND REHABILITATION, LLC (Nursing Home, about 10 miles away; HUNTSVILLE, AL)
- KINDRED TRANSITIONAL CAREANDREHAB-WHITESBURG GARDENS (Nursing Home, about 10 miles away; HUNTSVILLE, AL)
- WHITESBURG MANOR HEALTH CARE CENTER (Nursing Home, about 10 miles away; HUNTSVILLE, AL)
- FMC HUNTSVILLE (Dialysis Facility, about 12 miles away; HUNTSVILLE, AL)
- HUNTSVILLE HOSPICE CARE INC (Hospital, about 12 miles away; HUNTSVILLE, AL)
- DAY SURGERY OF HUNTSVILLE (Hospital, about 12 miles away; HUNTSVILLE, AL)
- HUNTSVILLE HOSPITAL EAST (Hospital, about 12 miles away; HUNTSVILLE, AL)
Colleges/universities with over 2000 students nearest to Owens Cross Roads:
- University of Alabama in Huntsville (about 14 miles; Huntsville, AL; Full-time enrollment: 6,006)
- Alabama A & M University (about 16 miles; Normal, AL; FT enrollment: 4,524)
- John C Calhoun State Community College (about 29 miles; Tanner, AL; FT enrollment: 7,911)
- Northeast Alabama Community College (about 32 miles; Rainsville, AL; FT enrollment: 2,409)
- Snead State Community College (about 32 miles; Boaz, AL; FT enrollment: 2,023)
- Athens State University (about 33 miles; Athens, AL; FT enrollment: 2,771)
- George C Wallace State Community College-Hanceville (about 40 miles; Hanceville, AL; FT enrollment: 4,486)
Private high school in Owens Cross Roads:
Public elementary/middle school in Owens Cross Roads:
- OWENS CROSS ROADS ELEM SCH (Students: 324, Location: 161 WILSON MANN ROAD, Grades: PK-6)
Private elementary/middle school in Owens Cross Roads:
Points of interest:
Notable location: Owens Cross Roads Volunteer Fire Department Station 1 (A). Display/hide its location on the map
Churches in Owens Cross Roads include: Church of Christ (A), Colliers Chapel Church (B), Owen Crossroads Church of God (C), Owen Crossroads First Methodist Church (D). Display/hide their locations on the map
Cemetery: Neal Chapel Cemetery (1). Display/hide its location on the map
Creek: Glover Cove Creek (A). Display/hide its location on the map
Court: Country Gas (9603 Highway 431 South).
Birthplace of: Nathan Tabor - Activist.
| This town: | 2.4 people |
| Alabama: | 2.5 people |
| This town: | 69.0% |
| Whole state: | 67.8% |
| This town: | 6.1% |
| Whole state: | 4.7% |
Likely homosexual households (counted as self-reported same-sex unmarried-partner households)
- Lesbian couples: 0.3% of all households
- Gay men: 0.8% of all households
16 people in residential treatment centers for juveniles (non-correctional) in 2010
30 people in other noninstitutional group quarters in 2000
Banks with branches in Owens Cross Roads (2011 data):
- Cadence Bank, N.A.: Hampton Cove Branch at 3001 Mountain Cove Boulevard, branch established on 2007/11/26. Info updated 2011/12/14: Bank assets: $3,909.7 mil, Deposits: $3,124.0 mil, headquarters in Birmingham, AL, positive income, Commercial Lending Specialization, 112 total offices, Holding Company: Cadence Bancorp Llc
- BancorpSouth Bank: Hampton Cove Branch at 410 Sutton Road, Suite A, branch established on 2010/10/25. Info updated 2007/07/18: Bank assets: $12,990.3 mil, Deposits: $10,863.8 mil, headquarters in Tupelo, MS, positive income, Commercial Lending Specialization, 271 total offices, Holding Company: Bancorpsouth, Inc.
- CB&S Bank, Inc.: Owens Crossroads Branch at 6388 Us Highway 431, branch established on 2008/04/15. Info updated 2011/02/24: Bank assets: $1,276.1 mil, Deposits: $1,018.1 mil, headquarters in Russellville, AL, positive income, Commercial Lending Specialization, 42 total offices, Holding Company: Cbs Banc-Corp.
- First Jackson Bank, Inc.: Wal-Mart Shopping Center Branch at 308 Sutton Road, branch established on 2007/11/16. Info updated 2011/02/24: Bank assets: $223.9 mil, Deposits: $188.7 mil, headquarters in Stevenson, AL, positive income, Commercial Lending Specialization, 6 total offices, Holding Company: 1st Jackson Bancshares, Inc.
- Regions Bank: Hampton Cove Branch at 6639 Hwy 431 South, branch established on 1997/06/26. Info updated 2011/02/24: Bank assets: $123,368.2 mil, Deposits: $98,301.3 mil, headquarters in Birmingham, AL, positive income, Commercial Lending Specialization, 1778 total offices, Holding Company: Regions Financial Corporation
For population 15 years and over in Owens Cross Roads:
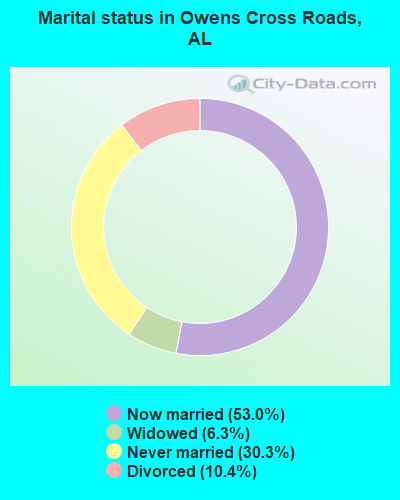
- Never married: 30.3%
- Now married: 53.0%
- Separated: 0.0%
- Widowed: 6.3%
- Divorced: 10.4%
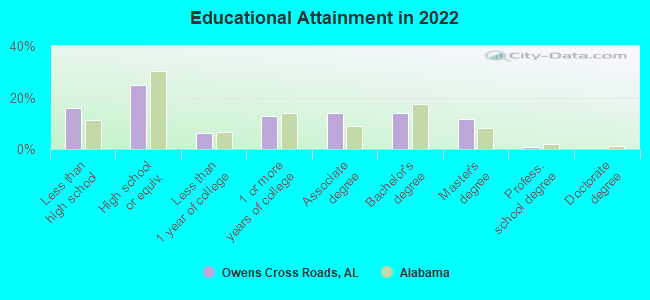
For population 25 years and over in Owens Cross Roads:
- High school or higher: 81.0%
- Bachelor's degree or higher: 24.4%
- Graduate or professional degree: 11.2%
- Unemployed: 11.8%
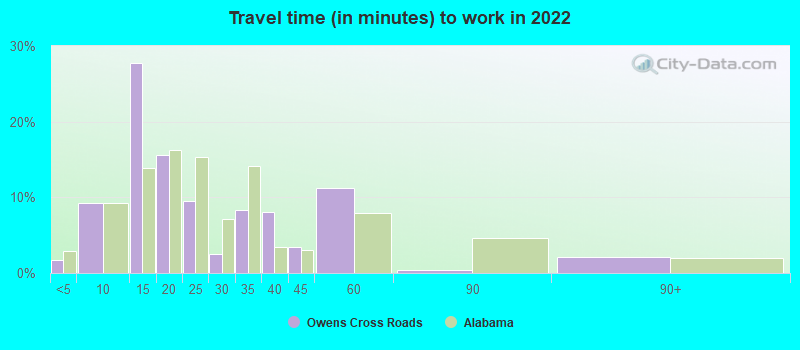
- Mean travel time to work (commute): 23.1 minutes
| Here: | 11.1 |
| Alabama average: | 11.5 |
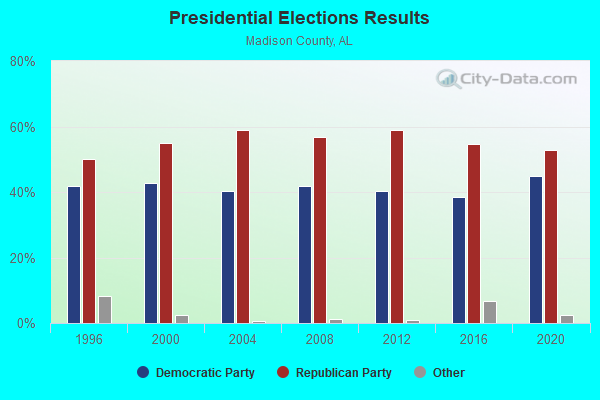
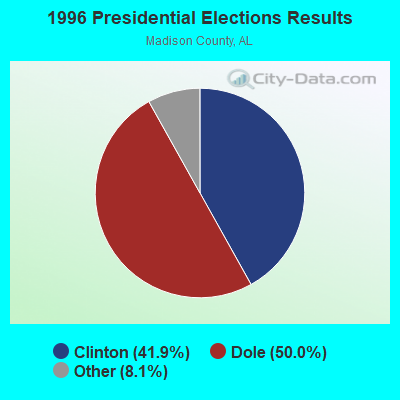
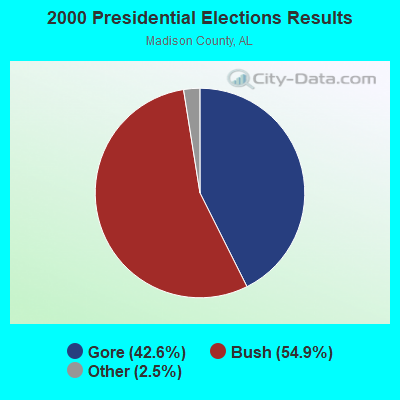


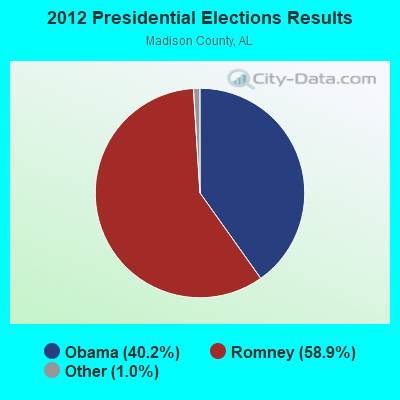
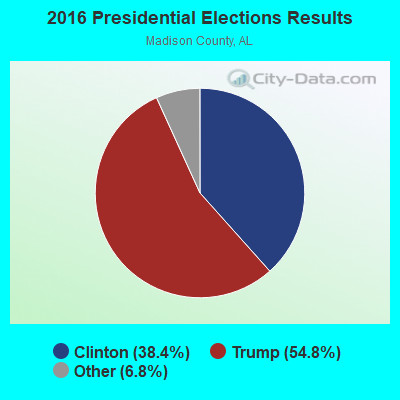
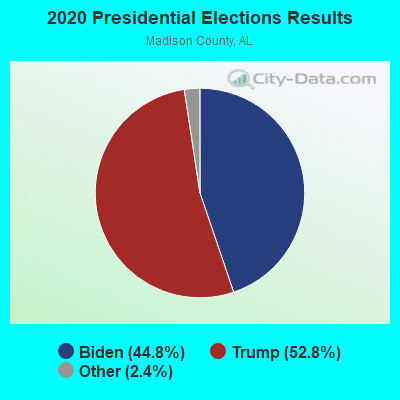
Graphs represent county-level data. Detailed 2008 Election Results
Political contributions by individuals in Owens Cross Roads, AL
Religion statistics for Owens Cross Roads, AL (based on Madison County data)
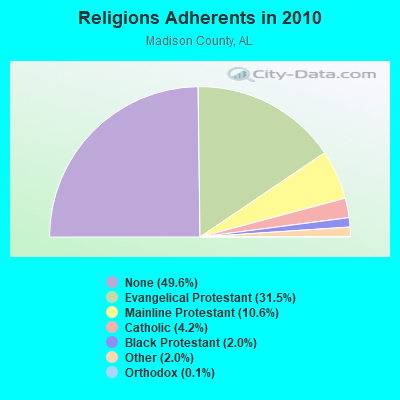
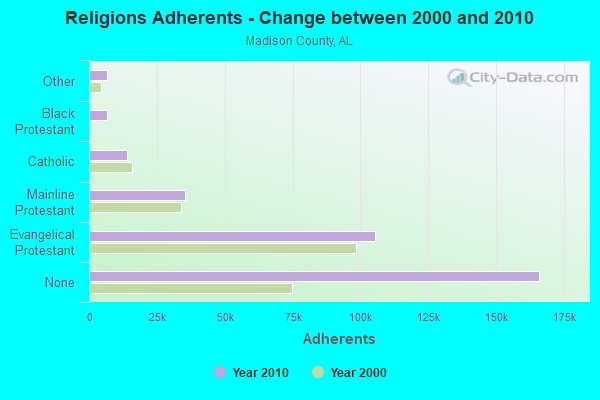
| Religion | Adherents | Congregations |
|---|---|---|
| Evangelical Protestant | 105,503 | 284 |
| Mainline Protestant | 35,533 | 72 |
| Catholic | 14,157 | 6 |
| Black Protestant | 6,710 | 41 |
| Other | 6,587 | 27 |
| Orthodox | 340 | 2 |
| None | 165,981 | - |
Food Environment Statistics:
| Madison County: | 1.12 / 10,000 pop. |
| State: | 1.89 / 10,000 pop. |
| Here: | 0.29 / 10,000 pop. |
| Alabama: | 0.20 / 10,000 pop. |
| Here: | 0.51 / 10,000 pop. |
| Alabama: | 0.65 / 10,000 pop. |
| Madison County: | 5.66 / 10,000 pop. |
| Alabama: | 6.32 / 10,000 pop. |
| This county: | 6.47 / 10,000 pop. |
| State: | 5.75 / 10,000 pop. |
| Here: | 12.1% |
| Alabama: | 11.8% |
| This county: | 30.9% |
| Alabama: | 31.7% |
| Here: | 14.1% |
| Alabama: | 13.5% |
Health and Nutrition:
| Owens Cross Roads: | 56.4% |
| Alabama: | 49.0% |
| Owens Cross Roads: | 58.3% |
| State: | 45.7% |
| Owens Cross Roads: | 28.3 |
| Alabama: | 28.9 |
| Here: | 17.1% |
| Alabama: | 20.7% |
| Here: | 5.7% |
| Alabama: | 11.0% |
| Owens Cross Roads: | 6.9 |
| Alabama: | 6.8 |
| Owens Cross Roads: | 36.3% |
| State: | 34.4% |
| Owens Cross Roads: | 63.0% |
| Alabama: | 55.2% |
| Owens Cross Roads: | 81.4% |
| Alabama: | 79.3% |
More about Health and Nutrition of Owens Cross Roads, AL Residents
| Local government employment and payroll (March 2022) | |||||
| Function | Full-time employees | Monthly full-time payroll | Average yearly full-time wage | Part-time employees | Monthly part-time payroll |
|---|---|---|---|---|---|
| Police Protection - Officers | 5 | $22,781 | $54,674 | 3 | $9,555 |
| Financial Administration | 1 | $5,252 | $63,024 | 0 | $0 |
| Other and Unallocable | 0 | $0 | 3 | $501 | |
| Firefighters | 0 | $0 | 2 | $3,762 | |
| Other Government Administration | 0 | $0 | 8 | $865 | |
| Judicial and Legal | 0 | $0 | 2 | $452 | |
| Totals for Government | 6 | $28,033 | $56,066 | 18 | $15,134 |
Owens Cross Roads government finances - Expenditure in 2017 (per resident):
- Current Operations - Police Protection: $214,000 ($80.69)
Sewerage: $151,000 ($56.94)
Electric Utilities: $79,000 ($29.79)
General - Other: $31,000 ($11.69)
Judicial and Legal Services: $14,000 ($5.28)
Solid Waste Management: $7,000 ($2.64)
Regular Highways: $3,000 ($1.13)
- General - Interest on Debt: $16,000 ($6.03)
- Intergovernmental to Local - Other - Regular Highways: $55,000 ($20.74)
- Total Salaries and Wages: $342,000 ($128.96)
Owens Cross Roads government finances - Revenue in 2017 (per resident):
- Charges - Sewerage: $259,000 ($97.66)
- Local Intergovernmental - Sewerage: $319,000 ($120.29)
- Miscellaneous - Fines and Forfeits: $73,000 ($27.53)
General Revenue - Other: $43,000 ($16.21)
- Tax - General Sales and Gross Receipts: $469,000 ($176.85)
Property: $97,000 ($36.58)
Other License: $49,000 ($18.48)
Alcoholic Beverage Sales: $46,000 ($17.35)
Motor Vehicle License: $37,000 ($13.95)
Occupation and Business License - Other: $31,000 ($11.69)
Motor Fuels Sales: $18,000 ($6.79)
Tobacco Products Sales: $5,000 ($1.89)
Alcoholic Beverage License: $1,000 ($0.38)
Owens Cross Roads government finances - Debt in 2017 (per resident):
- Long Term Debt - Beginning Outstanding - Unspecified Public Purpose: $396,000 ($149.32)
Outstanding Unspecified Public Purpose: $396,000 ($149.32)
7.25% of this county's 2021 resident taxpayers lived in other counties in 2020 ($73,277 average adjusted gross income)
| Here: | 7.25% |
| Alabama average: | 6.87% |
0.07% of residents moved from foreign countries ($1,008 average AGI)
Madison County: 0.07% Alabama average: 0.02%
Top counties from which taxpayers relocated into this county between 2020 and 2021:
| from Limestone County, AL | |
| from Morgan County, AL | |
| from Jefferson County, AL |
6.24% of this county's 2020 resident taxpayers moved to other counties in 2021 ($77,445 average adjusted gross income)
| Here: | 6.24% |
| Alabama average: | 6.41% |
0.04% of residents moved to foreign countries ($728 average AGI)
Madison County: 0.04% Alabama average: 0.02%
Top counties to which taxpayers relocated from this county between 2020 and 2021:
| to Limestone County, AL | |
| to Morgan County, AL | |
| to Marshall County, AL |
| Businesses in Owens Cross Roads, AL | ||||
| Name | Count | Name | Count | |
|---|---|---|---|---|
| FedEx | 1 | Publix Super Markets | 1 | |
| H&R Block | 1 | Rite Aid | 1 | |
| Hardee's | 1 | Subway | 1 | |
| Lowe's | 1 | T-Mobile | 1 | |
| McDonald's | 1 | U-Haul | 1 | |
| Penske | 1 | Walmart | 1 | |
| Pizza Hut | 1 | |||
Strongest AM radio stations in Owens Cross Roads:
- WLOR (1550 AM; 50 kW; HUNTSVILLE, AL; Owner: BCA RADIO, LLC)
- WDJL (1000 AM; daytime; 10 kW; HUNTSVILLE, AL; Owner: JAMES K. SHARP DBA 5TH AVE BROADCASTING)
- WEUP (1600 AM; 10 kW; HUNTSVILLE, AL; Owner: HUNDLEY BATTS, SR. & VIRGINIA CAPLES)
- WEUV (1700 AM; 10 kW; HUNTSVILLE, AL; Owner: HUNDLEY BATTS, SR & VIRGINIA CAPLES)
- WWAM (820 AM; daytime; 50 kW; JASPER, TN; Owner: SHELTON BROADCASTING SYSTEM)
- WBXR (1140 AM; daytime; 15 kW; HAZEL GREEN, AL; Owner: LOW COUNTRY CORPORATION, INC.)
- WNSI (810 AM; 50 kW; JACKSONVILLE, AL; Owner: UNITED BROADCASTING NETWORK, INC.)
- WVNN (770 AM; 10 kW; ATHENS, AL; Owner: ATHENS BROADCASTING COMPANY, INC.)
- WDJC (850 AM; 50 kW; BIRMINGHAM, AL; Owner: KIMTRON, INC.)
- WJOX (690 AM; 50 kW; BIRMINGHAM, AL; Owner: CITADEL BROADCASTING COMPANY)
- WFLI (1070 AM; 50 kW; LOOKOUT MOUNTAIN, TN; Owner: WFLI, INC.)
- WAPI (1070 AM; 50 kW; BIRMINGHAM, AL; Owner: CITADEL BROADCASTING COMPANY)
- WSM (650 AM; 50 kW; NASHVILLE, TN; Owner: GAYLORD ENTERTAINMENT COMPANY)
Strongest FM radio stations in Owens Cross Roads:
- W298AF (107.5 FM; HADEN, AL; Owner: HADEN RADIO COMPANY)
- WLRH (89.3 FM; HUNTSVILLE, AL; Owner: ALABAMA EDUCATIONAL TELEVISION COMMISSION)
- W289AC (105.7 FM; HUNTSVILLE, AL; Owner: WILLIAM PAXTON ROGERS)
- WXQW (94.1 FM; MERIDIANVILLE, AL; Owner: CAPSTAR TX LIMITED PARTNERSHIP)
- W293AH (106.5 FM; NORMAL, AL; Owner: CAPSTAR TX LIMITED PARTNERSHIP)
- WRSA-FM (96.9 FM; DECATUR, AL; Owner: NCA, INC.)
- W249BB (97.7 FM; HUNTSVILLE, AL; Owner: WAY-FM MEDIA GROUP, INC.)
- W275AA (102.9 FM; HUNTSVILLE, AL; Owner: ARCHIE C. BOBO, PERSONAL REP. OF DORSEY E. NEWMAN ESTATE)
- W300AH (107.9 FM; HUNTSVILLE, AL; Owner: PORTER L. BATTS)
- W202BV (88.3 FM; HUNTSVILLE, AL; Owner: WAY-FM MEDIA GROUP, INC.)
- WAHR (99.1 FM; HUNTSVILLE, AL; Owner: BCA RADIO, LLC)
- WRTT-FM (95.1 FM; HUNTSVILLE, AL; Owner: BCA RADIO, LLC)
- W222AK (92.3 FM; HUNTSVILLE, AL; Owner: PRESS W. PARHAM)
- WZYP (104.3 FM; ATHENS, AL; Owner: ATHENS BROADCASTING COMPANY, INC.)
- WYFD (91.7 FM; DECATUR, AL; Owner: BIBLE BROADCASTING NETWORK, INC.)
- W278AA (103.5 FM; MADISON, AL; Owner: TENNESSEE VALLEY RADIO, INC.)
- WAFN-FM (92.7 FM; ARAB, AL; Owner: FUN MEDIA GROUP, INC.)
- WDRM (102.1 FM; DECATUR, AL; Owner: CAPSTAR TX LIMITED PARTNERSHIP)
- WJIA (88.5 FM; GUNTERSVILLE, AL; Owner: LAKE CITY EDUCATIONAL B/CASTING INC.)
- WTAK-FM (106.1 FM; HARTSELLE, AL; Owner: CAPSTAR TX LIMITED PARTNERSHIP)
TV broadcast stations around Owens Cross Roads:
- WZDX (Channel 54; HUNTSVILLE, AL; Owner: HUNTSVILLE TELEVISION ACQUISITION CORP.)
- WAAY-TV (Channel 31; HUNTSVILLE, AL; Owner: PIEDMONT TELEVISION OF HUNTSVILLE LICENSE LLC)
- WHNT-TV (Channel 19; HUNTSVILLE, AL; Owner: NEW YORK TIMES MANAGEMENT SERVICES)
- W67CO (Channel 67; HUNTSVILLE, AL; Owner: TRINITY BROADCASTING NETWORK)
- WHIQ (Channel 25; HUNTSVILLE, AL; Owner: ALABAMA EDUCATIONAL TELEVISION COMMISSION)
- W64BJ (Channel 64; SCOTTSBORO, AL; Owner: TRINITY BROADCASTING NETWORK)
- WTZT-LP (Channel 11; ATHENS, AL; Owner: WTZT-LP TELEVISION STATION, L.L.C.)
- W38BQ (Channel 38; HUNTSVILLE, AL; Owner: THREE ANGELS BROADCASTING NETWORK)
- Owens Cross Roads, Alabama
- Fatal accident count11
- Vehicles involved in fatal accidents18
- Fatal accidents involving drunk persons:1
- Fatalities12
- Persons involved in fatal accidents29
- Pedestrians involved in fatal accidents0
- Alabama average
- Fatal accident count6089
- Vehicles involved in fatal accidents9254
- Fatal accidents involving drunk persons1964
- Fatalities6686
- Persons involved in fatal accidents14301
- Pedestrians involved in fatal accidents562
- National Bridge Inventory (NBI) Statistics
- 25Number of bridges
- 325ft / 99.5mTotal length
- $35,323,000Total costs
- 111,888Total average daily traffic
- 10,242Total average daily truck traffic
- 151,059Total future (year 2029) average daily traffic
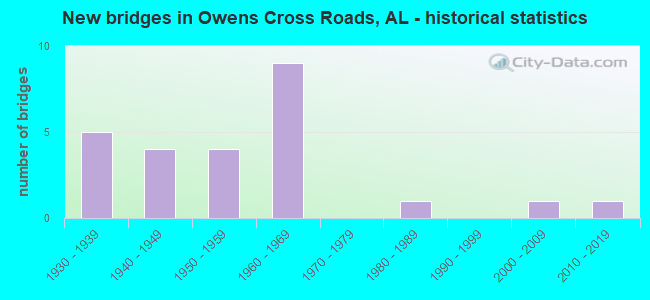
- New bridges - historical statistics
- 51930-1939
- 41940-1949
- 41950-1959
- 91960-1969
- 11980-1989
- 12000-2009
- 12010-2019
FCC Registered Antenna Towers:
29 (See the full list of FCC Registered Antenna Towers in Owens Cross Roads)FCC Registered Broadcast Land Mobile Towers:
5- Lat: 34.662139 Lon: -86.478528, Call Sign: WQYZ204,
Assigned Frequencies: 452.637 MHz, 457.862 MHz, 462.487 MHz, 451.562 MHz, 452.187 MHz, 457.687 MHz, Grant Date: 03/08/2017, Expiration Date: 03/08/2027, Certifier: Yvette A Coley-Smith, Registrant: Washington Radio Reports, Gettysburg, PA 17325, Phone: (717) 334-0668, Fax: (717) 334-6440, Email:
- Lat: 34.582972 Lon: -86.462083, Call Sign: WRCG659,
Assigned Frequencies: 463.912 MHz, 463.987 MHz, 467.100 MHz, 468.912 MHz, 468.987 MHz, Grant Date: 09/26/2018, Expiration Date: 09/26/2028, Certifier: Wilson Mann, Registrant: J&k Communications, Inc., 222 Towerview Drive, Columbia City, IN 46725, Phone: (260) 244-7975, Fax: (260) 244-3253, Email:
- Lat: 34.589167 Lon: -86.456389, Call Sign: WREB761,
Assigned Frequencies: 452.487 MHz, 456.512 MHz, 456.762 MHz, 457.112 MHz, 457.487 MHz, Grant Date: 09/13/2019, Expiration Date: 09/13/2029, Certifier: Adam Hampton, Registrant: Sharp Communication, 3403 Governors Drive Sw, Huntsville, AL 35805, Phone: (256) 929-9021, Email:
- 652 Taylor Road (Lat: 34.640806 Lon: -86.485194), Call Sign: WRJG998,
Assigned Frequencies: 451.412 MHz, 456.412 MHz, 451.637 MHz, 456.637 MHz, 452.137 MHz, 457.137 MHz, 452.312 MHz, 457.312 MHz, 452.762 MHz, 457.762 MHz, Grant Date: 08/28/2020, Expiration Date: 08/28/2030, Certifier: Scott Weeks, Registrant: Planet Headset, Inc, 811 Enati Way, Fox Island, WA 98333, Phone: (253) 238-0643, Fax: (253) 559-8555, Email:
- 314 James Rd (Lat: 34.667417 Lon: -86.493500), Call Sign: WSAP701,
Assigned Frequencies: 452.037 MHz, 457.987 MHz, 451.762 MHz, 451.662 MHz, 451.712 MHz, Grant Date: 02/02/2024, Expiration Date: 02/02/2034, Certifier: Stephanie Massanelli, Registrant: Myradiodealer, 25 Chatuge Shores Cir, Hayesville, NC 28904, Phone: (828) 389-5000, Email:
FCC Registered Microwave Towers:
2- 9BH1349A, 238 Wilson Mann Road (Lat: 34.585694 Lon: -86.452778), Type: Ltower, Structure height: 77.7 m, Overall height: 80.7 m, Call Sign: WQQW468,
Assigned Frequencies: 11565.0 MHz, 11645.0 MHz, 11565.0 MHz, 11645.0 MHz, 11565.0 MHz, 11645.0 MHz, 11565.0 MHz, 11645.0 MHz, 11565.0 MHz, 11645.0 MHz... (+12 more), Grant Date: 05/01/2023, Expiration Date: 03/14/2033, Certifier: Dan Menser, Registrant: T-Mobile License LLC, 12920 Se 38th St, Bellevue, WA 98006, Phone: (425) 383-8401, Fax: (425) 383-4040, Email:
- BI03MR099, 1548 Oak Grove Road (Lat: 34.516889 Lon: -86.426583), Type: Ltower, Structure height: 85.3 m, Overall height: 87.1 m, Call Sign: WQVL480,
Assigned Frequencies: 10895.0 MHz, 10895.0 MHz, 10895.0 MHz, 10895.0 MHz, 10895.0 MHz, 10895.0 MHz, 10895.0 MHz, 10895.0 MHz, Grant Date: 03/18/2015, Expiration Date: 03/18/2025, Cancellation Date: 04/06/2022, Certifier: David Werblow, Registrant: Dla Piper LLP, 500 8th Street, Nw, Washington, DC 20004, Phone: (202) 799-4216, Fax: (202) 799-5616, Email:
FCC Registered Amateur Radio Licenses:
145 (See the full list of FCC Registered Amateur Radio Licenses in Owens Cross Roads)FAA Registered Aircraft:
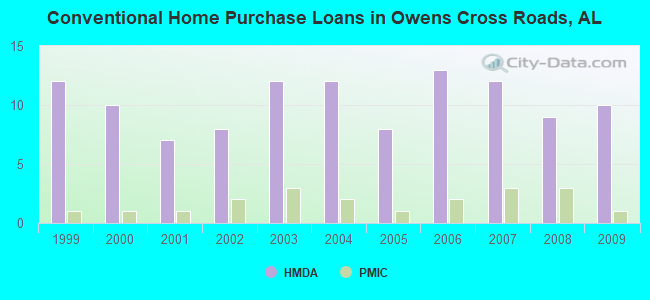
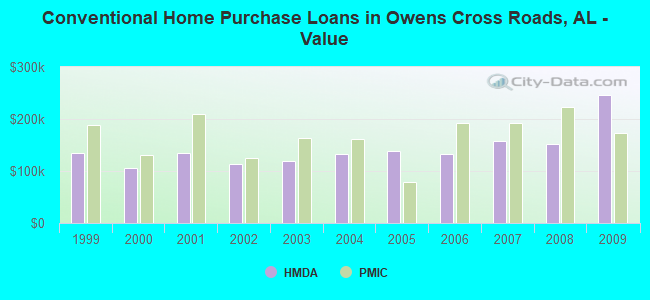
12 (See the full list of FAA Registered Aircraft in Owens Cross Roads)| Home Mortgage Disclosure Act Aggregated Statistics For Year 2009 (Based on 2 partial tracts) | ||||||||||
| A) FHA, FSA/RHS & VA Home Purchase Loans | B) Conventional Home Purchase Loans | C) Refinancings | D) Home Improvement Loans | F) Non-occupant Loans on < 5 Family Dwellings (A B C & D) | ||||||
|---|---|---|---|---|---|---|---|---|---|---|
| Number | Average Value | Number | Average Value | Number | Average Value | Number | Average Value | Number | Average Value | |
| LOANS ORIGINATED | 10 | $194,756 | 10 | $246,220 | 23 | $209,442 | 2 | $53,000 | 1 | $89,160 |
| APPLICATIONS APPROVED, NOT ACCEPTED | 0 | $0 | 1 | $124,080 | 2 | $132,055 | 0 | $0 | 0 | $0 |
| APPLICATIONS DENIED | 2 | $122,765 | 2 | $117,590 | 5 | $190,966 | 1 | $21,200 | 0 | $0 |
| APPLICATIONS WITHDRAWN | 1 | $346,540 | 1 | $475,360 | 6 | $186,343 | 0 | $0 | 0 | $0 |
| FILES CLOSED FOR INCOMPLETENESS | 0 | $0 | 0 | $0 | 1 | $196,030 | 0 | $0 | 0 | $0 |
Detailed HMDA statistics for the following Tracts: 0113.00
| Private Mortgage Insurance Companies Aggregated Statistics For Year 2009 (Based on 2 partial tracts) | ||||
| A) Conventional Home Purchase Loans | B) Refinancings | |||
|---|---|---|---|---|
| Number | Average Value | Number | Average Value | |
| LOANS ORIGINATED | 1 | $173,460 | 2 | $201,205 |
| APPLICATIONS APPROVED, NOT ACCEPTED | 0 | $0 | 0 | $0 |
| APPLICATIONS DENIED | 0 | $0 | 0 | $0 |
| APPLICATIONS WITHDRAWN | 0 | $0 | 0 | $0 |
| FILES CLOSED FOR INCOMPLETENESS | 0 | $0 | 0 | $0 |
Detailed PMIC statistics for the following Tracts: 0113.00
2002 - 2018 National Fire Incident Reporting System (NFIRS) incidents
- Fire incident types reported to NFIRS in Owens Cross Roads, AL
- 14449.5%Outside Fires
- 9231.6%Structure Fires
- 3512.0%Mobile Property/Vehicle Fires
- 206.9%Other
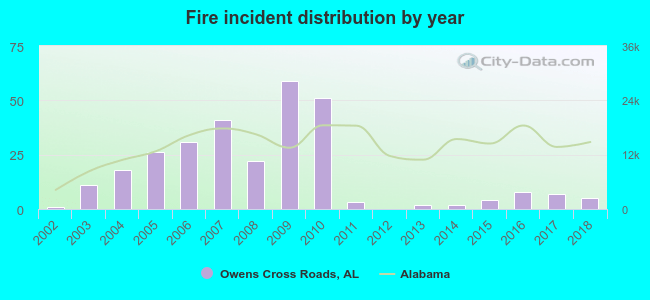 According to the data from the years 2002 - 2018 the average number of fire incidents per year is 17. The highest number of reported fire incidents - 59 took place in 2009, and the least - 0 in 2012. The data has a rising trend.
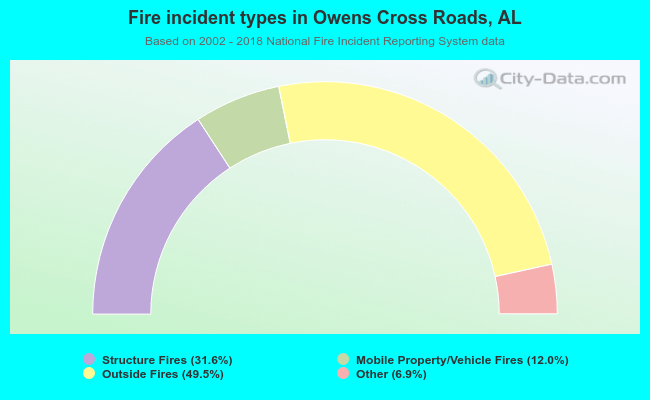 When looking into fire subcategories, the most reports belonged to: Outside Fires (49.5%), and Structure Fires (31.6%).
| Most common first names in Owens Cross Roads, AL among deceased individuals | ||
| Name | Count | Lived (average) |
|---|---|---|
| James | 47 | 70.6 years |
| William | 34 | 70.6 years |
| Robert | 32 | 73.9 years |
| John | 27 | 73.9 years |
| Mary | 23 | 80.6 years |
| Willie | 19 | 76.6 years |
| Charles | 16 | 67.3 years |
| George | 15 | 75.3 years |
| Thomas | 13 | 71.5 years |
| Ruby | 10 | 71.2 years |
| Most common last names in Owens Cross Roads, AL among deceased individuals | ||
| Last name | Count | Lived (average) |
|---|---|---|
| Maples | 18 | 79.3 years |
| Smith | 16 | 76.3 years |
| Drake | 14 | 75.4 years |
| Glover | 14 | 73.5 years |
| Byrd | 14 | 74.6 years |
| Miller | 13 | 69.4 years |
| Hillis | 11 | 60.8 years |
| Lanier | 10 | 81.1 years |
| Craft | 10 | 79.9 years |
| Craig | 10 | 79.9 years |
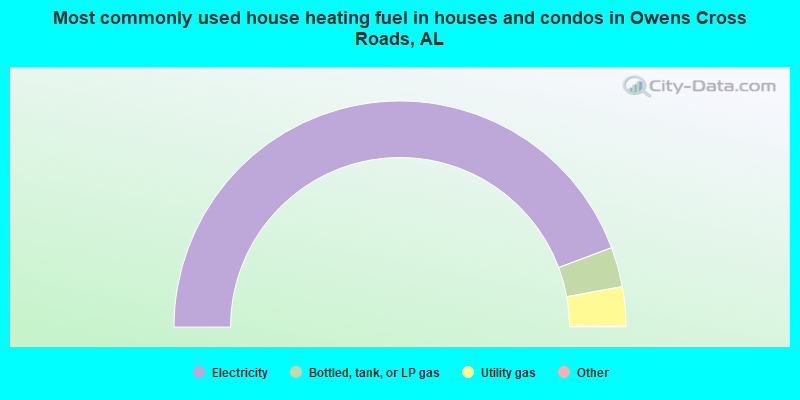
- 88.7%Electricity
- 5.7%Bottled, tank, or LP gas
- 5.6%Utility gas
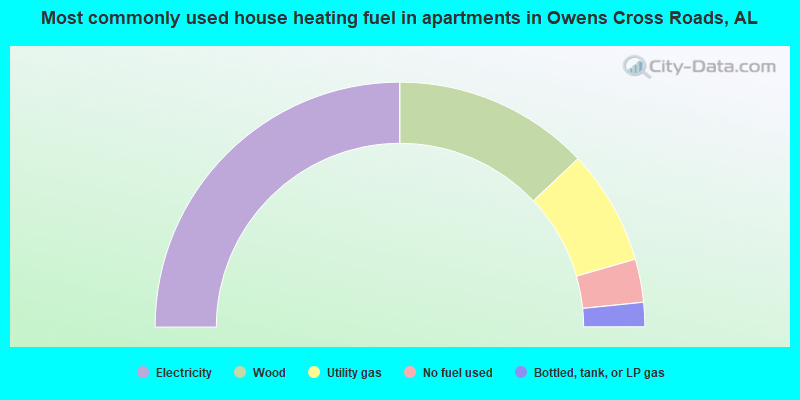
- 50.0%Electricity
- 25.9%Wood
- 15.2%Utility gas
- 5.7%No fuel used
- 3.2%Bottled, tank, or LP gas
Owens Cross Roads compared to Alabama state average:
- Hispanic race population percentage below state average.
- Median age below state average.
- Renting percentage below state average.
- House age significantly below state average.
- Institutionalized population percentage significantly above state average.
- Number of college students above state average.
Owens Cross Roads on our top lists:
- #97 on the list of "Top 101 cities with the largest percentage of people in other noninstitutional group quarters (population 1,000+)"
- #40 on the list of "Top 101 counties with the highest number of infant deaths per 1000 residents 2007-2013 (pop. 50,000+)"
- #66 on the list of "Top 101 counties with the most Evangelical Protestant adherents"
- #82 on the list of "Top 101 counties with the highest ground withdrawal of fresh water for public supply"
- #83 on the list of "Top 101 counties with the most Black Protestant congregations"
- #83 on the list of "Top 101 counties with the most Evangelical Protestant congregations"

|
|
Total of 58 patent applications in 2008-2024.