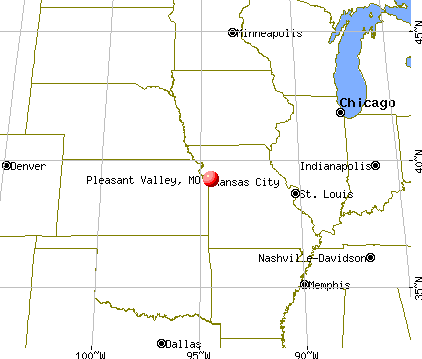
Pleasant Valley, Missouri
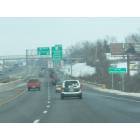
Submit your own pictures of this city and show them to the world
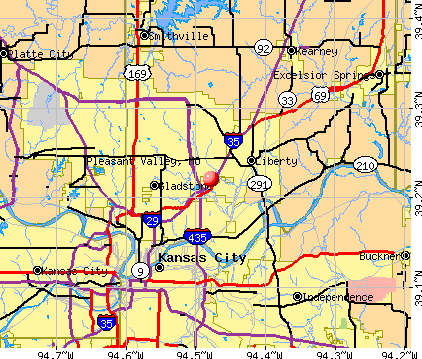
- OSM Map
- General Map
- Google Map
- MSN Map
Population change since 2000: -17.9%
 |
| Males: 1,270 | |
| Females: 1,457 |
| Median resident age: | 44.2 years |
| Missouri median age: | 39.1 years |
Zip codes: 64068.
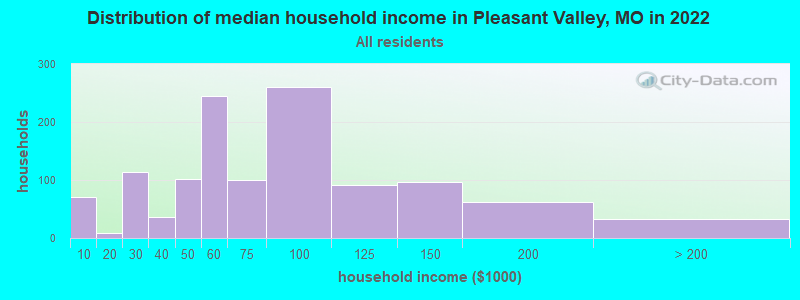
| Pleasant Valley: | $69,331 |
| MO: | $64,811 |
Estimated per capita income in 2022: $34,733 (it was $26,084 in 2000)
Pleasant Valley city income, earnings, and wages data
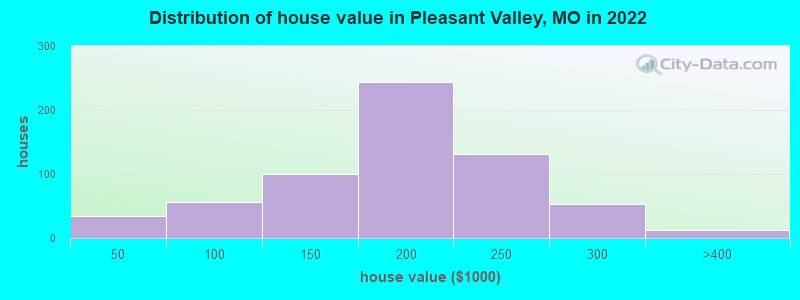
Estimated median house or condo value in 2022: $201,861 (it was $96,100 in 2000)
| Pleasant Valley: | $201,861 |
| MO: | $221,200 |
Mean prices in 2022: all housing units: $188,416; detached houses: $190,306; townhouses or other attached units: $145,425
Median gross rent in 2022: $1,043.
Pleasant Valley, MO residents, houses, and apartments details
(6.3% for White Non-Hispanic residents, 7.1% for Black residents, 100.0% for Native Hawaiian and other Pacific Islander residents, 9.3% for two or more races residents)
Detailed information about poverty and poor residents in Pleasant Valley, MO

Compare current foreclosures near Pleasant Valley, MO:
| Photo | Address | Area | Beds / Baths | Price | Details |
|---|---|---|---|---|---|

|
#1
E 34th St S
Independence, MO 64052
|
1,656 sq. feet
|
1 baths 3 beds |
$235,000
|
show details |

|
#2
N 46th St
Kansas City, KS 66102
|
980 sq. feet
|
1 baths 2 beds |
$78,500
|
show details |

|
#3
Rockhill Rd
Kansas City, MO 64110
|
1,752 sq. feet
|
2 baths 4 beds |
$334,900
|
show details |

|
#4
Admiral Blvd Apt 1006
Kansas City, MO 64106
|
752 sq. feet
|
1 baths 1 beds |
$187,000
|
show details |

|
#5
S Benton Ave
Kansas City, MO 64130
|
1,804 sq. feet
|
2 baths 3 beds |
$89,900
|
show details |

|
#6
Wabash Ave
Kansas City, MO 64130
|
836 sq. feet
|
1 baths 2 beds |
$52,000
|
show details |

|
#7
Walker Ave
Kansas City, KS 66104
|
1,540 sq. feet
|
2 baths 3 beds |
$129,900
|
show details |

|
#8
Indiana Ave
Kansas City, MO 64130
|
916 sq. feet
|
1 baths 2 beds |
$125,000
|
show details |

|
#9
E 68th Ter
Kansas City, MO 64132
|
720 sq. feet
|
1 baths 2 beds |
$64,050
|
show details |

|
#10
E 41st St
Kansas City, MO 64111
|
801 sq. feet
|
1 baths 1 beds |
$135,000
|
show details |
| Photo | Address | Area | Beds / Baths | Price | Details |
|---|---|---|---|---|---|

|
#11
Lyons Ave
Kansas City, KS 66101
|
586 sq. feet
|
1 baths 2 beds |
$15,900
|
show details |

|
#12
E 40th St
Kansas City, MO 64130
|
- sq. feet
|
1 baths 3 beds |
$19,900
|
show details |

|
#13
E Susquehanna Dr
Independence, MO 64056
|
6,462 sq. feet
|
10 baths 12 beds |
show details | |

|
#14
Paseo Blvd
Kansas City, MO 64110
|
2,608 sq. feet
|
2 baths 6 beds |
show details | |

|
#15
NW Valley Ln
Riverside, MO 64150
|
1,541 sq. feet
|
1 baths 2 beds |
show details | |

|
#16
E 79th St
Kansas City, MO 64138
|
1,943 sq. feet
|
2 baths 3 beds |
show details | |

|
#17
Georgia Ave
Kansas City, KS 66104
|
- sq. feet
|
1 baths 2 beds |
show details | |

|
#18
N 73rd St
Kansas City, KS 66109
|
1,314 sq. feet
|
1 baths 3 beds |
show details | |

|
#19
E Blackhawk Trl
Independence, MO 64056
|
1,334 sq. feet
|
2 baths 3 beds |
show details | |

|
#20
E 58th Ter
Kansas City, MO 64129
|
1,224 sq. feet
|
2 baths 3 beds |
show details |
| Photo | Address | Area | Beds / Baths | Price | Details |
|---|---|---|---|---|---|

|
#21
E 75th St
Kansas City, MO 64138
|
1,440 sq. feet
|
1 baths 3 beds |
show details | |

|
#22
E 59th Terrace Cir
Kansas City, MO 64133
|
1,380 sq. feet
|
2 baths 2 beds |
show details | |

|
#23
S Ash Ave
Independence, MO 64052
|
922 sq. feet
|
1 baths 2 beds |
show details | |

|
#24
N Ponca Dr
Independence, MO 64058
|
725 sq. feet
|
1 baths 2 beds |
show details | |

|
#25
N Union St
Independence, MO 64050
|
912 sq. feet
|
2 baths 3 beds |
show details | |

|
#26
N 45th St
Kansas City, KS 66104
|
1,120 sq. feet
|
1 baths 3 beds |
show details | |

|
#27
E 57th St
Kansas City, MO 64133
|
840 sq. feet
|
1 baths 3 beds |
show details | |

|
#28
N Hudson St
Buckner, MO 64016
|
1,612 sq. feet
|
1 baths 2 beds |
show details | |

|
#29
N Lydia Ave
Kansas City, MO 64155
|
1,598 sq. feet
|
2 baths 3 beds |
show details | |

|
#30
W 40th St
Kansas City, MO 64111
|
2,110 sq. feet
|
1 baths 4 beds |
show details |
| Photo | Address | Area | Beds / Baths | Price | Details |
|---|---|---|---|---|---|

|
#31
NW Ashford Ct
Blue Springs, MO 64015
|
4,631 sq. feet
|
4 baths 6 beds |
show details | |

|
#32
N Olive St
Kansas City, MO 64118
|
1,200 sq. feet
|
2 baths 3 beds |
show details | |

|
#33
N 40th St
Kansas City, KS 66102
|
1,147 sq. feet
|
1 baths 3 beds |
show details | |

|
#34
Benton Blvd
Kansas City, MO 64130
|
- sq. feet
|
2 baths 4 beds |
show details | |

|
#35
Bur Oak Dr
Liberty, MO 64068
|
3,780 sq. feet
|
3 baths 6 beds |
show details | |

|
#36
Cottonwood Creek Ct
Kearney, MO 64060
|
- sq. feet
|
2 baths 3 beds |
show details | |

|
#37
W 42nd Ave
Kansas City, KS 66103
|
1,816 sq. feet
|
1 baths 3 beds |
show details | |

|
#38
El Monte St
Mission, KS 66205
|
976 sq. feet
|
1 baths 2 beds |
show details | |

|
#39
Metcalf Ct # 41
Mission, KS 66202
|
1,260 sq. feet
|
2 baths 2 beds |
show details | |

|
#40
Lockridge Ave
Kansas City, MO 64128
|
3,012 sq. feet
|
3 baths 7 beds |
show details |
| Photo | Address | Area | Beds / Baths | Price | Details |
|---|---|---|---|---|---|

|
#41
E 47th Ter S
Independence, MO 64055
|
950 sq. feet
|
1 baths 2 beds |
show details | |

|
#42
N Winchester Ave
Kansas City, MO 64119
|
960 sq. feet
|
2 baths 4 beds |
show details | |

|
#43
S Greenwich Ln
Independence, MO 64055
|
1,000 sq. feet
|
1 baths 3 beds |
show details | |

|
#44
N Flora Ave
Kansas City, MO 64118
|
1,840 sq. feet
|
1 baths 4 beds |
show details | |

|
#45
Lockridge Ave
Kansas City, MO 64128
|
1,048 sq. feet
|
2 baths 3 beds |
show details | |

|
#46
Sycamore Ave
Kansas City, MO 64138
|
1,504 sq. feet
|
1 baths 3 beds |
show details | |

|
#47
Haskell Ave
Kansas City, KS 66109
|
1,386 sq. feet
|
2 baths 3 beds |
show details | |

|
#48
NE 114th St
Kansas City, MO 64155
|
1,214 sq. feet
|
2 baths 3 beds |
show details | |

|
#49
E 8th St N
Independence, MO 64056
|
967 sq. feet
|
1 baths 3 beds |
show details | |

|
Check over 1 million property listings on Foreclosure.com!
|
browse all offers | |||


- 2,40486.2%White alone
- 1676.0%Hispanic
- 1124.0%Two or more races
- 451.6%Black alone
- 250.9%Asian alone
- 70.3%American Indian alone
- 10.04%Native Hawaiian and Other
Pacific Islander alone
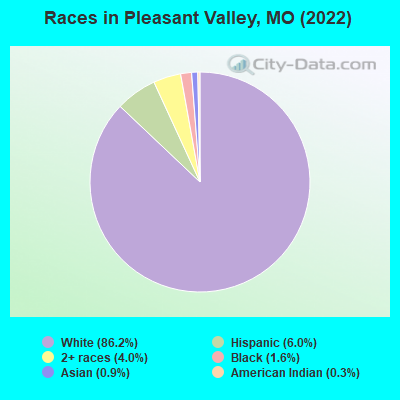
Races in Pleasant Valley detailed stats: ancestries, foreign born residents, place of birth
According to our research of Missouri and other state lists, there were 5 registered sex offenders living in Pleasant Valley, Missouri as of April 28, 2024.
The ratio of all residents to sex offenders in Pleasant Valley is 624 to 1.
The ratio of registered sex offenders to all residents in this city is lower than the state average.
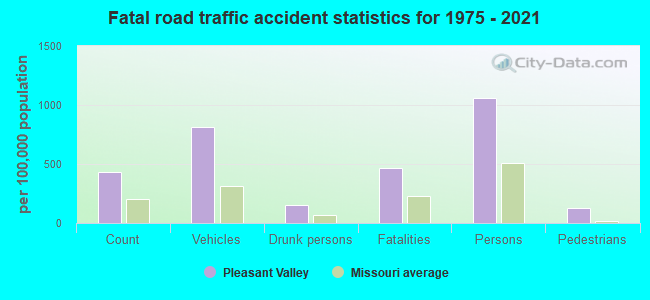
Type |
2009 |
2010 |
2011 |
2012 |
2013 |
2014 |
2015 |
2016 |
2017 |
2018 |
2019 |
2020 |
2021 |
2022 |
|---|---|---|---|---|---|---|---|---|---|---|---|---|---|---|
| Murders (per 100,000) | 0 (0.0) | 0 (0.0) | 0 (0.0) | 0 (0.0) | 0 (0.0) | 0 (0.0) | 0 (0.0) | 0 (0.0) | 0 (0.0) | 0 (0.0) | 0 (0.0) | 0 (0.0) | 0 (0.0) | 0 (0.0) |
| Rapes (per 100,000) | 0 (0.0) | 2 (67.5) | 0 (0.0) | 1 (33.2) | 2 (66.0) | 1 (32.8) | 0 (0.0) | 0 (0.0) | 0 (0.0) | 1 (32.7) | 0 (0.0) | 2 (65.7) | 0 (0.0) | 1 (36.6) |
| Robberies (per 100,000) | 0 (0.0) | 0 (0.0) | 2 (67.3) | 0 (0.0) | 0 (0.0) | 0 (0.0) | 0 (0.0) | 0 (0.0) | 0 (0.0) | 0 (0.0) | 0 (0.0) | 1 (32.9) | 0 (0.0) | 1 (36.6) |
| Assaults (per 100,000) | 5 (140.9) | 4 (135.1) | 1 (33.6) | 1 (33.2) | 3 (99.0) | 3 (98.4) | 1 (32.5) | 6 (195.2) | 8 (259.4) | 4 (130.8) | 1 (32.5) | 3 (98.6) | 4 (130.6) | 7 (256.1) |
| Burglaries (per 100,000) | 11 (310.0) | 7 (236.4) | 8 (269.2) | 20 (664.9) | 9 (296.9) | 6 (196.9) | 11 (357.3) | 10 (325.3) | 10 (324.3) | 6 (196.1) | 4 (130.2) | 11 (361.6) | 9 (293.8) | 4 (146.4) |
| Thefts (per 100,000) | 35 (986.5) | 29 (979.4) | 43 (1,447) | 33 (1,097) | 38 (1,254) | 28 (918.6) | 17 (552.1) | 20 (650.6) | 21 (680.9) | 19 (621.1) | 20 (650.8) | 29 (953.3) | 35 (1,143) | 15 (548.8) |
| Auto thefts (per 100,000) | 6 (169.1) | 5 (168.9) | 6 (201.9) | 0 (0.0) | 4 (132.0) | 9 (295.3) | 4 (129.9) | 11 (357.8) | 5 (162.1) | 6 (196.1) | 11 (358.0) | 12 (394.5) | 11 (359.1) | 6 (219.5) |
| Arson (per 100,000) | 1 (28.2) | 0 (0.0) | 0 (0.0) | 0 (0.0) | 0 (0.0) | 0 (0.0) | 0 (0.0) | 0 (0.0) | 1 (32.4) | 0 (0.0) | 0 (0.0) | 0 (0.0) | 1 (32.6) | 0 (0.0) |
| City-Data.com crime index | 102.9 | 150.3 | 119.8 | 123.7 | 154.1 | 120.1 | 64.0 | 116.5 | 114.8 | 106.6 | 70.3 | 177.2 | 121.1 | 141.2 |
The City-Data.com crime index weighs serious crimes and violent crimes more heavily. Higher means more crime, U.S. average is 246.1. It adjusts for the number of visitors and daily workers commuting into cities.
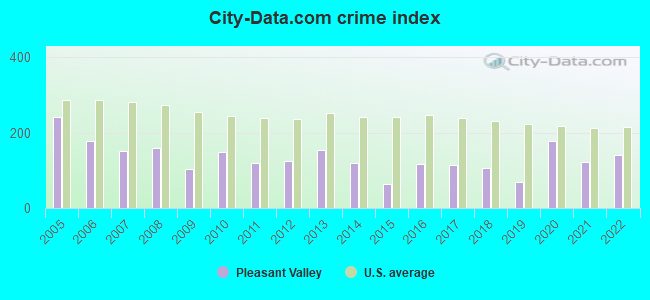
Crime rate in Pleasant Valley detailed stats: murders, rapes, robberies, assaults, burglaries, thefts, arson
Full-time law enforcement employees in 2021, including police officers: 21 (9 officers - 8 male; 1 female).
| Officers per 1,000 residents here: | 2.94 |
| Missouri average: | 2.54 |
 Recent articles from our blog. Our writers, many of them Ph.D. graduates or candidates, create easy-to-read articles on a wide variety of topics.

 | Southerner moving to KC (18 replies) |
| Missouri Outlaw History (3407 replies) |
| What are the most "white trash" towns around Kansas City, in rough order? (60 replies) |
| Kansas City Neighborhoods......Where to live?!?!?! (16 replies) |
| young family moving to KC in 9 days! Couple of questions.... (15 replies) |
| North Kansas City?? (28 replies) |
Latest news from Pleasant Valley, MO collected exclusively by city-data.com from local newspapers, TV, and radio stations
Ancestries: English (17.0%), American (14.8%), German (13.0%), Irish (10.1%), Scotch-Irish (6.1%), Swedish (2.4%).
Current Local Time: CST time zone
Incorporated in 1962
Land area: 1.30 square miles.
Population density: 2,102 people per square mile (low).
39 residents are foreign born
| This city: | 1.4% |
| Missouri: | 4.2% |
Median real estate property taxes paid for housing units with mortgages in 2022: $2,197 (1.1%)
Median real estate property taxes paid for housing units with no mortgage in 2022: $2,063 (1.1%)
Nearest city with pop. 50,000+: Independence, MO  (10.5 miles , pop. 113,288).
Nearest city with pop. 200,000+: Kansas City, MO (10.8 miles , pop. 441,545).
Nearest city with pop. 1,000,000+: Chicago, IL (400.6 miles , pop. 2,896,016).
Nearest cities:
), ), ), ), ), Latitude: 39.22 N, Longitude: 94.48 W
Area code commonly used in this area: 816
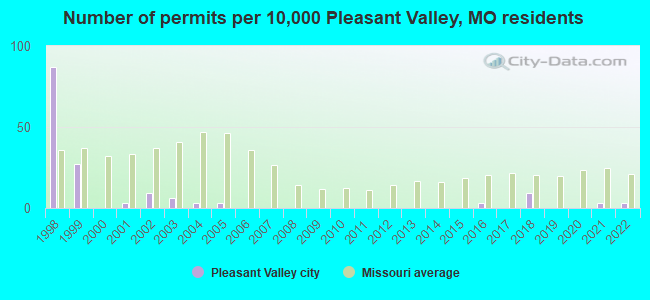
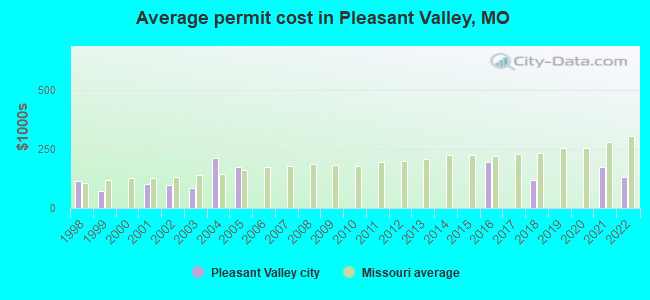
Single-family new house construction building permits:
- 2022: 1 building, cost: $132,000
- 2021: 1 building, cost: $175,000
- 2018: 3 buildings, average cost: $116,700
- 2016: 1 building, cost: $195,000
- 2005: 1 building, cost: $173,800
- 2004: 1 building, cost: $213,000
- 2003: 2 buildings, average cost: $86,000
- 2002: 3 buildings, average cost: $99,200
- 2001: 1 building, cost: $101,700
- 1999: 9 buildings, average cost: $73,000
- 1998: 29 buildings, average cost: $113,500
| Here: | 2.4% |
| Missouri: | 2.8% |
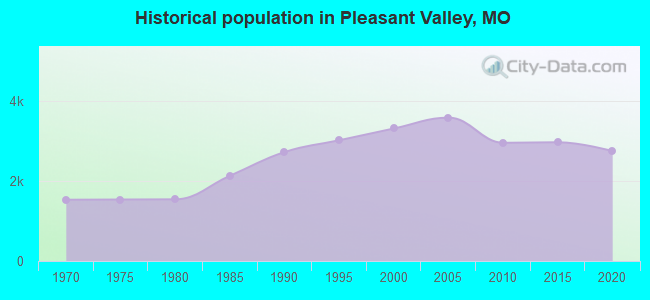
Population change in the 1990s: +576 (+21.0%).
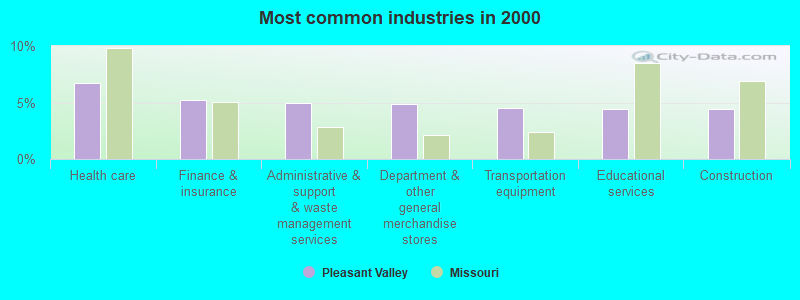
- Health care (6.7%)
- Finance & insurance (5.2%)
- Administrative & support & waste management services (4.9%)
- Department & other general merchandise stores (4.8%)
- Transportation equipment (4.5%)
- Educational services (4.5%)
- Construction (4.4%)
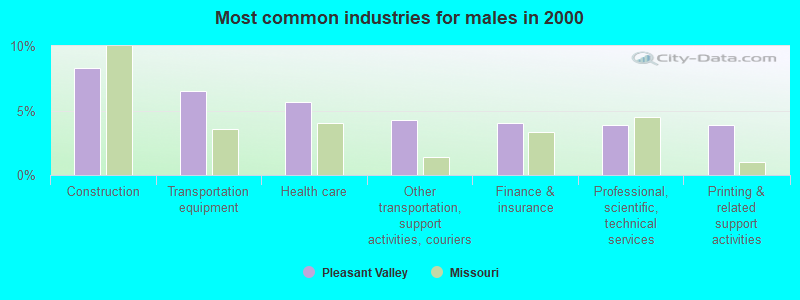
- Construction (8.3%)
- Transportation equipment (6.5%)
- Health care (5.7%)
- Other transportation, support activities, couriers (4.3%)
- Finance & insurance (4.1%)
- Professional, scientific, technical services (3.9%)
- Printing & related support activities (3.9%)
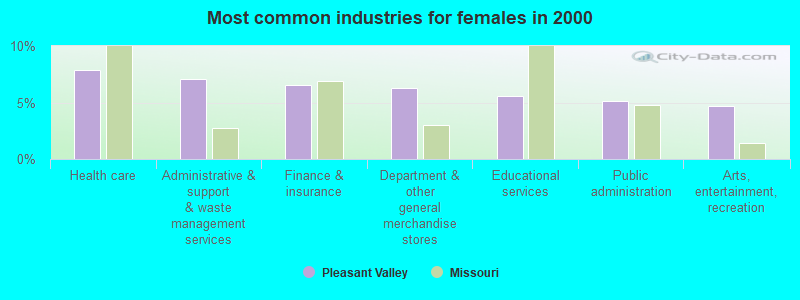
- Health care (7.9%)
- Administrative & support & waste management services (7.1%)
- Finance & insurance (6.5%)
- Department & other general merchandise stores (6.3%)
- Educational services (5.6%)
- Public administration (5.1%)
- Arts, entertainment, recreation (4.7%)
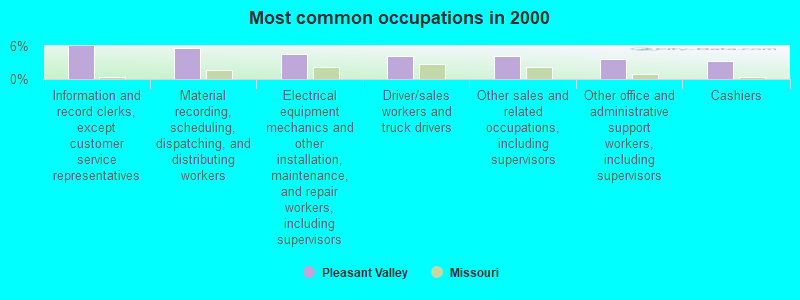
- Information and record clerks, except customer service representatives (5.9%)
- Material recording, scheduling, dispatching, and distributing workers (5.6%)
- Electrical equipment mechanics and other installation, maintenance, and repair workers, including supervisors (4.5%)
- Driver/sales workers and truck drivers (4.2%)
- Other sales and related occupations, including supervisors (4.2%)
- Other office and administrative support workers, including supervisors (3.7%)
- Cashiers (3.3%)
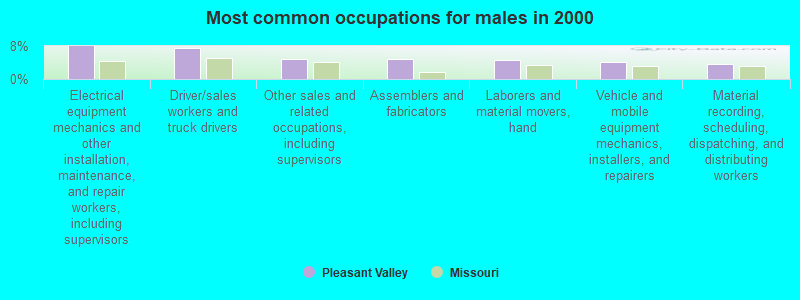
- Electrical equipment mechanics and other installation, maintenance, and repair workers, including supervisors (8.0%)
- Driver/sales workers and truck drivers (7.4%)
- Other sales and related occupations, including supervisors (4.9%)
- Assemblers and fabricators (4.8%)
- Laborers and material movers, hand (4.7%)
- Vehicle and mobile equipment mechanics, installers, and repairers (4.1%)
- Material recording, scheduling, dispatching, and distributing workers (3.7%)
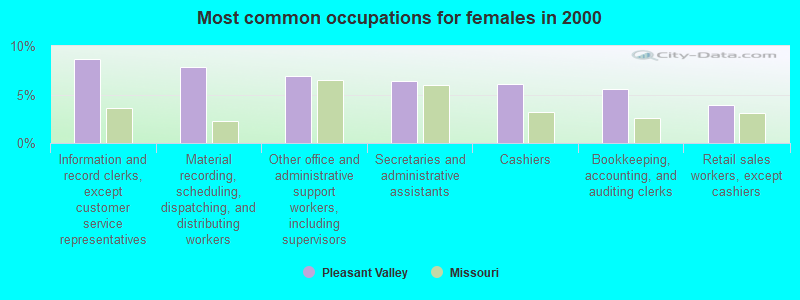
- Information and record clerks, except customer service representatives (8.7%)
- Material recording, scheduling, dispatching, and distributing workers (7.9%)
- Other office and administrative support workers, including supervisors (6.9%)
- Secretaries and administrative assistants (6.4%)
- Cashiers (6.1%)
- Bookkeeping, accounting, and auditing clerks (5.6%)
- Retail sales workers, except cashiers (3.9%)
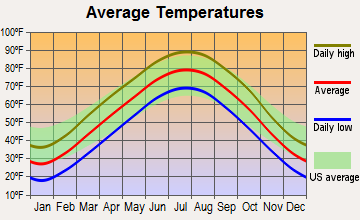
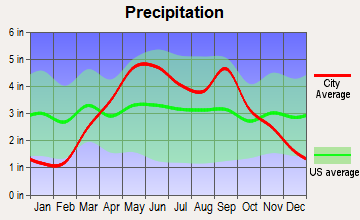
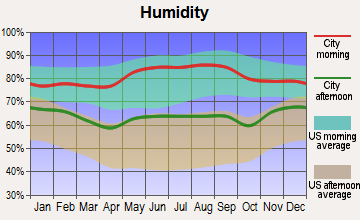
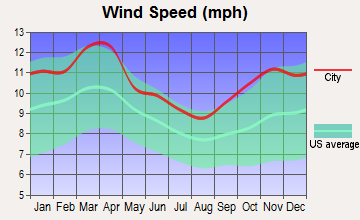
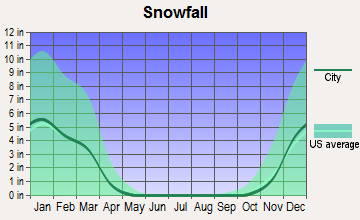
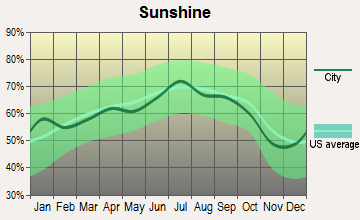
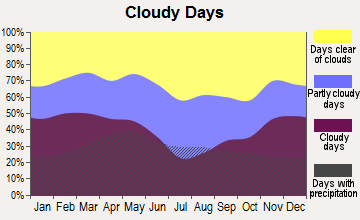
Average climate in Pleasant Valley, Missouri
Based on data reported by over 4,000 weather stations
|
|

(lower is better)
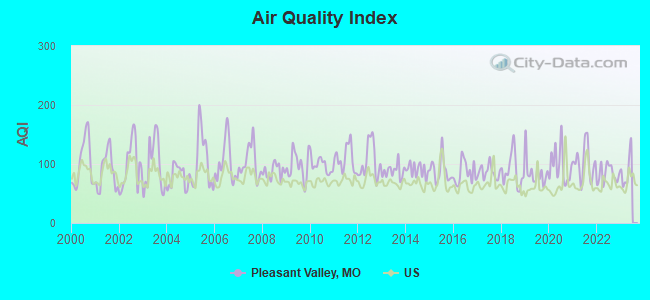
Air Quality Index (AQI) level in 2022 was 82.8. This is about average.
| City: | 82.8 |
| U.S.: | 72.6 |
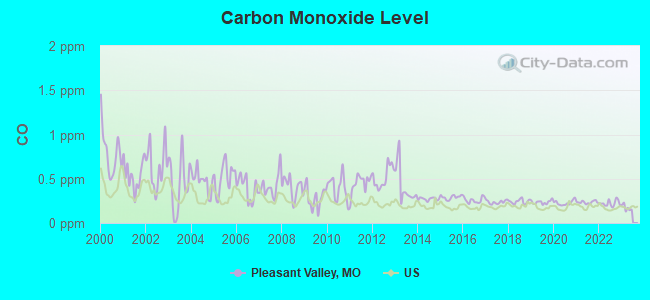
Carbon Monoxide (CO) [ppm] level in 2022 was 0.223. This is about average. Closest monitor was 5.4 miles away from the city center.
| City: | 0.223 |
| U.S.: | 0.251 |
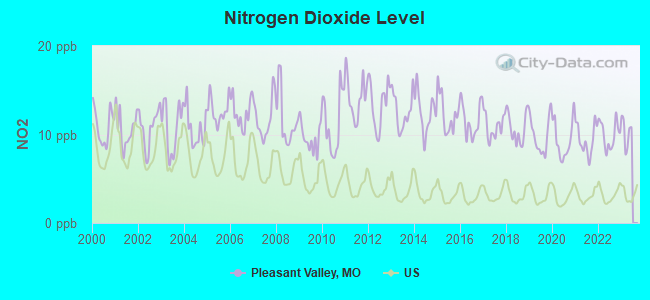
Nitrogen Dioxide (NO2) [ppb] level in 2022 was 9.97. This is significantly worse than average. Closest monitor was 6.5 miles away from the city center.
| City: | 9.97 |
| U.S.: | 5.11 |
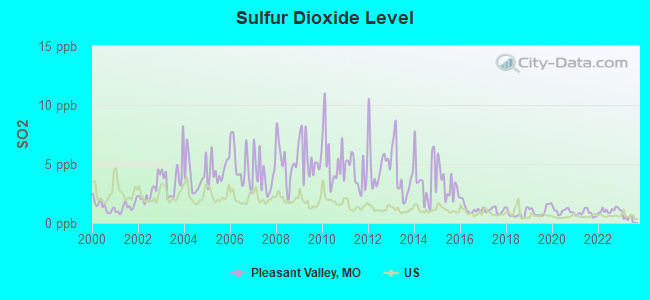
Sulfur Dioxide (SO2) [ppb] level in 2022 was 1.08. This is significantly better than average. Closest monitor was 2.7 miles away from the city center.
| City: | 1.08 |
| U.S.: | 1.51 |
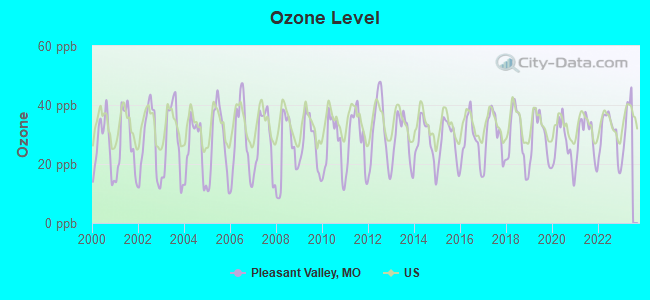
Ozone [ppb] level in 2022 was 30.3. This is about average. Closest monitor was 2.7 miles away from the city center.
| City: | 30.3 |
| U.S.: | 33.3 |
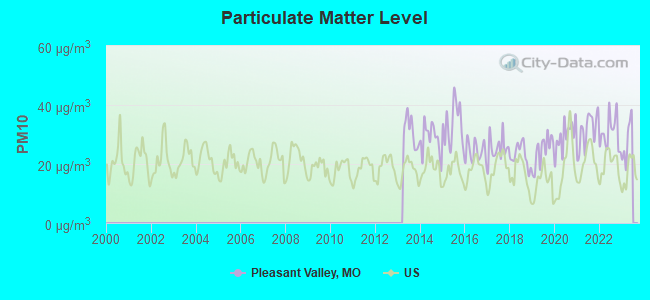
Particulate Matter (PM10) [µg/m3] level in 2022 was 30.5. This is significantly worse than average. Closest monitor was 6.8 miles away from the city center.
| City: | 30.5 |
| U.S.: | 19.2 |
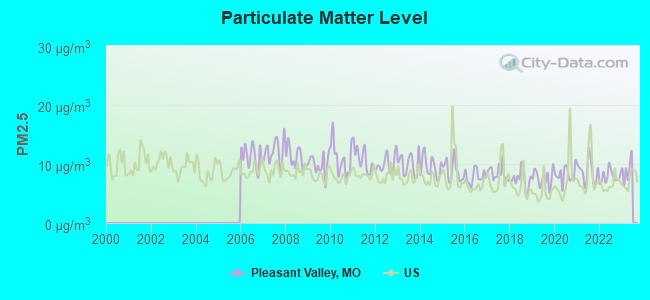
Particulate Matter (PM2.5) [µg/m3] level in 2022 was 7.85. This is about average. Closest monitor was 7.9 miles away from the city center.
| City: | 7.85 |
| U.S.: | 8.11 |
Tornado activity:
Pleasant Valley-area historical tornado activity is slightly above Missouri state average. It is 99% greater than the overall U.S. average.
On 5/20/1957, a category F5 (max. wind speeds 261-318 mph) tornado 17.1 miles away from the Pleasant Valley city center killed 44 people and injured 207 people and caused between $500,000 and $5,000,000 in damages.
On 5/4/2003, a category F4 (max. wind speeds 207-260 mph) tornado 0.7 miles away from the city center injured 13 people and caused $31 million in damages.
Earthquake activity:
Pleasant Valley-area historical earthquake activity is significantly above Missouri state average. It is 481% greater than the overall U.S. average.On 9/3/2016 at 12:02:44, a magnitude 5.8 (5.8 MW, Depth: 3.5 mi, Class: Moderate, Intensity: VI - VII) earthquake occurred 235.2 miles away from Pleasant Valley center
On 11/6/2011 at 03:53:10, a magnitude 5.7 (5.7 MW, Depth: 3.2 mi) earthquake occurred 284.4 miles away from the city center
On 11/12/2014 at 21:40:00, a magnitude 4.9 (4.9 MW, Depth: 2.5 mi, Class: Light, Intensity: IV - V) earthquake occurred 217.5 miles away from the city center
On 11/7/2016 at 01:44:24, a magnitude 5.0 (5.0 MW, Depth: 2.8 mi) earthquake occurred 257.1 miles away from the city center
On 2/13/2016 at 17:07:06, a magnitude 5.1 (5.1 MW, Depth: 5.2 mi) earthquake occurred 298.4 miles away from Pleasant Valley center
On 4/18/2008 at 09:36:59, a magnitude 5.4 (5.1 MB, 4.8 MS, 5.4 MW, 5.2 MW) earthquake occurred 359.0 miles away from the city center
Magnitude types: body-wave magnitude (MB), surface-wave magnitude (MS), moment magnitude (MW)
Natural disasters:
The number of natural disasters in Clay County (24) is greater than the US average (15).Major Disasters (Presidential) Declared: 16
Emergencies Declared: 6
Causes of natural disasters: Floods: 17, Storms: 14, Tornadoes: 7, Winter Storms: 3, Drought: 1, Heavy Rain: 1, Hurricane: 1, Ice Storm: 1, Wind: 1, Other: 1 (Note: some incidents may be assigned to more than one category).
Hospitals and medical centers near Pleasant Valley:
- PLEASANT VALLEY MANOR CARE CENTER (Nursing Home, about 1 miles away; LIBERTY, MO)
- CLAYVIEW HOME HEALTH SERVICES, INC (Home Health Center, about 3 miles away; KANSAS CITY, MO)
- LIBERTY HOSPITAL HOSPICE (Hospital, about 3 miles away; LIBERTY, MO)
- ASHTON COURT CARE AND REHABILITATION CENTRE (Nursing Home, about 3 miles away; LIBERTY, MO)
- REGIONAL HOSPICE II (Hospital, about 3 miles away; LIBERTY, MO)
- WOODBINE HEALTHCARE AND REHABILITATION CENTRE (Nursing Home, about 4 miles away; GLADSTONE, MO)
- LIBERTY TERRACE HEALTHCARE AND REHABILITATION CTR (Nursing Home, about 5 miles away; LIBERTY, MO)
Amtrak stations near Pleasant Valley:
- 10 miles: INDEPENDENCE (600 S. GRAND AVE.) . Services: free short-term parking, call for taxi service.
- 11 miles: KANSAS CITY (2200 MAIN ST.) . Services: ticket office, fully wheelchair accessible, enclosed waiting area, public restrooms, public payphones, snack bar, free short-term parking, paid long-term parking, call for car rental service, taxi stand, public transit connection.
Colleges/universities with over 2000 students nearest to Pleasant Valley:
- Grantham University (about 11 miles; Kansas City, MO; Full-time enrollment: 8,385)
- Park University (about 11 miles; Parkville, MO; FT enrollment: 9,131)
- Metropolitan Community College-Kansas City (about 13 miles; Kansas City, MO; FT enrollment: 12,834)
- University of Missouri-Kansas City (about 14 miles; Kansas City, MO; FT enrollment: 10,544)
- Rockhurst University (about 15 miles; Kansas City, MO; FT enrollment: 2,013)
- Kansas City Kansas Community College (about 17 miles; Kansas City, KS; FT enrollment: 4,718)
- Wright Career College (about 23 miles; Overland Park, KS; FT enrollment: 3,107)
Public school in Pleasant Valley:
- PLEASANT VALLEY EARLY CHILD. (Students: 162, Location: 6800 SOBBIE RD, Grades: PK)
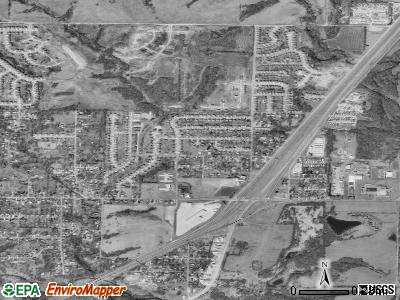
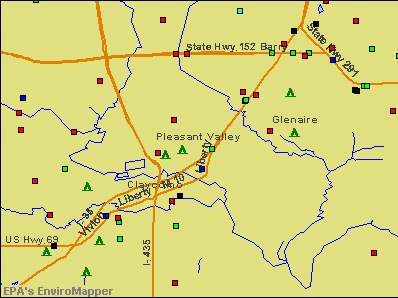
Points of interest:
Notable location: Pleasant Valley Fire Department (A). Display/hide its location on the map
| This city: | 2.4 people |
| Missouri: | 2.5 people |
| This city: | 64.6% |
| Whole state: | 65.3% |
| This city: | 8.5% |
| Whole state: | 6.7% |
Likely homosexual households (counted as self-reported same-sex unmarried-partner households)
- Lesbian couples: 0.6% of all households
- Gay men: 0.3% of all households
89 people in nursing homes in 2000
22 people in schools, hospitals, or wards for the intellectually disabled in 2000
For population 15 years and over in Pleasant Valley:
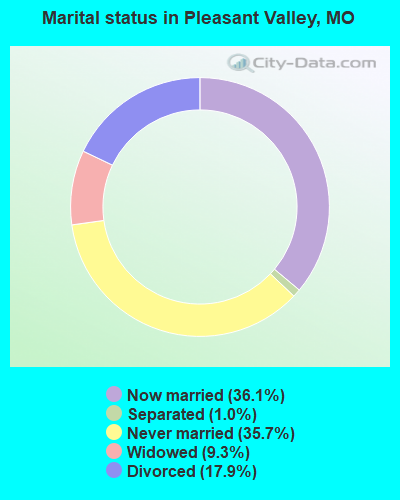
- Never married: 35.7%
- Now married: 36.1%
- Separated: 1.0%
- Widowed: 9.3%
- Divorced: 17.9%
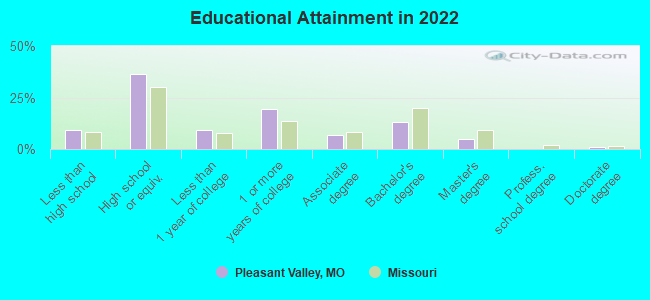
For population 25 years and over in Pleasant Valley:
- High school or higher: 90.7%
- Bachelor's degree or higher: 18.6%
- Graduate or professional degree: 5.7%
- Unemployed: 3.5%
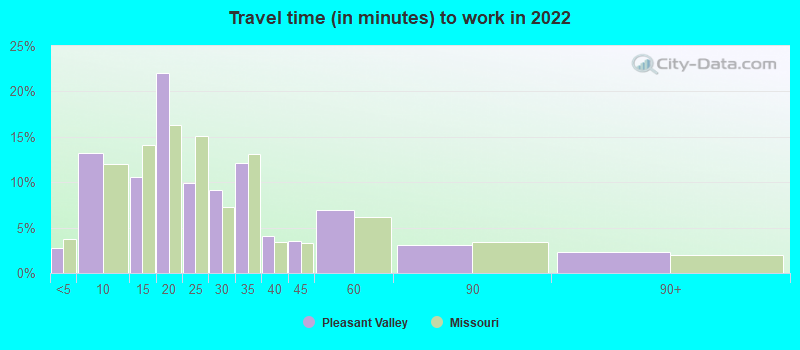
- Mean travel time to work (commute): 18.9 minutes
| Here: | 10.4 |
| Missouri average: | 11.1 |
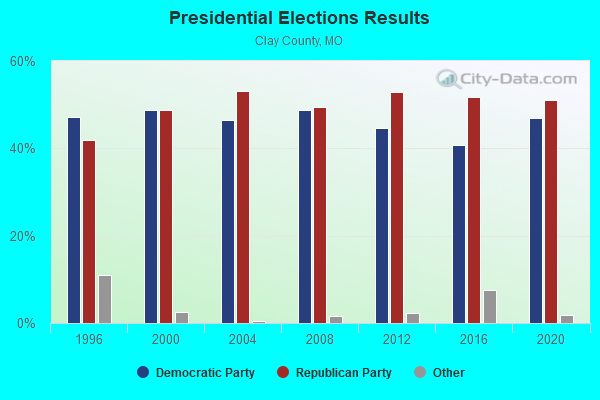
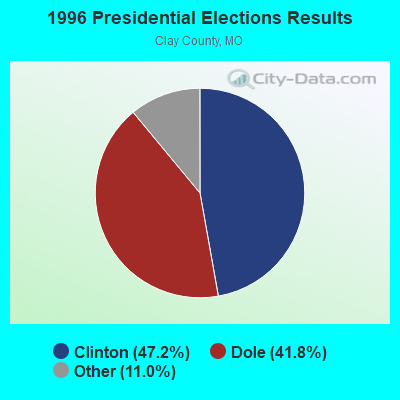
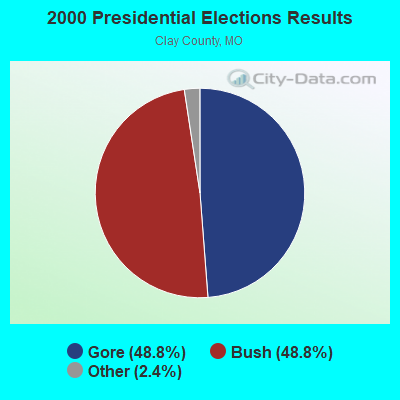
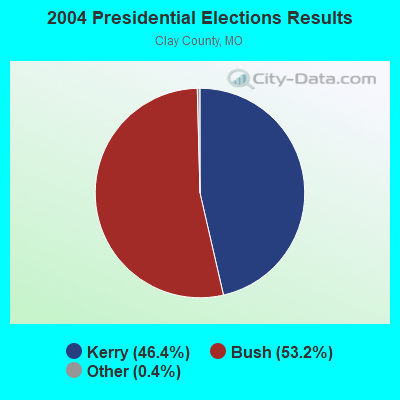
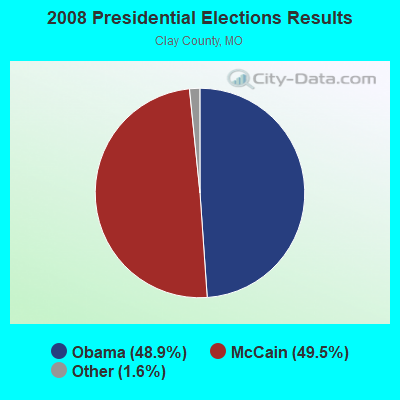
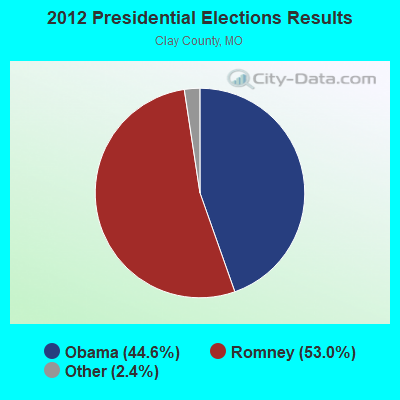
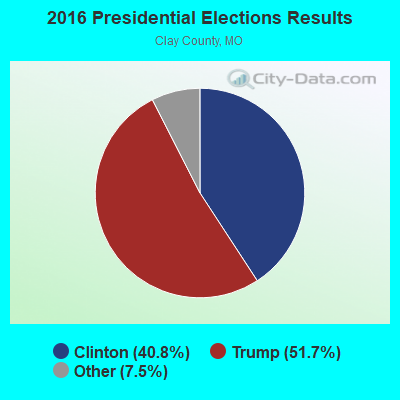
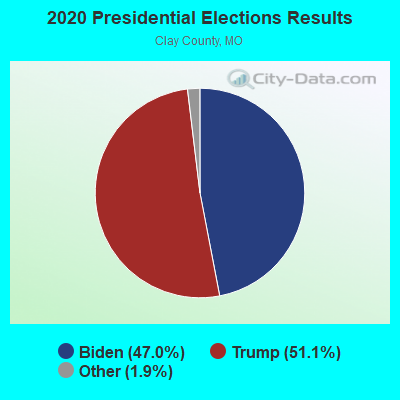
Graphs represent county-level data. Detailed 2008 Election Results
Political contributions by individuals in Pleasant Valley, MO
Religion statistics for Pleasant Valley, MO (based on Clay County data)
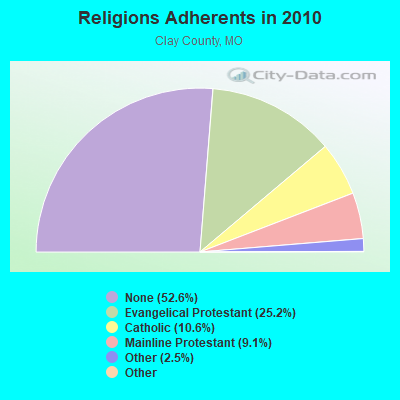
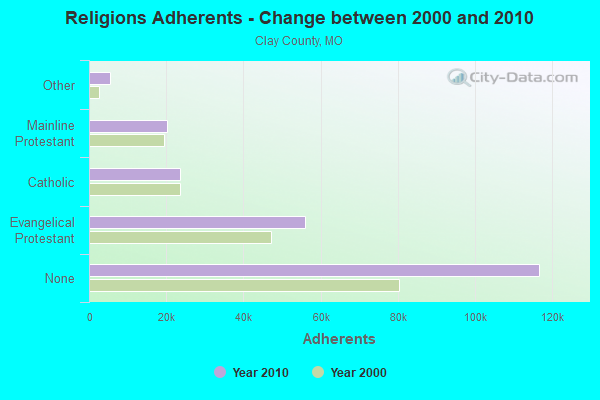
| Religion | Adherents | Congregations |
|---|---|---|
| Evangelical Protestant | 55,953 | 140 |
| Catholic | 23,511 | 9 |
| Mainline Protestant | 20,193 | 41 |
| Other | 5,454 | 23 |
| Black Protestant | 125 | 1 |
| Orthodox | 44 | 1 |
| None | 116,659 | - |
Food Environment Statistics:
| Clay County: | 1.56 / 10,000 pop. |
| Missouri: | 1.88 / 10,000 pop. |
| Clay County: | 0.14 / 10,000 pop. |
| Missouri: | 0.18 / 10,000 pop. |
| Clay County: | 0.28 / 10,000 pop. |
| State: | 0.60 / 10,000 pop. |
| Clay County: | 3.12 / 10,000 pop. |
| Missouri: | 4.34 / 10,000 pop. |
| Clay County: | 6.38 / 10,000 pop. |
| Missouri: | 7.37 / 10,000 pop. |
| Clay County: | 7.9% |
| Missouri: | 8.8% |
| Clay County: | 30.5% |
| State: | 29.6% |
| This county: | 12.2% |
| Missouri: | 13.5% |
Health and Nutrition:
| This city: | 48.5% |
| Missouri: | 50.9% |
| This city: | 45.9% |
| Missouri: | 48.6% |
| Pleasant Valley: | 29.4 |
| Missouri: | 28.7 |
| Pleasant Valley: | 23.5% |
| Missouri: | 20.6% |
| This city: | 12.2% |
| State: | 10.1% |
| Pleasant Valley: | 6.8 |
| State: | 6.8 |
| Here: | 37.2% |
| Missouri: | 34.3% |
| This city: | 56.1% |
| Missouri: | 57.5% |
| Pleasant Valley: | 78.6% |
| Missouri: | 79.3% |
More about Health and Nutrition of Pleasant Valley, MO Residents
| Local government employment and payroll (March 2022) | |||||
| Function | Full-time employees | Monthly full-time payroll | Average yearly full-time wage | Part-time employees | Monthly part-time payroll |
|---|---|---|---|---|---|
| Police Protection - Officers | 6 | $32,723 | $65,446 | 3 | $698 |
| Police - Other | 3 | $11,384 | $45,536 | 5 | $1,806 |
| Other Government Administration | 1 | $5,879 | $70,548 | 11 | $2,901 |
| Financial Administration | 1 | $4,371 | $52,452 | 0 | $0 |
| Judicial and Legal | 1 | $4,933 | $59,196 | 2 | $1,672 |
| Firefighters | 0 | $0 | 33 | $35,192 | |
| Other and Unallocable | 0 | $0 | 3 | $2,052 | |
| Totals for Government | 12 | $59,290 | $59,290 | 57 | $44,321 |
Pleasant Valley government finances - Expenditure in 2021 (per resident):
- Current Operations - Police Protection: $531,000 ($194.72)
Central Staff Services: $306,000 ($112.21)
Local Fire Protection: $220,000 ($80.67)
Regular Highways: $102,000 ($37.40)
Judicial and Legal Services: $93,000 ($34.10)
General Public Buildings: $45,000 ($16.50)
Sewerage: $37,000 ($13.57)
Financial Administration: $15,000 ($5.50)
General - Other: $9,000 ($3.30)
Solid Waste Management: $7,000 ($2.57)
Parks and Recreation: $5,000 ($1.83)
- General - Interest on Debt: $43,000 ($15.77)
- Intergovernmental to Local - Other - Sewerage: $320,000 ($117.35)
Other - Solid Waste Management: $3,000 ($1.10)
Other - Correctional Institutions: $1,000 ($0.37)
- Intergovernmental to State - Health - Other: $1,000 ($0.37)
Natural Resources - Other: $1,000 ($0.37)
- Other Capital Outlay - Local Fire Protection: $114,000 ($41.80)
General - Other: $85,000 ($31.17)
- Total Salaries and Wages: $631,000 ($231.39)
Pleasant Valley government finances - Revenue in 2021 (per resident):
- Charges - Sewerage: $486,000 ($178.22)
Hospital Public: $60,000 ($22.00)
Parks and Recreation: $1,000 ($0.37)
- Federal Intergovernmental - Public Welfare: $10,000 ($3.67)
- Local Intergovernmental - Other: $61,000 ($22.37)
Highways: $9,000 ($3.30)
- Miscellaneous - Fines and Forfeits: $100,000 ($36.67)
Rents: $9,000 ($3.30)
Interest Earnings: $8,000 ($2.93)
General Revenue - Other: $2,000 ($0.73)
- State Intergovernmental - Highways: $39,000 ($14.30)
Health and Hospitals: $11,000 ($4.03)
- Tax - General Sales and Gross Receipts: $737,000 ($270.26)
Public Utilities Sales: $86,000 ($31.54)
Property: $46,000 ($16.87)
Occupation and Business License - Other: $2,000 ($0.73)
Pleasant Valley government finances - Debt in 2021 (per resident):
- Long Term Debt - Beginning Outstanding - Unspecified Public Purpose: $1,071,000 ($392.74)
Outstanding Unspecified Public Purpose: $956,000 ($350.57)
Retired Unspecified Public Purpose: $115,000 ($42.17)
Pleasant Valley government finances - Cash and Securities in 2021 (per resident):
- Other Funds - Cash and Securities: $2,848,000 ($1044.37)
8.80% of this county's 2021 resident taxpayers lived in other counties in 2020 ($56,910 average adjusted gross income)
| Here: | 8.80% |
| Missouri average: | 7.67% |
0.02% of residents moved from foreign countries ($156 average AGI)
Clay County: 0.02% Missouri average: 0.02%
Top counties from which taxpayers relocated into this county between 2020 and 2021:
| from Jackson County, MO | |
| from Platte County, MO | |
| from Johnson County, KS |
Businesses in Pleasant Valley, MO
- FedEx: 1
Strongest AM radio stations in Pleasant Valley:
- KKHK (1250 AM; 25 kW; KANSAS CITY, KS)
- WHB (810 AM; 50 kW; KANSAS CITY, MO; Owner: UNION BROADCASTING, INC.)
- KCMO (710 AM; 10 kW; KANSAS CITY, MO; Owner: SUSQUEHANNA KANSAS CITY PARTNERSHIP)
- KGGN (890 AM; daytime; 1 kW; GLADSTONE, MO; Owner: MORTENSON BROADCASTING COMPANY, INC.)
- KCTE (1510 AM; daytime; 10 kW; INDEPENDENCE, MO; Owner: UNION BROADCASTING, INC.)
- KCCV (760 AM; daytime; 6 kW; OVERLAND PARK, KS; Owner: BOTT BROADCASTING COMPANY)
- KPHN (1190 AM; 5 kW; KANSAS CITY, MO; Owner: ABC, INC.)
- KXTR (1660 AM; 10 kW; KANSAS CITY, KS; Owner: ENTERCOM KANSAS CITY LICENSE, LLC)
- KMBZ (980 AM; 5 kW; KANSAS CITY, MO; Owner: ENTERCOM KANSAS CITY LICENSE, LLC)
- KCSP (610 AM; 5 kW; KANSAS CITY, MO; Owner: ENTERCOM KANSAS CITY LICENSE, LLC)
- KCXL (1140 AM; 0 kW; LIBERTY, MO; Owner: ALPINE BROADCASTING CORPORATION)
- KCNW (1380 AM; 2 kW; FAIRWAY, KS; Owner: KANSAS CITY RADIO, INC.)
- KKLO (1410 AM; 5 kW; LEAVENWORTH, KS; Owner: CHARA COMMUNICATIONS, INC.)
Strongest FM radio stations in Pleasant Valley:
- KSRC (102.1 FM; KANSAS CITY, MO; Owner: INFINITY RADIO OPERATIONS INC.)
- WDAF-FM (106.5 FM; LIBERTY, MO; Owner: ENTERCOM KANSAS CITY LICENSE, LLC)
- KUDL (98.1 FM; KANSAS CITY, KS; Owner: ENTERCOM KANSAS CITY LICENSE, LLC)
- KBEQ-FM (104.3 FM; KANSAS CITY, MO; Owner: INFINITY RADIO SUBSIDIARY OPERATIONS INC.)
- KZPL (97.3 FM; LEE'S SUMMIT, MO; Owner: UNION FIRST BROADCASTING, LLC)
- KCMO-FM (94.9 FM; KANSAS CITY, MO; Owner: SUSQUEHANNA KANSAS CITY PARTNERSHIP)
- KCUR-FM (89.3 FM; KANSAS CITY, MO; Owner: CURATORS OF UNIVERSITY OF MISSOURI)
- KLJC (88.5 FM; KANSAS CITY, MO; Owner: CALVARY BIBLE COLLEGE)
- KQRC-FM (98.9 FM; LEAVENWORTH, KS; Owner: ENTERCOM KANSAS CITY LICENSE, LLC)
- KRBZ (96.5 FM; KANSAS CITY, MO; Owner: ENTERCOM KANSAS CITY LICENSE, LLC)
- KYYS (99.7 FM; KANSAS CITY, MO; Owner: ENTERCOM KANSAS CITY LICENSE, LLC)
- KFKF-FM (94.1 FM; KANSAS CITY, KS; Owner: INFINITY RADIO SUBSIDIARY OPERATIONS INC.)
- KMXV (93.3 FM; KANSAS CITY, MO; Owner: INFINITY RADIO OPERATIONS INC.)
- KPRS (103.3 FM; KANSAS CITY, MO; Owner: CARTER BROADCAST GROUP, INC.)
- KWJC (91.9 FM; LIBERTY, MO; Owner: WILLIAM JEWELL COLLEGE)
- KKFI (90.1 FM; KANSAS CITY, MO; Owner: MID-COAST RADIO PROJECT, INC.)
- KMJK (107.3 FM; LEXINGTON, MO; Owner: ALLUR-KANSAS CITY, INC.)
- KCFX (101.1 FM; HARRISONVILLE, MO; Owner: SUSQUEHANNA KANSAS CITY PARTNERSHIP)
- KCCV-FM (92.3 FM; OLATHE, KS; Owner: BOTT BROADCASTING COMPANY)
- KAYX (92.5 FM; RICHMOND, MO; Owner: BOTT COMMUNICATIONS, INC.)
TV broadcast stations around Pleasant Valley:
- KMBC-TV (Channel 9; KANSAS CITY, MO; Owner: KMBC HEARST-ARGYLE TELEVISION, INC.)
- KCPT (Channel 19; KANSAS CITY, MO; Owner: PUBLIC TELEVISION 19, INC.)
- KSMO-TV (Channel 62; KANSAS CITY, MO; Owner: KSMO LICENSEE, INC.)
- KCWE (Channel 29; KANSAS CITY, MO; Owner: KCWE-TV, INC.)
- KCTV (Channel 5; KANSAS CITY, MO; Owner: MEREDITH CORPORATION)
- K48FS (Channel 48; KANSAS CITY, MO; Owner: WORD OF GOD FELLOWSHIP, INC.)
- KSHB-TV (Channel 41; KANSAS CITY, MO; Owner: SCRIPPS HOWARD BROADCASTING COMPANY)
- WDAF-TV (Channel 4; KANSAS CITY, MO; Owner: WDAF LICENSE, INC.)
- KPXE (Channel 50; KANSAS CITY, MO; Owner: PAXSON KANSAS CITY LICENSE, INC.)
- KMCI (Channel 38; LAWRENCE, KS; Owner: SCRIPPS HOWARD BROADCASTING COMPANY)
- K35CT (Channel 35; KANSAS CITY, MO; Owner: WORD OF GOD FELLOWSHIP, INC.)
- K26CR (Channel 26; KANSAS CITY, MO; Owner: VENTANA TELEVISION, INC.)
- KTAJ (Channel 16; ST. JOSEPH, MO; Owner: TRINITY BROADCASTING NETWORK)
- National Bridge Inventory (NBI) Statistics
- 47Number of bridges
- 509ft / 155mTotal length
- 793,015Total average daily traffic
- 125,887Total average daily truck traffic
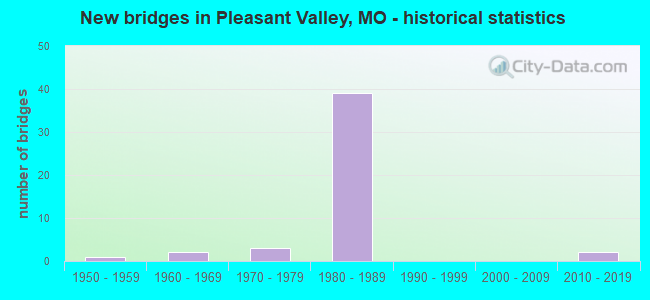
- New bridges - historical statistics
- 11950-1959
- 21960-1969
- 31970-1979
- 391980-1989
- 22010-2019
FCC Registered Antenna Towers:
10 (See the full list of FCC Registered Antenna Towers in Pleasant Valley)FCC Registered Broadcast Land Mobile Towers:
5- 6801 Sobbie Rd (Lat: 39.200000 Lon: -94.479111), Type: Tower, Structure height: 46 m, Call Sign: KNIR645,
Assigned Frequencies: 154.980 MHz, Grant Date: 12/27/2013, Expiration Date: 02/07/2024, Registrant: Commenco, Inc, 4901 Bristol Ave, Kansas City, MO 64129, Phone: (816) 753-2166, Fax: (816) 753-3688, Email:
- 601 Sobbie Rd (Lat: 39.216667 Lon: -94.479111), Call Sign: KTT889,
Assigned Frequencies: 155.730 MHz, Grant Date: 12/23/2021, Expiration Date: 12/29/2031, Registrant: Commenco, Inc., 4901 Bristol Avenue, Kansas City, MO 64129, Phone: (816) 753-2166, Fax: (816) 753-3688, Email:
- 6801 Sobbie Road (Lat: 39.216667 Lon: -94.479111), Type: Tower, Structure height: 46 m, Call Sign: WPXS599,
Assigned Frequencies: 151.460 MHz, Grant Date: 03/16/2013, Expiration Date: 06/03/2023, Cancellation Date: 08/05/2023, Certifier: Donald Mansell, Registrant: Commenco, Inc., 4901 Bristol Avenue, Kansas City, MO 64129, Phone: (816) 753-2166, Fax: (816) 753-3688, Email:
- Lat: 39.216306 Lon: -94.472472, Call Sign: WQLH748,
Assigned Frequencies: 451.237 MHz, 451.312 MHz, 451.387 MHz, 452.062 MHz, 452.162 MHz, Grant Date: 01/25/2010, Expiration Date: 01/25/2020, Cancellation Date: 03/28/2020, Certifier: Kevin White, Registrant: Washington Radio Reports, 4901 Bristol Avenue, Gettysburg, PA 17325, Phone: (717) 334-0668, Fax: (717) 334-6440, Email:
- Lat: 39.216333 Lon: -94.479611, Call Sign: WRMQ948,
Assigned Frequencies: 769.006 MHz, 769.006 MHz, 799.006 MHz, Grant Date: 05/19/2021, Expiration Date: 05/19/2031, Certifier: Gordon Abraham, Registrant: Apco International, Inc, 351 N Williamson Blvd, Daytona Beach, FL 32114, Phone: (386) 944-2469, Email:
FCC Registered Microwave Towers:
2- PLEAS VLY FD, 6801 Sobbie Rd (Lat: 39.216806 Lon: -94.479139), Type: Mtower, Structure height: 22 m, Overall height: 24 m, Call Sign: WQVF427,
Assigned Frequencies: 10775.0 MHz, 21275.0 MHz, Grant Date: 01/26/2015, Expiration Date: 01/26/2025, Certifier: Nikki Thomas, Registrant: Commenco Inc., 4901 Bristol Ave, Kansas City, MO 64129, Phone: (816) 753-2166
- PLEAS VLY PD, 6502 Royal St (Lat: 39.212389 Lon: -94.481889), Type: Bant, Structure height: 10 m, Overall height: 12 m, Call Sign: WQVF428,
Assigned Frequencies: 17900.0 MHz, 22475.0 MHz, 11265.0 MHz, Grant Date: 01/26/2015, Expiration Date: 01/26/2025, Certifier: Nikki Thomas, Registrant: Commenco Inc., 4901 Bristol Ave, Kansas City, MO 64129, Phone: (816) 753-2166, Email:
FCC Registered Amateur Radio Licenses:
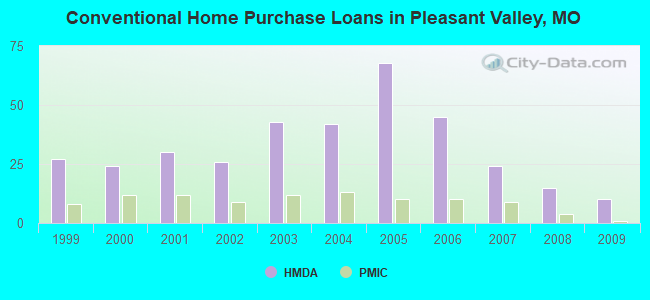
11 (See the full list of FCC Registered Amateur Radio Licenses in Pleasant Valley)| Home Mortgage Disclosure Act Aggregated Statistics For Year 2009 (Based on 1 partial tract) | ||||||||||||
| A) FHA, FSA/RHS & VA Home Purchase Loans | B) Conventional Home Purchase Loans | C) Refinancings | D) Home Improvement Loans | F) Non-occupant Loans on < 5 Family Dwellings (A B C & D) | G) Loans On Manufactured Home Dwelling (A B C & D) | |||||||
|---|---|---|---|---|---|---|---|---|---|---|---|---|
| Number | Average Value | Number | Average Value | Number | Average Value | Number | Average Value | Number | Average Value | Number | Average Value | |
| LOANS ORIGINATED | 13 | $118,184 | 10 | $76,763 | 53 | $125,011 | 1 | $99,590 | 6 | $101,643 | 1 | $43,270 |
| APPLICATIONS APPROVED, NOT ACCEPTED | 1 | $85,420 | 3 | $76,713 | 4 | $156,008 | 0 | $0 | 0 | $0 | 1 | $34,690 |
| APPLICATIONS DENIED | 3 | $122,717 | 1 | $59,680 | 18 | $129,970 | 3 | $22,877 | 1 | $115,630 | 1 | $1,490 |
| APPLICATIONS WITHDRAWN | 1 | $158,530 | 1 | $45,510 | 10 | $177,212 | 1 | $18,650 | 0 | $0 | 0 | $0 |
| FILES CLOSED FOR INCOMPLETENESS | 0 | $0 | 0 | $0 | 1 | $120,110 | 0 | $0 | 0 | $0 | 0 | $0 |
Detailed HMDA statistics for the following Tracts: 0208.01
| Private Mortgage Insurance Companies Aggregated Statistics For Year 2009 (Based on 1 partial tract) | ||||
| A) Conventional Home Purchase Loans | B) Refinancings | |||
|---|---|---|---|---|
| Number | Average Value | Number | Average Value | |
| LOANS ORIGINATED | 1 | $211,860 | 3 | $156,537 |
| APPLICATIONS APPROVED, NOT ACCEPTED | 0 | $0 | 0 | $0 |
| APPLICATIONS DENIED | 1 | $73,110 | 1 | $202,910 |
| APPLICATIONS WITHDRAWN | 0 | $0 | 0 | $0 |
| FILES CLOSED FOR INCOMPLETENESS | 0 | $0 | 0 | $0 |
Detailed PMIC statistics for the following Tracts: 0208.01
2004 - 2018 National Fire Incident Reporting System (NFIRS) incidents
- Fire incident types reported to NFIRS in Pleasant Valley, MO
- 8740.7%Outside Fires
- 6028.0%Mobile Property/Vehicle Fires
- 4722.0%Structure Fires
- 209.3%Other
 Based on the data from the years 2004 - 2018 the average number of fires per year is 14. The highest number of reported fires - 32 took place in 2006, and the least - 3 in 2013. The data has a declining trend.
 When looking into fire subcategories, the most incidents belonged to: Outside Fires (40.7%), and Mobile Property/Vehicle Fires (28.0%).
- 88.8%Utility gas
- 10.4%Electricity
- 0.8%Bottled, tank, or LP gas
- 84.3%Utility gas
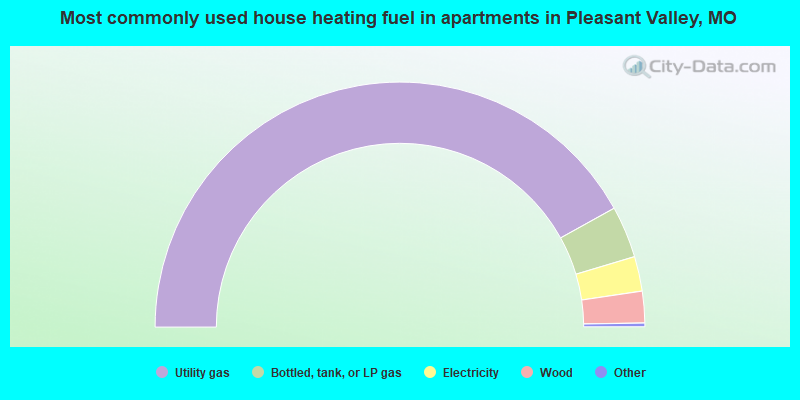
- 6.9%Bottled, tank, or LP gas
- 4.6%Electricity
- 4.2%Wood
Pleasant Valley compared to Missouri state average:
- Unemployed percentage significantly below state average.
- Black race population percentage significantly below state average.
- Median age above state average.
- Foreign-born population percentage significantly below state average.
- Length of stay since moving in significantly above state average.
- Institutionalized population percentage above state average.
Pleasant Valley on our top lists:
- #7 on the list of "Top 101 cities with the most residents born in Oceania, n.e.c. (population 500+)"
- #8 on the list of "Top 101 cities with the most residents born in Oceania (population 500+)"
- #84 on the list of "Top 101 cities with the largest percentage of people in schools, hospitals, or wards for the mentally retarded (population 1,000+)"
- #19 on the list of "Top 101 counties with the lowest percentage of residents relocating from foreign countries between 2010 and 2011"
- #41 on the list of "Top 101 counties with the highest surface withdrawal of fresh water for public supply"
- #48 on the list of "Top 101 counties with the highest total withdrawal of fresh water for public supply"
- #60 on the list of "Top 101 counties with the highest Ozone (1-hour) air pollution readings in 2012 (ppm)"
- #91 on the list of "Top 101 counties with the highest ground withdrawal of fresh water for public supply (pop. 50,000+)"

|
Total of 6 patent applications in 2008-2024.