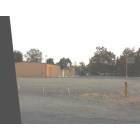
Rio Linda, California Submit your own pictures of this place and show them to the world
OSM Map
General Map
Google Map
MSN Map
OSM Map
General Map
Google Map
MSN Map
OSM Map
General Map
Google Map
MSN Map
OSM Map
General Map
Google Map
MSN Map
Please wait while loading the map...
Population in 2010: 15,106. Population change since 2000: +44.3%Males: 7,178 Females: 7,928
March 2022 cost of living index in Rio Linda: 101.9 (near average, U.S. average is 100) Percentage of residents living in poverty in 2022: 13.3%for White Non-Hispanic residents , 16.4% for Black residents , 21.3% for Hispanic or Latino residents , 21.2% for American Indian residents , 24.2% for Native Hawaiian and other Pacific Islander residents , 22.7% for other race residents , 9.7% for two or more races residents )
Profiles of local businesses
Business Search - 14 Million verified businesses
Data:
Median household income ($)
Median household income (% change since 2000)
Household income diversity
Ratio of average income to average house value (%)
Ratio of average income to average rent
Median household income ($) - White
Median household income ($) - Black or African American
Median household income ($) - Asian
Median household income ($) - Hispanic or Latino
Median household income ($) - American Indian and Alaska Native
Median household income ($) - Multirace
Median household income ($) - Other Race
Median household income for houses/condos with a mortgage ($)
Median household income for apartments without a mortgage ($)
Races - White alone (%)
Races - White alone (% change since 2000)
Races - Black alone (%)
Races - Black alone (% change since 2000)
Races - American Indian alone (%)
Races - American Indian alone (% change since 2000)
Races - Asian alone (%)
Races - Asian alone (% change since 2000)
Races - Hispanic (%)
Races - Hispanic (% change since 2000)
Races - Native Hawaiian and Other Pacific Islander alone (%)
Races - Native Hawaiian and Other Pacific Islander alone (% change since 2000)
Races - Two or more races (%)
Races - Two or more races (% change since 2000)
Races - Other race alone (%)
Races - Other race alone (% change since 2000)
Racial diversity
Unemployment (%)
Unemployment (% change since 2000)
Unemployment (%) - White
Unemployment (%) - Black or African American
Unemployment (%) - Asian
Unemployment (%) - Hispanic or Latino
Unemployment (%) - American Indian and Alaska Native
Unemployment (%) - Multirace
Unemployment (%) - Other Race
Population density (people per square mile)
Population - Males (%)
Population - Females (%)
Population - Males (%) - White
Population - Males (%) - Black or African American
Population - Males (%) - Asian
Population - Males (%) - Hispanic or Latino
Population - Males (%) - American Indian and Alaska Native
Population - Males (%) - Multirace
Population - Males (%) - Other Race
Population - Females (%) - White
Population - Females (%) - Black or African American
Population - Females (%) - Asian
Population - Females (%) - Hispanic or Latino
Population - Females (%) - American Indian and Alaska Native
Population - Females (%) - Multirace
Population - Females (%) - Other Race
Coronavirus confirmed cases (Apr 27, 2024)
Deaths caused by coronavirus (Apr 27, 2024)
Coronavirus confirmed cases (per 100k population) (Apr 27, 2024)
Deaths caused by coronavirus (per 100k population) (Apr 27, 2024)
Daily increase in number of cases (Apr 27, 2024)
Weekly increase in number of cases (Apr 27, 2024)
Cases doubled (in days) (Apr 27, 2024)
Hospitalized patients (Apr 18, 2022)
Negative test results (Apr 18, 2022)
Total test results (Apr 18, 2022)
COVID Vaccine doses distributed (per 100k population) (Sep 19, 2023)
COVID Vaccine doses administered (per 100k population) (Sep 19, 2023)
COVID Vaccine doses distributed (Sep 19, 2023)
COVID Vaccine doses administered (Sep 19, 2023)
Likely homosexual households (%)
Likely homosexual households (% change since 2000)
Likely homosexual households - Lesbian couples (%)
Likely homosexual households - Lesbian couples (% change since 2000)
Likely homosexual households - Gay men (%)
Likely homosexual households - Gay men (% change since 2000)
Cost of living index
Median gross rent ($)
Median contract rent ($)
Median monthly housing costs ($)
Median house or condo value ($)
Median house or condo value ($ change since 2000)
Mean house or condo value by units in structure - 1, detached ($)
Mean house or condo value by units in structure - 1, attached ($)
Mean house or condo value by units in structure - 2 ($)
Mean house or condo value by units in structure by units in structure - 3 or 4 ($)
Mean house or condo value by units in structure - 5 or more ($)
Mean house or condo value by units in structure - Boat, RV, van, etc. ($)
Mean house or condo value by units in structure - Mobile home ($)
Median house or condo value ($) - White
Median house or condo value ($) - Black or African American
Median house or condo value ($) - Asian
Median house or condo value ($) - Hispanic or Latino
Median house or condo value ($) - American Indian and Alaska Native
Median house or condo value ($) - Multirace
Median house or condo value ($) - Other Race
Median resident age
Resident age diversity
Median resident age - Males
Median resident age - Females
Median resident age - White
Median resident age - Black or African American
Median resident age - Asian
Median resident age - Hispanic or Latino
Median resident age - American Indian and Alaska Native
Median resident age - Multirace
Median resident age - Other Race
Median resident age - Males - White
Median resident age - Males - Black or African American
Median resident age - Males - Asian
Median resident age - Males - Hispanic or Latino
Median resident age - Males - American Indian and Alaska Native
Median resident age - Males - Multirace
Median resident age - Males - Other Race
Median resident age - Females - White
Median resident age - Females - Black or African American
Median resident age - Females - Asian
Median resident age - Females - Hispanic or Latino
Median resident age - Females - American Indian and Alaska Native
Median resident age - Females - Multirace
Median resident age - Females - Other Race
Commute - mean travel time to work (minutes)
Travel time to work - Less than 5 minutes (%)
Travel time to work - Less than 5 minutes (% change since 2000)
Travel time to work - 5 to 9 minutes (%)
Travel time to work - 5 to 9 minutes (% change since 2000)
Travel time to work - 10 to 19 minutes (%)
Travel time to work - 10 to 19 minutes (% change since 2000)
Travel time to work - 20 to 29 minutes (%)
Travel time to work - 20 to 29 minutes (% change since 2000)
Travel time to work - 30 to 39 minutes (%)
Travel time to work - 30 to 39 minutes (% change since 2000)
Travel time to work - 40 to 59 minutes (%)
Travel time to work - 40 to 59 minutes (% change since 2000)
Travel time to work - 60 to 89 minutes (%)
Travel time to work - 60 to 89 minutes (% change since 2000)
Travel time to work - 90 or more minutes (%)
Travel time to work - 90 or more minutes (% change since 2000)
Marital status - Never married (%)
Marital status - Now married (%)
Marital status - Separated (%)
Marital status - Widowed (%)
Marital status - Divorced (%)
Median family income ($)
Median family income (% change since 2000)
Median non-family income ($)
Median non-family income (% change since 2000)
Median per capita income ($)
Median per capita income (% change since 2000)
Median family income ($) - White
Median family income ($) - Black or African American
Median family income ($) - Asian
Median family income ($) - Hispanic or Latino
Median family income ($) - American Indian and Alaska Native
Median family income ($) - Multirace
Median family income ($) - Other Race
Median year house/condo built
Median year apartment built
Year house built - Built 2005 or later (%)
Year house built - Built 2000 to 2004 (%)
Year house built - Built 1990 to 1999 (%)
Year house built - Built 1980 to 1989 (%)
Year house built - Built 1970 to 1979 (%)
Year house built - Built 1960 to 1969 (%)
Year house built - Built 1950 to 1959 (%)
Year house built - Built 1940 to 1949 (%)
Year house built - Built 1939 or earlier (%)
Average household size
Household density (households per square mile)
Average household size - White
Average household size - Black or African American
Average household size - Asian
Average household size - Hispanic or Latino
Average household size - American Indian and Alaska Native
Average household size - Multirace
Average household size - Other Race
Occupied housing units (%)
Vacant housing units (%)
Owner occupied housing units (%)
Renter occupied housing units (%)
Vacancy status - For rent (%)
Vacancy status - For sale only (%)
Vacancy status - Rented or sold, not occupied (%)
Vacancy status - For seasonal, recreational, or occasional use (%)
Vacancy status - For migrant workers (%)
Vacancy status - Other vacant (%)
Residents with income below the poverty level (%)
Residents with income below 50% of the poverty level (%)
Children below poverty level (%)
Poor families by family type - Married-couple family (%)
Poor families by family type - Male, no wife present (%)
Poor families by family type - Female, no husband present (%)
Poverty status for native-born residents (%)
Poverty status for foreign-born residents (%)
Poverty among high school graduates not in families (%)
Poverty among people who did not graduate high school not in families (%)
Residents with income below the poverty level (%) - White
Residents with income below the poverty level (%) - Black or African American
Residents with income below the poverty level (%) - Asian
Residents with income below the poverty level (%) - Hispanic or Latino
Residents with income below the poverty level (%) - American Indian and Alaska Native
Residents with income below the poverty level (%) - Multirace
Residents with income below the poverty level (%) - Other Race
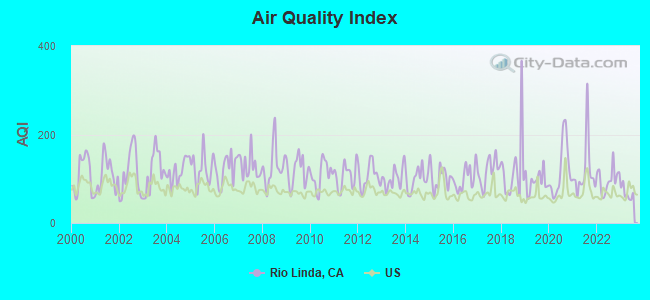
Air pollution - Air Quality Index (AQI)
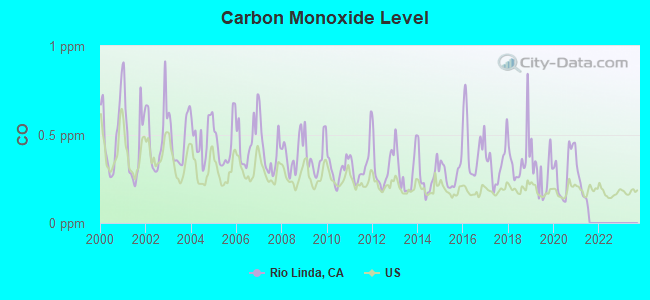
Air pollution - CO
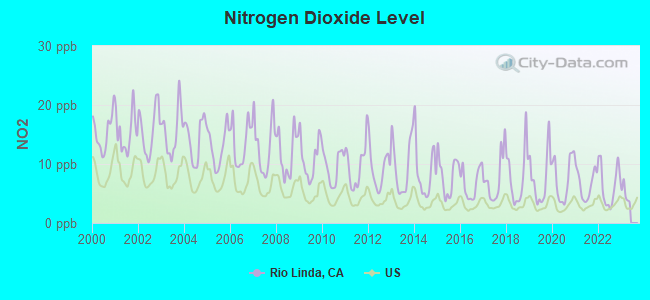
Air pollution - NO2
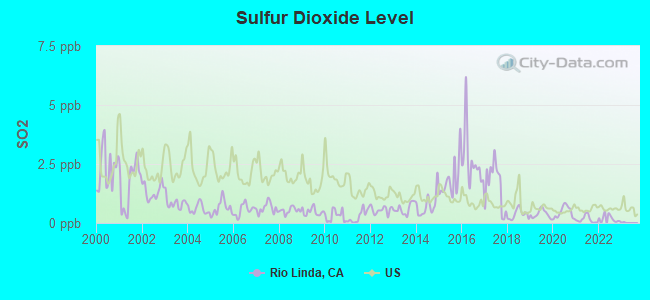
Air pollution - SO2
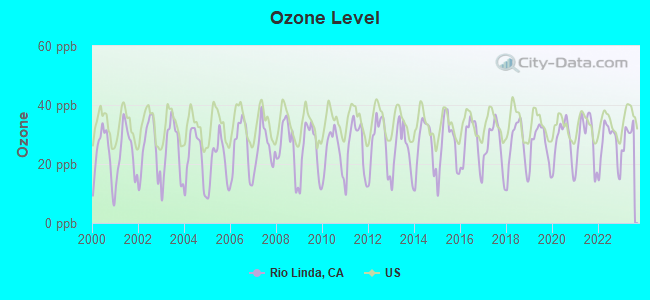
Air pollution - Ozone
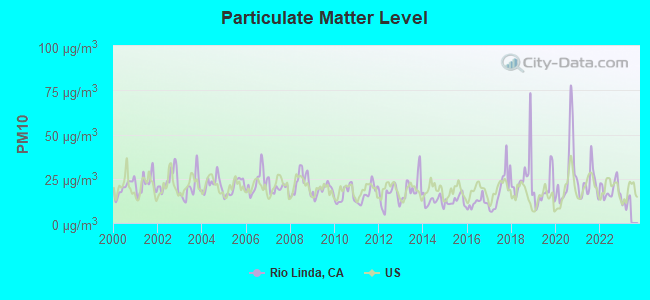
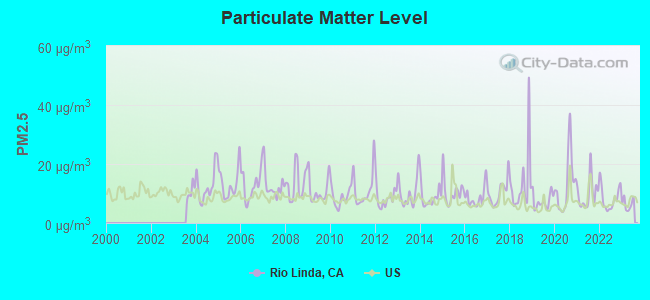
Air pollution - PM10
Air pollution - PM25
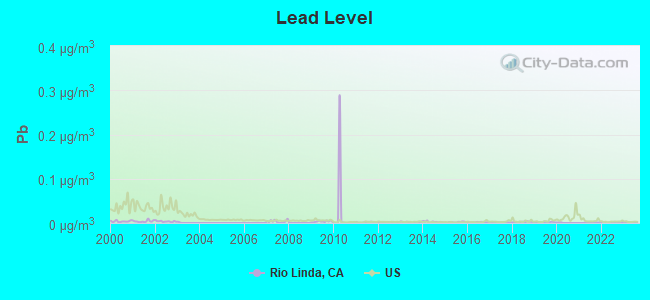
Air pollution - Pb
Crime - Murders per 100,000 population
Crime - Rapes per 100,000 population
Crime - Robberies per 100,000 population
Crime - Assaults per 100,000 population
Crime - Burglaries per 100,000 population
Crime - Thefts per 100,000 population
Crime - Auto thefts per 100,000 population
Crime - Arson per 100,000 population
Crime - City-data.com crime index
Crime - Violent crime index
Crime - Property crime index
Crime - Murders per 100,000 population (5 year average)
Crime - Rapes per 100,000 population (5 year average)
Crime - Robberies per 100,000 population (5 year average)
Crime - Assaults per 100,000 population (5 year average)
Crime - Burglaries per 100,000 population (5 year average)
Crime - Thefts per 100,000 population (5 year average)
Crime - Auto thefts per 100,000 population (5 year average)
Crime - Arson per 100,000 population (5 year average)
Crime - City-data.com crime index (5 year average)
Crime - Violent crime index (5 year average)
Crime - Property crime index (5 year average)
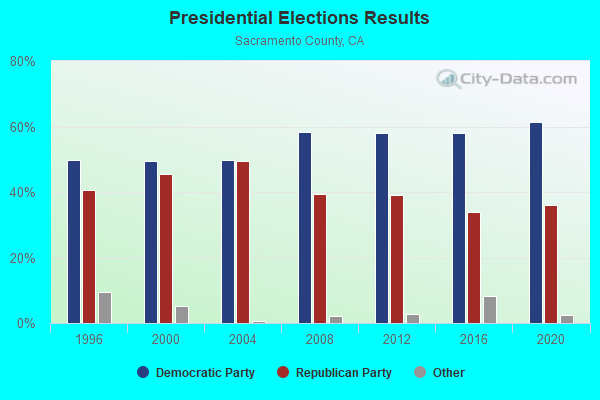
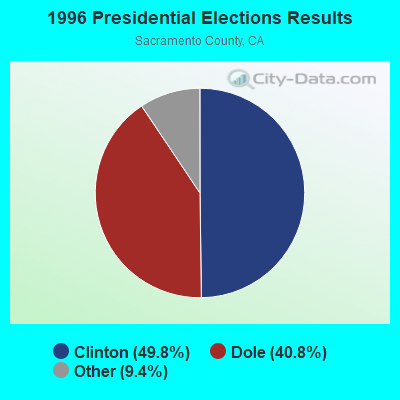
1996 Presidential Elections Results (%) - Democratic Party (Clinton)
1996 Presidential Elections Results (%) - Republican Party (Dole)
1996 Presidential Elections Results (%) - Other
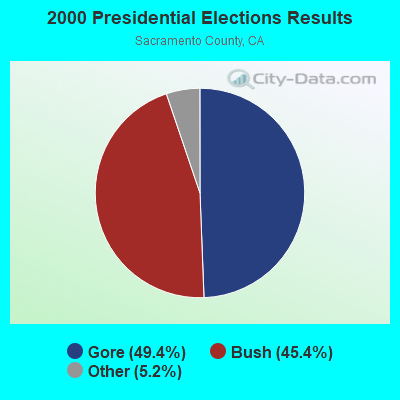
2000 Presidential Elections Results (%) - Democratic Party (Gore)
2000 Presidential Elections Results (%) - Republican Party (Bush)
2000 Presidential Elections Results (%) - Other
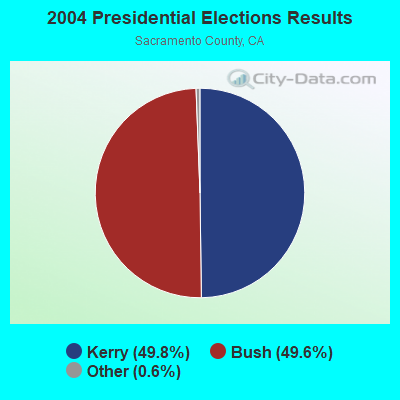
2004 Presidential Elections Results (%) - Democratic Party (Kerry)
2004 Presidential Elections Results (%) - Republican Party (Bush)
2004 Presidential Elections Results (%) - Other
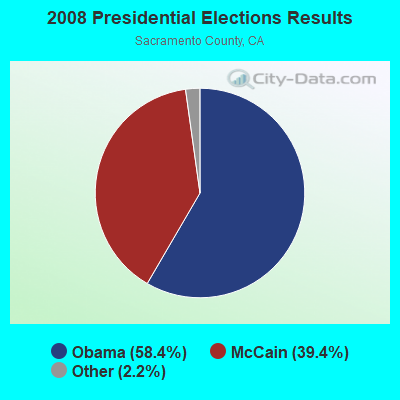
2008 Presidential Elections Results (%) - Democratic Party (Obama)
2008 Presidential Elections Results (%) - Republican Party (McCain)
2008 Presidential Elections Results (%) - Other
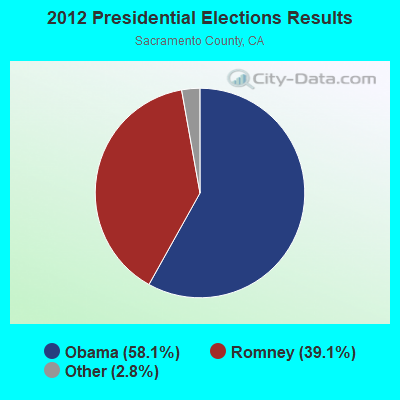
2012 Presidential Elections Results (%) - Democratic Party (Obama)
2012 Presidential Elections Results (%) - Republican Party (Romney)
2012 Presidential Elections Results (%) - Other
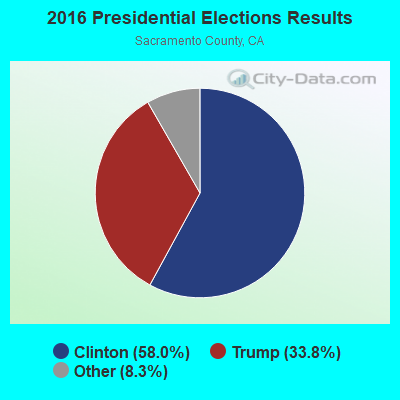
2016 Presidential Elections Results (%) - Democratic Party (Clinton)
2016 Presidential Elections Results (%) - Republican Party (Trump)
2016 Presidential Elections Results (%) - Other
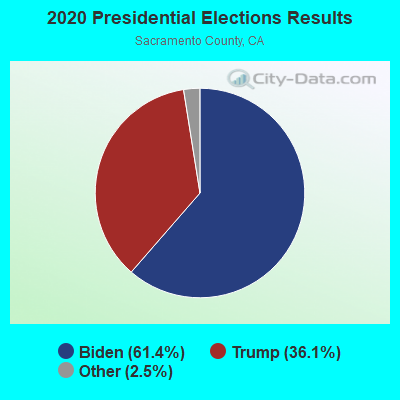
2020 Presidential Elections Results (%) - Democratic Party (Biden)
2020 Presidential Elections Results (%) - Republican Party (Trump)
2020 Presidential Elections Results (%) - Other
Ancestries Reported - Arab (%)
Ancestries Reported - Czech (%)
Ancestries Reported - Danish (%)
Ancestries Reported - Dutch (%)
Ancestries Reported - English (%)
Ancestries Reported - French (%)
Ancestries Reported - French Canadian (%)
Ancestries Reported - German (%)
Ancestries Reported - Greek (%)
Ancestries Reported - Hungarian (%)
Ancestries Reported - Irish (%)
Ancestries Reported - Italian (%)
Ancestries Reported - Lithuanian (%)
Ancestries Reported - Norwegian (%)
Ancestries Reported - Polish (%)
Ancestries Reported - Portuguese (%)
Ancestries Reported - Russian (%)
Ancestries Reported - Scotch-Irish (%)
Ancestries Reported - Scottish (%)
Ancestries Reported - Slovak (%)
Ancestries Reported - Subsaharan African (%)
Ancestries Reported - Swedish (%)
Ancestries Reported - Swiss (%)
Ancestries Reported - Ukrainian (%)
Ancestries Reported - United States (%)
Ancestries Reported - Welsh (%)
Ancestries Reported - West Indian (%)
Ancestries Reported - Other (%)
Educational Attainment - No schooling completed (%)
Educational Attainment - Less than high school (%)
Educational Attainment - High school or equivalent (%)
Educational Attainment - Less than 1 year of college (%)
Educational Attainment - 1 or more years of college (%)
Educational Attainment - Associate degree (%)
Educational Attainment - Bachelor's degree (%)
Educational Attainment - Master's degree (%)
Educational Attainment - Professional school degree (%)
Educational Attainment - Doctorate degree (%)
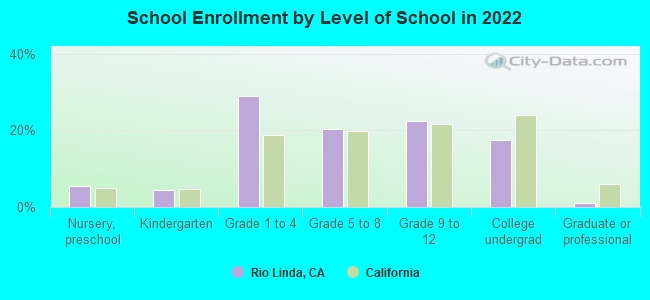
School Enrollment - Nursery, preschool (%)
School Enrollment - Kindergarten (%)
School Enrollment - Grade 1 to 4 (%)
School Enrollment - Grade 5 to 8 (%)
School Enrollment - Grade 9 to 12 (%)
School Enrollment - College undergrad (%)
School Enrollment - Graduate or professional (%)
School Enrollment - Not enrolled in school (%)
School enrollment - Public schools (%)
School enrollment - Private schools (%)
School enrollment - Not enrolled (%)
Median number of rooms in houses and condos
Median number of rooms in apartments
Housing units lacking complete plumbing facilities (%)
Housing units lacking complete kitchen facilities (%)
Density of houses
Urban houses (%)
Rural houses (%)
Households with people 60 years and over (%)
Households with people 65 years and over (%)
Households with people 75 years and over (%)
Households with one or more nonrelatives (%)
Households with no nonrelatives (%)
Population in households (%)
Family households (%)
Nonfamily households (%)
Population in families (%)
Family households with own children (%)
Median number of bedrooms in owner occupied houses
Mean number of bedrooms in owner occupied houses
Median number of bedrooms in renter occupied houses
Mean number of bedrooms in renter occupied houses
Median number of vehichles in owner occupied houses
Mean number of vehichles in owner occupied houses
Median number of vehichles in renter occupied houses
Mean number of vehichles in renter occupied houses
Mortgage status - with mortgage (%)
Mortgage status - with second mortgage (%)
Mortgage status - with home equity loan (%)
Mortgage status - with both second mortgage and home equity loan (%)
Mortgage status - without a mortgage (%)
Average family size
Average family size - White
Average family size - Black or African American
Average family size - Asian
Average family size - Hispanic or Latino
Average family size - American Indian and Alaska Native
Average family size - Multirace
Average family size - Other Race
Geographical mobility - Same house 1 year ago (%)
Geographical mobility - Moved within same county (%)
Geographical mobility - Moved from different county within same state (%)
Geographical mobility - Moved from different state (%)
Geographical mobility - Moved from abroad (%)
Place of birth - Born in state of residence (%)
Place of birth - Born in other state (%)
Place of birth - Native, outside of US (%)
Place of birth - Foreign born (%)
Housing units in structures - 1, detached (%)
Housing units in structures - 1, attached (%)
Housing units in structures - 2 (%)
Housing units in structures - 3 or 4 (%)
Housing units in structures - 5 to 9 (%)
Housing units in structures - 10 to 19 (%)
Housing units in structures - 20 to 49 (%)
Housing units in structures - 50 or more (%)
Housing units in structures - Mobile home (%)
Housing units in structures - Boat, RV, van, etc. (%)
House/condo owner moved in on average (years ago)
Renter moved in on average (years ago)
Year householder moved into unit - Moved in 1999 to March 2000 (%)
Year householder moved into unit - Moved in 1995 to 1998 (%)
Year householder moved into unit - Moved in 1990 to 1994 (%)
Year householder moved into unit - Moved in 1980 to 1989 (%)
Year householder moved into unit - Moved in 1970 to 1979 (%)
Year householder moved into unit - Moved in 1969 or earlier (%)
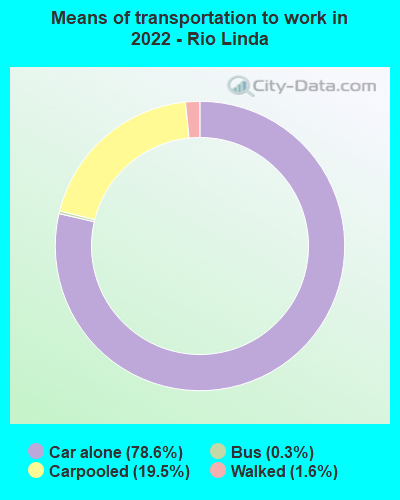
Means of transportation to work - Drove car alone (%)
Means of transportation to work - Carpooled (%)
Means of transportation to work - Public transportation (%)
Means of transportation to work - Bus or trolley bus (%)
Means of transportation to work - Streetcar or trolley car (%)
Means of transportation to work - Subway or elevated (%)
Means of transportation to work - Railroad (%)
Means of transportation to work - Ferryboat (%)
Means of transportation to work - Taxicab (%)
Means of transportation to work - Motorcycle (%)
Means of transportation to work - Bicycle (%)
Means of transportation to work - Walked (%)
Means of transportation to work - Other means (%)
Working at home (%)
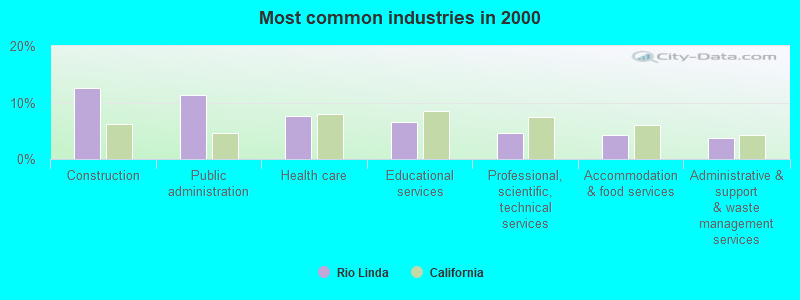
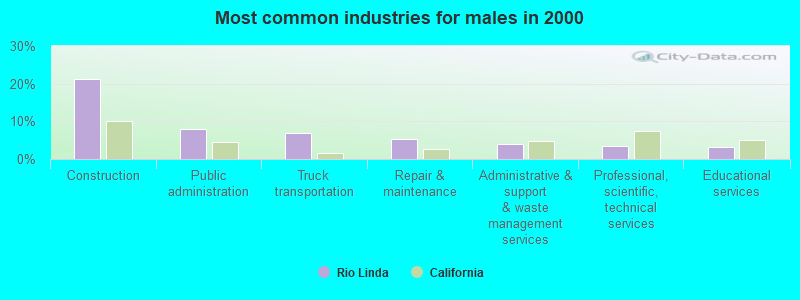
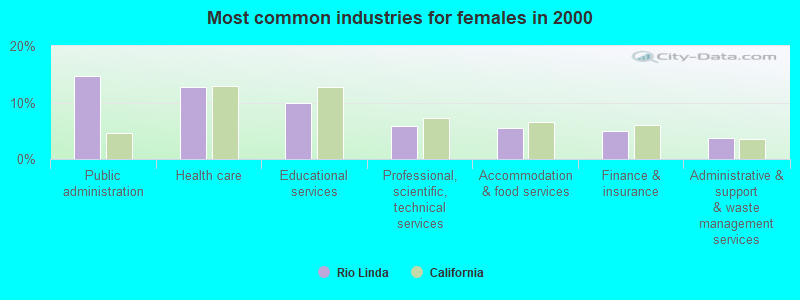
Industry diversity
Most Common Industries - Agriculture, forestry, fishing and hunting, and mining (%)
Most Common Industries - Agriculture, forestry, fishing and hunting (%)
Most Common Industries - Mining, quarrying, and oil and gas extraction (%)
Most Common Industries - Construction (%)
Most Common Industries - Manufacturing (%)
Most Common Industries - Wholesale trade (%)
Most Common Industries - Retail trade (%)
Most Common Industries - Transportation and warehousing, and utilities (%)
Most Common Industries - Transportation and warehousing (%)
Most Common Industries - Utilities (%)
Most Common Industries - Information (%)
Most Common Industries - Finance and insurance, and real estate and rental and leasing (%)
Most Common Industries - Finance and insurance (%)
Most Common Industries - Real estate and rental and leasing (%)
Most Common Industries - Professional, scientific, and management, and administrative and waste management services (%)
Most Common Industries - Professional, scientific, and technical services (%)
Most Common Industries - Management of companies and enterprises (%)
Most Common Industries - Administrative and support and waste management services (%)
Most Common Industries - Educational services, and health care and social assistance (%)
Most Common Industries - Educational services (%)
Most Common Industries - Health care and social assistance (%)
Most Common Industries - Arts, entertainment, and recreation, and accommodation and food services (%)
Most Common Industries - Arts, entertainment, and recreation (%)
Most Common Industries - Accommodation and food services (%)
Most Common Industries - Other services, except public administration (%)
Most Common Industries - Public administration (%)
Occupation diversity
Most Common Occupations - Management, business, science, and arts occupations (%)
Most Common Occupations - Management, business, and financial occupations (%)
Most Common Occupations - Management occupations (%)
Most Common Occupations - Business and financial operations occupations (%)
Most Common Occupations - Computer, engineering, and science occupations (%)
Most Common Occupations - Computer and mathematical occupations (%)
Most Common Occupations - Architecture and engineering occupations (%)
Most Common Occupations - Life, physical, and social science occupations (%)
Most Common Occupations - Education, legal, community service, arts, and media occupations (%)
Most Common Occupations - Community and social service occupations (%)
Most Common Occupations - Legal occupations (%)
Most Common Occupations - Education, training, and library occupations (%)
Most Common Occupations - Arts, design, entertainment, sports, and media occupations (%)
Most Common Occupations - Healthcare practitioners and technical occupations (%)
Most Common Occupations - Health diagnosing and treating practitioners and other technical occupations (%)
Most Common Occupations - Health technologists and technicians (%)
Most Common Occupations - Service occupations (%)
Most Common Occupations - Healthcare support occupations (%)
Most Common Occupations - Protective service occupations (%)
Most Common Occupations - Fire fighting and prevention, and other protective service workers including supervisors (%)
Most Common Occupations - Law enforcement workers including supervisors (%)
Most Common Occupations - Food preparation and serving related occupations (%)
Most Common Occupations - Building and grounds cleaning and maintenance occupations (%)
Most Common Occupations - Personal care and service occupations (%)
Most Common Occupations - Sales and office occupations (%)
Most Common Occupations - Sales and related occupations (%)
Most Common Occupations - Office and administrative support occupations (%)
Most Common Occupations - Natural resources, construction, and maintenance occupations (%)
Most Common Occupations - Farming, fishing, and forestry occupations (%)
Most Common Occupations - Construction and extraction occupations (%)
Most Common Occupations - Installation, maintenance, and repair occupations (%)
Most Common Occupations - Production, transportation, and material moving occupations (%)
Most Common Occupations - Production occupations (%)
Most Common Occupations - Transportation occupations (%)
Most Common Occupations - Material moving occupations (%)
People in Group quarters - Institutionalized population (%)
People in Group quarters - Correctional institutions (%)
People in Group quarters - Federal prisons and detention centers (%)
People in Group quarters - Halfway houses (%)
People in Group quarters - Local jails and other confinement facilities (including police lockups) (%)
People in Group quarters - Military disciplinary barracks (%)
People in Group quarters - State prisons (%)
People in Group quarters - Other types of correctional institutions (%)
People in Group quarters - Nursing homes (%)
People in Group quarters - Hospitals/wards, hospices, and schools for the handicapped (%)
People in Group quarters - Hospitals/wards and hospices for chronically ill (%)
People in Group quarters - Hospices or homes for chronically ill (%)
People in Group quarters - Military hospitals or wards for chronically ill (%)
People in Group quarters - Other hospitals or wards for chronically ill (%)
People in Group quarters - Hospitals or wards for drug/alcohol abuse (%)
People in Group quarters - Mental (Psychiatric) hospitals or wards (%)
People in Group quarters - Schools, hospitals, or wards for the mentally retarded (%)
People in Group quarters - Schools, hospitals, or wards for the physically handicapped (%)
People in Group quarters - Institutions for the deaf (%)
People in Group quarters - Institutions for the blind (%)
People in Group quarters - Orthopedic wards and institutions for the physically handicapped (%)
People in Group quarters - Wards in general hospitals for patients who have no usual home elsewhere (%)
People in Group quarters - Wards in military hospitals for patients who have no usual home elsewhere (%)
People in Group quarters - Juvenile institutions (%)
People in Group quarters - Long-term care (%)
People in Group quarters - Homes for abused, dependent, and neglected children (%)
People in Group quarters - Residential treatment centers for emotionally disturbed children (%)
People in Group quarters - Training schools for juvenile delinquents (%)
People in Group quarters - Short-term care, detention or diagnostic centers for delinquent children (%)
People in Group quarters - Type of juvenile institution unknown (%)
People in Group quarters - Noninstitutionalized population (%)
People in Group quarters - College dormitories (includes college quarters off campus) (%)
People in Group quarters - Military quarters (%)
People in Group quarters - On base (%)
People in Group quarters - Barracks, unaccompanied personnel housing (UPH), (Enlisted/Officer), ;and similar group living quarters for military personnel (%)
People in Group quarters - Transient quarters for temporary residents (%)
People in Group quarters - Military ships (%)
People in Group quarters - Group homes (%)
People in Group quarters - Homes or halfway houses for drug/alcohol abuse (%)
People in Group quarters - Homes for the mentally ill (%)
People in Group quarters - Homes for the mentally retarded (%)
People in Group quarters - Homes for the physically handicapped (%)
People in Group quarters - Other group homes (%)
People in Group quarters - Religious group quarters (%)
People in Group quarters - Dormitories (%)
People in Group quarters - Agriculture workers' dormitories on farms (%)
People in Group quarters - Job Corps and vocational training facilities (%)
People in Group quarters - Other workers' dormitories (%)
People in Group quarters - Crews of maritime vessels (%)
People in Group quarters - Other nonhousehold living situations (%)
People in Group quarters - Other noninstitutional group quarters (%)
Residents speaking English at home (%)
Residents speaking English at home - Born in the United States (%)
Residents speaking English at home - Native, born elsewhere (%)
Residents speaking English at home - Foreign born (%)
Residents speaking Spanish at home (%)
Residents speaking Spanish at home - Born in the United States (%)
Residents speaking Spanish at home - Native, born elsewhere (%)
Residents speaking Spanish at home - Foreign born (%)
Residents speaking other language at home (%)
Residents speaking other language at home - Born in the United States (%)
Residents speaking other language at home - Native, born elsewhere (%)
Residents speaking other language at home - Foreign born (%)
Class of Workers - Employee of private company (%)
Class of Workers - Self-employed in own incorporated business (%)
Class of Workers - Private not-for-profit wage and salary workers (%)
Class of Workers - Local government workers (%)
Class of Workers - State government workers (%)
Class of Workers - Federal government workers (%)
Class of Workers - Self-employed workers in own not incorporated business and Unpaid family workers (%)
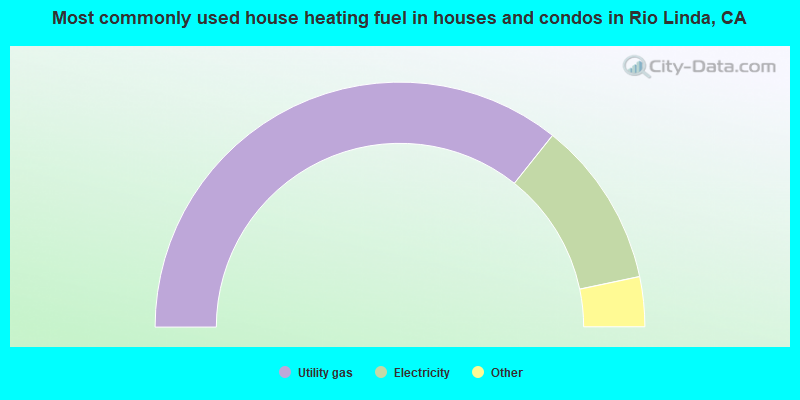
House heating fuel used in houses and condos - Utility gas (%)
House heating fuel used in houses and condos - Bottled, tank, or LP gas (%)
House heating fuel used in houses and condos - Electricity (%)
House heating fuel used in houses and condos - Fuel oil, kerosene, etc. (%)
House heating fuel used in houses and condos - Coal or coke (%)
House heating fuel used in houses and condos - Wood (%)
House heating fuel used in houses and condos - Solar energy (%)
House heating fuel used in houses and condos - Other fuel (%)
House heating fuel used in houses and condos - No fuel used (%)
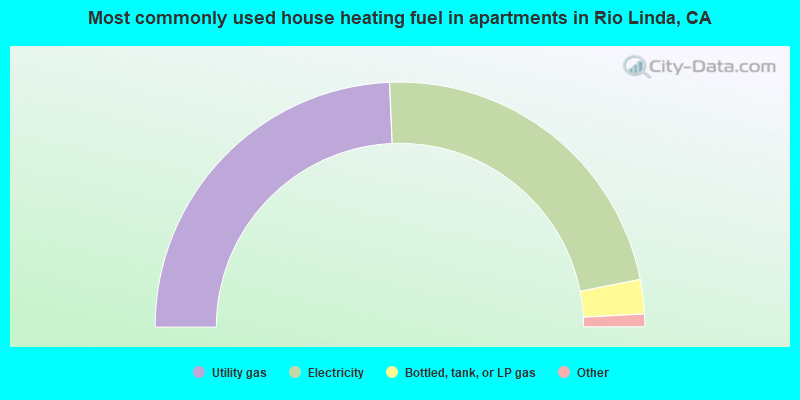
House heating fuel used in apartments - Utility gas (%)
House heating fuel used in apartments - Bottled, tank, or LP gas (%)
House heating fuel used in apartments - Electricity (%)
House heating fuel used in apartments - Fuel oil, kerosene, etc. (%)
House heating fuel used in apartments - Coal or coke (%)
House heating fuel used in apartments - Wood (%)
House heating fuel used in apartments - Solar energy (%)
House heating fuel used in apartments - Other fuel (%)
House heating fuel used in apartments - No fuel used (%)
Armed forces status - In Armed Forces (%)
Armed forces status - Civilian (%)
Armed forces status - Civilian - Veteran (%)
Armed forces status - Civilian - Nonveteran (%)
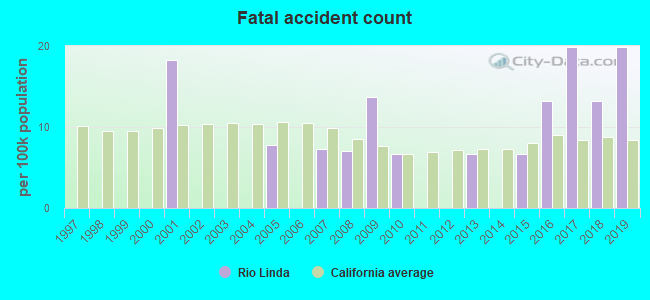
Fatal accidents locations in years 2005-2021
Fatal accidents locations in 2005
Fatal accidents locations in 2006
Fatal accidents locations in 2007
Fatal accidents locations in 2008
Fatal accidents locations in 2009
Fatal accidents locations in 2010
Fatal accidents locations in 2011
Fatal accidents locations in 2012
Fatal accidents locations in 2013
Fatal accidents locations in 2014
Fatal accidents locations in 2015
Fatal accidents locations in 2016
Fatal accidents locations in 2017
Fatal accidents locations in 2018
Fatal accidents locations in 2019
Fatal accidents locations in 2020
Fatal accidents locations in 2021
Alcohol use - People drinking some alcohol every month (%)
Alcohol use - People not drinking at all (%)
Alcohol use - Average days/month drinking alcohol
Alcohol use - Average drinks/week
Alcohol use - Average days/year people drink much
Audiometry - Average condition of hearing (%)
Audiometry - People that can hear a whisper from across a quiet room (%)
Audiometry - People that can hear normal voice from across a quiet room (%)
Audiometry - Ears ringing, roaring, buzzing (%)
Audiometry - Had a job exposure to loud noise (%)
Audiometry - Had off-work exposure to loud noise (%)
Blood Pressure & Cholesterol - Has high blood pressure (%)
Blood Pressure & Cholesterol - Checking blood pressure at home (%)
Blood Pressure & Cholesterol - Frequently checking blood cholesterol (%)
Blood Pressure & Cholesterol - Has high cholesterol level (%)
Consumer Behavior - Money monthly spent on food at supermarket/grocery store
Consumer Behavior - Money monthly spent on food at other stores
Consumer Behavior - Money monthly spent on eating out
Consumer Behavior - Money monthly spent on carryout/delivered foods
Consumer Behavior - Income spent on food at supermarket/grocery store (%)
Consumer Behavior - Income spent on food at other stores (%)
Consumer Behavior - Income spent on eating out (%)
Consumer Behavior - Income spent on carryout/delivered foods (%)
Current Health Status - General health condition (%)
Current Health Status - Blood donors (%)
Current Health Status - Has blood ever tested for HIV virus (%)
Current Health Status - Left-handed people (%)
Dermatology - People using sunscreen (%)
Diabetes - Diabetics (%)
Diabetes - Had a blood test for high blood sugar (%)
Diabetes - People taking insulin (%)
Diet Behavior & Nutrition - Diet health (%)
Diet Behavior & Nutrition - Milk product consumption (# of products/month)
Diet Behavior & Nutrition - Meals not home prepared (#/week)
Diet Behavior & Nutrition - Meals from fast food or pizza place (#/week)
Diet Behavior & Nutrition - Ready-to-eat foods (#/month)
Diet Behavior & Nutrition - Frozen meals/pizza (#/month)
Drug Use - People that ever used marijuana or hashish (%)
Drug Use - Ever used hard drugs (%)
Drug Use - Ever used any form of cocaine (%)
Drug Use - Ever used heroin (%)
Drug Use - Ever used methamphetamine (%)
Health Insurance - People covered by health insurance (%)
Kidney Conditions-Urology - Avg. # of times urinating at night
Medical Conditions - People with asthma (%)
Medical Conditions - People with anemia (%)
Medical Conditions - People with psoriasis (%)
Medical Conditions - People with overweight (%)
Medical Conditions - Elderly people having difficulties in thinking or remembering (%)
Medical Conditions - People who ever received blood transfusion (%)
Medical Conditions - People having trouble seeing even with glass/contacts (%)
Medical Conditions - People with arthritis (%)
Medical Conditions - People with gout (%)
Medical Conditions - People with congestive heart failure (%)
Medical Conditions - People with coronary heart disease (%)
Medical Conditions - People with angina pectoris (%)
Medical Conditions - People who ever had heart attack (%)
Medical Conditions - People who ever had stroke (%)
Medical Conditions - People with emphysema (%)
Medical Conditions - People with thyroid problem (%)
Medical Conditions - People with chronic bronchitis (%)
Medical Conditions - People with any liver condition (%)
Medical Conditions - People who ever had cancer or malignancy (%)
Mental Health - People who have little interest in doing things (%)
Mental Health - People feeling down, depressed, or hopeless (%)
Mental Health - People who have trouble sleeping or sleeping too much (%)
Mental Health - People feeling tired or having little energy (%)
Mental Health - People with poor appetite or overeating (%)
Mental Health - People feeling bad about themself (%)
Mental Health - People who have trouble concentrating on things (%)
Mental Health - People moving or speaking slowly or too fast (%)
Mental Health - People having thoughts they would be better off dead (%)
Oral Health - Average years since last visit a dentist
Oral Health - People embarrassed because of mouth (%)
Oral Health - People with gum disease (%)
Oral Health - General health of teeth and gums (%)
Oral Health - Average days a week using dental floss/device
Oral Health - Average days a week using mouthwash for dental problem
Oral Health - Average number of teeth
Pesticide Use - Households using pesticides to control insects (%)
Pesticide Use - Households using pesticides to kill weeds (%)
Physical Activity - People doing vigorous-intensity work activities (%)
Physical Activity - People doing moderate-intensity work activities (%)
Physical Activity - People walking or bicycling (%)
Physical Activity - People doing vigorous-intensity recreational activities (%)
Physical Activity - People doing moderate-intensity recreational activities (%)
Physical Activity - Average hours a day doing sedentary activities
Physical Activity - Average hours a day watching TV or videos
Physical Activity - Average hours a day using computer
Physical Functioning - People having limitations keeping them from working (%)
Physical Functioning - People limited in amount of work they can do (%)
Physical Functioning - People that need special equipment to walk (%)
Physical Functioning - People experiencing confusion/memory problems (%)
Physical Functioning - People requiring special healthcare equipment (%)
Prescription Medications - Average number of prescription medicines taking
Preventive Aspirin Use - Adults 40+ taking low-dose aspirin (%)
Reproductive Health - Vaginal deliveries (%)
Reproductive Health - Cesarean deliveries (%)
Reproductive Health - Deliveries resulted in a live birth (%)
Reproductive Health - Pregnancies resulted in a delivery (%)
Reproductive Health - Women breastfeeding newborns (%)
Reproductive Health - Women that had a hysterectomy (%)
Reproductive Health - Women that had both ovaries removed (%)
Reproductive Health - Women that have ever taken birth control pills (%)
Reproductive Health - Women taking birth control pills (%)
Reproductive Health - Women that have ever used Depo-Provera or injectables (%)
Reproductive Health - Women that have ever used female hormones (%)
Sexual Behavior - People 18+ that ever had sex (vaginal, anal, or oral) (%)
Sexual Behavior - Males 18+ that ever had vaginal sex with a woman (%)
Sexual Behavior - Males 18+ that ever performed oral sex on a woman (%)
Sexual Behavior - Males 18+ that ever had anal sex with a woman (%)
Sexual Behavior - Males 18+ that ever had any sex with a man (%)
Sexual Behavior - Females 18+ that ever had vaginal sex with a man (%)
Sexual Behavior - Females 18+ that ever performed oral sex on a man (%)
Sexual Behavior - Females 18+ that ever had anal sex with a man (%)
Sexual Behavior - Females 18+ that ever had any kind of sex with a woman (%)
Sexual Behavior - Average age people first had sex
Sexual Behavior - Average number of female sex partners in lifetime (males 18+)
Sexual Behavior - Average number of female vaginal sex partners in lifetime (males 18+)
Sexual Behavior - Average age people first performed oral sex on a woman (18+)
Sexual Behavior - Average number of woman performed oral sex on in lifetime (18+)
Sexual Behavior - Average number of male sex partners in lifetime (males 18+)
Sexual Behavior - Average number of male anal sex partners in lifetime (males 18+)
Sexual Behavior - Average age people first performed oral sex on a man (18+)
Sexual Behavior - Average number of male oral sex partners in lifetime (18+)
Sexual Behavior - People using protection when performing oral sex (%)
Sexual Behavior - Average number of times people have vaginal or anal sex a year
Sexual Behavior - People having sex without condom (%)
Sexual Behavior - Average number of male sex partners in lifetime (females 18+)
Sexual Behavior - Average number of male vaginal sex partners in lifetime (females 18+)
Sexual Behavior - Average number of female sex partners in lifetime (females 18+)
Sexual Behavior - Circumcised males 18+ (%)
Sleep Disorders - Average hours sleeping at night
Sleep Disorders - People that has trouble sleeping (%)
Smoking-Cigarette Use - People smoking cigarettes (%)
Taste & Smell - People 40+ having problems with smell (%)
Taste & Smell - People 40+ having problems with taste (%)
Taste & Smell - People 40+ that ever had wisdom teeth removed (%)
Taste & Smell - People 40+ that ever had tonsils teeth removed (%)
Taste & Smell - People 40+ that ever had a loss of consciousness because of a head injury (%)
Taste & Smell - People 40+ that ever had a broken nose or other serious injury to face or skull (%)
Taste & Smell - People 40+ that ever had two or more sinus infections (%)
Weight - Average height (inches)
Weight - Average weight (pounds)
Weight - Average BMI
Weight - People that are obese (%)
Weight - People that ever were obese (%)
Weight - People trying to lose weight (%)
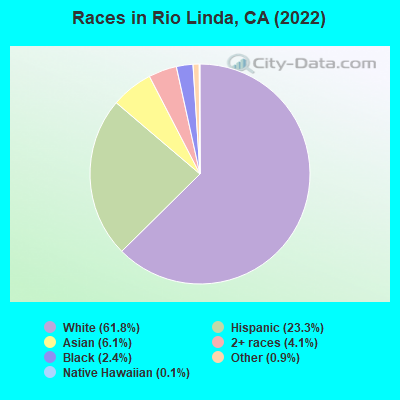
10,284 61.8% White alone 3,871 23.3% Hispanic 1,023 6.1% Asian alone 679 4.1% Two or more races 400 2.4% Black alone 142 0.9% Other race alone 19 0.1% Native Hawaiian and Other 15 0.09% American Indian alone
Latest news from Rio Linda, CA collected exclusively by city-data.com from local newspapers, TV, and radio stations
Ancestries: Russian (6.8%), German (4.2%), European (3.9%), Ukrainian (3.5%), American (3.2%), English (2.9%).
Current Local Time:
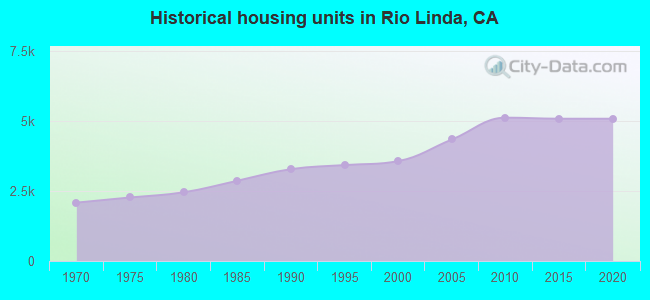
Land area: 5.48 square miles.
Population density: 2,758 people per square mile (average).
2,316 residents are foreign born (5.3% Latin America , 4.4% Europe , 4.2% Asia ).
This place:
13.9%California:
26.5%
Median real estate property taxes paid for housing units with mortgages in 2022: $2,800 (0.6%)Median real estate property taxes paid for housing units with no mortgage in 2022: $2,181 (0.5%)
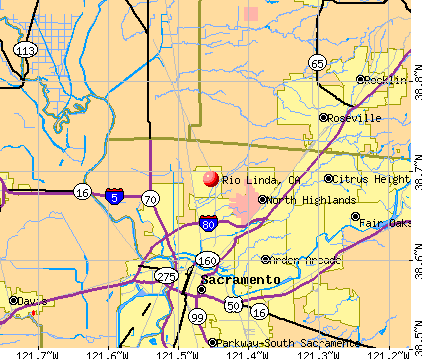
Nearest city with pop. 50,000+: Arden-Arcade, CA
Nearest city with pop. 200,000+: Sacramento, CA
Nearest city with pop. 1,000,000+: Los Angeles, CA
Nearest cities:
Latitude: 38.69 N, Longitude: 121.45 W
Daytime population change due to commuting: -3,892 (-23.4%)Workers who live and work in this place: 1,514 (20.8%)
Unemployment in December 2023:
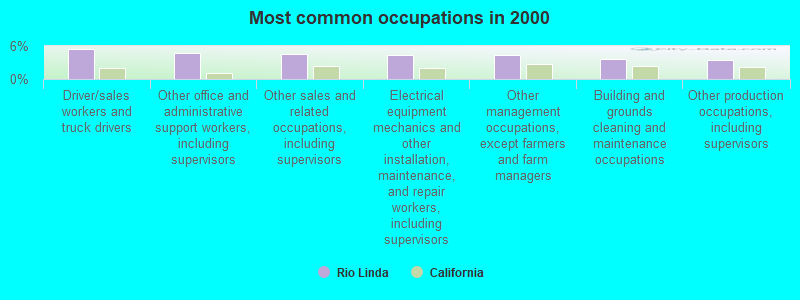
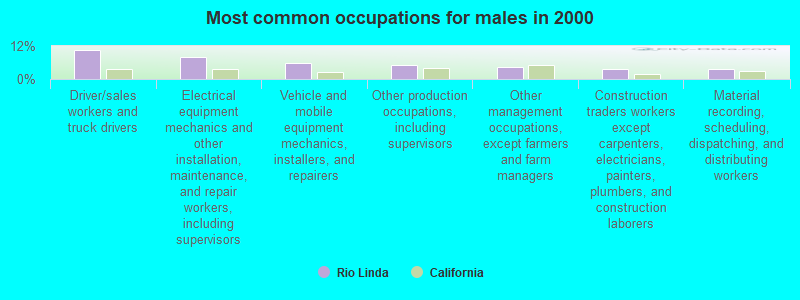
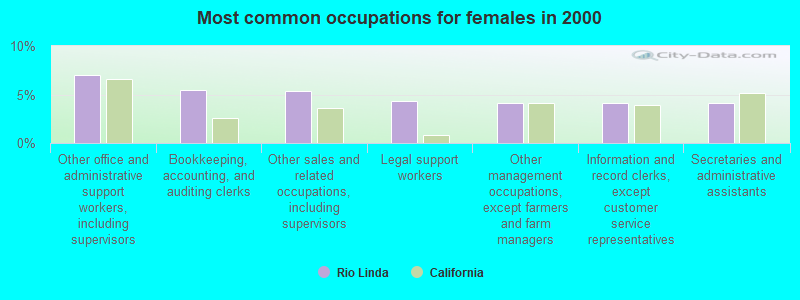
Most common occupations in Rio Linda, CA (%)
Both Males Females
Driver/sales workers and truck drivers (5.5%)
Other office and administrative support workers, including supervisors (4.8%)
Other sales and related occupations, including supervisors (4.6%)
Electrical equipment mechanics and other installation, maintenance, and repair workers, including supervisors (4.3%)
Other management occupations, except farmers and farm managers (4.3%)
Building and grounds cleaning and maintenance occupations (3.7%)
Other production occupations, including supervisors (3.4%)
Driver/sales workers and truck drivers (10.7%)
Electrical equipment mechanics and other installation, maintenance, and repair workers, including supervisors (7.9%)
Vehicle and mobile equipment mechanics, installers, and repairers (5.8%)
Other production occupations, including supervisors (5.3%)
Other management occupations, except farmers and farm managers (4.4%)
Construction traders workers except carpenters, electricians, painters, plumbers, and construction laborers (3.8%)
Material recording, scheduling, dispatching, and distributing workers (3.8%)
Other office and administrative support workers, including supervisors (7.0%)
Bookkeeping, accounting, and auditing clerks (5.5%)
Other sales and related occupations, including supervisors (5.4%)
Legal support workers (4.3%)
Other management occupations, except farmers and farm managers (4.2%)
Information and record clerks, except customer service representatives (4.2%)
Secretaries and administrative assistants (4.2%)
Earthquake activity:
Rio Linda-area historical earthquake activity is significantly above California state average. It is 7620% greater than the overall U.S. average. On 4/18/1906 at 13:12:21, a magnitude 7.9 (7.9 UK, Class: Major, Intensity: VIII - XII) earthquake occurred 96.5 miles away from the city center, causing $524,000,000 total damage On 10/18/1989 at 00:04:15, a magnitude 7.1 (6.5 MB, 7.1 MS, 6.9 MW, 7.0 ML) earthquake occurred 110.7 miles away from the city center, causing 62 deaths ( 62 shaking deaths) and 3757 injuries, causing $1,305,032,704 total damage On 10/3/1915 at 06:52:48, a magnitude 7.6 (7.6 UK) earthquake occurred 245.1 miles away from the city center On 1/31/1922 at 13:17:28, a magnitude 7.6 (7.6 UK) earthquake occurred 258.6 miles away from Rio Linda center On 7/21/1952 at 11:52:14, a magnitude 7.7 (7.7 UK) earthquake occurred 289.1 miles away from Rio Linda center, causing $50,000,000 total damage On 4/25/1992 at 18:06:04, a magnitude 7.2 (6.3 MB, 7.1 MS, 7.2 MW, 7.1 MW, Depth: 9.4 mi) earthquake occurred 180.6 miles away from Rio Linda center, causing $75,000,000 total damage Magnitude types: body-wave magnitude (MB), local magnitude (ML), surface-wave magnitude (MS), moment magnitude (MW) Natural disasters: The number of natural disasters in Sacramento County (18) is near the US average (15).Major Disasters (Presidential) Declared: 11Emergencies Declared: 3Floods: 13, Winter Storms: 6, Storms: 5, Mudslides: 4, Landslides: 3, Drought: 1, Earthquake: 1, Heavy Rain: 1, Hurricane: 1, Tornado: 1, Wind: 1, Other: 1 (Note: some incidents may be assigned to more than one category). Hospitals and medical centers near Rio Linda: NORWOOD PINES ALZHEIMERS CENTER (Nursing Home, about 4 miles away; SACRAMENTO, CA)
WINDSOR CARE CENTER OF SACRAMENTO (Nursing Home, about 4 miles away; SACRAMENTO, CA)
AMEDISYS HOME HEALTH CARE (Home Health Center, about 4 miles away; SACRAMENTO, CA)
VITAS HEALTHCARE CORPORATION OF CALIFORNIA (Hospital, about 4 miles away; SACRAMENTO, CA)
NORTH HIGHLANDS DIALYSIS CENTER (Dialysis Facility, about 5 miles away; NORTH HIGHLANDS, CA)
ANTELOPE HILLS MANOR ICF DDN (Hospital, about 5 miles away; ANTELOPE, CA)
PSA HEALTHCARE (Home Health Center, about 6 miles away; SACRAMENTO, CA)
Airports located in Rio Linda: Amtrak stations near Rio Linda: 8 miles: SACRAMENTO (401 I ST.) Services: ticket office, partially wheelchair accessible, enclosed waiting area, public restrooms, public payphones, vending machines, paid short-term parking, paid long-term parking, call for car rental service, call for taxi service, public transit connection.
11 miles: ROSEVILLE (201 PACIFIC ST.) Services: partially wheelchair accessible, public payphones, free short-term parking, free long-term parking, taxi stand, intercity bus service.
11 miles: RANCHO CORDOVA (10369 FOLSOM BLVD.) - Bus Station Services: fully wheelchair accessible, free short-term parking, public transit connection.
Colleges/universities with over 2000 students nearest to Rio Linda:
Universal Technical Institute of Northern California Inc (about 6 miles; Sacramento, CA ; Full-time enrollment: 3,193)
University of Phoenix-Sacramento Valley Campus (about 7 miles; Sacramento, CA ; FT enrollment: 2,855)
American River College (about 7 miles; Sacramento, CA ; FT enrollment: 20,452)
California State University-Sacramento (about 10 miles; Sacramento, CA ; FT enrollment: 22,234)
Sacramento City College (about 11 miles; Sacramento, CA ; FT enrollment: 15,963)
Sierra College (about 15 miles; Rocklin, CA ; FT enrollment: 11,488)
Cosumnes River College (about 17 miles; Sacramento, CA ; FT enrollment: 9,327)
Public high schools in Rio Linda:
Private high school in Rio Linda: CALVARY BAPTIST CHURCH SCHOOL Students: 28, Location: 6608 16TH ST, Grades: KG-12)
Public elementary/middle schools in Rio Linda: RIO LINDA PREPARATORY ACADEMY Students: 464, Location: 1101 G ST., Grades: 5-8)WESTSIDE PREPARATORY CHARTER Students: 394, Location: 6537 W. SECOND ST., Grades: 7-8, Charter school )ORCHARD ELEMENTARY Students: 276, Location: 1040 Q ST., Grades: KG-8)DRY CREEK ELEMENTARY Students: 263, Location: 1230 G ST., Grades: KG-4)PATHWAYS COMMUNITY DAY Students: 23, Location: 6450 20TH ST., Grades: KG-8)WESTSIDE ELEMENTARY Location: 6537 W. SECOND ST., Grades: KG-6)
See full list of schools located in Rio Linda User-submitted facts and corrections:
Post Office located at 801 M St. Rio Linda 5193 deliveries as of August 2005.
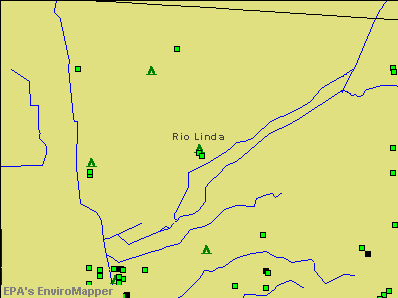
Notable locations in Rio Linda: (A) , Rio Linda Neighborhood Library (B) , Sacramento Metropolitan Fire District Station 111 (C) . Display/hide their locations on the map
Shopping Center: (1) . Display/hide its location on the map
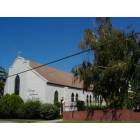
Churches in Rio Linda include: (A) , First Apostolic Church of Rio Linda (B) , First Baptist Church of Rio Linda (C) , First Fijian Church of God (D) , First Southern Baptist Church (E) , Pentecostal Church of God (F) , Rio Linda Community United Methodist Church (G) , Rio Linda Seventh Day Adventist Church (H) . Display/hide their locations on the map
Parks in Rio Linda include: (1) , Babe Park (2) , Depot Park (3) , Westside Park (4) . Display/hide their locations on the map
Birthplace of: Dave Huckaba - Martial artist.
Sacramento County has a predicted average indoor radon screening level less than 2 pCi/L (pico curies per liter) - Low Potential Drinking water stations with addresses in Rio Linda and their reported violations in the past:
TRAP THE (Population served: 65, Groundwater):
Past monitoring violations:
One routine major monitoring violation
2 minor monitoring violations
Average household size: This place:
3.1 peopleCalifornia:
2.9 people
Percentage of family households: This place:
75.8%Whole state:
68.7%
Percentage of households with unmarried partners: This place:
8.0%Whole state:
7.2%
Likely homosexual households (counted as self-reported same-sex unmarried-partner households)
Lesbian couples: 0.7% of all households Gay men: 0.2% of all households
People in group quarters in Rio Linda in 2010:
31 people in group homes intended for adults
13 people in residential treatment centers for adults
7 people in workers' group living quarters and job corps centers
2 people in other noninstitutional facilities
People in group quarters in Rio Linda in 2000:
14 people in homes or halfway houses for drug/alcohol abuse
13 people in nursing homes
11 people in schools, hospitals, or wards for the intellectually disabled
8 people in homes for the mentally retarded
8 people in other noninstitutional group quarters
4 people in homes for the physically handicapped
For population 15 years and over in Rio Linda:
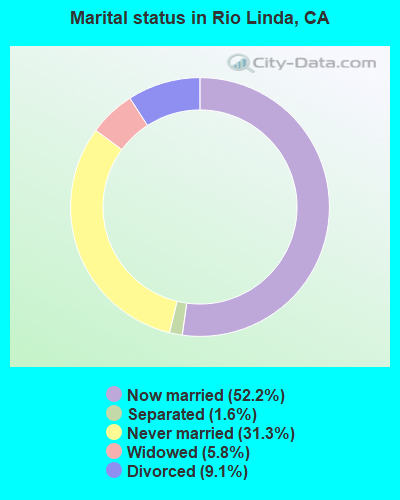
Never married: 31.3%Now married: 52.2%Separated: 1.6%Widowed: 5.8%Divorced: 9.1% For population 25 years and over in Rio Linda:
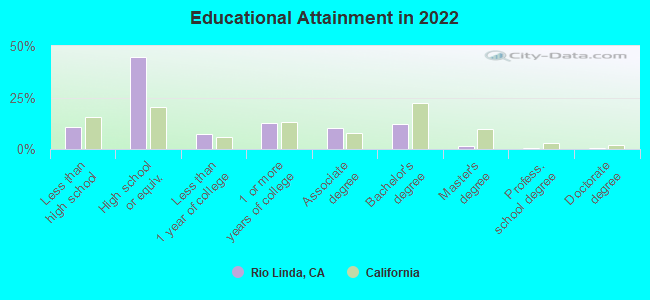
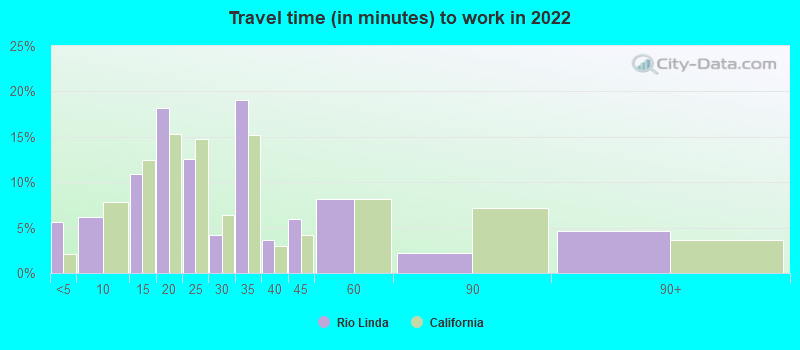
High school or higher: 88.3%Bachelor's degree or higher: 14.1%Graduate or professional degree: 2.6%Unemployed: 10.0%Mean travel time to work (commute): 26.3 minutes
Education Gini index (Inequality in education) Here:
10.0California average:
15.5
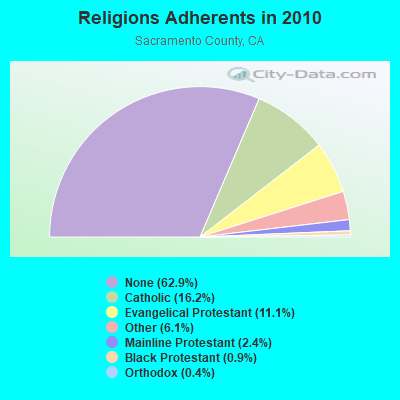
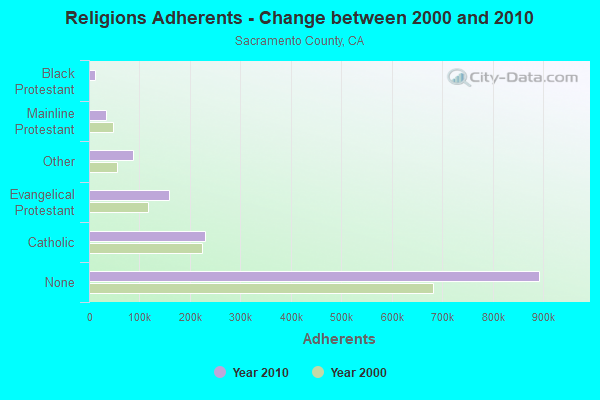
Religion statistics for Rio Linda, CA (based on Sacramento County data)
Religion Adherents Congregations Catholic 229,725 45 Evangelical Protestant 157,621 493 Other 86,390 183 Mainline Protestant 33,989 105 Black Protestant 12,585 38 Orthodox 5,675 12 None 892,803 -
Source: Clifford Grammich, Kirk Hadaway, Richard Houseal, Dale E.Jones, Alexei Krindatch, Richie Stanley and Richard H.Taylor. 2012. 2010 U.S.Religion Census: Religious Congregations & Membership Study. Association of Statisticians of American Religious Bodies. Jones, Dale E., et al. 2002. Congregations and Membership in the United States 2000. Nashville, TN: Glenmary Research Center. Graphs represent county-level data
Food Environment Statistics: Number of grocery stores : 255Here :
1.85 / 10,000 pop.California :
2.14 / 10,000 pop.
Number of supercenters and club stores : 10This county :
0.07 / 10,000 pop.California :
0.04 / 10,000 pop.
Number of convenience stores (no gas) : 86This county :
0.62 / 10,000 pop.California :
0.62 / 10,000 pop.
Number of convenience stores (with gas) : 233This county :
1.69 / 10,000 pop.California :
1.49 / 10,000 pop.
Number of full-service restaurants : 922Sacramento County :
6.68 / 10,000 pop.California :
7.42 / 10,000 pop.
Adult diabetes rate : Sacramento County :
7.8%California :
7.3%
Adult obesity rate : Sacramento County :
25.0%California :
21.3%
Low-income preschool obesity rate : Sacramento County :
15.4%California :
17.9%
Health and Nutrition: Healthy diet rate : This city:
47.8%California:
49.4%
Average overall health of teeth and gums : This city:
44.2%California:
48.0%
Average BMI : Rio Linda:
28.9California:
28.1
People feeling badly about themselves : Rio Linda:
22.5%California:
20.2%
People not drinking alcohol at all : This city:
11.2%California:
11.2%
Average hours sleeping at night : Overweight people : This city:
34.3%State:
31.5%
General health condition : This city:
54.8%California:
56.4%
Average condition of hearing : Here:
78.5%California:
80.9%
More about Health and Nutrition of Rio Linda, CA Residents
5.68% of this county's 2021 resident taxpayers lived in other counties in 2020 ($67,729 average adjusted gross income )
Here:
5.68%California average:
5.19%
0.01% of residents moved from foreign countries ($150 average AGI )Sacramento County:
0.01%California average:
0.03%
Top counties from which taxpayers relocated into this county between 2020 and 2021:
6.10% of this county's 2020 resident taxpayers moved to other counties in 2021 ($74,281 average adjusted gross income )
Here:
6.10%California average:
6.14%
0.01% of residents moved to foreign countries ($109 average AGI )Sacramento County:
0.01%California average:
0.02%
Top counties to which taxpayers relocated from this county between 2020 and 2021:
Businesses in Rio Linda, CA
Name Count Name Count
7-Eleven 1 Subway 1 KFC 1 True Value 1 McDonald's 1 UPS 1
Strongest AM radio stations in Rio Linda:
KFBK (1530 AM; 50 kW; SACRAMENTO, CA; Owner: AMFM RADIO LICENSES, L.L.C.)
KFIA (710 AM; 25 kW; CARMICHAEL, CA; Owner: VISTA BROADCASTING INC.)
KSMH (1620 AM; 10 kW; WEST SACRAMENTO, CA; Owner: IHR EDUCATIONAL BROADCASTING)
KSTE (650 AM; 25 kW; RANCHO CORDOVA, CA; Owner: AMFM RADIO LICENSES, L.L.C.)
KCTC (1320 AM; 5 kW; SACRAMENTO, CA; Owner: ENTERCOM SACRAMENTO LICENSE, LLC)
KIID (1470 AM; 5 kW; SACRAMENTO, CA; Owner: ABC, INC.)
KHTK (1140 AM; 50 kW; SACRAMENTO, CA; Owner: INFINITY RADIO SUBSIDIARY OPERATIONS INC.)
KLIB (1110 AM; 10 kW; ROSEVILLE, CA; Owner: WAY BROADCASTING, INC.)
KFSG (1690 AM; 10 kW; ROSEVILLE, CA; Owner: WAY BROADCASTING, INC.)
KSQR (1240 AM; 1 kW; SACRAMENTO, CA; Owner: MOON BROADCASTING SACRAMENTO, LLC)
KAHI (950 AM; 10 kW; AUBURN, CA; Owner: IHR EDUCATIONAL BROADCASTING)
KCBS (740 AM; 50 kW; SAN FRANCISCO, CA; Owner: INFINITY BROADCASTING OPERATIONS, INC.)
KCBC (770 AM; 50 kW; RIVERBANK, CA; Owner: KIERTRON, INC.)
Strongest FM radio stations in Rio Linda:
KGBY (92.5 FM; SACRAMENTO, CA; Owner: AMFM RADIO LICENSES, L.L.C.)
KXPR (90.9 FM; SACRAMENTO, CA; Owner: CALIFORNIA STATE UNIVERSITY)
KDND (107.9 FM; SACRAMENTO, CA; Owner: ENTERCOM SACRAMENTO LICENSE, LLC)
KQEI-FM (89.3 FM; NORTH HIGHLANDS, CA; Owner: KQED, INC.)
KSEG (96.9 FM; SACRAMENTO, CA; Owner: ENTERCOM SACRAMENTO LICENSE, LLC)
KXCL (103.9 FM; YUBA CITY, CA; Owner: HARLAN COMMUNICATIONS, INC.)
K290AI (105.9 FM; NATOMAS, CA; Owner: EDUCATIONAL MEDIA FOUNDATION)
KYMX (96.1 FM; SACRAMENTO, CA; Owner: INFINITY RADIO OPERATIONS INC.)
KBMB (103.5 FM; SACRAMENTO, CA; Owner: DIAMOND RADIO, INC.)
KRCX-FM (99.9 FM; MARYSVILLE, CA; Owner: ENTRAVISION HOLDINGS, LLC)
KEDR (88.1 FM; SACRAMENTO, CA; Owner: FAMILY STATIONS, INC.)
KUIC (95.3 FM; VACAVILLE, CA; Owner: KUIC, INC.)
K211DF (90.1 FM; FOOTHILL FARMS, CA; Owner: YOUR CHRISTIAN COMPANION NETWORK, INC.)
KMJE (101.5 FM; GRIDLEY, CA; Owner: RESULTS RADIO LICENSEE, LLC)
K213BZ (90.5 FM; RICHVALE, CA; Owner: FAMILY STATIONS, INC.)
KKSF-FM1 (103.7 FM; PLEASANTON, ETC., CA; Owner: AMFM RADIO LICENSES, L.L.C.)
KRRE (104.3 FM; DAVIS, CA; Owner: ENTRAVISION HOLDINGS, LLC)
KBLX-FM2 (102.9 FM; PLEASANTON, CA; Owner: ICBC BROADCAST HOLDINGS -CA, INC.)
KSOL-FM3 (98.9 FM; PLEASANTON, CA; Owner: TMS LICENSE CALIFORNIA, INC)
KFRC-FM3 (99.7 FM; WALNUT CREEK, CA; Owner: INFINITY KFRC-FM, INC.)
TV broadcast stations around Rio Linda:
KEZT-CA (Channel 23; SACRAMENTO, CA; Owner: TELEFUTURA SACRAMENTO LLC)
K17EH (Channel 17; EUREKA, CA; Owner: MS COMMUNICATIONS, LLC)
KSAO-LP (Channel 49; SACRAMENTO, CA; Owner: GARY M. COCOLA FAMILY TRUST, GARY M. COCOLA TRUSTEE)
KBTV-LP (Channel 8; SACRAMENTO, CA; Owner: INCISOR COMMUNICATIONS, L.L.C.)
KMUM-CA (Channel 15; SACRAMENTO, CA; Owner: CABALLERO TELEVISION TEXAS, L.L.C.)
K69FB (Channel 69; SACRAMENTO, CA; Owner: TRINITY BROADCASTING NETWORK)
KMMK-LP (Channel 14; SACRAMENTO, CA; Owner: CABALLERO TELEVISION TEXAS, L.L.C.)
KCSO-LP (Channel 33; SACRAMENTO, CA; Owner: SAINTE 51, L.P.)
K22FR (Channel 22; SACRAMENTO, CA; Owner: NATIONAL MINORITY T.V., INC.)
KRJR-LP (Channel 47; SACRAMENTO, CA; Owner: WORD OF GOD FELLOWSHIP, INC.)
KSPX (Channel 29; SACRAMENTO, CA; Owner: PAXSON SACRAMENTO LICENSE, INC.)
KTXL (Channel 40; SACRAMENTO, CA; Owner: CHANNEL 40, INC.)
KQCA (Channel 58; STOCKTON, CA; Owner: KCRA HEARST-ARGYLE TELEVISION, INC.)
KVIE (Channel 6; SACRAMENTO, CA; Owner: KVIE, INC.)
KCRA-TV (Channel 3; SACRAMENTO, CA; Owner: KCRA HEARST-ARGYLE TELEVISION, INC.)
KOVR (Channel 13; STOCKTON, CA; Owner: SCI - SACRAMENTO LICENSEE, LLC)
KXTV (Channel 10; SACRAMENTO, CA; Owner: KXTV, INC.)
KMAX-TV (Channel 31; SACRAMENTO, CA; Owner: UPN STATIONS GROUP INC.)
KUVS (Channel 19; MODESTO, CA; Owner: KUVS LICENSE PARTNERSHIP, G.P.)
K61DW (Channel 61; SACRAMENTO, CA; Owner: DR. W. R. PORTEE)
K27EU (Channel 27; SACRAMENTO, CA; Owner: ABUNDANT LIFE BROADCASTING, INC.)
KSTV-LP (Channel 60; SACRAMENTO, CA; Owner: GARY M. COCOLA FAMILY TRUST, GARY M. COCOLA TRUSTEE)
K27FX (Channel 27; EUREKA, CA; Owner: MS COMMUNICATIONS, LLC)
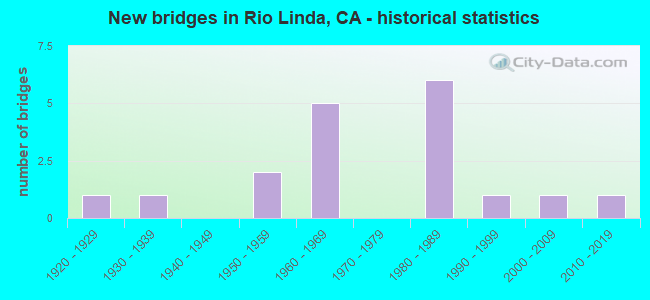
National Bridge Inventory (NBI) Statistics 18 Number of bridges177ft / 53.8m Total length114,762 Total average daily traffic9,555 Total average daily truck traffic152,075 Total future (year 2037) average daily traffic
New bridges - historical statistics
1 1920-1929 1 1930-1939 2 1950-1959 5 1960-1969 6 1980-1989 1 1990-1999 1 2000-2009 1 2010-2019
See full National Bridge Inventory statistics for Rio Linda, CA
FCC Registered Cell Phone Towers: 1 (
See the full list of FCC Registered Cell Phone Towers in Rio Linda )
FCC Registered Antenna Towers: 56 (
See the full list of FCC Registered Antenna Towers )
FCC Registered Commercial Land Mobile Towers: 2
1500 Sw Of The West End Of Delano St (Lat: 38.707111 Lon: -121.476889), Structure height: 152 m, Call Sign: KMK636, Licensee ID: L00462320, Assigned Frequencies: 161.640 MHz, 161.670 MHz, 161.700 MHz, 161.760 MHz, Grant Date: 06/10/1983, Expiration Date: 12/01/1997, Cancellation Date: 09/24/2000, Registrant: American Radio Systems Liclense Corp, 116 Huntington Ave, Boston, MA 02116 606 Delano Street (Lat: 38.707111 Lon: -121.476889), Structure height: 152 m, Call Sign: KPE890, Assigned Frequencies: 450.800 MHz, Grant Date: 05/13/1985, Expiration Date: 12/01/2029, Registrant: Iheartmedia, Inc., 7136 S. Yale Avenue, Suite 501, Tulsa, OK 74136, Phone: (918) 664-4581, Fax: (918) 664-3066, Email:
FCC Registered Private Land Mobile Towers: 1
6241 Rio Linda Blvd (Lat: 38.681861 Lon: -121.458278), Call Sign: WNQI350, Licensee ID: L00124905, Assigned Frequencies: 929.762 MHz, Grant Date: 09/11/1999, Expiration Date: 09/11/2009, Cancellation Date: 01/05/2005, Registrant: Fast Page Inc, Reno, NV 89510, Phone: (775) 358-1100 FCC Registered Broadcast Land Mobile Towers: 3
730 L St (Lat: 38.689056 Lon: -121.448556), Call Sign: KKQ420, Licensee ID: L00543305, Assigned Frequencies: 153.545 MHz, Grant Date: 06/16/2012, Expiration Date: 08/26/2022, Cancellation Date: 10/29/2022, Registrant: Rio Linda County Water District, Rio Linda, CA 95673, Phone: (916) 991-3044 Lat: 38.682194 Lon: -121.480972, Call Sign: WQHI645, Assigned Frequencies: 456.462 MHz, 456.587 MHz, 462.187 MHz, 467.462 MHz, Grant Date: 06/03/2017, Expiration Date: 08/07/2027, Certifier: David Mace, Registrant: Federal Licensing Inc, 1588 Fairfield Road, Gettysburg, PA 17325, Phone: (717) 334-9262, Fax: (717) 334-6440, Email:
Lat: 38.687639 Lon: -121.481500, Call Sign: WRDK550, Assigned Frequencies: 451.662 MHz, 456.662 MHz, 452.637 MHz, 457.637 MHz, 462.412 MHz, Grant Date: 05/20/2019, Expiration Date: 05/20/2029, Certifier: Ron Satterfield, Registrant: Silke Communications, 3 Crow Canyon Road, San Ramon, CA 94583, Phone: (925) 552-1820, Fax: (541) 687-1613, Email:
FCC Registered Microwave Towers: 6 (
See the full list of FCC Registered Microwave Towers in this town )
FCC Registered Paging Towers: 1 (
See the full list of FCC Registered Paging Towers )
FCC Registered Maritime Coast & Aviation Ground Towers: 1 (
See the full list of FCC Registered Maritime Coast & Aviation Ground Towers )
FCC Registered Amateur Radio Licenses: 120 (
See the full list of FCC Registered Amateur Radio Licenses in Rio Linda )
FAA Registered Aircraft Manufacturers and Dealers: 1 (
See the full list of FAA Registered Manufacturers and Dealers in Rio Linda )
FAA Registered Aircraft: 19 (
See the full list of FAA Registered Aircraft )
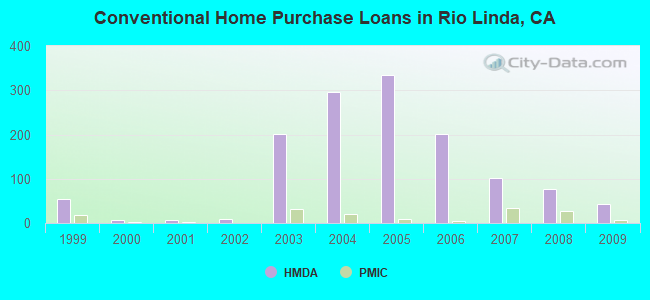
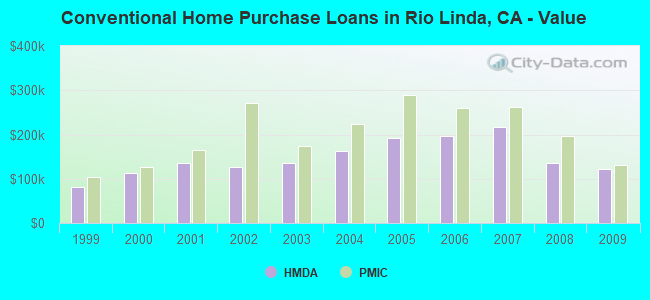
Home Mortgage Disclosure Act Aggregated Statistics For Year 2009(Based on 2 full and 2 partial tracts) A) FHA, FSA/RHS & VA B) Conventional C) Refinancings D) Home Improvement Loans F) Non-occupant Loans on G) Loans On Manufactured Number Average Value Number Average Value Number Average Value Number Average Value Number Average Value Number Average Value
LOANS ORIGINATED 85 $148,283 44 $121,552 92 $151,339 6 $81,105 15 $101,259 4 $101,500 APPLICATIONS APPROVED, NOT ACCEPTED 4 $208,662 8 $171,534 15 $161,383 0 $0 4 $84,585 0 $0 APPLICATIONS DENIED 16 $175,689 17 $131,735 60 $176,592 11 $77,288 10 $131,194 3 $71,000 APPLICATIONS WITHDRAWN 13 $134,909 7 $105,267 27 $180,662 3 $186,097 4 $102,480 1 $59,000 FILES CLOSED FOR INCOMPLETENESS 1 $119,000 3 $121,590 8 $236,308 0 $0 0 $0 0 $0
Aggregated Statistics For Year 2008(Based on 2 full and 2 partial tracts) A) FHA, FSA/RHS & VA B) Conventional C) Refinancings D) Home Improvement Loans F) Non-occupant Loans on G) Loans On Manufactured Number Average Value Number Average Value Number Average Value Number Average Value Number Average Value Number Average Value
LOANS ORIGINATED 65 $167,340 76 $134,558 83 $181,008 12 $61,915 29 $106,107 3 $206,330 APPLICATIONS APPROVED, NOT ACCEPTED 7 $154,964 19 $119,176 20 $222,698 3 $98,127 8 $136,112 1 $70,000 APPLICATIONS DENIED 9 $197,073 35 $163,574 105 $224,393 28 $75,701 18 $140,533 3 $86,247 APPLICATIONS WITHDRAWN 8 $161,091 14 $178,874 43 $204,420 8 $168,010 6 $167,350 1 $20,000 FILES CLOSED FOR INCOMPLETENESS 1 $238,510 6 $173,395 8 $257,584 1 $250,000 2 $93,140 0 $0
Aggregated Statistics For Year 2007(Based on 2 full and 2 partial tracts) A) FHA, FSA/RHS & VA B) Conventional C) Refinancings D) Home Improvement Loans F) Non-occupant Loans on G) Loans On Manufactured Number Average Value Number Average Value Number Average Value Number Average Value Number Average Value Number Average Value
LOANS ORIGINATED 6 $232,457 102 $217,784 242 $207,096 36 $114,834 33 $197,104 4 $181,320 APPLICATIONS APPROVED, NOT ACCEPTED 0 $0 18 $245,392 59 $230,235 8 $88,940 3 $284,760 2 $201,405 APPLICATIONS DENIED 1 $259,740 55 $230,931 231 $242,314 55 $123,919 22 $232,348 5 $280,268 APPLICATIONS WITHDRAWN 0 $0 17 $245,252 98 $223,125 10 $132,404 6 $186,955 1 $241,350 FILES CLOSED FOR INCOMPLETENESS 0 $0 3 $204,740 31 $290,819 1 $213,070 0 $0 2 $154,500
Aggregated Statistics For Year 2006(Based on 2 full and 2 partial tracts) A) FHA, FSA/RHS & VA B) Conventional C) Refinancings D) Home Improvement Loans F) Non-occupant Loans on G) Loans On Manufactured Number Average Value Number Average Value Number Average Value Number Average Value Number Average Value Number Average Value
LOANS ORIGINATED 1 $228,170 201 $196,733 469 $214,165 95 $127,767 52 $186,968 7 $208,210 APPLICATIONS APPROVED, NOT ACCEPTED 0 $0 48 $220,469 89 $231,178 19 $143,413 13 $197,775 5 $181,368 APPLICATIONS DENIED 0 $0 78 $219,048 231 $235,713 74 $116,515 18 $227,081 10 $163,600 APPLICATIONS WITHDRAWN 0 $0 46 $216,283 183 $243,726 21 $152,490 5 $257,450 0 $0 FILES CLOSED FOR INCOMPLETENESS 0 $0 11 $225,350 51 $255,240 4 $106,750 0 $0 1 $118,360
Aggregated Statistics For Year 2005(Based on 2 full and 2 partial tracts) A) FHA, FSA/RHS & VA B) Conventional C) Refinancings D) Home Improvement Loans F) Non-occupant Loans on G) Loans On Manufactured Number Average Value Number Average Value Number Average Value Number Average Value Number Average Value Number Average Value
LOANS ORIGINATED 4 $277,122 334 $192,180 647 $203,736 97 $148,296 66 $207,677 12 $174,832 APPLICATIONS APPROVED, NOT ACCEPTED 1 $280,000 72 $188,414 90 $219,746 22 $118,283 14 $158,457 9 $145,504 APPLICATIONS DENIED 3 $280,817 110 $207,583 290 $208,208 65 $125,263 22 $228,713 9 $152,162 APPLICATIONS WITHDRAWN 1 $312,000 74 $177,539 254 $203,894 40 $160,916 21 $197,232 4 $133,162 FILES CLOSED FOR INCOMPLETENESS 0 $0 20 $192,416 83 $216,251 6 $198,145 6 $197,973 3 $218,333
Aggregated Statistics For Year 2004(Based on 2 full and 2 partial tracts) A) FHA, FSA/RHS & VA B) Conventional C) Refinancings D) Home Improvement Loans F) Non-occupant Loans on G) Loans On Manufactured Number Average Value Number Average Value Number Average Value Number Average Value Number Average Value Number Average Value
LOANS ORIGINATED 11 $214,265 296 $162,107 636 $168,540 86 $115,274 78 $156,421 14 $147,624 APPLICATIONS APPROVED, NOT ACCEPTED 2 $256,500 52 $152,194 115 $175,467 13 $94,433 8 $150,665 5 $173,740 APPLICATIONS DENIED 5 $208,488 105 $164,089 232 $167,836 71 $83,488 16 $160,467 14 $120,902 APPLICATIONS WITHDRAWN 0 $0 46 $172,850 249 $168,007 22 $122,595 13 $199,166 3 $153,430 FILES CLOSED FOR INCOMPLETENESS 0 $0 11 $156,991 93 $167,603 4 $61,862 2 $247,470 1 $138,750
Aggregated Statistics For Year 2003(Based on 2 full and 2 partial tracts) A) FHA, FSA/RHS & VA B) Conventional C) Refinancings D) Home Improvement Loans E) Loans on Dwellings For 5+ Families F) Non-occupant Loans on Number Average Value Number Average Value Number Average Value Number Average Value Number Average Value Number Average Value
LOANS ORIGINATED 50 $179,783 201 $135,133 838 $134,889 40 $36,429 1 $650,000 71 $126,645 APPLICATIONS APPROVED, NOT ACCEPTED 6 $188,072 20 $148,825 115 $144,781 11 $30,633 0 $0 11 $134,495 APPLICATIONS DENIED 9 $177,889 37 $129,765 257 $141,568 34 $26,990 0 $0 18 $147,536 APPLICATIONS WITHDRAWN 8 $176,510 39 $135,282 247 $133,319 4 $82,860 0 $0 11 $132,879 FILES CLOSED FOR INCOMPLETENESS 2 $177,500 5 $140,660 39 $144,448 0 $0 0 $0 1 $146,390
Aggregated Statistics For Year 2002(Based on 1 partial tract) A) FHA, FSA/RHS & VA B) Conventional C) Refinancings D) Home Improvement Loans F) Non-occupant Loans on Number Average Value Number Average Value Number Average Value Number Average Value Number Average Value
LOANS ORIGINATED 2 $138,445 9 $127,317 23 $136,490 1 $39,500 2 $105,080 APPLICATIONS APPROVED, NOT ACCEPTED 0 $0 4 $74,602 4 $95,170 0 $0 0 $0 APPLICATIONS DENIED 0 $0 4 $108,825 11 $148,434 2 $34,525 1 $98,740 APPLICATIONS WITHDRAWN 0 $0 1 $151,730 9 $142,752 0 $0 0 $0 FILES CLOSED FOR INCOMPLETENESS 0 $0 0 $0 2 $116,245 0 $0 0 $0
Aggregated Statistics For Year 2001(Based on 1 partial tract) A) FHA, FSA/RHS & VA B) Conventional C) Refinancings D) Home Improvement Loans F) Non-occupant Loans on Number Average Value Number Average Value Number Average Value Number Average Value Number Average Value
LOANS ORIGINATED 1 $144,640 6 $135,995 22 $120,345 1 $6,270 2 $98,540 APPLICATIONS APPROVED, NOT ACCEPTED 0 $0 2 $112,570 4 $123,398 0 $0 0 $0 APPLICATIONS DENIED 0 $0 2 $122,510 13 $122,485 1 $29,960 1 $155,680 APPLICATIONS WITHDRAWN 0 $0 2 $110,595 6 $118,063 1 $16,750 0 $0 FILES CLOSED FOR INCOMPLETENESS 0 $0 0 $0 2 $142,465 0 $0 0 $0
Aggregated Statistics For Year 2000(Based on 1 partial tract) A) FHA, FSA/RHS & VA B) Conventional C) Refinancings D) Home Improvement Loans F) Non-occupant Loans on Number Average Value Number Average Value Number Average Value Number Average Value Number Average Value
LOANS ORIGINATED 3 $100,197 6 $113,682 6 $91,458 1 $44,130 1 $66,330 APPLICATIONS APPROVED, NOT ACCEPTED 0 $0 1 $119,310 1 $136,740 1 $22,340 0 $0 APPLICATIONS DENIED 0 $0 2 $92,550 4 $81,788 1 $44,810 1 $56,930 APPLICATIONS WITHDRAWN 0 $0 1 $111,960 3 $83,673 0 $0 0 $0 FILES CLOSED FOR INCOMPLETENESS 0 $0 0 $0 2 $77,500 0 $0 0 $0
Aggregated Statistics For Year 1999(Based on 1 full and 1 partial tracts) A) FHA, FSA/RHS & VA B) Conventional C) Refinancings D) Home Improvement Loans E) Loans on Dwellings For 5+ Families F) Non-occupant Loans on Number Average Value Number Average Value Number Average Value Number Average Value Number Average Value Number Average Value
LOANS ORIGINATED 80 $98,545 55 $80,971 147 $84,892 29 $27,559 2 $98,720 21 $68,584 APPLICATIONS APPROVED, NOT ACCEPTED 2 $102,525 4 $117,662 46 $79,030 14 $27,054 0 $0 4 $83,445 APPLICATIONS DENIED 7 $100,769 16 $81,887 100 $71,814 33 $24,920 2 $85,395 5 $43,102 APPLICATIONS WITHDRAWN 12 $109,091 16 $98,286 66 $89,445 2 $34,550 2 $168,810 3 $59,560 FILES CLOSED FOR INCOMPLETENESS 2 $105,630 3 $102,767 24 $88,651 0 $0 0 $0 1 $99,890
Detailed HMDA statistics for the following Tracts:
0072.02
, 0072.07 , 0072.08 , 0072.09
Private Mortgage Insurance Companies Aggregated Statistics For Year 2009(Based on 2 full and 2 partial tracts) A) Conventional Number Average Value
LOANS ORIGINATED 6 $130,170 APPLICATIONS APPROVED, NOT ACCEPTED 1 $207,120 APPLICATIONS DENIED 0 $0 APPLICATIONS WITHDRAWN 0 $0 FILES CLOSED FOR INCOMPLETENESS 0 $0
Aggregated Statistics For Year 2008(Based on 2 full and 2 partial tracts) A) Conventional B) Refinancings C) Non-occupant Loans on Number Average Value Number Average Value Number Average Value
LOANS ORIGINATED 27 $197,331 5 $237,574 2 $171,500 APPLICATIONS APPROVED, NOT ACCEPTED 14 $266,626 5 $288,426 1 $238,000 APPLICATIONS DENIED 2 $142,000 1 $332,990 0 $0 APPLICATIONS WITHDRAWN 1 $191,690 0 $0 0 $0 FILES CLOSED FOR INCOMPLETENESS 2 $208,000 1 $288,000 2 $271,000
Aggregated Statistics For Year 2007(Based on 2 full and 2 partial tracts) A) Conventional B) Refinancings C) Non-occupant Loans on Number Average Value Number Average Value Number Average Value
LOANS ORIGINATED 34 $261,323 20 $311,032 1 $244,190 APPLICATIONS APPROVED, NOT ACCEPTED 4 $279,098 7 $302,134 0 $0 APPLICATIONS DENIED 0 $0 0 $0 0 $0 APPLICATIONS WITHDRAWN 1 $409,590 1 $375,810 0 $0 FILES CLOSED FOR INCOMPLETENESS 0 $0 0 $0 0 $0
Aggregated Statistics For Year 2006(Based on 2 full and 2 partial tracts) A) Conventional B) Refinancings Number Average Value Number Average Value
LOANS ORIGINATED 4 $259,100 11 $303,395 APPLICATIONS APPROVED, NOT ACCEPTED 0 $0 7 $309,000 APPLICATIONS DENIED 0 $0 0 $0 APPLICATIONS WITHDRAWN 0 $0 1 $293,000 FILES CLOSED FOR INCOMPLETENESS 0 $0 0 $0
Aggregated Statistics For Year 2005(Based on 2 full and 2 partial tracts) A) Conventional B) Refinancings C) Non-occupant Loans on Number Average Value Number Average Value Number Average Value
LOANS ORIGINATED 10 $289,909 11 $287,553 2 $251,500 APPLICATIONS APPROVED, NOT ACCEPTED 3 $200,757 9 $267,283 0 $0 APPLICATIONS DENIED 0 $0 0 $0 0 $0 APPLICATIONS WITHDRAWN 0 $0 1 $372,200 1 $286,000 FILES CLOSED FOR INCOMPLETENESS 0 $0 0 $0 0 $0
Aggregated Statistics For Year 2004(Based on 2 full and 2 partial tracts) A) Conventional B) Refinancings C) Non-occupant Loans on D) Loans On Manufactured Number Average Value Number Average Value Number Average Value Number Average Value
LOANS ORIGINATED 21 $223,367 19 $235,055 3 $197,840 1 $187,690 APPLICATIONS APPROVED, NOT ACCEPTED 3 $170,450 10 $192,621 1 $162,000 0 $0 APPLICATIONS DENIED 0 $0 0 $0 0 $0 0 $0 APPLICATIONS WITHDRAWN 0 $0 2 $227,000 0 $0 0 $0 FILES CLOSED FOR INCOMPLETENESS 11 $284,455 5 $223,400 0 $0 0 $0
Aggregated Statistics For Year 2003(Based on 2 full and 2 partial tracts) A) Conventional B) Refinancings C) Non-occupant Loans on Number Average Value Number Average Value Number Average Value
LOANS ORIGINATED 31 $173,753 36 $165,509 5 $135,532 APPLICATIONS APPROVED, NOT ACCEPTED 8 $163,455 20 $159,794 1 $126,000 APPLICATIONS DENIED 0 $0 1 $190,690 0 $0 APPLICATIONS WITHDRAWN 0 $0 3 $181,960 0 $0 FILES CLOSED FOR INCOMPLETENESS 0 $0 0 $0 0 $0
Aggregated Statistics For Year 2002(Based on 1 partial tract) A) Conventional B) Refinancings Number Average Value Number Average Value
LOANS ORIGINATED 1 $270,770 1 $186,190 APPLICATIONS APPROVED, NOT ACCEPTED 0 $0 1 $108,820 APPLICATIONS DENIED 0 $0 0 $0 APPLICATIONS WITHDRAWN 0 $0 0 $0 FILES CLOSED FOR INCOMPLETENESS 0 $0 0 $0
Aggregated Statistics For Year 2001(Based on 1 partial tract) A) Conventional B) Refinancings Number Average Value Number Average Value
LOANS ORIGINATED 2 $165,075 1 $201,300 APPLICATIONS APPROVED, NOT ACCEPTED 0 $0 1 $108,420 APPLICATIONS DENIED 0 $0 0 $0 APPLICATIONS WITHDRAWN 0 $0 0 $0 FILES CLOSED FOR INCOMPLETENESS 0 $0 0 $0
Aggregated Statistics For Year 2000(Based on 1 partial tract) A) Conventional B) Refinancings Number Average Value Number Average Value
LOANS ORIGINATED 2 $127,550 1 $107,050 APPLICATIONS APPROVED, NOT ACCEPTED 1 $97,110 0 $0 APPLICATIONS DENIED 0 $0 0 $0 APPLICATIONS WITHDRAWN 0 $0 0 $0 FILES CLOSED FOR INCOMPLETENESS 0 $0 0 $0
Aggregated Statistics For Year 1999(Based on 1 full and 1 partial tracts) A) Conventional B) Refinancings C) Non-occupant Loans on Number Average Value Number Average Value Number Average Value
LOANS ORIGINATED 18 $104,469 16 $98,171 5 $58,964 APPLICATIONS APPROVED, NOT ACCEPTED 3 $155,597 3 $107,797 0 $0 APPLICATIONS DENIED 0 $0 0 $0 0 $0 APPLICATIONS WITHDRAWN 0 $0 0 $0 0 $0 FILES CLOSED FOR INCOMPLETENESS 1 $122,610 1 $95,760 0 $0
Detailed PMIC statistics for the following Tracts:
0072.02
, 0072.07 , 0072.08 , 0072.09
Most common first names in Rio Linda, CA among deceased individuals Name Count Lived (average)
John 88 72.1 years James 66 68.2 years William 62 71.0 years Robert 60 68.6 years Mary 47 75.6 years George 38 73.4 years Charles 37 67.7 years Edward 27 64.9 years Joseph 27 68.3 years Walter 24 73.9 years
Most common last names in Rio Linda, CA among deceased individuals Last name Count Lived (average)
Smith 33 68.7 years Brown 26 72.7 years Johnson 24 81.2 years Green 20 69.3 years Williams 18 75.6 years Jones 16 72.4 years Clark 15 75.1 years Davis 15 70.4 years Cox 12 69.2 years Wilson 12 73.3 years
Rio Linda compared to California state average:
Median house value below state average. Renting percentage below state average. Length of stay since moving in significantly above state average. Percentage of population with a bachelor's degree or higher below state average.
#60 on the list of "Top 101 cities with the most residents born in Armenia (population 500+)"
#12 on the list of "Top 101 counties with the highest percentage of residents that drank alcohol in the past 30 days"
#18 on the list of "Top 101 counties with the highest ground withdrawal of fresh water for public supply"
#19 on the list of "Top 101 counties with the highest total withdrawal of fresh water for public supply"
#23 on the list of "Top 101 counties with the most Other adherents"
#25 on the list of "Top 101 counties with the most Other congregations (pop. 50,000+)"
Top Patent Applicants
Russell Tuckerman (2)
Susan Cook (2)
Randy R. Wilson (2)
Martin P. Johnson (2)
Robert Shane Lair (1)
Joseph Terefe (1)
Toby Gal-Yun Chan (1)
Walter W. White (1)
Total of 11 patent applications in 2008-2024.


 Recent articles from our blog. Our writers, many of them Ph.D. graduates or candidates, create easy-to-read articles on a wide variety of topics.

 (7.1 miles
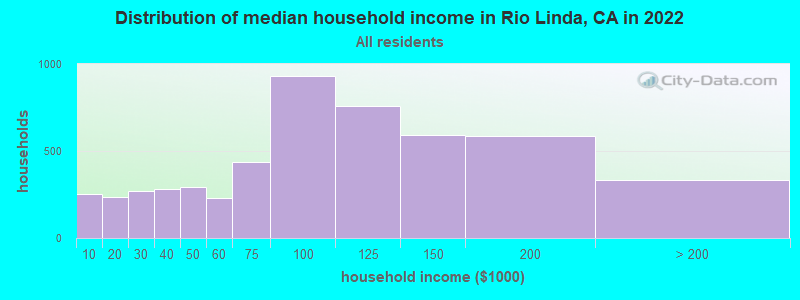


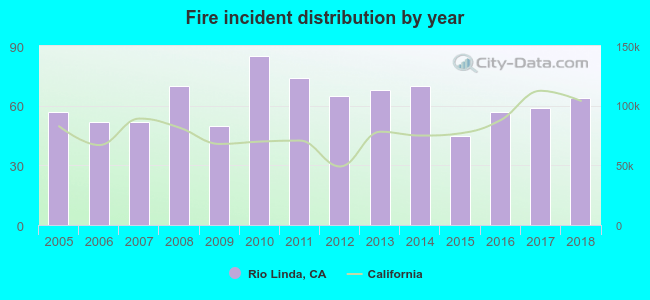 Based on the data from the years 2005 - 2018 the average number of fires per year is 62. The highest number of reported fire incidents - 85 took place in 2010, and the least - 45 in 2015. The data has a rising trend.
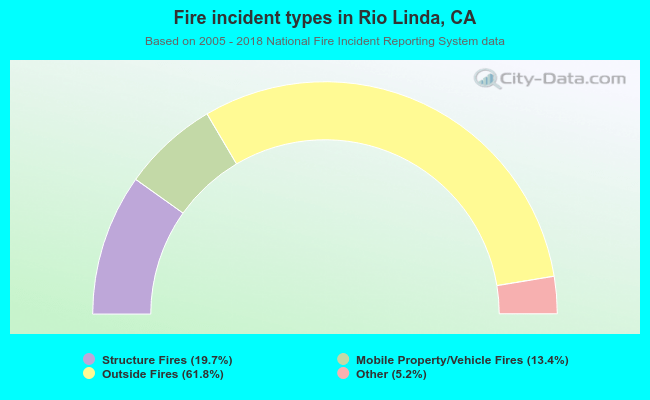 When looking into fire subcategories, the most incidents belonged to: Outside Fires (61.8%), and Structure Fires (19.7%).