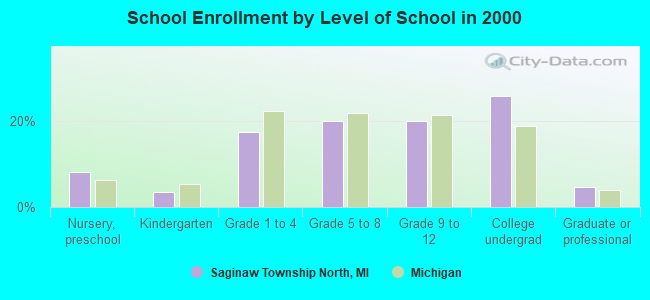
Saginaw Township North, Michigan
Submit your own pictures of this place and show them to the world
- OSM Map
- General Map
- Google Map
- MSN Map
| Males: 11,165 | |
| Females: 12,885 |
| Median resident age: | 41.2 years |
| Michigan median age: | 35.5 years |
Zip codes: 48603.
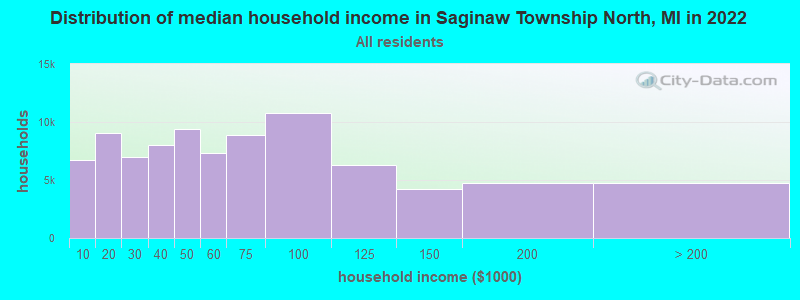
| Saginaw Township North: | $58,983 |
| MI: | $66,986 |
Estimated per capita income in 2022: $41,177 (it was $24,466 in 2000)
Saginaw Township North CDP income, earnings, and wages data
Estimated median house or condo value in 2022: $197,366 (it was $114,300 in 2000)
| Saginaw Township North: | $197,366 |
| MI: | $224,400 |
Mean prices in 2022: all housing units: $169,394; detached houses: $171,549; townhouses or other attached units: $213,146; in 2-unit structures: $165,772; in 3-to-4-unit structures: $154,505; in 5-or-more-unit structures: $150,327; mobile homes: $96,214
Saginaw Township North, MI residents, houses, and apartments details
Detailed information about poverty and poor residents in Saginaw Township North, MI
Compare current foreclosures near Saginaw Township North, MI:


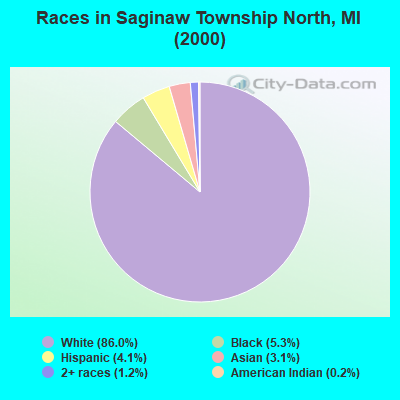
- 21,50186.0%White alone
- 1,3195.3%Black alone
- 1,0234.1%Hispanic
- 7683.1%Asian alone
- 3071.2%Two or more races
- 570.2%American Indian alone
- 190.08%Other race alone
Races in Saginaw Township North detailed stats: ancestries, foreign born residents, place of birth
 Recent articles from our blog. Our writers, many of them Ph.D. graduates or candidates, create easy-to-read articles on a wide variety of topics.

 | Possible move from Texas to Saginaw area (52 replies) |
| Michigan unemployment rates 2013 (3 replies) |
| Which Michigan counties are growing, which aren't (11 replies) |
Latest news from Saginaw Township North, MI collected exclusively by city-data.com from local newspapers, TV, and radio stations
Ancestries: German (34.8%), Polish (11.4%), Irish (10.8%), English (10.5%), French (8.3%), United States (3.9%).
Current Local Time: EST time zone
Land area: 13.5 square miles.
Population density: 1,782 people per square mile (low).
1,244 residents are foreign born (2.9% Asia, 1.1% Europe).
| This place: | 5.0% |
| Michigan: | 5.3% |
| Saginaw Township North CDP: | 1.3% ($1,453) |
| Michigan: | 1.3% ($1,461) |
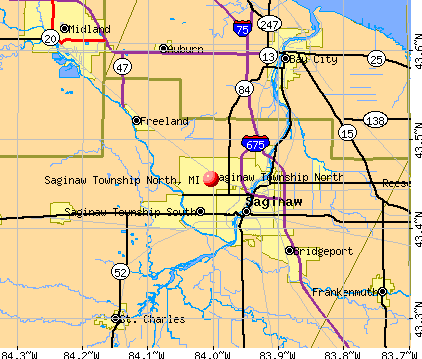
Nearest city with pop. 50,000+: Saginaw, MI  (3.5 miles , pop. 61,799).
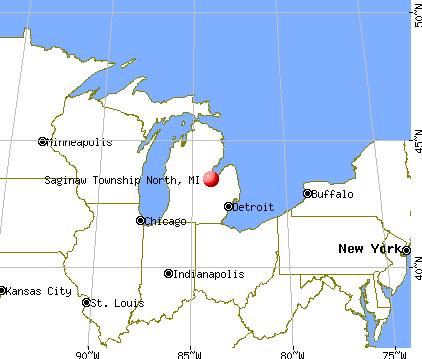
Nearest city with pop. 200,000+: Detroit, MI (86.8 miles , pop. 951,270).
Nearest city with pop. 1,000,000+: Chicago, IL (217.8 miles , pop. 2,896,016).
Nearest cities:
), ), ), ), )Latitude: 43.46 N, Longitude: 84.00 W
Daytime population change due to commuting: +2,720 (+10.9%)
Workers who live and work in this place: 2,969 (25.7%)
Area code commonly used in this area: 989
| Here: | 4.6% |
| Michigan: | 3.5% |
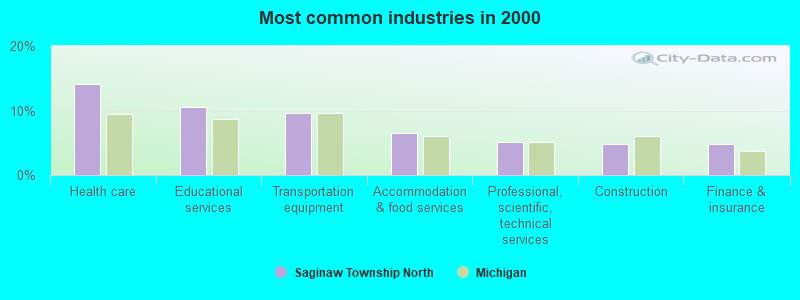
- Health care (14.2%)
- Educational services (10.5%)
- Transportation equipment (9.7%)
- Accommodation & food services (6.4%)
- Professional, scientific, technical services (5.2%)
- Construction (4.8%)
- Finance & insurance (4.7%)
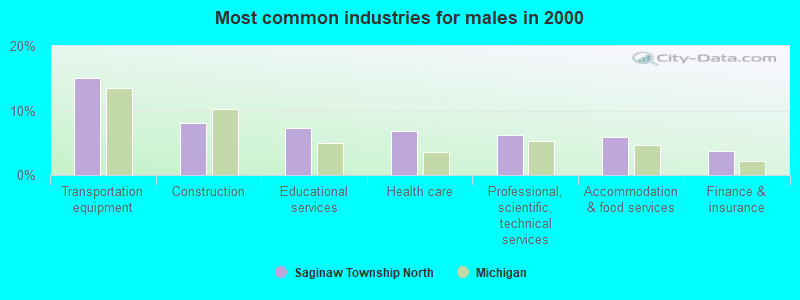
- Transportation equipment (15.1%)
- Construction (8.0%)
- Educational services (7.4%)
- Health care (6.9%)
- Professional, scientific, technical services (6.2%)
- Accommodation & food services (5.9%)
- Finance & insurance (3.7%)
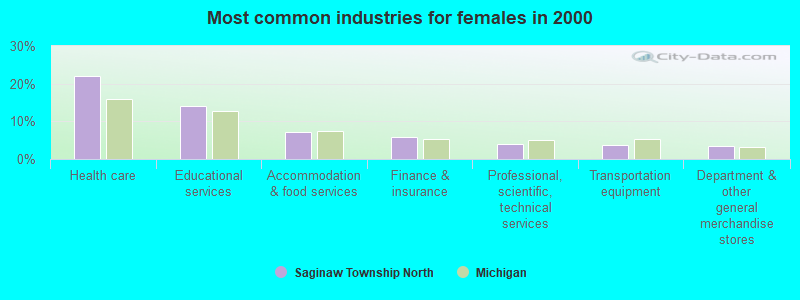
- Health care (22.0%)
- Educational services (14.0%)
- Accommodation & food services (7.1%)
- Finance & insurance (5.9%)
- Professional, scientific, technical services (4.0%)
- Transportation equipment (3.8%)
- Department & other general merchandise stores (3.4%)
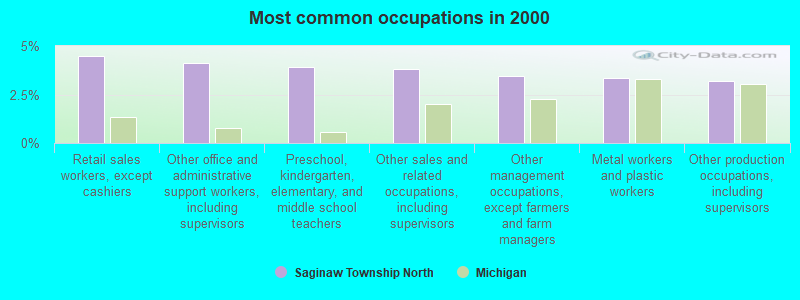
- Retail sales workers, except cashiers (4.5%)
- Other office and administrative support workers, including supervisors (4.1%)
- Preschool, kindergarten, elementary, and middle school teachers (3.9%)
- Other sales and related occupations, including supervisors (3.8%)
- Other management occupations, except farmers and farm managers (3.5%)
- Metal workers and plastic workers (3.3%)
- Other production occupations, including supervisors (3.2%)
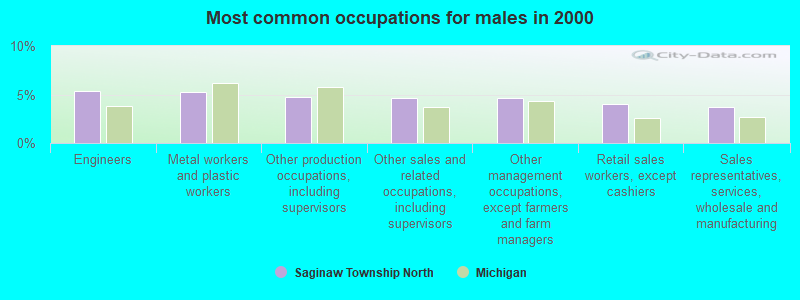
- Engineers (5.4%)
- Metal workers and plastic workers (5.3%)
- Other production occupations, including supervisors (4.7%)
- Other sales and related occupations, including supervisors (4.6%)
- Other management occupations, except farmers and farm managers (4.6%)
- Retail sales workers, except cashiers (4.0%)
- Sales representatives, services, wholesale and manufacturing (3.7%)
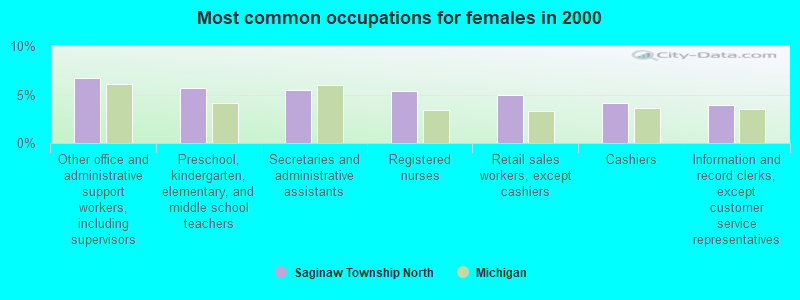
- Other office and administrative support workers, including supervisors (6.7%)
- Preschool, kindergarten, elementary, and middle school teachers (5.7%)
- Secretaries and administrative assistants (5.5%)
- Registered nurses (5.4%)
- Retail sales workers, except cashiers (5.0%)
- Cashiers (4.1%)
- Information and record clerks, except customer service representatives (3.9%)
Average climate in Saginaw Township North, Michigan
Based on data reported by over 4,000 weather stations


(lower is better)
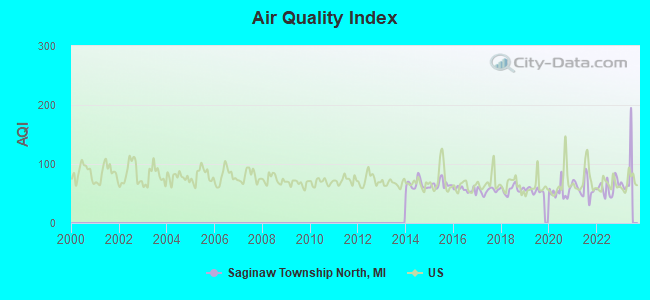
Air Quality Index (AQI) level in 2022 was 60.6. This is about average.
| City: | 60.6 |
| U.S.: | 72.6 |
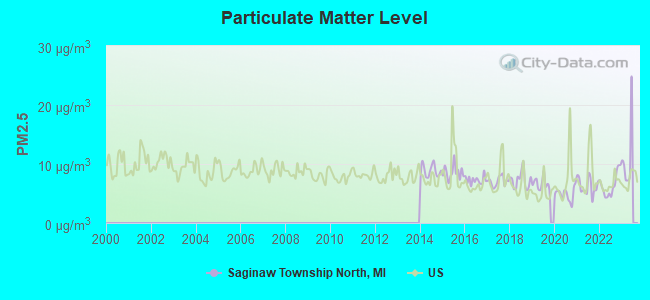
Particulate Matter (PM2.5) [µg/m3] level in 2022 was 6.47. This is better than average. Closest monitor was 4.1 miles away from the city center.
| City: | 6.47 |
| U.S.: | 8.11 |
Tornado activity:
Saginaw Township North-area historical tornado activity is slightly above Michigan state average. It is 23% greater than the overall U.S. average.
On 6/8/1953, a category F5 (max. wind speeds 261-318 mph) tornado 25.8 miles away from the Saginaw Township North place center killed 116 people and injured 844 people and caused between $5,000,000 and $50,000,000 in damages.
On 6/12/1984, a category F3 (max. wind speeds 158-206 mph) tornado 9.4 miles away from the place center injured 2 people and caused between $500,000 and $5,000,000 in damages.
Earthquake activity:
Saginaw Township North-area historical earthquake activity is significantly above Michigan state average. It is 52% smaller than the overall U.S. average.On 9/25/1998 at 19:52:52, a magnitude 5.2 (4.8 MB, 4.3 MS, 5.2 LG, 4.5 MW, Depth: 3.1 mi, Class: Moderate, Intensity: VI - VII) earthquake occurred 228.7 miles away from Saginaw Township North center
On 1/31/1986 at 16:46:43, a magnitude 5.0 (5.0 MB) earthquake occurred 193.5 miles away from Saginaw Township North center
On 5/2/2015 at 16:23:07, a magnitude 4.2 (4.2 MW, Depth: 2.8 mi, Class: Light, Intensity: IV - V) earthquake occurred 111.1 miles away from the city center
On 7/12/1986 at 08:19:37, a magnitude 4.5 (4.5 MB) earthquake occurred 202.7 miles away from Saginaw Township North center
On 7/27/1980 at 18:52:21, a magnitude 5.2 (5.1 MB, 4.7 MS, 5.0 UK, 5.2 UK) earthquake occurred 363.2 miles away from the city center
On 4/18/2008 at 09:36:59, a magnitude 5.4 (5.1 MB, 4.8 MS, 5.4 MW, 5.2 MW) earthquake occurred 401.0 miles away from the city center
Magnitude types: regional Lg-wave magnitude (LG), body-wave magnitude (MB), surface-wave magnitude (MS), moment magnitude (MW)
Natural disasters:
The number of natural disasters in Saginaw County (16) is near the US average (15).Major Disasters (Presidential) Declared: 11
Emergencies Declared: 3
Causes of natural disasters: Floods: 10, Storms: 10, Tornadoes: 4, Winds: 2, Blizzard: 1, Hurricane: 1, Snowstorm: 1, Winter Storm: 1, Other: 1 (Note: some incidents may be assigned to more than one category).
Hospitals and medical centers near Saginaw Township North:
- TOTAL CARE HOME HEALTH CARE, INC (Home Health Center, about 1 miles away; SAGINAW, MI)
- SAGINAW SENIOR CARE AND REHAB CENTER, L L C (Nursing Home, about 1 miles away; SAGINAW, MI)
- NATIONAL HOME HEALTH CARE AGENCY (Home Health Center, about 2 miles away; SAGINAW, MI)
- MAGNUMCARE OF SAGINAW, LLC (Nursing Home, about 2 miles away; SAGINAW, MI)
- DORSY HOME HEALTH CARE, INC (Home Health Center, about 2 miles away; SAGINAW, MI)
- A D HEALTH CARE PROFESSIONAL (Home Health Center, about 2 miles away; SAGINAW, MI)
- GENTIVA HEALTH SERVICES (Home Health Center, about 2 miles away; SAGINAW, MI)
Colleges/universities with over 2000 students nearest to Saginaw Township North:
- Saginaw Valley State University (about 7 miles; University Center, MI; Full-time enrollment: 9,021)
- Delta College (about 8 miles; University Center, MI; FT enrollment: 7,480)
- Northwood University-Michigan (about 19 miles; Midland, MI; FT enrollment: 2,763)
- Baker College of Owosso (about 34 miles; Owosso, MI; FT enrollment: 2,081)
- Kettering University (about 34 miles; Flint, MI; FT enrollment: 2,044)
- University of Michigan-Flint (about 35 miles; Flint, MI; FT enrollment: 6,284)
- Mott Community College (about 35 miles; Flint, MI; FT enrollment: 7,394)
Points of interest:
Notable locations in Saginaw Township North: Pleasant Valley Golf Course (A), Saginaw Charter Township Fire Department 2 (B), Saginaw Charter Township Fire Department 1 (C), Saginaw Township Police Department (D). Display/hide their locations on the map
Shopping Center: Fashion Square Mall (1). Display/hide its location on the map
Churches in Saginaw Township North include: McCarty Road Church (A), Bethany Church (B), Church of God (C), Church of Jesus Christ of Latter Day Saints (D), Saginaw Wesleyan Church (E), Saginaw Bay Church of Christ (F), Faith Baptist Church (G), Gloria Dei Lutheran Church (H), Saint Demetrios Church (I). Display/hide their locations on the map
Cemeteries: Saginaw County Poor Farm Cemetery (1), Saginaw Township Cemetery (2), Bethlehem Cemetery (3). Display/hide their locations on the map
Lake: Haithco Lake (A). Display/hide its location on the map
Parks in Saginaw Township North include: William H Haithco Recreation Area (1), Can-Amera Park (2), Saginaw Township Soccer Complex (3), Briarwood Park (4), Berberovich Park (5), North Little League Park (6), George Olson Recreation Complex (7). Display/hide their locations on the map
| This place: | 2.3 people |
| Michigan: | 2.6 people |
| This place: | 61.4% |
| Whole state: | 68.5% |
| This place: | 3.8% |
| Whole state: | 5.3% |
Likely homosexual households (counted as self-reported same-sex unmarried-partner households)
- Lesbian couples: 0.1% of all households
- Gay men: 0.1% of all households
| This place: | 7.1% |
| Whole state: | 10.5% |
| This place: | 3.2% |
| Whole state: | 4.8% |
People in group quarters in Saginaw Township North in 2000:
- 375 people in nursing homes
- 344 people in other noninstitutional group quarters
- 54 people in short-term care, detention or diagnostic centers for delinquent children
- 21 people in homes for the mentally ill
- 12 people in other group homes
- 6 people in religious group quarters
- 4 people in other nonhousehold living situations
For population 15 years and over in Saginaw Township North:
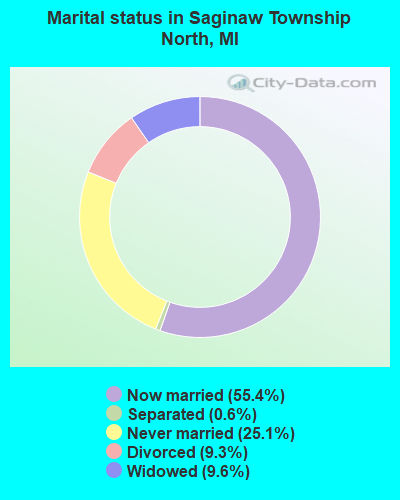
- Never married: 25.1%
- Now married: 55.4%
- Separated: 0.6%
- Widowed: 9.6%
- Divorced: 9.3%
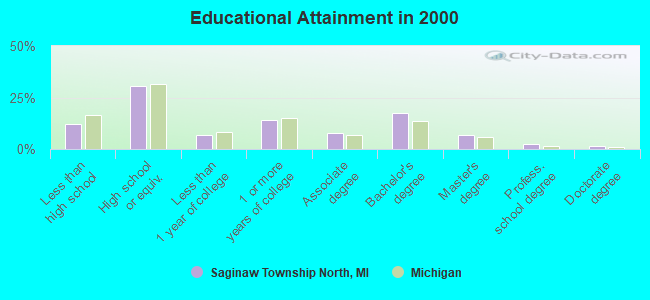
For population 25 years and over in Saginaw Township North:
- High school or higher: 87.7%
- Bachelor's degree or higher: 28.0%
- Graduate or professional degree: 10.7%
- Unemployed: 5.2%
- Mean travel time to work (commute): 19.2 minutes
| Here: | 10.9 |
| Michigan average: | 11.3 |
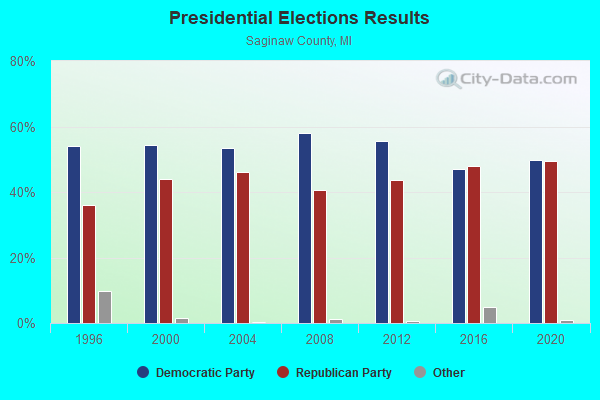
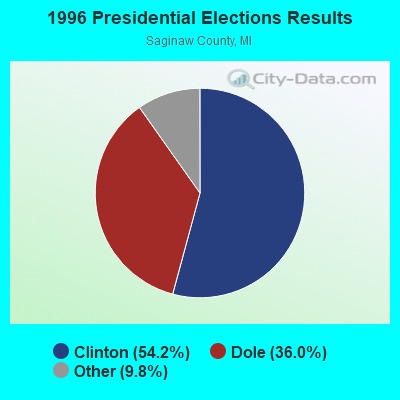
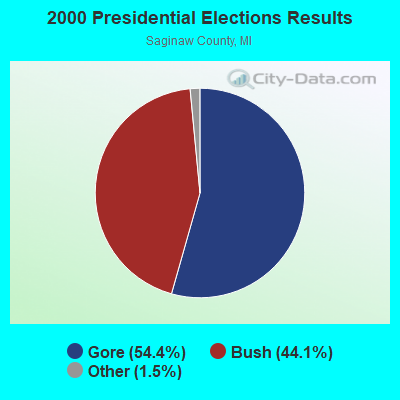
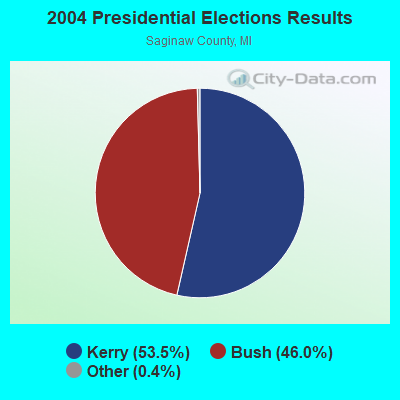
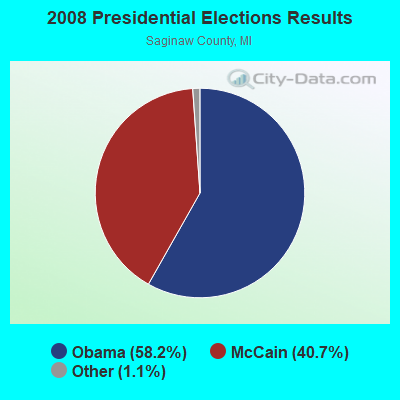
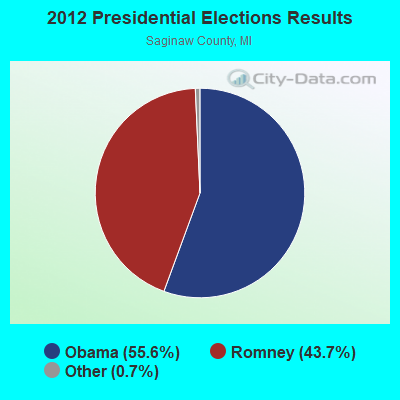
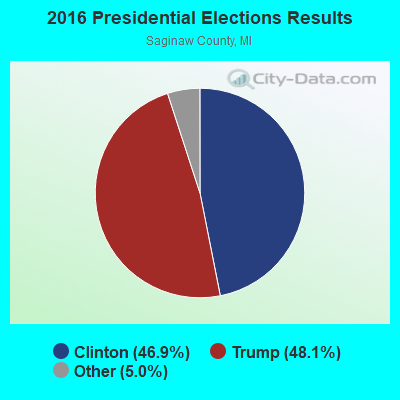
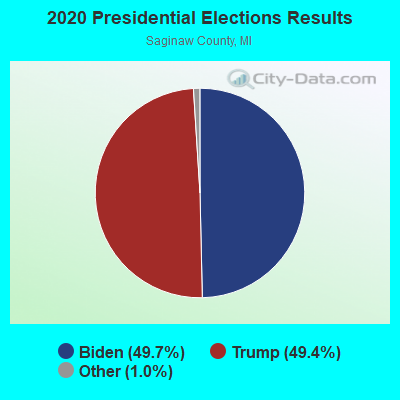
Graphs represent county-level data. Detailed 2008 Election Results
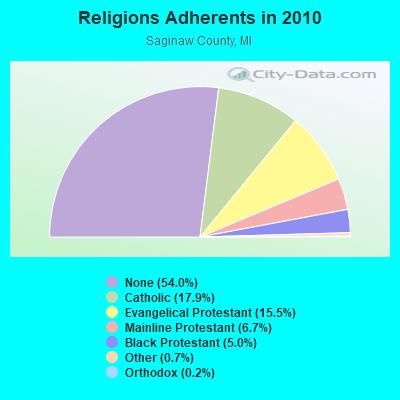
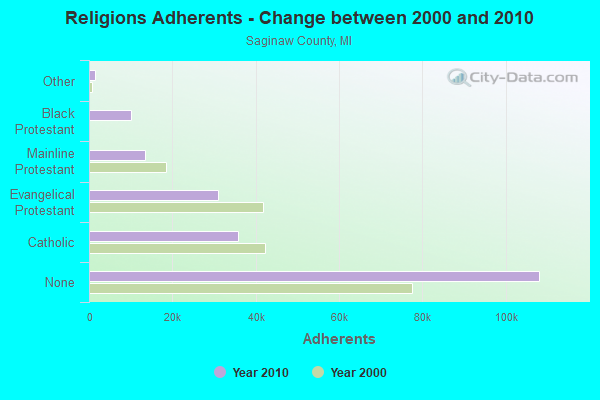
Religion statistics for Saginaw Township North, MI (based on Saginaw County data)
| Religion | Adherents | Congregations |
|---|---|---|
| Catholic | 35,873 | 29 |
| Evangelical Protestant | 30,990 | 102 |
| Mainline Protestant | 13,477 | 47 |
| Black Protestant | 10,053 | 28 |
| Other | 1,323 | 9 |
| Orthodox | 350 | 1 |
| None | 108,103 | - |
Food Environment Statistics:
| This county: | 2.08 / 10,000 pop. |
| State: | 2.34 / 10,000 pop. |
| Saginaw County: | 0.20 / 10,000 pop. |
| Michigan: | 0.18 / 10,000 pop. |
| Saginaw County: | 2.22 / 10,000 pop. |
| State: | 1.52 / 10,000 pop. |
| Saginaw County: | 2.72 / 10,000 pop. |
| Michigan: | 2.99 / 10,000 pop. |
| Here: | 4.89 / 10,000 pop. |
| Michigan: | 6.80 / 10,000 pop. |
| This county: | 10.6% |
| Michigan: | 9.7% |
| This county: | 33.7% |
| Michigan: | 29.7% |
| Here: | 14.0% |
| Michigan: | 13.4% |
Strongest AM radio stations in Saginaw Township North:
- WMAX (1440 AM; 5 kW; BAY CITY, MI; Owner: AM MEDIA SERVICES, L.L.C.)
- WSGW (790 AM; 5 kW; SAGINAW, MI; Owner: NM LICENSING LLC)
- WOAP (1080 AM; 50 kW; OWOSSO, MI)
- WSAM (1400 AM; 1 kW; SAGINAW, MI; Owner: THE MACDONALD BROADCASTING COMPANY)
- WKNX (1250 AM; 1 kW; BAY CITY, MI; Owner: FRANKENMUTH BROADCASTING, INC.)
- WWJ (950 AM; 50 kW; DETROIT, MI; Owner: INFINITY BROADCASTING OPERATIONS, INC.)
- WJR (760 AM; 50 kW; DETROIT, MI; Owner: ABC, INC.)
- WXYT (1270 AM; 50 kW; DETROIT, MI; Owner: INFINITY BROADCASTING CORP. OF DETROIT)
- WFDF (910 AM; 50 kW; FLINT, MI; Owner: ABC, INC.)
- WCHB (1200 AM; 50 kW; TAYLOR, MI; Owner: RADIO ONE OF DETROIT, LLC)
- WDFN (1130 AM; 50 kW; DETROIT, MI; Owner: AMFM RADIO LICENSES, L.L.C.)
- WTCM (580 AM; 35 kW; TRAVERSE CITY, MI; Owner: WTCM RADIO, INC.)
- WKAR (870 AM; daytime; 10 kW; EAST LANSING, MI; Owner: MICHIGAN STATE UNIVERSITY)
Strongest FM radio stations in Saginaw Township North:
- WGER (106.3 FM; SAGINAW, MI; Owner: NM LICENSING LLC)
- WKCQ (98.1 FM; SAGINAW, MI; Owner: THE MACDONALD BROADCASTING COMPANY)
- WIOG (102.5 FM; BAY CITY, MI; Owner: CITADEL BROADCASTING COMPANY)
- WILZ (104.5 FM; SAGINAW, MI; Owner: CITADEL BROADCASTING COMPANY)
- WHNN (96.1 FM; BAY CITY, MI; Owner: CITADEL BROADCASTING COMPANY)
- WTCF (100.5 FM; CARROLLTON, MI; Owner: NM LICENSING LLC)
- WTLZ (107.1 FM; SAGINAW, MI; Owner: NM LICENSING LLC)
- WUGN (99.7 FM; MIDLAND, MI; Owner: FAMILY LIFE BROADCASTING SYSTEM, INC)
- WEEG (97.3 FM; ESSEXVILLE, MI; Owner: THE MACDONALD BROADCASTING COMPANY)
- WUCX-FM (90.1 FM; BAY CITY, MI; Owner: CENTRAL MICHIGAN UNIVERSITY)
- WTRK (89.1 FM; BAY CITY, MI; Owner: BEYOND THE BAY MEDIA GROUP)
- WCEN-FM (94.5 FM; HEMLOCK, MI; Owner: NM LICENSING LLC)
- WRCL (93.7 FM; FRANKENMUTH, MI; Owner: REGENT BROADCASTING OF FLINT, INC.)
- WKQZ (93.3 FM; MIDLAND, MI; Owner: CITADEL BROADCASTING COMPANY)
- WYLZ (100.9 FM; PINCONNING, MI; Owner: CITADEL BROADCASTING COMPANY)
- WWBN (101.5 FM; TUSCOLA, MI; Owner: REGENT BROADCASTING OF FLINT, INC.)
- WRSR (103.9 FM; OWOSSO, MI; Owner: CUMULUS LICENSING CORP.)
TV broadcast stations around Saginaw Township North:
- WNEM-TV (Channel 5; BAY CITY, MI; Owner: MEREDITH CORPORATION)
- W68DH (Channel 68; PETOSKEY, MI; Owner: MS COMMUNICATIONS, LLC)
- W22CC (Channel 22; PINCONNING, MI; Owner: P & P CABLE HOLDINGS, L.L.C.)
- W69DW (Channel 69; PINCONNING, MI; Owner: NTN/SAGINAW, INC.)
- WDCQ-TV (Channel 19; UNIVERSITY CENTER, MI; Owner: DELTA COLLEGE)
- WJRT-TV (Channel 12; FLINT, MI; Owner: FLINT LICENSE SUBSIDIARY CORP.)
- WSMH (Channel 66; FLINT, MI; Owner: WSMH LICENSEE, LLC)
- WAQP (Channel 49; SAGINAW, MI; Owner: TCT OF MICHIGAN, INC.)
- WEYI-TV (Channel 25; SAGINAW, MI; Owner: WEYI BROADCASTING, LLC)
- W58CW (Channel 58; PINCONNING, MI; Owner: P & P CABLE HOLDINGS, L.L.C.)
- WCMU-TV (Channel 14; MOUNT PLEASANT, MI; Owner: CENTRAL MICHIGAN UNIVERSITY)
- W15BP (Channel 15; PINCONNING, MI; Owner: P & P CABLE HOLDINGS, L.L.C.)
- WUHO-LP (Channel 57; PINCONNING, MI; Owner: P & P CABLE HOLDINGS, L.L.C.)
- W09CK (Channel 9; FLINT, MI; Owner: P & P CABLE HOLDINGS, L.L.C.)
- W52CU (Channel 52; PINCONNING, MI; Owner: NTN/SAGINAW, INC.)
- W46CR (Channel 46; SAGINAW/MIDLAND, MI; Owner: YONEIDE S. DINZEY)
- WXON-LP (Channel 54; FLINT, MI; Owner: P & P CABLE HOLDINGS, L.L.C.)
- National Bridge Inventory (NBI) Statistics
- 5Number of bridges
- 30ft / 9.3mTotal length
- 72,483Total average daily traffic
- 3,477Total average daily truck traffic
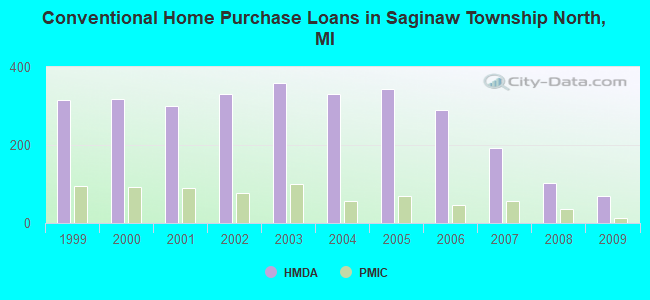
| Home Mortgage Disclosure Act Aggregated Statistics For Year 2009 (Based on 2 full and 4 partial tracts) | ||||||||||||||
| A) FHA, FSA/RHS & VA Home Purchase Loans | B) Conventional Home Purchase Loans | C) Refinancings | D) Home Improvement Loans | E) Loans on Dwellings For 5+ Families | F) Non-occupant Loans on < 5 Family Dwellings (A B C & D) | G) Loans On Manufactured Home Dwelling (A B C & D) | ||||||||
|---|---|---|---|---|---|---|---|---|---|---|---|---|---|---|
| Number | Average Value | Number | Average Value | Number | Average Value | Number | Average Value | Number | Average Value | Number | Average Value | Number | Average Value | |
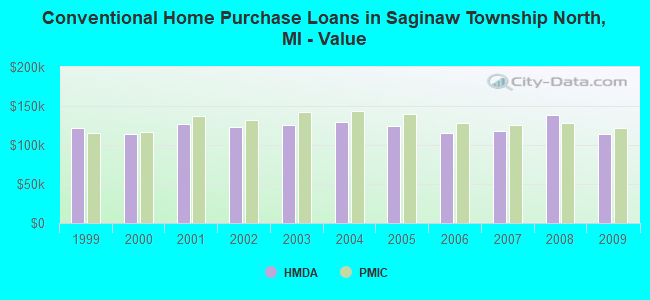
| LOANS ORIGINATED | 99 | $114,980 | 69 | $113,653 | 437 | $123,447 | 24 | $20,123 | 1 | $137,530 | 16 | $73,718 | 3 | $40,790 |
| APPLICATIONS APPROVED, NOT ACCEPTED | 3 | $132,763 | 2 | $156,995 | 39 | $150,260 | 3 | $75,623 | 0 | $0 | 0 | $0 | 0 | $0 |
| APPLICATIONS DENIED | 19 | $88,409 | 11 | $96,092 | 108 | $145,862 | 12 | $43,587 | 0 | $0 | 5 | $80,926 | 0 | $0 |
| APPLICATIONS WITHDRAWN | 14 | $111,959 | 4 | $189,768 | 77 | $132,106 | 4 | $31,575 | 0 | $0 | 3 | $110,757 | 0 | $0 |
| FILES CLOSED FOR INCOMPLETENESS | 1 | $125,190 | 2 | $61,430 | 10 | $158,965 | 0 | $0 | 0 | $0 | 1 | $80,000 | 0 | $0 |
Detailed HMDA statistics for the following Tracts: 0103.02 , 0103.03, 0103.04, 0104.01, 0104.02, 0104.03
| Private Mortgage Insurance Companies Aggregated Statistics For Year 2009 (Based on 2 full and 4 partial tracts) | ||||
| A) Conventional Home Purchase Loans | B) Refinancings | |||
|---|---|---|---|---|
| Number | Average Value | Number | Average Value | |
| LOANS ORIGINATED | 14 | $122,252 | 10 | $157,557 |
| APPLICATIONS APPROVED, NOT ACCEPTED | 2 | $96,125 | 5 | $133,636 |
| APPLICATIONS DENIED | 1 | $217,510 | 4 | $146,702 |
| APPLICATIONS WITHDRAWN | 0 | $0 | 2 | $153,510 |
| FILES CLOSED FOR INCOMPLETENESS | 1 | $126,950 | 0 | $0 |
Detailed PMIC statistics for the following Tracts: 0103.02 , 0103.03, 0103.04, 0104.01, 0104.02, 0104.03
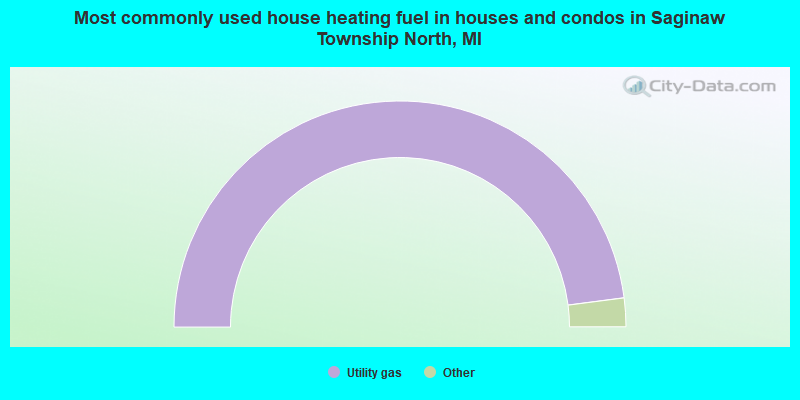
- 95.9%Utility gas
- 3.3%Electricity
- 0.4%Bottled, tank, or LP gas
- 0.3%Fuel oil, kerosene, etc.
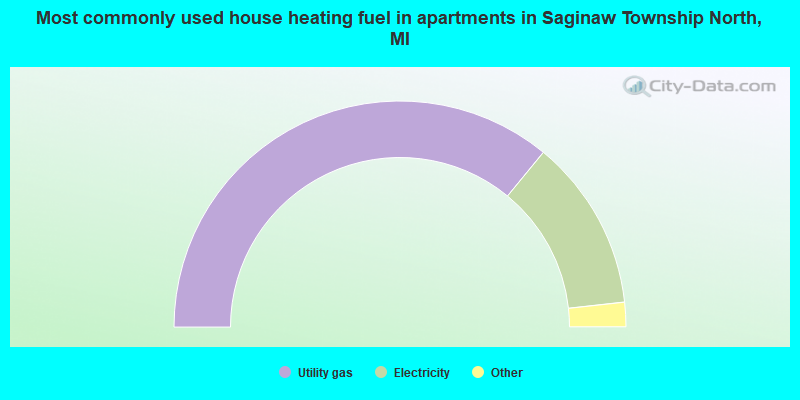
- 71.9%Utility gas
- 24.6%Electricity
- 1.8%Bottled, tank, or LP gas
- 0.7%Other fuel
- 0.5%No fuel used
- 0.4%Fuel oil, kerosene, etc.
Saginaw Township North compared to Michigan state average:
- Unemployed percentage below state average.
- Black race population percentage below state average.
- Renting percentage significantly below state average.
- Length of stay since moving in significantly above state average.
- Number of rooms per house significantly below state average.
- House age significantly below state average.
- Institutionalized population percentage significantly above state average.
Saginaw Township North on our top lists:
- #16 on the list of "Top 101 cities with largest percentage of males in industries: transportation equipment (population 5,000+)"
- #47 on the list of "Top 101 cities with largest percentage of females in industries: clothing and accessories, including shoe, stores (population 5,000+)"
- #52 on the list of "Top 101 cities with largest percentage of males in industries: clothing and accessories, including shoe, stores (population 5,000+)"
- #54 on the list of "Top 101 cities with largest percentage of females in industries: transportation equipment (population 5,000+)"
- #58 on the list of "Top 101 cities with largest percentage of males in occupations: food and beverage serving workers except waiters/waitresses (population 5,000+)"
- #66 on the list of "Top 101 cities with largest percentage of females in industries: vending machine operators (population 5,000+)"
- #76 on the list of "Top 101 cities with largest percentage of males in occupations: waiters and waitresses (population 5,000+)"
- #77 on the list of "Top 101 cities with largest percentage of females in occupations: vehicle and mobile equipment mechanics, installers, and repairers (population 5,000+)"
- #86 on the list of "Top 101 cities with largest percentage of females in industries: health care (population 5,000+)"
- #90 on the list of "Top 101 cities with largest percentage of males in occupations: preschool, kindergarten, elementary and middle school teachers (population 5,000+)"
- #93 on the list of "Top 101 cities with the smallest percentage of likely homosexual households (counted as self-reported same-sex unmarried-partner households) (population 5,000+)"
- #96 on the list of "Top 101 cities with the largest percentage of people in short-term care, detention or diagnostic centers for delinquent children (population 1,000+)"
- #100 on the list of "Top 101 cities with largest percentage of males in industries: furniture and home furnishings, and household appliance stores (population 5,000+)"
- #16 on the list of "Top 101 counties with the lowest percentage of residents relocating to foreign countries in 2011"
- #25 on the list of "Top 101 counties with the largest number of people moving out compared to moving in (pop. 50,000+)"
- #47 on the list of "Top 101 counties with the lowest percentage of residents relocating from foreign countries between 2010 and 2011"
- #62 on the list of "Top 101 counties with the lowest percentage of residents relocating from other counties between 2010 and 2011 (pop. 50,000+)"
- #94 on the list of "Top 101 counties with the most Black Protestant adherents"