Snoqualmie Valley, Washington
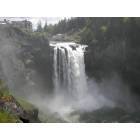
Snoqualmie Valley: Roaring Snoqualmie Falls
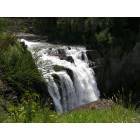
Snoqualmie Valley: Upper Snoqualmie Falls

Snoqualmie Valley: Azalea Walk at Snoqualmie Falls Visitor Park
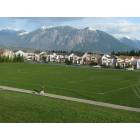
Snoqualmie Valley: Snoqualmie Ridge Neighborhood
- add
your
Submit your own pictures of this place and show them to the world
- OSM Map
- General Map
- Google Map
- MSN Map

| Males: 20,101 | |
| Females: 19,299 |
| Median resident age: | 35.5 years |
| Washington median age: | 35.3 years |
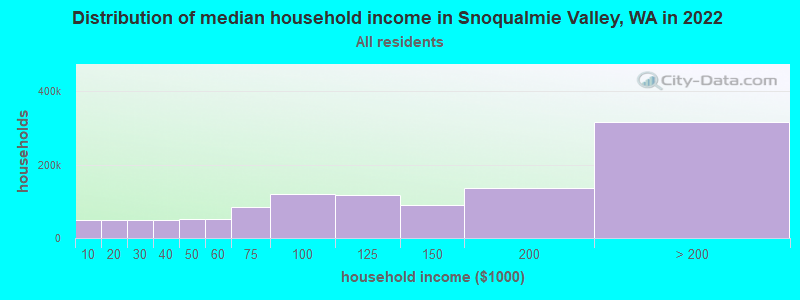
| Snoqualmie Valley: | $143,149 |
| WA: | $91,306 |
Estimated per capita income in 2022: $67,057 (it was $28,301 in 2000)
Snoqualmie Valley CCD income, earnings, and wages data
Estimated median house or condo value in 2022: $887,716 (it was $233,100 in 2000)
| Snoqualmie Valley: | $887,716 |
| WA: | $569,500 |
Mean prices in 2022: all housing units: over $1,000,000; detached houses: over $1,000,000; townhouses or other attached units: $797,959; in 2-unit structures: $602,104; in 3-to-4-unit structures: $645,645; in 5-or-more-unit structures: $562,830; mobile homes: $271,735; occupied boats, rvs, vans, etc.: $635,138
Snoqualmie Valley, WA residents, houses, and apartments details
Detailed information about poverty and poor residents in Snoqualmie Valley, WA


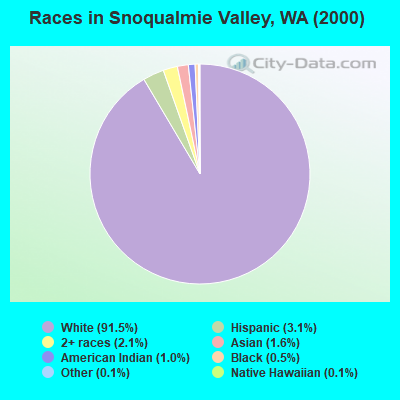
- 33,76091.5%White alone
- 1,1413.1%Hispanic
- 7772.1%Two or more races
- 5911.6%Asian alone
- 3511.0%American Indian alone
- 1790.5%Black alone
- 400.1%Native Hawaiian and Other
Pacific Islander alone - 540.1%Other race alone
Races in Snoqualmie Valley detailed stats: ancestries, foreign born residents, place of birth
 Recent articles from our blog. Our writers, many of them Ph.D. graduates or candidates, create easy-to-read articles on a wide variety of topics.
Current Local Time: PST time zone
Land area: 899.9 square miles.
Population density: 44 people per square mile (very low).

| Snoqualmie Valley CCD: | 1.2% ($2,712) |
| Washington: | 1.2% ($1,915) |
Nearest city with pop. 50,000+: Issaquah Plateau, WA (14.5 miles  , pop. 50,237).
Nearest city with pop. 200,000+: East Seattle, WA (21.1 miles , pop. 480,100).
Nearest city with pop. 1,000,000+: Los Angeles, CA (950.2 miles , pop. 3,694,820).
Nearest cities:
), ), ), Latitude: 47.59 N, Longitude: 121.71 W
Area code commonly used in this area: 425

| Here: | 3.5% |
| Washington: | 4.6% |
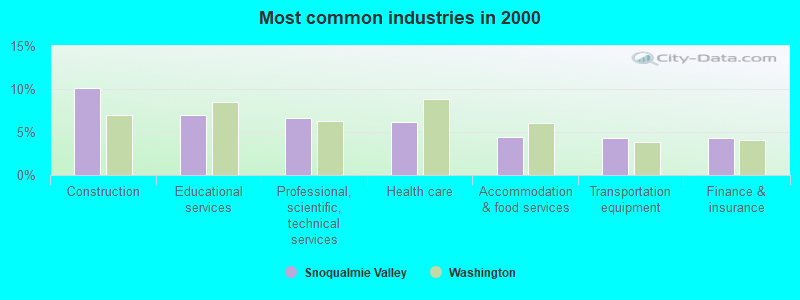
- Construction (10.1%)
- Educational services (7.0%)
- Professional, scientific, technical services (6.7%)
- Health care (6.2%)
- Accommodation & food services (4.5%)
- Transportation equipment (4.3%)
- Finance & insurance (4.3%)
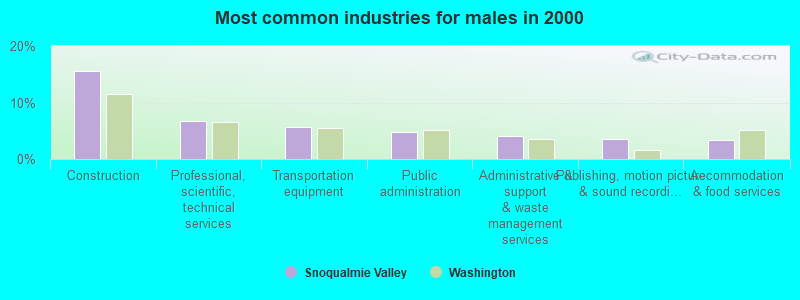
- Construction (15.5%)
- Professional, scientific, technical services (6.7%)
- Transportation equipment (5.7%)
- Public administration (4.9%)
- Administrative & support & waste management services (4.0%)
- Publishing, motion picture & sound recording industries (3.6%)
- Accommodation & food services (3.4%)
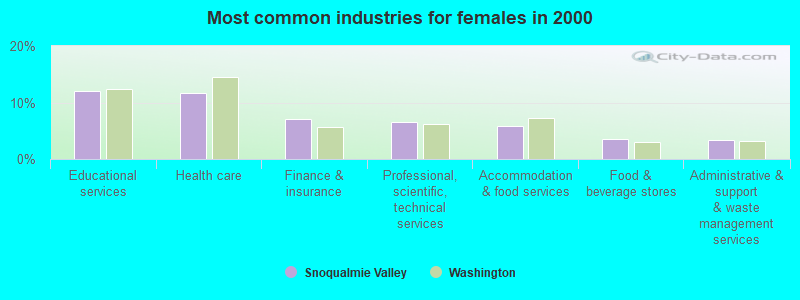
- Educational services (12.0%)
- Health care (11.6%)
- Finance & insurance (7.0%)
- Professional, scientific, technical services (6.6%)
- Accommodation & food services (5.8%)
- Food & beverage stores (3.5%)
- Administrative & support & waste management services (3.3%)
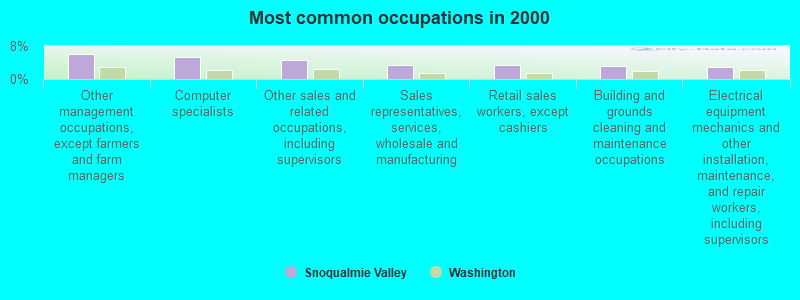
- Other management occupations, except farmers and farm managers (6.1%)
- Computer specialists (5.2%)
- Other sales and related occupations, including supervisors (4.5%)
- Sales representatives, services, wholesale and manufacturing (3.5%)
- Retail sales workers, except cashiers (3.3%)
- Building and grounds cleaning and maintenance occupations (3.3%)
- Electrical equipment mechanics and other installation, maintenance, and repair workers, including supervisors (2.8%)
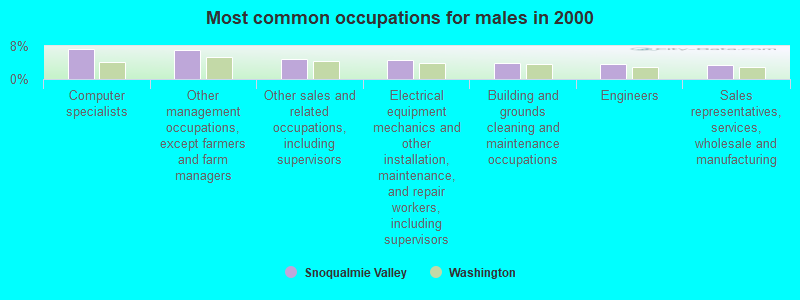
- Computer specialists (7.2%)
- Other management occupations, except farmers and farm managers (7.1%)
- Other sales and related occupations, including supervisors (4.9%)
- Electrical equipment mechanics and other installation, maintenance, and repair workers, including supervisors (4.5%)
- Building and grounds cleaning and maintenance occupations (3.9%)
- Engineers (3.6%)
- Sales representatives, services, wholesale and manufacturing (3.5%)
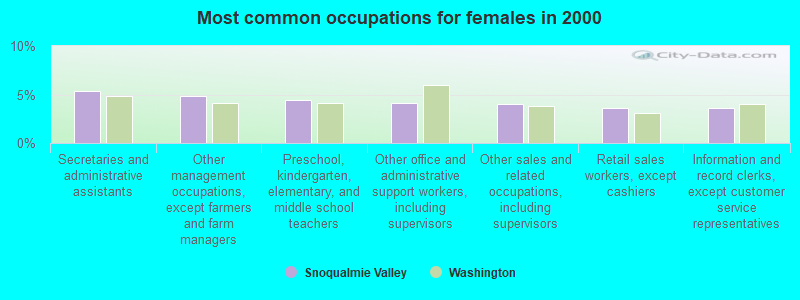
- Secretaries and administrative assistants (5.4%)
- Other management occupations, except farmers and farm managers (4.8%)
- Preschool, kindergarten, elementary, and middle school teachers (4.5%)
- Other office and administrative support workers, including supervisors (4.1%)
- Other sales and related occupations, including supervisors (4.0%)
- Retail sales workers, except cashiers (3.6%)
- Information and record clerks, except customer service representatives (3.6%)
Average climate in Snoqualmie Valley, Washington
Based on data reported by over 4,000 weather stations


(lower is better)
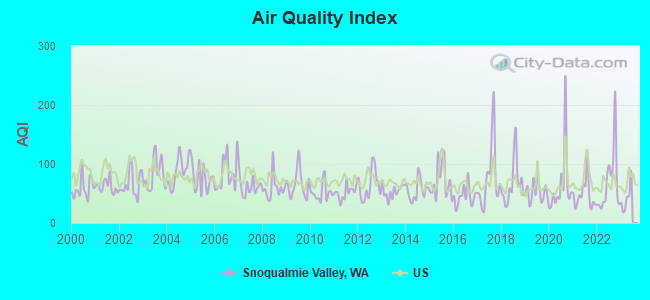
Air Quality Index (AQI) level in 2022 was 68.9. This is about average.
| City: | 68.9 |
| U.S.: | 72.6 |
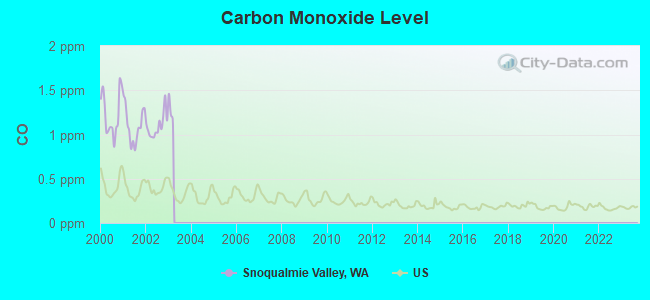
Carbon Monoxide (CO) [ppm] level in 2002 was 1.10. This is significantly worse than average. Closest monitor was 22.5 miles away from the city center.
| City: | 1.10 |
| U.S.: | 0.25 |
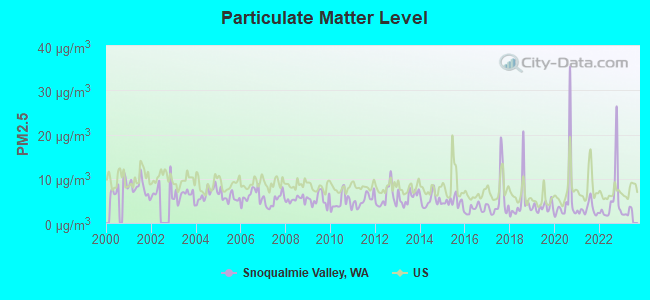
Particulate Matter (PM2.5) [µg/m3] level in 2022 was 5.46. This is significantly better than average. Closest monitor was 7.6 miles away from the city center.
| City: | 5.46 |
| U.S.: | 8.11 |
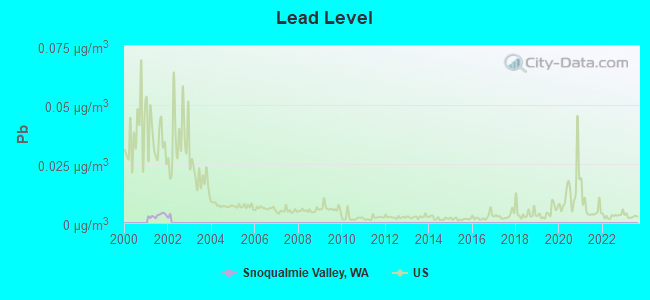
Lead (Pb) [µg/m3] level in 2001 was 0.00317. This is significantly better than average. Closest monitor was 16.6 miles away from the city center.
| City: | 0.00317 |
| U.S.: | 0.00931 |
Earthquake activity:
Snoqualmie Valley-area historical earthquake activity is significantly above Washington state average. It is 1310% greater than the overall U.S. average.On 4/13/1949 at 19:55:42, a magnitude 7.0 (7.0 UK, Class: Major, Intensity: VIII - XII) earthquake occurred 43.7 miles away from the city center, causing $80,000,000 total damage
On 2/28/2001 at 18:54:32, a magnitude 6.8 (6.5 MB, 6.6 MS, 6.8 MW, Class: Strong, Intensity: VII - IX) earthquake occurred 53.4 miles away from Snoqualmie Valley center, causing $2,000,000,000 total damage and $305,000,000 insured losses
On 2/28/2001 at 18:54:32, a magnitude 6.8 (6.8 MD, Depth: 32.2 mi) earthquake occurred 56.5 miles away from the city center
On 4/29/1965 at 15:28:43, a magnitude 6.6 (6.6 UK) earthquake occurred 34.7 miles away from the city center, causing $28,000,000 total damage
On 7/3/1999 at 01:43:54, a magnitude 5.8 (5.4 MB, 5.5 MS, 5.8 MW, 5.3 ME, Depth: 25.2 mi, Class: Moderate, Intensity: VI - VII) earthquake occurred 80.2 miles away from Snoqualmie Valley center
On 5/3/1996 at 04:04:22, a magnitude 5.5 (5.2 MB, 5.3 MD, 5.5 ML, Depth: 2.5 mi) earthquake occurred 16.8 miles away from the city center
Magnitude types: body-wave magnitude (MB), duration magnitude (MD), energy magnitude (ME), local magnitude (ML), surface-wave magnitude (MS), moment magnitude (MW)
Natural disasters:
The number of natural disasters in King County (30) is a lot greater than the US average (15).Major Disasters (Presidential) Declared: 27
Emergencies Declared: 1
Causes of natural disasters: Floods: 21, Storms: 16, Mudslides: 11, Landslides: 9, Winter Storms: 7, Earthquakes: 2, Heavy Rains: 2, Winds: 2, Hurricane: 1, Snow: 1, Volcanic Eruption: 1, Other: 1 (Note: some incidents may be assigned to more than one category).
Hospitals and medical centers near Snoqualmie Valley:
- MOUNT SI TRANSITIONAL HEALTH CENTER (Nursing Home, about 8 miles away; NORTH BEND, WA)
- NORTH BEND NURSING HOME (Nursing Home, about 8 miles away; NORTH BEND, WA)
- NKC SNOQUALMIE RIDGE KIDNEY CENTER (Dialysis Facility, about 9 miles away; SNOQUALMIE, WA)
- MARIANWOOD (Nursing Home, about 16 miles away; ISSAQUAH, WA)
- PROVIDENCE MARIANWOOD (Nursing Home, about 16 miles away; ISSAQUAH, WA)
- ISSAQUAH NURSING AND REHABILITATION CENTER (Nursing Home, about 16 miles away; ISSAQUAH, WA)
- ISSAQUAH VILLA CARE CENTER (Nursing Home, about 16 miles away; ISSAQUAH, WA)
Colleges/universities with over 2000 students nearest to Snoqualmie Valley:
- Bellevue College (about 21 miles; Bellevue, WA; Full-time enrollment: 10,940)
- Lake Washington Institute of Technology (about 23 miles; Kirkland, WA; FT enrollment: 2,947)
- Renton Technical College (about 23 miles; Renton, WA; FT enrollment: 2,549)
- Cascadia Community College (about 26 miles; Bothell, WA; FT enrollment: 2,238)
- University of Washington-Bothell Campus (about 26 miles; Bothell, WA; FT enrollment: 3,902)
- University of Washington-Seattle Campus (about 29 miles; Seattle, WA; FT enrollment: 39,445)
- Seattle University (about 29 miles; Seattle, WA; FT enrollment: 5,808)
Points of interest:
Notable locations in Snoqualmie Valley: Skykomish District Ranger Office (A), Asahel Curtis Picnic Ground (B), Snoqualmie Summit Ski Area (C), Taylor River Forest Camp (D), Foss River Camp (E), Foss River Campground (F), Mountain Tree Farm Center (G), Denny Creek Trailhead (H), Mount Si Golf Course (I), Alpental Ski Area (J), Carnation Golf Course (K), Commonwealth Campground (L), City Cabin (M), Stevens Pass Recreation Area (N), Snoqualmie Pass Recreation Area (O), Miller River Campground (P), Tokul (Q), Camp Waskowitz (R), Camp Joy (S), Tye Canyon Campground (T). Display/hide their locations on the map
Cemetery: Fall City Cemetery (1). Display/hide its location on the map
Lakes, reservoirs, and swamps: Terrace Lakes (A), Cass Pond (B), Cold Lake (C), Tye Lake (D), Lake Titicaca (E), Trout Lake (F), Cloudy Lake (G), No Name Lake (H). Display/hide their locations on the map
Rivers and creeks: Beaver Creek (A), Beckler River (B), Bolt Creek (C), Boxley Creek (D), Bridge Creek (E), Brockway Creek (F), Burn Creek (G), Burnboot Creek (H), Calligan Creek (I). Display/hide their locations on the map
Parks in Snoqualmie Valley include: Loutsis Park (1), Fall City Community Park (2), E J Roberts Park (3), Gardner Weeks Park (4), Duvall Park (5), Taylor Park (6), John MacDonald Tolt River Park (7), Si View County Park (8), Fort Tilton Historical Marker (9). Display/hide their locations on the map
| This place: | 2.8 people |
| Washington: | 2.5 people |
| This place: | 76.2% |
| Whole state: | 64.4% |
| This place: | 6.4% |
| Whole state: | 7.7% |
Likely homosexual households (counted as self-reported same-sex unmarried-partner households)
- Lesbian couples: 0.5% of all households
- Gay men: 0.3% of all households
| This place: | 4.4% |
| Whole state: | 10.6% |
| This place: | 2.4% |
| Whole state: | 4.6% |
People in group quarters in Snoqualmie Valley in 2010:
- 126 people in correctional facilities intended for juveniles
- 42 people in nursing facilities/skilled-nursing facilities
- 31 people in other noninstitutional facilities
- 27 people in workers' group living quarters and job corps centers
- 19 people in emergency and transitional shelters (with sleeping facilities) for people experiencing homelessness
- 11 people in group homes intended for adults
- 4 people in college/university student housing
People in group quarters in Snoqualmie Valley in 2000:
- 200 people in short-term care, detention or diagnostic centers for delinquent children
- 47 people in nursing homes
- 45 people in other noninstitutional group quarters
- 16 people in unknown juvenile institutions
- 14 people in other group homes
- 12 people in other nonhousehold living situations
- 11 people in homes for the mentally retarded
- 2 people in religious group quarters
For population 15 years and over in Snoqualmie Valley:
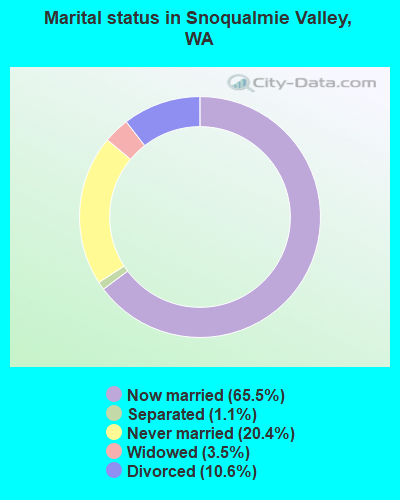
- Never married: 20.4%
- Now married: 65.5%
- Separated: 1.1%
- Widowed: 3.5%
- Divorced: 10.6%
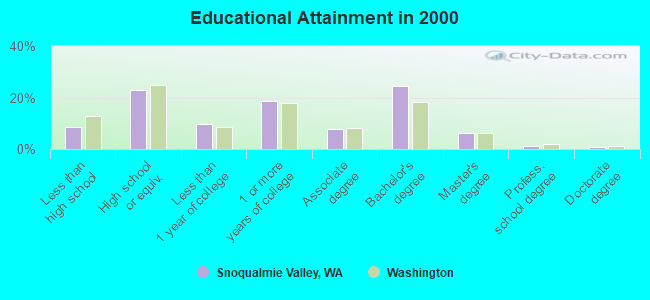
For population 25 years and over in Snoqualmie Valley:
- High school or higher: 91.4%
- Bachelor's degree or higher: 32.7%
- Graduate or professional degree: 8.4%
- Unemployed: 3.3%
- Mean travel time to work (commute): 31.9 minutes
| Here: | 9.2 |
| Washington average: | 11.3 |
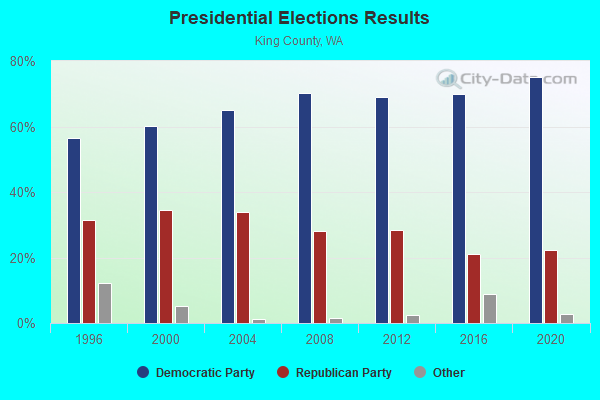
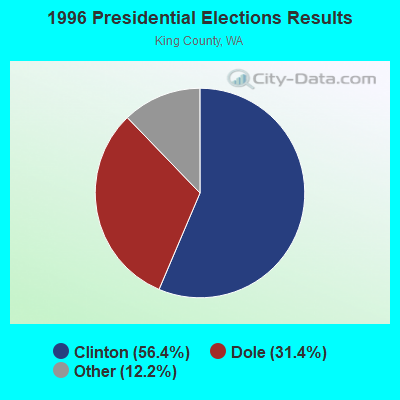
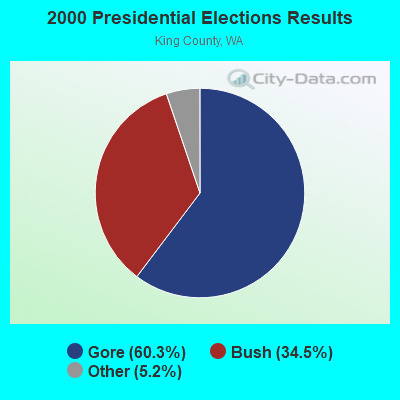
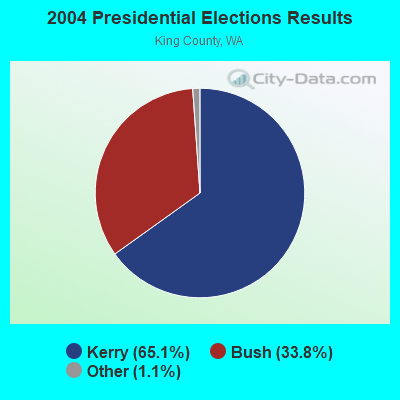
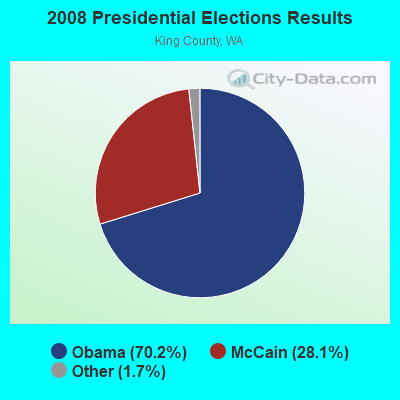
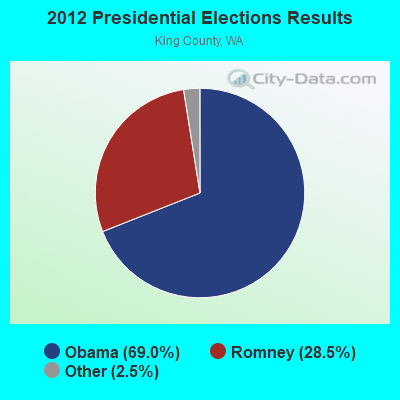
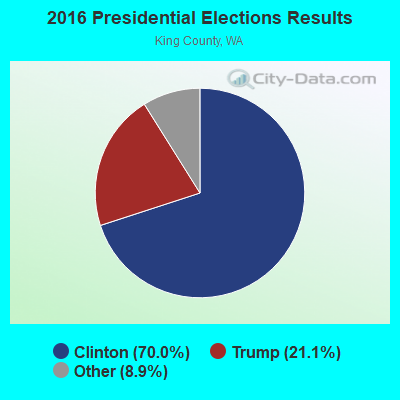
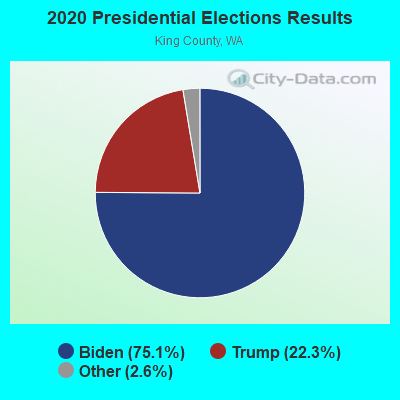
Graphs represent county-level data. Detailed 2008 Election Results
Religion statistics for Snoqualmie Valley, WA (based on King County data)
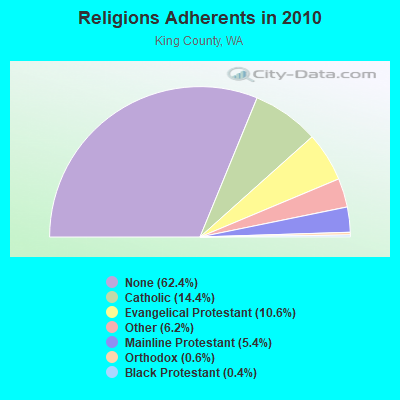
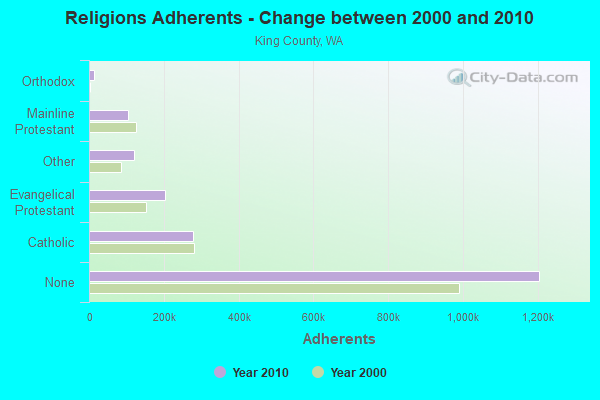
| Religion | Adherents | Congregations |
|---|---|---|
| Catholic | 278,340 | 71 |
| Evangelical Protestant | 204,523 | 711 |
| Other | 119,713 | 329 |
| Mainline Protestant | 104,806 | 304 |
| Orthodox | 12,257 | 20 |
| Black Protestant | 7,030 | 24 |
| None | 1,204,580 | - |
Food Environment Statistics:
| King County: | 2.37 / 10,000 pop. |
| State: | 2.06 / 10,000 pop. |
| This county: | 0.16 / 10,000 pop. |
| State: | 0.19 / 10,000 pop. |
| King County: | 1.19 / 10,000 pop. |
| Washington: | 1.18 / 10,000 pop. |
| King County: | 2.16 / 10,000 pop. |
| Washington: | 2.67 / 10,000 pop. |
| This county: | 10.95 / 10,000 pop. |
| State: | 8.26 / 10,000 pop. |
| This county: | 6.7% |
| Washington: | 7.7% |
| This county: | 20.5% |
| State: | 25.7% |
| King County: | 14.6% |
| State: | 13.9% |
6.69% of this county's 2021 resident taxpayers lived in other counties in 2020 ($106,002 average adjusted gross income)
| Here: | 6.69% |
| Washington average: | 7.53% |
0.02% of residents moved from foreign countries ($181 average AGI)
King County: 0.02% Washington average: 0.05%
Top counties from which taxpayers relocated into this county between 2020 and 2021:
| from Snohomish County, WA | |
| from Pierce County, WA | |
| from Los Angeles County, CA |
7.71% of this county's 2020 resident taxpayers moved to other counties in 2021 ($123,052 average adjusted gross income)
| Here: | 7.71% |
| Washington average: | 7.40% |
0.01% of residents moved to foreign countries ($183 average AGI)
King County: 0.01% Washington average: 0.04%
Top counties to which taxpayers relocated from this county between 2020 and 2021:
| to Snohomish County, WA | |
| to Pierce County, WA | |
| to Maricopa County, AZ |
Strongest AM radio stations in Snoqualmie Valley:
- KIXI (880 AM; 50 kW; MERCER ISLAND/SEATTL, WA; Owner: BELLEVUE RADIO, INC.)
- KRKO (1380 AM; 50 kW; EVERETT, WA; Owner: S-R BROADCASTING, CO.)
- KIRO (710 AM; 50 kW; SEATTLE, WA; Owner: ENTERCOM SEATTLE LICENSE, LLC)
- KTTH (770 AM; 50 kW; SEATTLE, WA; Owner: ENTERCOM SEATTLE LICENSE, LLC)
- KGNW (820 AM; 50 kW; BURIEN-SEATTLE, WA; Owner: INSPIRATION MEDIA, INC.)
- KOMO (1000 AM; 50 kW; SEATTLE, WA; Owner: FISHER BROADCASTING - SEATTLE RADIO, L.L.C.)
- KYCW (1090 AM; 50 kW; SEATTLE, WA; Owner: INFINITY RADIO SUBSIDIARY OPERATIONS INC.)
- KJR (950 AM; 50 kW; SEATTLE, WA)
- KKOL (1300 AM; 50 kW; SEATTLE, WA; Owner: INSPIRATION MEDIA, INC.)
- KNWX (1210 AM; 28 kW; AUBURN-FEDERAL WAY, WA; Owner: ENTERCOM SEATTLE LICENSE, LLC)
- KKNW (1150 AM; 10 kW; SEATTLE, WA; Owner: ORCA RADIO, INC.)
- KRIZ (1420 AM; 10 kW; RENTON, WA; Owner: KRIZ BROADCASTING, INC.)
- KYIZ (1620 AM; 10 kW; RENTON, WA; Owner: KRIZ BROADCASTING, INC.)
Strongest FM radio stations in Snoqualmie Valley:
- KZOK-FM (102.5 FM; SEATTLE, WA; Owner: INFINITY RADIO SUBSIDIARY OPERATIONS INC.)
- KMPS-FM (94.1 FM; SEATTLE, WA; Owner: INFINITY RADIO SUBSIDIARY OPERATIONS INC.)
- KBKS (106.1 FM; TACOMA, WA; Owner: INFINITY RADIO SUBSIDIARY OPERATIONS INC.)
- KING-FM (98.1 FM; SEATTLE, WA; Owner: CLASSIC RADIO, INC.)
- KLSY-FM (92.5 FM; BELLEVUE, WA; Owner: BELLEVUE RADIO INC.)
- KPLU-FM (88.5 FM; TACOMA, WA; Owner: PACIFIC LUTHERAN UNIVERSITY, INC.)
- KWJZ (98.9 FM; SEATTLE, WA; Owner: ORCA RADIO, INC.)
- KBSG-FM (97.3 FM; TACOMA, WA; Owner: ENTERCOM SEATTLE LICENSE, LLC)
- KMTT (103.7 FM; TACOMA, WA; Owner: ENTERCOM SEATTLE LICENSE, LLC)
- KNDD (107.7 FM; SEATTLE, WA; Owner: ENTERCOM SEATTLE LICENSE, LLC)
- KYPT (96.5 FM; SEATTLE, WA; Owner: INFINITY RADIO SUBSIDIARY OPERATIONS INC.)
- KISW (99.9 FM; SEATTLE, WA; Owner: ENTERCOM SEATTLE LICENSE, LLC)
- KJR-FM (95.7 FM; SEATTLE, WA; Owner: ACKERLEY MEDIA GROUP, INC.)
- KUBE (93.3 FM; SEATTLE, WA; Owner: ACKERLEY MEDIA GROUP, INC.)
- K201EX (88.1 FM; GREENWATER, WA; Owner: CALVARY CHAPEL OF TWIN FALLS, INC.)
- KPLZ-FM (101.5 FM; SEATTLE, WA; Owner: FISHER BROADCASTING - SEATTLE RADIO, L.L.C.)
- KQBZ (100.7 FM; SEATTLE, WA; Owner: ENTERCOM SEATTLE LICENSE, LLC)
- KNHC (89.5 FM; SEATTLE, WA; Owner: SEATTLE PUBLIC SCHOOLS)
- KRWM (106.9 FM; BREMERTON, WA; Owner: SEASCAPE RADIO, INC.)
- KCMS (105.3 FM; EDMONDS, WA; Owner: CRISTA MINISTRIES, INC.)
TV broadcast stations around Snoqualmie Valley:
- KHCV (Channel 45; SEATTLE, WA; Owner: NORTH PACIFIC INTERNATIONAL TELEVISION, INC.)
- KWPX (Channel 33; BELLEVUE, WA; Owner: PAXSON COMMUNICATIONS LICENSE COMPANY, LLC)
- KWDK (Channel 56; TACOMA, WA; Owner: PUGET SOUND EDUCATIONAL TV, INC.)
- KSTW (Channel 11; TACOMA, WA; Owner: UPN TELEVISION STATIONS INC.)
- KING-TV (Channel 5; SEATTLE, WA; Owner: KING BROADCASTING COMPANY)
- K58DP (Channel 58; SEATTLE, WA; Owner: WORD OF GOD FELLOWSHIP, INC.)
- KTWB-TV (Channel 22; SEATTLE, WA; Owner: TRIBUNE TELEVISION HOLDINGS, INC.)
- KOMO-TV (Channel 4; SEATTLE, WA; Owner: FISHER BROADCASTING - SEATTLE TV, L.L.C.)
- KCTS-TV (Channel 9; SEATTLE, WA; Owner: KCTS TELEVISION)
- KIRO-TV (Channel 7; SEATTLE, WA; Owner: KIRO-TV HOLDINGS, INC.)
- KWOG (Channel 51; BELLEVUE, WA; Owner: AFRICAN-AMERICAN BROADCASTING CO.OF BELLEVUE, INC.)
- K57HB (Channel 57; EUREKA, CA; Owner: MS COMMUNICATIONS, LLC)
- KONG-TV (Channel 16; EVERETT, WA; Owner: KONG-TV, INC.)
- K68DL (Channel 68; SEATTLE, WA; Owner: THREE ANGELS BROADCASTING NETWORK)
FCC Registered Microwave Towers:
1- SE02800A, Sr 906 (Lat: 47.423611 Lon: -121.416111), Type: Building, Structure height: 7.5 m, Call Sign: WQJY681,
Assigned Frequencies: 23125.0 MHz, 23275.0 MHz, 23125.0 MHz, 23275.0 MHz, 23125.0 MHz, 23275.0 MHz, 23125.0 MHz, 23275.0 MHz, 23125.0 MHz, 23275.0 MHz... (+10 more), Grant Date: 04/02/2019, Expiration Date: 02/18/2029, Certifier: Dan Menser, Registrant: T-Mobile License LLC, 12920 Se 38th St, Bellevue, WA 98006, Phone: (425) 383-8401, Fax: (425) 383-4040, Email:
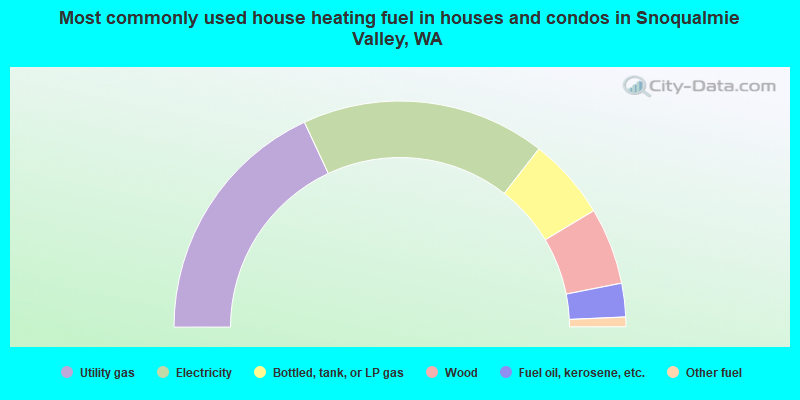
- 36.1%Utility gas
- 35.0%Electricity
- 11.7%Bottled, tank, or LP gas
- 11.0%Wood
- 4.8%Fuel oil, kerosene, etc.
- 1.4%Other fuel
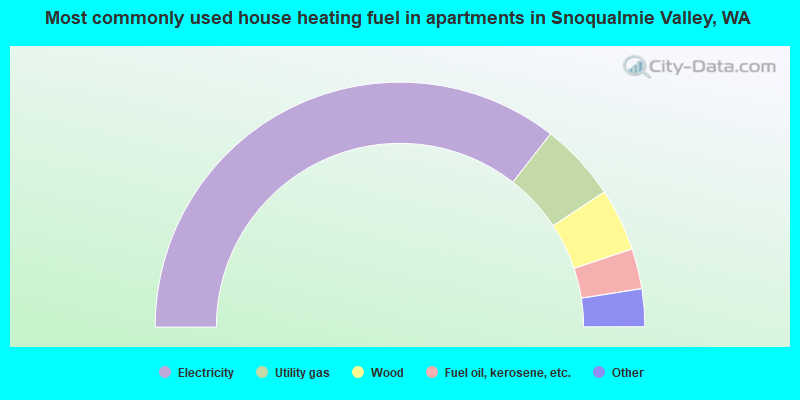
- 71.1%Electricity
- 10.3%Utility gas
- 8.3%Wood
- 5.3%Fuel oil, kerosene, etc.
- 3.3%Bottled, tank, or LP gas
- 1.1%Other fuel
- 0.4%No fuel used
- 0.2%Solar energy
Snoqualmie Valley compared to Washington state average:
- Median household income above state average.
- Median house value above state average.
- Unemployed percentage significantly below state average.
- Black race population percentage significantly below state average.
- Hispanic race population percentage significantly below state average.
- Foreign-born population percentage significantly below state average.
- Renting percentage below state average.
- Length of stay since moving in significantly above state average.
- Number of rooms per house significantly below state average.
- House age significantly below state average.
Snoqualmie Valley on our top lists:
- #12 on the list of "Top 101 cities with largest percentage of males in industries: publishing, and motion picture and sound recording industries (population 5,000+)"
- #13 on the list of "Top 101 cities with largest percentage of females in industries: apparel, fabrics, and notions merchant wholesalers (population 5,000+)"
- #50 on the list of "Top 101 cities with the largest percentage of people in short-term care, detention or diagnostic centers for delinquent children (population 1,000+)"
- #58 on the list of "Top 100 cities with largest land areas (pop. 5,000+)"
- #69 on the list of "Top 101 cities with largest percentage of males in industries: clothing and accessories, including shoe, stores (population 5,000+)"
- #71 on the list of "Top 101 cities with largest percentage of males in occupations: computer specialists (population 5,000+)"
- #72 on the list of "Top 101 cities with largest percentage of females in occupations: pipelayers, plumbers, pipefitters, and steamfitters (population 5,000+)"
- #75 on the list of "Top 101 cities with largest percentage of females in occupations: financial managers (population 5,000+)"
- #83 on the list of "Top 101 cities with largest percentage of females in industries: broadcasting and telecommunications (population 5,000+)"
- #89 on the list of "Top 101 cities with largest percentage of females in occupations: sales representatives, services, wholesale and manufacturing (population 5,000+)"
- #92 on the list of "Top 101 cities with largest percentage of females in industries: vending machine operators (population 5,000+)"
- #94 on the list of "Top 101 cities with largest percentage of females in occupations: entertainers and performers, sports, and related workers (population 5,000+)"
- #5 on the list of "Top 101 counties with the most Mainline Protestant congregations"
- #8 on the list of "Top 101 counties with the lowest Ozone (1-hour) air pollution readings in 2012 (ppm)"
- #9 on the list of "Top 101 counties with the most Other congregations"
- #11 on the list of "Top 101 counties with the most Mainline Protestant adherents"
- #11 on the list of "Top 101 counties with the highest percentage of residents that exercised in the past month"