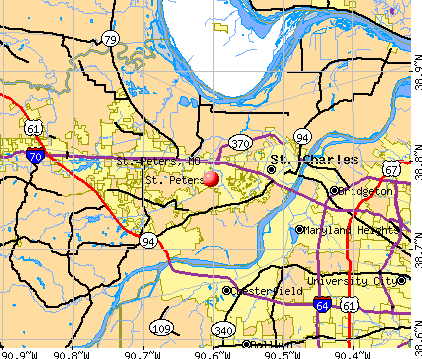
St. Peters, Missouri

St. Peters: Ice in the trees near my home in St. Peters
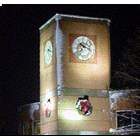
St. Peters: St. Peters City Hall Clock Tower

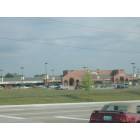
St. Peters: Mid Rivers Mall parking lot in spring of 2007
St. Peters: Fort Zumwalt South High School, St. Peters, MO
St. Peters: City Hall At Night
St. Peters: Dierbergs On Salt Lick Rd. In St. Peters
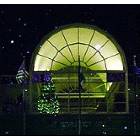
St. Peters: St Peters Fountain
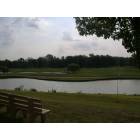
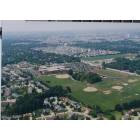
St. Peters: St. Peters Golf Course

St. Peters: St. Peters City Hall

St. Peters: St. Peters City Hall
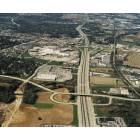
St. Peters: Mid Rivers Mall Dr. at I-70
- see
16
more - add
your
Submit your own pictures of this city and show them to the world
- OSM Map
- General Map
- Google Map
- MSN Map
Population change since 2000: +13.9%
 |
| Males: 27,425 | |
| Females: 31,098 |
| Median resident age: | 40.8 years |
| Missouri median age: | 39.1 years |
Zip codes: 63376.
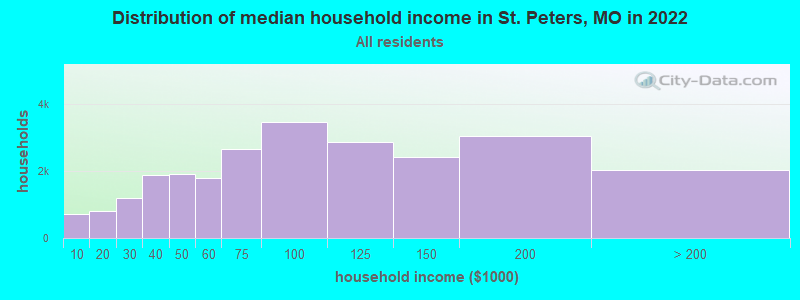
| St. Peters: | $88,027 |
| MO: | $64,811 |
Estimated per capita income in 2022: $43,093 (it was $22,792 in 2000)
St. Peters city income, earnings, and wages data
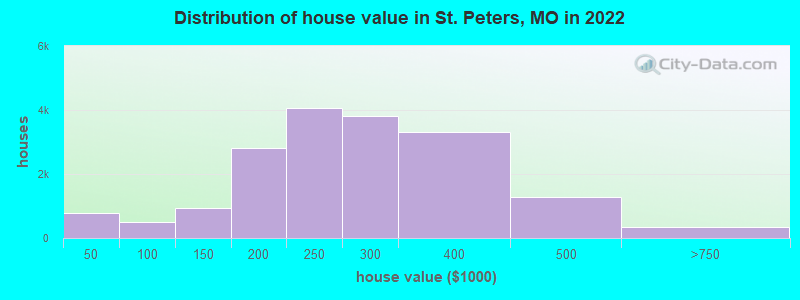
Estimated median house or condo value in 2022: $256,269 (it was $113,000 in 2000)
| St. Peters: | $256,269 |
| MO: | $221,200 |
Mean prices in 2022: all housing units: $267,922; detached houses: $291,281; townhouses or other attached units: $204,989; in 2-unit structures: $335,943; in 3-to-4-unit structures: $156,347; in 5-or-more-unit structures: $100,766; mobile homes: $31,187
Median gross rent in 2022: $1,186.
(3.8% for White Non-Hispanic residents, 3.1% for Black residents, 12.4% for Hispanic or Latino residents, 34.1% for Native Hawaiian and other Pacific Islander residents, 7.5% for two or more races residents)
Detailed information about poverty and poor residents in St. Peters, MO


Compare current foreclosures near St. Peters, MO:
| Photo | Address | Area | Beds / Baths | Price | Details |
|---|---|---|---|---|---|

|
#1
Willow Wren Ct Unit 308
Florissant, MO 63033
|
955 sq. feet
|
2 baths 2 beds |
$78,000
|
show details |

|
#2
Ross Ave
Saint Louis, MO 63146
|
1,520 sq. feet
|
2 baths 3 beds |
$218,400
|
show details |

|
#3
Cricket Ct
Florissant, MO 63033
|
1,557 sq. feet
|
2 baths 4 beds |
$90,250
|
show details |

|
#4
E Milton Ave
Saint Louis, MO 63114
|
1,325 sq. feet
|
1 baths 2 beds |
$184,900
|
show details |

|
#5
Mallet Hl
Ballwin, MO 63021
|
4,530 sq. feet
|
4 baths 5 beds |
$649,900
|
show details |

|
#6
Canton Ave
Saint Louis, MO 63130
|
1,516 sq. feet
|
1 baths 3 beds |
$179,900
|
show details |

|
#7
Shelburne Dr
Saint Charles, MO 63301
|
1,436 sq. feet
|
2 baths 3 beds |
$219,900
|
show details |

|
#8
Grants Pkwy
Florissant, MO 63031
|
986 sq. feet
|
1 baths 3 beds |
$167,000
|
show details |

|
#9
Majella Dr
Bridgeton, MO 63044
|
- sq. feet
|
1 baths 3 beds |
$88,400
|
show details |

|
#10
Flamingo Dr
Florissant, MO 63031
|
1,025 sq. feet
|
1 baths 3 beds |
show details |
| Photo | Address | Area | Beds / Baths | Price | Details |
|---|---|---|---|---|---|

|
#11
Taylor Ave
Bridgeton, MO 63044
|
2,252 sq. feet
|
3 baths 4 beds |
show details | |

|
#12
Brower Ct
Saint Louis, MO 63134
|
840 sq. feet
|
1 baths 2 beds |
show details | |

|
#13
Foxmont Dr
Hazelwood, MO 63042
|
1,053 sq. feet
|
1 baths 3 beds |
show details | |

|
#14
Roanoke Dr
Saint Charles, MO 63304
|
2,526 sq. feet
|
2 baths 4 beds |
show details | |

|
#15
Liberty Grove Dr
Foristell, MO 63348
|
1,890 sq. feet
|
3 baths 4 beds |
show details | |

|
#16
Arbor Green Dr
Saint Charles, MO 63304
|
2,165 sq. feet
|
2 baths 4 beds |
show details | |

|
#17
Eastbrook Dr
Saint Louis, MO 63114
|
816 sq. feet
|
1 baths 2 beds |
show details | |

|
#18
Jacobs Crossing Dr
Saint Charles, MO 63304
|
2,413 sq. feet
|
3 baths 4 beds |
show details | |

|
#19
Lynnbrook Dr
Saint Charles, MO 63303
|
1,260 sq. feet
|
3 baths 3 beds |
show details | |

|
#20
Belleau Lake Dr
O Fallon, MO 63366
|
1,508 sq. feet
|
2 baths 3 beds |
show details |
| Photo | Address | Area | Beds / Baths | Price | Details |
|---|---|---|---|---|---|

|
#21
Orleans Ln
Florissant, MO 63031
|
1,424 sq. feet
|
1 baths 3 beds |
show details | |

|
#22
North Ave
Saint Louis, MO 63114
|
962 sq. feet
|
1 baths 3 beds |
show details | |

|
#23
Cumberland Lndg
Saint Charles, MO 63303
|
2,387 sq. feet
|
3 baths 3 beds |
show details | |

|
#24
Echo Ln
Saint Louis, MO 63114
|
900 sq. feet
|
1 baths 2 beds |
show details | |

|
#25
Kathlyn Dr
Saint Louis, MO 63134
|
1,200 sq. feet
|
1 baths 2 beds |
show details | |

|
#26
Woodrun Dr
Ballwin, MO 63021
|
1,310 sq. feet
|
3 baths 3 beds |
show details | |

|
#27
Faris Ave
Saint Louis, MO 63130
|
1,200 sq. feet
|
1 baths 3 beds |
show details | |

|
#28
Skylark Dr
Florissant, MO 63031
|
1,807 sq. feet
|
3 baths 3 beds |
show details | |

|
#29
Orchid Blossom Ct
Saint Peters, MO 63376
|
- sq. feet
|
2 baths 3 beds |
show details | |

|
#30
Green Valley Dr
Saint Peters, MO 63376
|
800 sq. feet
|
1 baths 2 beds |
show details |
| Photo | Address | Area | Beds / Baths | Price | Details |
|---|---|---|---|---|---|

|
#31
Marble Crossing Dr
Wentzville, MO 63385
|
1,294 sq. feet
|
2 baths 3 beds |
show details | |

|
#32
Driftwood Trails Dr
Florissant, MO 63031
|
1,283 sq. feet
|
2 baths 3 beds |
show details | |

|
#33
Lindsay Ln
Florissant, MO 63031
|
1,123 sq. feet
|
2 baths 3 beds |
show details | |

|
#34
Boggan Pl
Florissant, MO 63031
|
1,425 sq. feet
|
1 baths 2 beds |
show details | |

|
#35
Tulip Tree Ln
Hazelwood, MO 63042
|
1,602 sq. feet
|
2 baths 4 beds |
show details | |

|
#36
Somerset Dr
Florissant, MO 63033
|
1,565 sq. feet
|
2 baths 3 beds |
show details | |

|
#37
Tulip Tree Ln
Hazelwood, MO 63042
|
839 sq. feet
|
1 baths 3 beds |
show details | |

|
#38
Cypress Creek Dr
Florissant, MO 63031
|
1,012 sq. feet
|
2 baths 2 beds |
show details | |

|
#39
Pine Bend Dr
Chesterfield, MO 63005
|
3,770 sq. feet
|
5 baths 4 beds |
show details | |

|
#40
Pine Bend Dr
Chesterfield, MO 63005
|
4,770 sq. feet
|
4 baths 4 beds |
show details |
| Photo | Address | Area | Beds / Baths | Price | Details |
|---|---|---|---|---|---|

|
#41
Mars Ln
Maryland Heights, MO 63043
|
1,260 sq. feet
|
1 baths 3 beds |
show details | |

|
#42
Barrett Station Rd
Saint Louis, MO 63122
|
1,974 sq. feet
|
2 baths 3 beds |
show details | |

|
#43
Hawkesbury Dr
Saint Louis, MO 63121
|
1,227 sq. feet
|
2 baths 3 beds |
show details | |

|
#44
Redcoat Dr
Maryland Heights, MO 63043
|
1,478 sq. feet
|
2 baths 4 beds |
show details | |

|
#45
Plaza Ave
Saint Louis, MO 63135
|
725 sq. feet
|
1 baths 2 beds |
show details | |

|
#46
Warm Winds Dr
O Fallon, MO 63366
|
1,663 sq. feet
|
2 baths 3 beds |
show details | |

|
#47
Dombard Ln
Saint Louis, MO 63134
|
1,252 sq. feet
|
2 baths 3 beds |
show details | |

|
#48
Ashby Rd
Saint Louis, MO 63114
|
972 sq. feet
|
1 baths 2 beds |
show details | |

|
#49
N Florissant Rd
Saint Louis, MO 63135
|
- sq. feet
|
1 baths 3 beds |
show details | |

|
Check over 1 million property listings on Foreclosure.com!
|
browse all offers | |||


- 49,33083.9%White alone
- 3,7526.4%Two or more races
- 2,7064.6%Black alone
- 1,5082.6%Hispanic
- 1,2752.2%Asian alone
- 380.06%American Indian alone
- 380.06%Other race alone
- 180.03%Native Hawaiian and Other
Pacific Islander alone
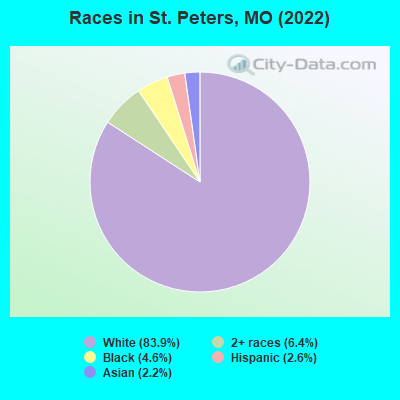
Races in St. Peters detailed stats: ancestries, foreign born residents, place of birth
According to our research of Missouri and other state lists, there were 86 registered sex offenders living in St. Peters, Missouri as of April 27, 2024.
The ratio of all residents to sex offenders in St. Peters is 668 to 1.
The ratio of registered sex offenders to all residents in this city is lower than the state average.
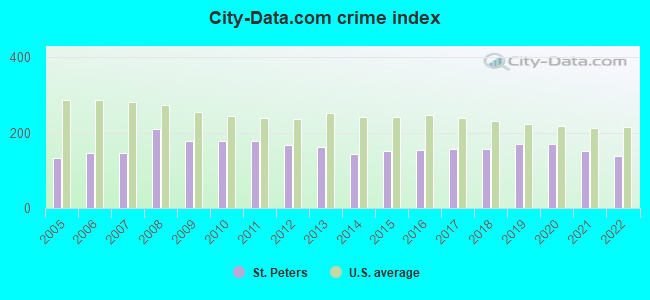
The City-Data.com crime index weighs serious crimes and violent crimes more heavily. Higher means more crime, U.S. average is 246.1. It adjusts for the number of visitors and daily workers commuting into cities.
- means the value is smaller than the state average.- means the value is about the same as the state average.
- means the value is bigger than the state average.
Crime rate in St. Peters detailed stats: murders, rapes, robberies, assaults, burglaries, thefts, arson
Full-time law enforcement employees in 2021, including police officers: 123 (96 officers - 88 male; 8 female).
| Officers per 1,000 residents here: | 1.64 |
| Missouri average: | 2.54 |
 Recent articles from our blog. Our writers, many of them Ph.D. graduates or candidates, create easy-to-read articles on a wide variety of topics.

 | What is wrong with St.Charles County? (227 replies) |
| St. Peters - your opinions (13 replies) |
| Amazon is looking for a second headquarters (177 replies) |
| Missouri Outlaw History (3407 replies) |
| Asians moving to STL (42 replies) |
| St Louis A Possibility? (38 replies) |
Latest news from St. Peters, MO collected exclusively by city-data.com from local newspapers, TV, and radio stations
Ancestries: German (29.2%), American (12.0%), Irish (9.6%), English (6.3%), Italian (5.6%), European (2.5%).
Current Local Time: CST time zone
Incorporated in 1910
Elevation: 435 feet
Land area: 21.2 square miles.
Population density: 2,763 people per square mile (average).
1,747 residents are foreign born (1.3% Asia, 0.8% Latin America, 0.6% Europe).
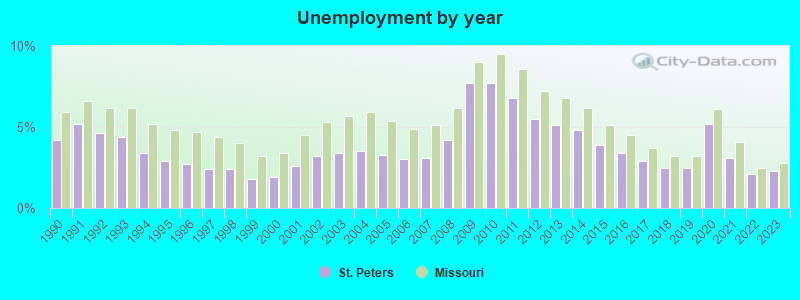
| This city: | 3.0% |
| Missouri: | 4.2% |
Median real estate property taxes paid for housing units with mortgages in 2022: $2,861 (1.1%)
Median real estate property taxes paid for housing units with no mortgage in 2022: $2,720 (1.1%)
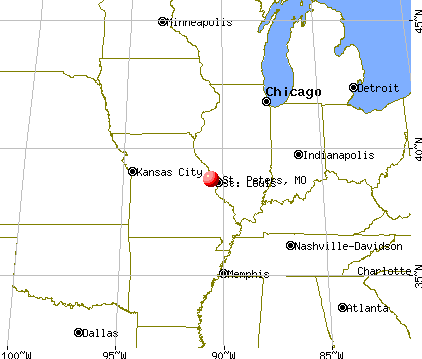
Nearest city with pop. 200,000+: St. Louis, MO  (22.1 miles , pop. 348,189).
Nearest city with pop. 1,000,000+: Chicago, IL (261.9 miles , pop. 2,896,016).
Nearest cities:
), ), Latitude: 38.78 N, Longitude: 90.60 W
Daytime population change due to commuting: +3,456 (+5.9%)
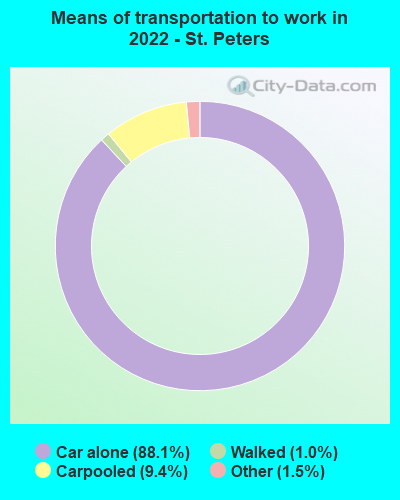
Workers who live and work in this city: 10,814 (34.3%)
St. Peters, Missouri accommodation & food services, waste management - Economy and Business Data
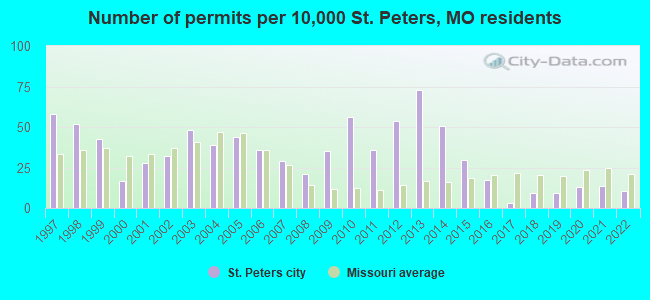
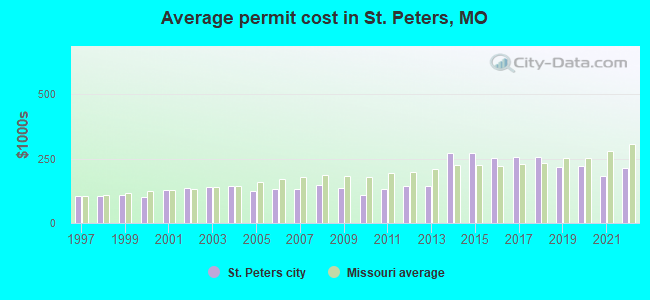
Single-family new house construction building permits:
- 2022: 55 buildings, average cost: $213,800
- 2021: 69 buildings, average cost: $181,600
- 2020: 67 buildings, average cost: $221,700
- 2019: 49 buildings, average cost: $215,900
- 2018: 48 buildings, average cost: $255,100
- 2017: 17 buildings, average cost: $254,700
- 2016: 89 buildings, average cost: $252,700
- 2015: 152 buildings, average cost: $269,600
- 2014: 261 buildings, average cost: $270,000
- 2013: 373 buildings, average cost: $143,400
- 2012: 277 buildings, average cost: $143,600
- 2011: 183 buildings, average cost: $130,000
- 2010: 290 buildings, average cost: $110,200
- 2009: 181 buildings, average cost: $136,700
- 2008: 108 buildings, average cost: $147,500
- 2007: 150 buildings, average cost: $131,900
- 2006: 185 buildings, average cost: $130,200
- 2005: 226 buildings, average cost: $122,600
- 2004: 199 buildings, average cost: $143,700
- 2003: 246 buildings, average cost: $140,700
- 2002: 165 buildings, average cost: $135,700
- 2001: 143 buildings, average cost: $127,400
- 2000: 85 buildings, average cost: $101,500
- 1999: 218 buildings, average cost: $106,700
- 1998: 268 buildings, average cost: $103,900
- 1997: 299 buildings, average cost: $103,300
| Here: | 2.3% |
| Missouri: | 2.8% |
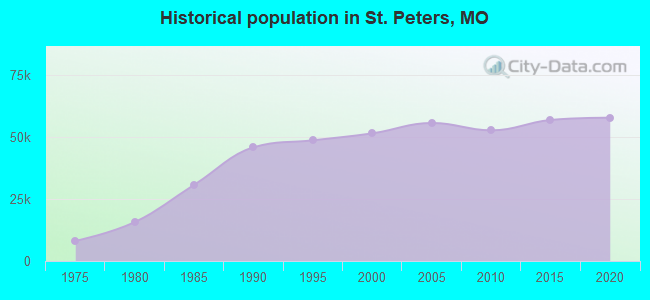
Population change in the 1990s: +9,344 (+22.2%).
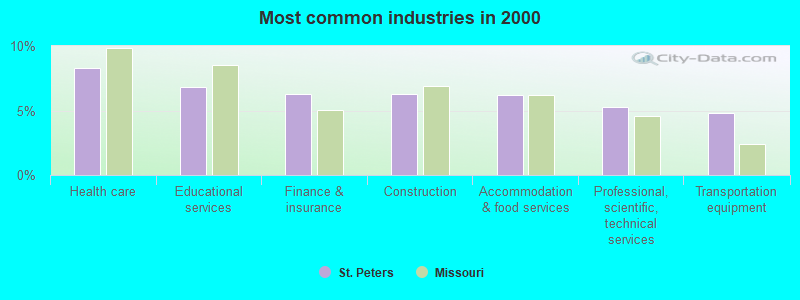
- Health care (8.3%)
- Educational services (6.8%)
- Finance & insurance (6.3%)
- Construction (6.3%)
- Accommodation & food services (6.2%)
- Professional, scientific, technical services (5.3%)
- Transportation equipment (4.8%)
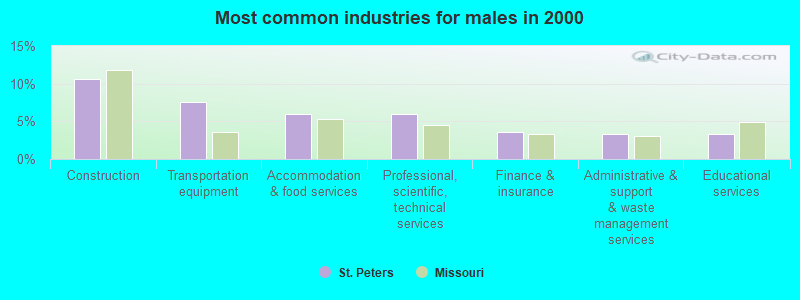
- Construction (10.7%)
- Transportation equipment (7.5%)
- Accommodation & food services (6.0%)
- Professional, scientific, technical services (5.9%)
- Finance & insurance (3.6%)
- Administrative & support & waste management services (3.3%)
- Educational services (3.3%)
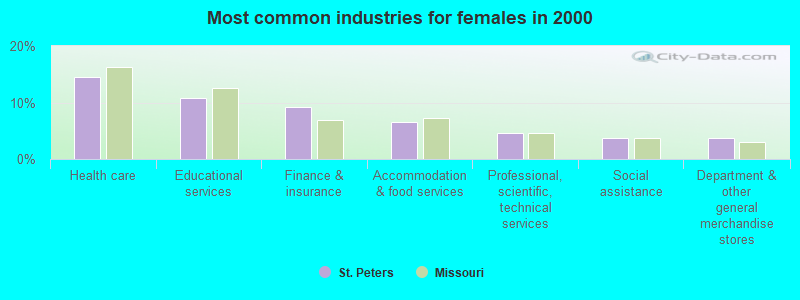
- Health care (14.5%)
- Educational services (10.7%)
- Finance & insurance (9.3%)
- Accommodation & food services (6.6%)
- Professional, scientific, technical services (4.6%)
- Social assistance (3.8%)
- Department & other general merchandise stores (3.8%)

- Cooks and food preparation workers (6.1%)
- Other management occupations, except farmers and farm managers (4.7%)
- Computer specialists (4.3%)
- Retail sales workers, except cashiers (3.8%)
- Material recording, scheduling, dispatching, and distributing workers (2.8%)
- Registered nurses (2.5%)
- Secretaries and administrative assistants (2.5%)
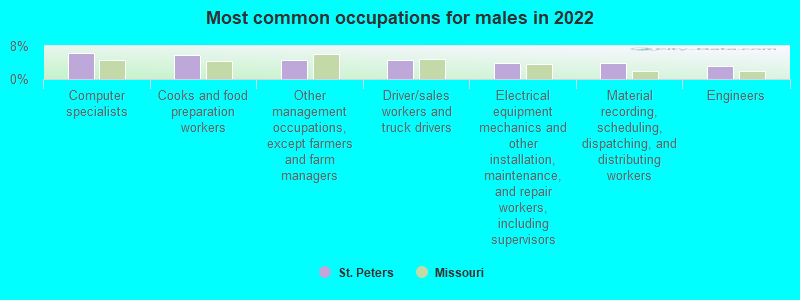
- Computer specialists (6.4%)
- Cooks and food preparation workers (5.8%)
- Other management occupations, except farmers and farm managers (4.5%)
- Driver/sales workers and truck drivers (4.5%)
- Electrical equipment mechanics and other installation, maintenance, and repair workers, including supervisors (4.0%)
- Material recording, scheduling, dispatching, and distributing workers (3.9%)
- Engineers (3.3%)

- Cooks and food preparation workers (6.3%)
- Registered nurses (4.9%)
- Retail sales workers, except cashiers (4.9%)
- Other management occupations, except farmers and farm managers (4.8%)
- Secretaries and administrative assistants (4.8%)
- Other financial specialists (3.5%)
- Other teachers, instructors, education, training, and library occupations (3.5%)
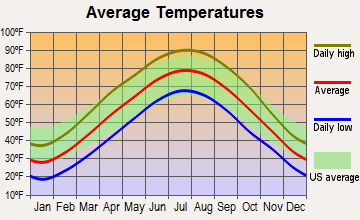
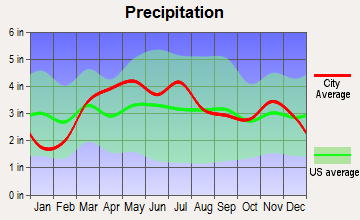
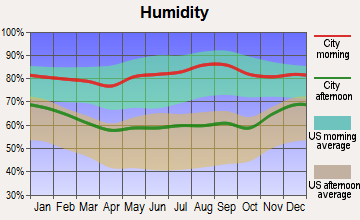
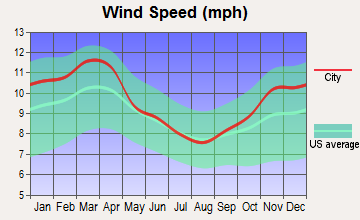
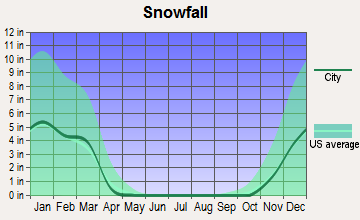
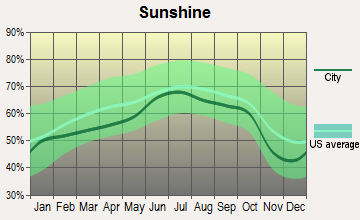
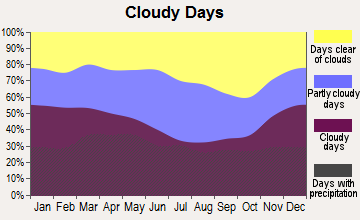
Average climate in St. Peters, Missouri
Based on data reported by over 4,000 weather stations
|
|

(lower is better)
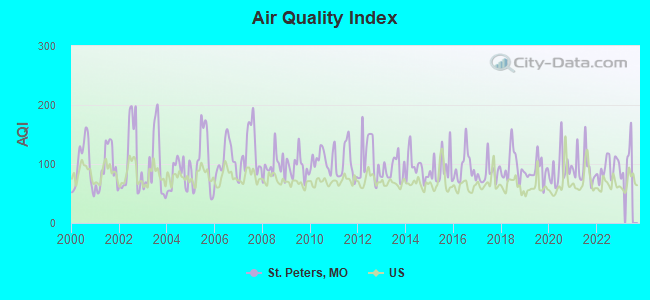
Air Quality Index (AQI) level in 2022 was 93.9. This is worse than average.
| City: | 93.9 |
| U.S.: | 72.6 |
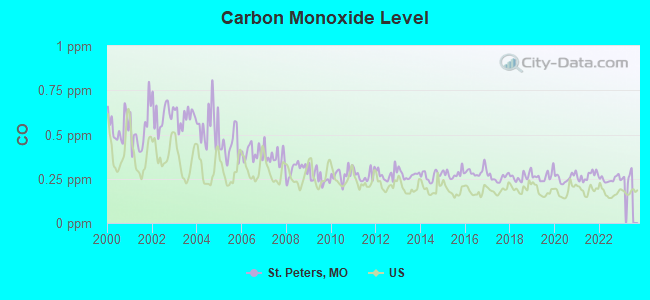
Carbon Monoxide (CO) [ppm] level in 2022 was 0.247. This is about average. Closest monitor was 5.5 miles away from the city center.
| City: | 0.247 |
| U.S.: | 0.251 |
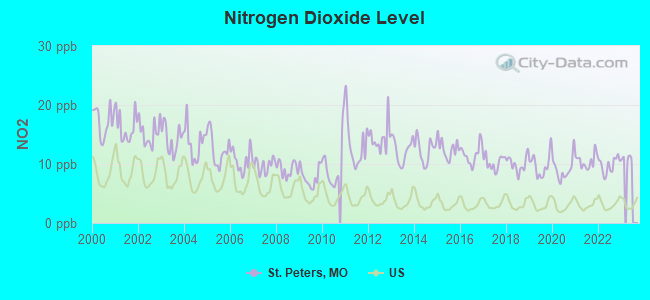
Nitrogen Dioxide (NO2) [ppb] level in 2022 was 9.80. This is significantly worse than average. Closest monitor was 5.5 miles away from the city center.
| City: | 9.80 |
| U.S.: | 5.11 |
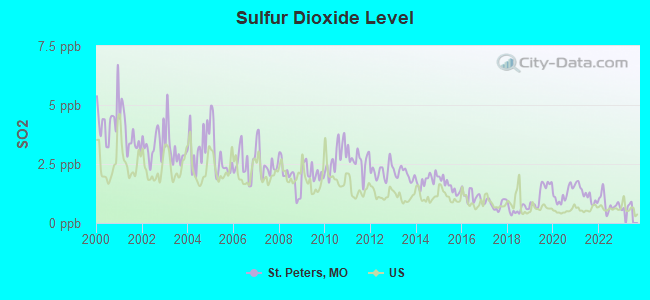
Sulfur Dioxide (SO2) [ppb] level in 2022 was 0.830. This is significantly better than average. Closest monitor was 5.5 miles away from the city center.
| City: | 0.830 |
| U.S.: | 1.515 |
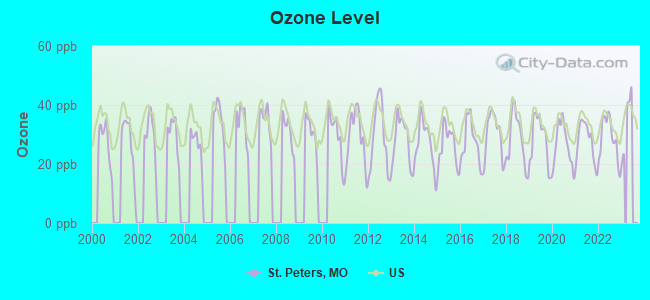
Ozone [ppb] level in 2022 was 28.7. This is about average. Closest monitor was 5.5 miles away from the city center.
| City: | 28.7 |
| U.S.: | 33.3 |
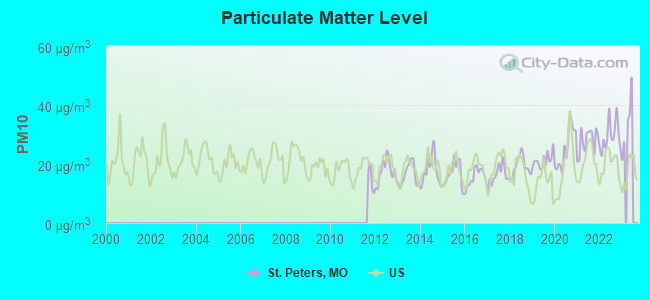
Particulate Matter (PM10) [µg/m3] level in 2022 was 29.5. This is significantly worse than average. Closest monitor was 12.6 miles away from the city center.
| City: | 29.5 |
| U.S.: | 19.2 |
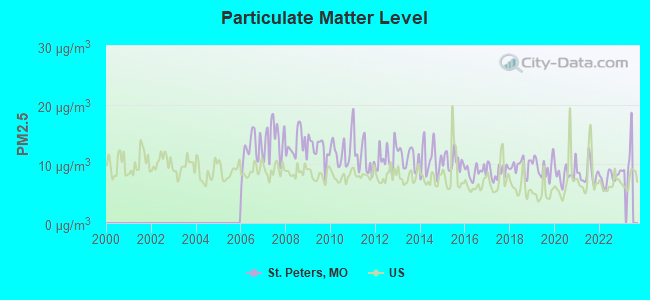
Particulate Matter (PM2.5) [µg/m3] level in 2022 was 7.69. This is about average. Closest monitor was 16.3 miles away from the city center.
| City: | 7.69 |
| U.S.: | 8.11 |
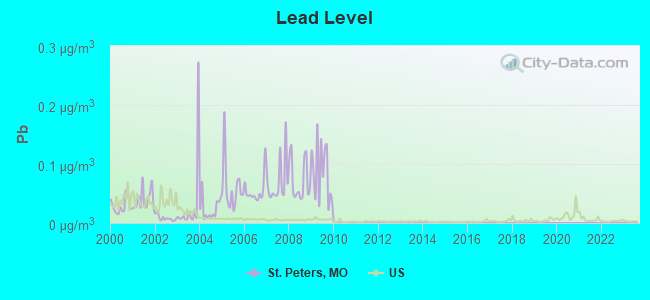
Lead (Pb) [µg/m3] level in 2009 was 0.0856. This is significantly worse than average. Closest monitor was 5.5 miles away from the city center.
| City: | 0.0856 |
| U.S.: | 0.0093 |
Tornado activity:
St. Peters-area historical tornado activity is near Missouri state average. It is 66% greater than the overall U.S. average.
On 1/24/1967, a category F4 (max. wind speeds 207-260 mph) tornado 7.4 miles away from the St. Peters city center killed 3 people and injured 216 people and caused between $5,000,000 and $50,000,000 in damages.
On 2/10/1959, a category F4 tornado 17.2 miles away from the city center killed 21 people and injured 345 people and caused between $5,000,000 and $50,000,000 in damages.
Earthquake activity:
St. Peters-area historical earthquake activity is significantly above Missouri state average. It is 320% greater than the overall U.S. average.On 4/18/2008 at 09:36:59, a magnitude 5.4 (5.1 MB, 4.8 MS, 5.4 MW, 5.2 MW, Class: Moderate, Intensity: VI - VII) earthquake occurred 148.6 miles away from the city center
On 4/18/2008 at 09:36:59, a magnitude 5.2 (5.2 MW, Depth: 8.9 mi) earthquake occurred 148.6 miles away from the city center
On 6/10/1987 at 23:48:54, a magnitude 5.1 (4.9 MB, 4.4 MS, 4.6 MS, 5.1 LG) earthquake occurred 146.5 miles away from the city center
On 9/26/1990 at 13:18:51, a magnitude 5.0 (4.7 MB, 4.8 LG, 5.0 LG, Depth: 7.7 mi) earthquake occurred 125.8 miles away from St. Peters center
On 5/4/1991 at 01:18:54, a magnitude 5.0 (4.4 MB, 4.6 LG, 5.0 LG, Depth: 3.1 mi) earthquake occurred 159.0 miles away from St. Peters center
On 6/18/2002 at 17:37:15, a magnitude 5.0 (4.3 MB, 4.6 MW, 5.0 LG) earthquake occurred 162.6 miles away from St. Peters center
Magnitude types: regional Lg-wave magnitude (LG), body-wave magnitude (MB), surface-wave magnitude (MS), moment magnitude (MW)
Natural disasters:
The number of natural disasters in St. Charles County (4) is a lot smaller than the US average (15).Major Disasters (Presidential) Declared: 1
Emergencies Declared: 1
Causes of natural disasters: Floods: 3, Storms: 3, Tornadoes: 3, Winds: 2, Other: 1 (Note: some incidents may be assigned to more than one category).

Hospitals and medical centers near St. Peters:
- ST PETERS MANOR CARE CENTER (Nursing Home, about 1 miles away; SAINT PETERS, MO)
- GREAT RIVERS HEALTH CARE MGMT (Home Health Center, about 1 miles away; SAINT PETERS, MO)
- SAINT CHARLES COUNTY DIALYSIS (Dialysis Facility, about 2 miles away; SAINT PETERS, MO)
- BARNES-JEWISH ST PETERS HOSPITAL Acute Care Hospitals (about 2 miles away; SAINT PETERS, MO)
- ST CHARLES HABILITATION CENTER (Hospital, about 4 miles away; SAINT CHARLES, MO)
- BENCHMARK HEALTHCARE OF ST CHARLES (Nursing Home, about 5 miles away; SAINT CHARLES, MO)
- NHC HEALTHCARE, ST CHARLES (Nursing Home, about 5 miles away; SAINT CHARLES, MO)
Airports and heliports located in St. Peters:
See details about Airports and heliports located in St. Peters, MOAmtrak station near St. Peters:
College/University in St. Peters:
Colleges/universities with over 2000 students nearest to St. Peters:
- St Charles Community College (about 3 miles; Cottleville, MO; Full-time enrollment: 5,302)
- Lindenwood University (about 6 miles; Saint Charles, MO; FT enrollment: 11,117)
- Maryville University of Saint Louis (about 11 miles; Saint Louis, MO; FT enrollment: 3,651)
- Missouri Baptist University (about 13 miles; Saint Louis, MO; FT enrollment: 2,898)
- University of Missouri-St Louis (about 17 miles; Saint Louis, MO; FT enrollment: 10,322)
- Washington University in St Louis (about 19 miles; Saint Louis, MO; FT enrollment: 10,823)
- Webster University (about 20 miles; Saint Louis, MO; FT enrollment: 12,406)
Public high schools in St. Peters:
- FT. ZUMWALT SOUTH HIGH (Students: 2,087, Location: 8050 MEXICO RD, Grades: 9-12)
- BOONSLICK SCHOOL (Students: 129, Location: 321 KNAUST RD, Grades: KG-12)
- FT. ZUMWALT EAST HIGH (Location: 600 1ST EXECUTIVE AVE, Grades: 9-12)
Public elementary/middle schools in St. Peters:
- FT. ZUMWALT SOUTH MIDDLE (Students: 1,179, Location: 300 KNAUST RD, Grades: 6-8)
- PROGRESS SOUTH ELEM. (Students: 970, Location: 201 KNAUST RD, Grades: KG-5)
- FAIRMOUNT ELEM. (Students: 960, Location: 1725 THOELE RD, Grades: KG-5)
- DR. BERNARD J. DUBRAY MIDDLE (Students: 861, Location: 100 DUBRAY DR, Grades: 6-8)
- WARREN ELEM. (Students: 737, Location: 141 WEISS RD, Grades: KG-5)
- HAWTHORN ELEM. (Students: 543, Location: 166 BOONE HILLS DR, Grades: KG-5)
- MID RIVERS ELEM. (Students: 515, Location: 7479 MEXICO RD, Grades: KG-5)
- LEWIS CLARK ELEM. (Students: 434, Location: 460 MCMENAMY RD, Grades: 3-5)
- ST. PETERS ELEM. (Students: 421, Location: 400 MCMENAMY RD, Grades: KG-2)
Library in St. Peters:
- SAINT CHARLES CITY-COUNTY LIBRARY DISTRICT (Operating income: $16,133,263; Location: 77 BOONE HILLS DR.; 840,389 books; 45,695 e-books; 76,491 audio materials; 70,471 video materials; 182 local licensed databases; 14 state licensed databases; 2 other licensed databases; 4,383 print serial subscriptions; 2,109 electronic serial subscriptions)
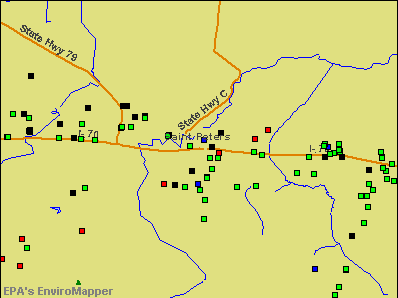
Points of interest:
Notable locations in St. Peters: Saint Peters Spencer Center Sewage Treatment Plant (A), Central County Fire and Rescue Station 1 (B), Central County Fire and Rescue Station 2 (C), Central County Fire and Rescue Station 3 (D), Central County Fire and Rescue Station 4 (E). Display/hide their locations on the map
Shopping Centers: Saint Peters Square Shopping Center (1), Westfield Shopping Town-Mid Rivers Shopping Center (2), Midrivers Mall (3), Cave Spring Crossing Shopping Center (4), Cave Springs Square Shopping Center (5), Harvester Square Shopping Center (6), Mid Rivers Center Shopping Center (7), Mid Rivers Plaza Shopping Center (8). Display/hide their locations on the map
Churches in St. Peters include: Wesleyan Church (A), Church On the Rock (B). Display/hide their locations on the map
Creeks: Belleau Creek (A), Spencer Creek (B). Display/hide their locations on the map
Birthplace of: Manley Ottmer Hudson - Lawyer for public international law, Kellie Suttle - Athletics competitor.
| This city: | 2.5 people |
| Missouri: | 2.5 people |
| This city: | 68.3% |
| Whole state: | 65.3% |
| This city: | 5.9% |
| Whole state: | 6.7% |
Likely homosexual households (counted as self-reported same-sex unmarried-partner households)
- Lesbian couples: 0.2% of all households
- Gay men: 0.2% of all households
People in group quarters in St. Peters in 2010:
- 184 people in nursing facilities/skilled-nursing facilities
- 13 people in group homes intended for adults
- 6 people in other noninstitutional facilities
People in group quarters in St. Peters in 2000:
- 127 people in nursing homes
- 10 people in other noninstitutional group quarters
- 6 people in homes for the mentally retarded
- 3 people in other nonhousehold living situations
Banks with branches in St. Peters (2011 data):
- Regions Bank: Spencer Crossing Branch at 229 Spencer Road, branch established on 1997/12/22; Mid Rivers Mall Banking Ctr. Branch at 1228 Mid Rivers Mall Drive, Suite 103, branch established on 1997/09/09. Info updated 2011/02/24: Bank assets: $123,368.2 mil, Deposits: $98,301.3 mil, headquarters in Birmingham, AL, positive income, Commercial Lending Specialization, 1778 total offices, Holding Company: Regions Financial Corporation
- St. Johns Bank and Trust Company: Cave Springs Facility at 1053 Cave Springs Road, branch established on 1992/09/14. Info updated 2006/11/03: Bank assets: $303.8 mil, Deposits: $273.6 mil, headquarters in Saint Louis, MO, positive income, Commercial Lending Specialization, 7 total offices, Holding Company: Unity Bancshares, L.L.c.
- Enterprise Bank & Trust: St. Peters Branch at 300 St. Peters Centre Boulevard, branch established on 1996/11/25. Info updated 2011/11/08:, headquarters in Clayton, MO, 21 total offices
- Lindell Bank & Trust Company: 5500 Mexico Road Branch at 5500 Mexico Road, branch established on 1989/03/30. Info updated 2010/01/07: Bank assets: $506.6 mil, Deposits: $373.2 mil, headquarters in St. Louis, MO, positive income, Commercial Lending Specialization, 10 total offices, Holding Company: First Illinois Bancorp, Inc.
- CBC Bank: St. Peters Branch at 688 Salt Lick Road, branch established on 1998/04/15. Info updated 2006/11/03: Bank assets: $32.7 mil, Deposits: $29.3 mil, headquarters in Bowling Green, MO, negative income in the last year, Commercial Lending Specialization, 4 total offices, Holding Company: Clifford Bancshares, Inc.
- Citizens National Bank of Greater St. Louis: 671 Salt Lick Road Branch at 671 Salt Lick Road, branch established on 1998/06/09. Info updated 2006/11/03: Bank assets: $455.0 mil, Deposits: $377.0 mil, headquarters in Maplewood, MO, positive income, Commercial Lending Specialization, 6 total offices, Holding Company: Cardinal Bancorp, Inc.
- Truman Bank: Blackstone Centre Branch at 3899 South Outer Service Road, Unit J, branch established on 1998/01/14. Info updated 2006/07/10: Bank assets: $315.3 mil, Deposits: $265.8 mil, headquarters in St. Louis, MO, negative income in the last year, Commercial Lending Specialization, 4 total offices, Holding Company: Templar Fund, Inc., The
For population 15 years and over in St. Peters:
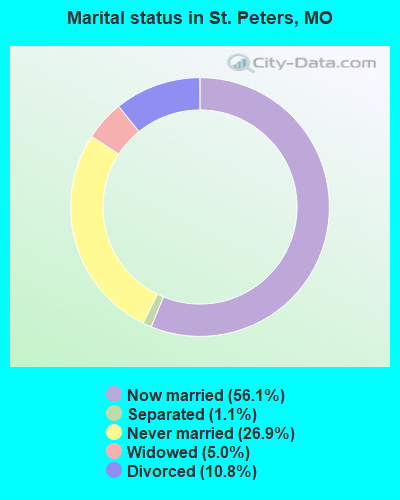
- Never married: 26.9%
- Now married: 56.1%
- Separated: 1.1%
- Widowed: 5.0%
- Divorced: 10.8%
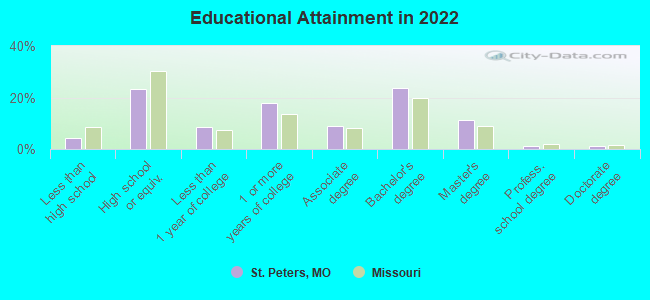
For population 25 years and over in St. Peters:
- High school or higher: 95.5%
- Bachelor's degree or higher: 38.1%
- Graduate or professional degree: 13.7%
- Unemployed: 2.1%
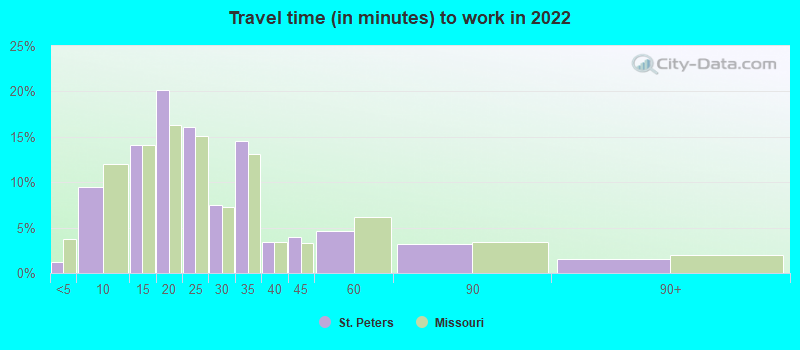
- Mean travel time to work (commute): 20.6 minutes
| Here: | 9.5 |
| Missouri average: | 11.1 |
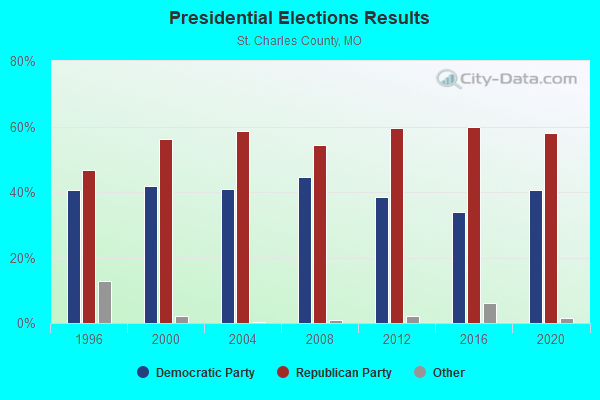

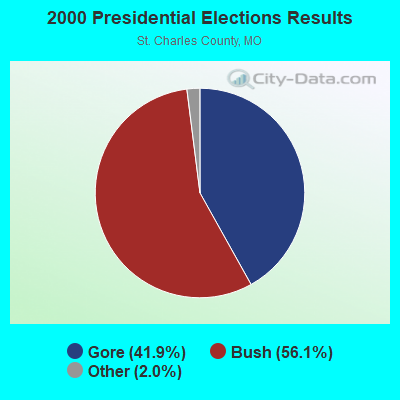
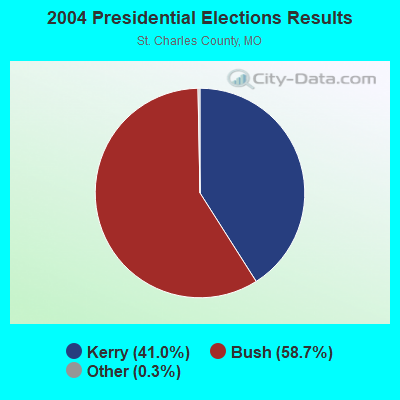
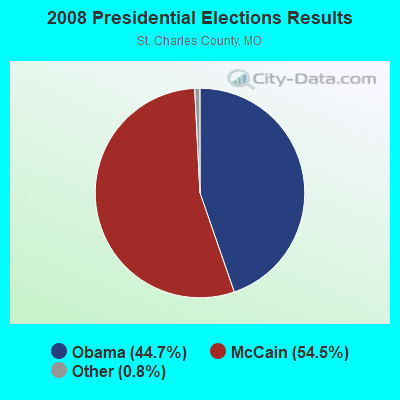
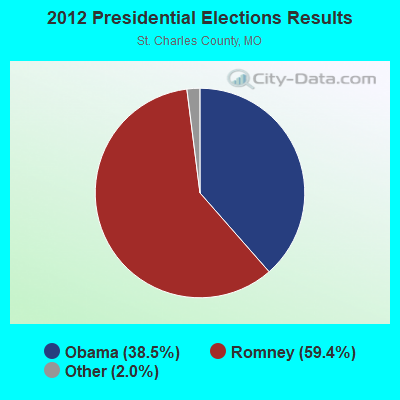
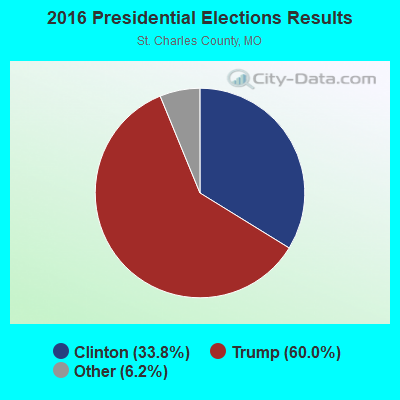
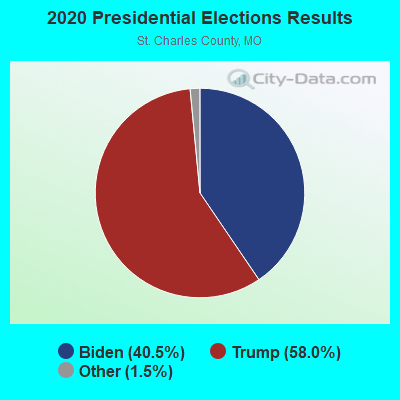
Graphs represent county-level data. Detailed 2008 Election Results
Religion statistics for St. Peters, MO (based on St. Charles County data)
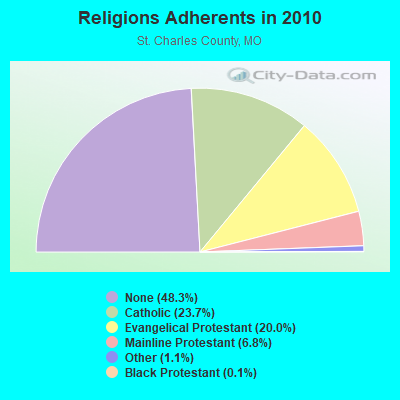
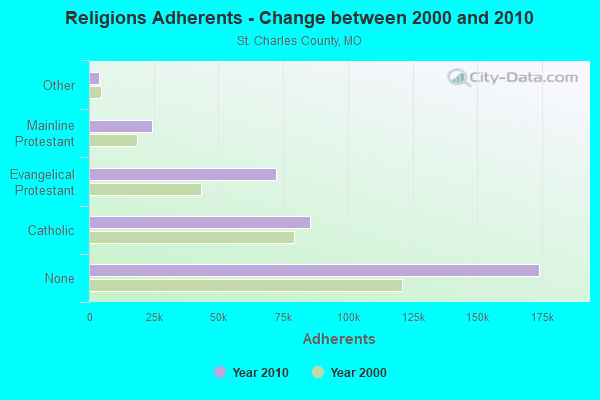
| Religion | Adherents | Congregations |
|---|---|---|
| Catholic | 85,536 | 20 |
| Evangelical Protestant | 72,210 | 141 |
| Mainline Protestant | 24,412 | 38 |
| Other | 3,929 | 22 |
| Black Protestant | 406 | 3 |
| None | 173,992 | - |
Food Environment Statistics:
| This county: | 1.02 / 10,000 pop. |
| Missouri: | 1.88 / 10,000 pop. |
| St. Charles County: | 0.06 / 10,000 pop. |
| Missouri: | 0.18 / 10,000 pop. |
| This county: | 0.29 / 10,000 pop. |
| Missouri: | 0.60 / 10,000 pop. |
| This county: | 3.00 / 10,000 pop. |
| Missouri: | 4.34 / 10,000 pop. |
| St. Charles County: | 7.02 / 10,000 pop. |
| Missouri: | 7.37 / 10,000 pop. |
| This county: | 8.0% |
| Missouri: | 8.8% |
| St. Charles County: | 28.0% |
| State: | 29.6% |
| Here: | 15.1% |
| Missouri: | 13.5% |
Health and Nutrition:
| Here: | 51.8% |
| State: | 50.9% |
| St. Peters: | 50.9% |
| Missouri: | 48.6% |
| St. Peters: | 28.5 |
| Missouri: | 28.7 |
| Here: | 20.6% |
| State: | 20.6% |
| St. Peters: | 8.6% |
| Missouri: | 10.1% |
| St. Peters: | 6.8 |
| State: | 6.8 |
| This city: | 34.4% |
| Missouri: | 34.3% |
| This city: | 59.4% |
| State: | 57.5% |
| This city: | 81.0% |
| Missouri: | 79.3% |
More about Health and Nutrition of St. Peters, MO Residents
St. Peters government finances - Expenditure in 2021 (per resident):
- Construction - Regular Highways: $2,977,000 ($50.87)
Sewerage: $467,000 ($7.98)
Parks and Recreation: $187,000 ($3.20)
Water Utilities: $104,000 ($1.78)
Protective Inspection and Regulation - Other: $21,000 ($0.36)
- Current Operations - Police Protection: $13,685,000 ($233.84)
Parks and Recreation: $11,016,000 ($188.23)
Solid Waste Management: $10,958,000 ($187.24)
Regular Highways: $8,932,000 ($152.62)
Sewerage: $6,640,000 ($113.46)
Water Utilities: $4,440,000 ($75.87)
Financial Administration: $4,028,000 ($68.83)
General - Other: $2,445,000 ($41.78)
Protective Inspection and Regulation - Other: $1,837,000 ($31.39)
Central Staff Services: $1,670,000 ($28.54)
General Public Buildings: $904,000 ($15.45)
Health - Other: $601,000 ($10.27)
Judicial and Legal Services: $476,000 ($8.13)
Housing and Community Development: $208,000 ($3.55)
- General - Interest on Debt: $3,100,000 ($52.97)
- Other Capital Outlay - Parks and Recreation: $3,385,000 ($57.84)
Financial Administration: $1,139,000 ($19.46)
Sewerage: $982,000 ($16.78)
Regular Highways: $862,000 ($14.73)
Water Utilities: $432,000 ($7.38)
Solid Waste Management: $378,000 ($6.46)
Police Protection: $256,000 ($4.37)
Protective Inspection and Regulation - Other: $208,000 ($3.55)
General - Other: $99,000 ($1.69)
Health - Other: $92,000 ($1.57)
- Total Salaries and Wages: $34,732,000 ($593.48)
- Water Utilities - Interest on Debt: $336,000 ($5.74)
St. Peters government finances - Revenue in 2021 (per resident):
- Charges - Solid Waste Management: $13,294,000 ($227.16)
Sewerage: $5,658,000 ($96.68)
Parks and Recreation: $5,658,000 ($96.68)
Other: $1,941,000 ($33.17)
- Federal Intergovernmental - Other: $1,487,000 ($25.41)
Highways: $654,000 ($11.18)
- Local Intergovernmental - Highways: $2,187,000 ($37.37)
Other: $211,000 ($3.61)
- Miscellaneous - General Revenue - Other: $1,188,000 ($20.30)
Special Assessments: $828,000 ($14.15)
Sale of Property: $746,000 ($12.75)
Fines and Forfeits: $606,000 ($10.35)
Rents: $295,000 ($5.04)
Interest Earnings: $217,000 ($3.71)
Donations From Private Sources: $110,000 ($1.88)
- Revenue - Water Utilities: $7,550,000 ($129.01)
- State Intergovernmental - Highways: $1,339,000 ($22.88)
Other: $40,000 ($0.68)
- Tax - General Sales and Gross Receipts: $35,236,000 ($602.09)
Property: $11,433,000 ($195.36)
Public Utilities Sales: $4,243,000 ($72.50)
Motor Vehicle License: $709,000 ($12.11)
Occupation and Business License - Other: $300,000 ($5.13)
Tobacco Products Sales: $165,000 ($2.82)
Other Selective Sales: $133,000 ($2.27)
Alcoholic Beverage License: $88,000 ($1.50)
Other: $34,000 ($0.58)
Amusements License: $13,000 ($0.22)
St. Peters government finances - Debt in 2021 (per resident):
- Long Term Debt - Beginning Outstanding - Unspecified Public Purpose: $113,690,000 ($1942.66)
Outstanding Unspecified Public Purpose: $105,065,000 ($1795.28)
Retired Unspecified Public Purpose: $22,975,000 ($392.58)
Issue, Unspecified Public Purpose: $14,350,000 ($245.20)
Outstanding Nonguaranteed - Industrial Revenue: $13,305,000 ($227.35)
Beginning Outstanding - Public Debt for Private Purpose: $13,305,000 ($227.35)
St. Peters government finances - Cash and Securities in 2021 (per resident):
- Bond Funds - Cash and Securities: $1,359,000 ($23.22)
- Other Funds - Cash and Securities: $50,168,000 ($857.24)
- Sinking Funds - Cash and Securities: $17,428,000 ($297.80)
6.75% of this county's 2021 resident taxpayers lived in other counties in 2020 ($68,404 average adjusted gross income)
| Here: | 6.75% |
| Missouri average: | 7.67% |
0.01% of residents moved from foreign countries ($105 average AGI)
St. Charles County: 0.01% Missouri average: 0.02%
Top counties from which taxpayers relocated into this county between 2020 and 2021:
| from St. Louis County, MO | |
| from St. Louis city, MO | |
| from Lincoln County, MO |
6.01% of this county's 2020 resident taxpayers moved to other counties in 2021 ($73,859 average adjusted gross income)
| Here: | 6.01% |
| Missouri average: | 7.51% |
0.01% of residents moved to foreign countries ($135 average AGI)
St. Charles County: 0.01% Missouri average: 0.01%
Top counties to which taxpayers relocated from this county between 2020 and 2021:
| to St. Louis County, MO | |
| to Lincoln County, MO | |
| to Warren County, MO |
| Businesses in St. Peters, MO | ||||
| Name | Count | Name | Count | |
|---|---|---|---|---|
| ALDI | 2 | Men's Wearhouse | 2 | |
| AT&T | 3 | Motherhood Maternity | 1 | |
| Aeropostale | 1 | New York & Co | 1 | |
| American Eagle Outfitters | 1 | Nike | 6 | |
| Ann Taylor | 1 | Pac Sun | 1 | |
| Arby's | 2 | Panera Bread | 2 | |
| Bath & Body Works | 1 | Penske | 1 | |
| Bed Bath & Beyond | 1 | Red Robin | 1 | |
| Blockbuster | 2 | Ruby Tuesday | 1 | |
| Brunswick Bowling & Billiards | 1 | Rue21 | 1 | |
| Costco | 1 | Starbucks | 2 | |
| Days Inn | 1 | Steak 'n Shake | 3 | |
| Decora Cabinetry | 4 | The Limited | 1 | |
| Finish Line | 1 | True Value | 1 | |
| Foot Locker | 1 | U.S. Cellular | 3 | |
| Fredericks Of Hollywood | 1 | UPS | 1 | |
| Hobby Lobby | 1 | Value City Furniture | 1 | |
| Hot Topic | 1 | Victoria's Secret | 1 | |
| Kohl's | 1 | Volkswagen | 1 | |
| Macy's | 1 | White Castle | 1 | |
| Marshalls | 1 | YMCA | 1 | |
| MasterBrand Cabinets | 5 | |||
Strongest AM radio stations in St. Peters:
- KXEN (1010 AM; 50 kW; FESTUS-ST. LOUIS, MO; Owner: BDJ RADIO ENTERPRISES, LLC)
- KIRL (1460 AM; 5 kW; ST. CHARLES, MO; Owner: BRONCO BROADCASTING CO., INC.)
- KMOX (1120 AM; 50 kW; ST. LOUIS, MO; Owner: INFINITY BROADCASTING OPERATIONS, INC.)
- KFUO (850 AM; 5 kW; CLAYTON, MO; Owner: LUTHERAN CHURCH-MISSOURI SYNOD)
- KTRS (550 AM; 5 kW; ST. LOUIS, MO; Owner: KTRS-AM LICENSE, L.L.C.)
- KSIV (1320 AM; 5 kW; CLAYTON, MO; Owner: BOTT COMMUNICATIONS, INC.)
- KJSL (630 AM; 5 kW; ST. LOUIS, MO; Owner: WMUZ RADIO, INC.)
- WSDZ (1260 AM; 20 kW; BELLEVILLE, IL)
- KRFT (1190 AM; 10 kW; DE SOTO, MO; Owner: ALL SPORTS RADIO, LLC)
- KSLG (1380 AM; 5 kW; ST. LOUIS, MO; Owner: NEW HORIZON 7TH-DAY CHRISTIAN CHURCH, INC.)
- WRTH (1430 AM; 5 kW; ST. LOUIS, MO)
- KATZ (1600 AM; 5 kW; ST. LOUIS, MO; Owner: CITICASTERS LICENSES, L.P.)
- KSTL (690 AM; 1 kW; ST. LOUIS, MO; Owner: WMUZ RADIO, INC.)
Strongest FM radio stations in St. Peters:
- KFTK (97.1 FM; FLORISSANT, MO; Owner: EMMIS RADIO LICENSE CORPORATION)
- KCLC (89.1 FM; ST. CHARLES, MO; Owner: LINDENWOOD COLLEGE)
- KEZK-FM (102.5 FM; ST. LOUIS, MO; Owner: INFINITY RADIO SUBSIDIARY OPERATIONS INC.)
- KIHT (96.3 FM; ST. LOUIS, MO; Owner: EMMIS RADIO LICENSE CORPORATION)
- KWMU (90.7 FM; ST. LOUIS, MO; Owner: THE CURATORS OF THE UNIVERSITY OF MISSOURI)
- KSD (93.7 FM; ST. LOUIS, MO; Owner: CITICASTERS LICENSES, L.P.)
- KSLZ (107.7 FM; ST. LOUIS, MO; Owner: CITICASTERS LICENSES, L.P.)
- KFUO-FM (99.1 FM; CLAYTON, MO; Owner: THE LUTHERAN CHURCH-MISSOURI SYNOD)
- KYKY (98.1 FM; ST. LOUIS, MO; Owner: INFINITY RADIO SUBSIDIARY OPERATIONS INC.)
- WSSM (106.5 FM; GRANITE CITY, IL; Owner: BONNEVILLE HOLDING COMPANY)
- KSHE (94.7 FM; CRESTWOOD, MO; Owner: EMMIS RADIO LICENSE CORPORATION)
- KSIV-FM (91.5 FM; ST. LOUIS, MO; Owner: COMMUNITY BROADCASTING, INC.)
- WIL-FM (92.3 FM; ST. LOUIS, MO; Owner: BONNEVILLE HOLDING COMPANY)
- KLOU (103.3 FM; ST. LOUIS, MO; Owner: CITICASTERS LICENSES, L.P.)
- WMLL (104.1 FM; JERSEYVILLE, IL; Owner: EMMIS RADIO LICENSE CORPORATION)
- KPNT (105.7 FM; ST. GENEVIEVE, MO; Owner: EMMIS RADIO LICENSE CORPORATION)
- WSIE (88.7 FM; EDWARDSVILLE, IL; Owner: BOARD OF TRUSTEES, S. ILLINOIS UNIV.)
- KSLQ-FM (104.5 FM; WASHINGTON, MO; Owner: Y2K, INC.)
- KDHX (88.1 FM; ST. LOUIS, MO; Owner: DOUBLE HELIX CORPORATION)
- KNLH (89.5 FM; CEDAR HILL, MO; Owner: NEW LIFE EVANGELISTIC CENTER, INC.)
TV broadcast stations around St. Peters:
- K59GP (Channel 59; ST. CHARLES, MO; Owner: TRINITY BROADCASTING NETWORK)
- KSDK (Channel 5; ST. LOUIS, MO; Owner: MULTIMEDIA KSDK, INC.)
- KPLR-TV (Channel 11; ST. LOUIS, MO; Owner: KPLR, INC.)
- KTVI (Channel 2; ST. LOUIS, MO; Owner: KTVI LICENSE, INC.)
- KETC (Channel 9; ST. LOUIS, MO; Owner: ST. LOUIS REGIONAL & EDUCATIONAL PUBLIC TV COMMISSION)
- KDNL-TV (Channel 30; ST. LOUIS, MO; Owner: KDNL LICENSEE, LLC)
- K63FW (Channel 63; JAMESTOWN, MO; Owner: ROGER E. HARDERS)
- KMOV (Channel 4; ST. LOUIS, MO; Owner: KMOV-TV, INC.)
- KPTN-LP (Channel 58; ST. LOUIS, MO; Owner: KURT J. PETERSEN)
- K40FF (Channel 40; ST. LOUIS, MO; Owner: EBC ST. LOUIS, INC.)
- WRBU (Channel 46; EAST ST. LOUIS, IL; Owner: ROBERTS BROADCASTING COMPANY)
- KNLC (Channel 24; ST. LOUIS, MO; Owner: NEW LIFE EVANGELISTIC CENTER, INC.)
- K18BT (Channel 18; ST. LOUIS, MO; Owner: TRINITY BROADCASTING NETWORK)
- K65FN (Channel 65; BATESVILLE, AR; Owner: MS COMMUNICATIONS, LLC)
- K49FC (Channel 49; ST. LOUIS, MO; Owner: THREE ANGELS BROADCASTING NETWORK)
- K64DT (Channel 64; ST. LOUIS, MO; Owner: WORD OF GOD FELLOWSHIP, INC.)
- K62EG (Channel 62; ST. LOUIS, MO; Owner: ETERNAL FAMILY NETWORK)
- K38HD (Channel 38; ST. LOUIS, MO; Owner: VENTANA TELEVISION, INC.)
- National Bridge Inventory (NBI) Statistics
- 140Number of bridges
- 1,401ft / 427mTotal length
- $2,750,000Total costs
- 2,480,048Total average daily traffic
- 197,909Total average daily truck traffic
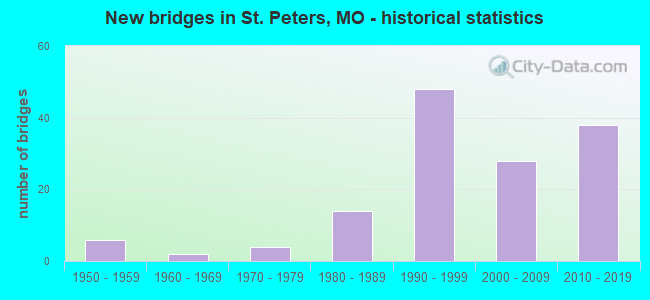
- New bridges - historical statistics
- 61950-1959
- 21960-1969
- 41970-1979
- 141980-1989
- 481990-1999
- 282000-2009
- 382010-2019
FCC Registered Antenna Towers: 116 (See the full list of FCC Registered Antenna Towers)
FCC Registered Broadcast Land Mobile Towers: 25 (See the full list of FCC Registered Broadcast Land Mobile Towers in St. Peters, MO)
FCC Registered Microwave Towers: 22 (See the full list of FCC Registered Microwave Towers in this town)
FCC Registered Paging Towers: 1 (See the full list of FCC Registered Paging Towers)
FCC Registered Amateur Radio Licenses: 19 (See the full list of FCC Registered Amateur Radio Licenses in St. Peters)
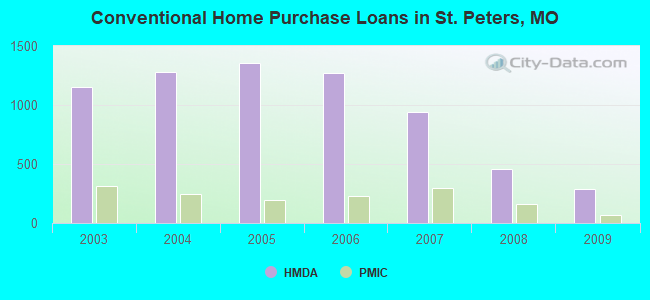
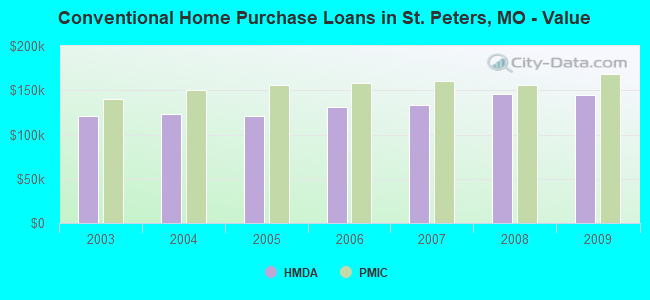
| Home Mortgage Disclosure Act Aggregated Statistics For Year 2009 (Based on 6 full and 10 partial tracts) | ||||||||||||||
| A) FHA, FSA/RHS & VA Home Purchase Loans | B) Conventional Home Purchase Loans | C) Refinancings | D) Home Improvement Loans | E) Loans on Dwellings For 5+ Families | F) Non-occupant Loans on < 5 Family Dwellings (A B C & D) | G) Loans On Manufactured Home Dwelling (A B C & D) | ||||||||
|---|---|---|---|---|---|---|---|---|---|---|---|---|---|---|
| Number | Average Value | Number | Average Value | Number | Average Value | Number | Average Value | Number | Average Value | Number | Average Value | Number | Average Value | |
| LOANS ORIGINATED | 396 | $147,678 | 288 | $144,091 | 2,104 | $148,569 | 64 | $50,623 | 2 | $6,179,500 | 70 | $108,029 | 7 | $43,789 |
| APPLICATIONS APPROVED, NOT ACCEPTED | 17 | $157,801 | 20 | $159,077 | 155 | $150,484 | 16 | $31,133 | 0 | $0 | 3 | $111,777 | 3 | $29,277 |
| APPLICATIONS DENIED | 33 | $144,533 | 33 | $155,464 | 438 | $159,324 | 48 | $30,806 | 0 | $0 | 18 | $87,046 | 2 | $35,790 |
| APPLICATIONS WITHDRAWN | 36 | $140,709 | 25 | $143,991 | 320 | $151,717 | 12 | $37,387 | 0 | $0 | 5 | $102,670 | 0 | $0 |
| FILES CLOSED FOR INCOMPLETENESS | 3 | $182,407 | 3 | $142,580 | 93 | $159,858 | 3 | $82,430 | 0 | $0 | 2 | $145,235 | 0 | $0 |
Detailed mortgage data for all 16 tracts in St. Peters, MO
| Private Mortgage Insurance Companies Aggregated Statistics For Year 2009 (Based on 6 full and 10 partial tracts) | ||||||
| A) Conventional Home Purchase Loans | B) Refinancings | C) Non-occupant Loans on < 5 Family Dwellings (A & B) | ||||
|---|---|---|---|---|---|---|
| Number | Average Value | Number | Average Value | Number | Average Value | |
| LOANS ORIGINATED | 69 | $168,650 | 93 | $166,855 | 0 | $0 |
| APPLICATIONS APPROVED, NOT ACCEPTED | 15 | $181,820 | 33 | $164,766 | 1 | $367,920 |
| APPLICATIONS DENIED | 5 | $162,532 | 17 | $184,623 | 0 | $0 |
| APPLICATIONS WITHDRAWN | 4 | $199,898 | 6 | $162,958 | 0 | $0 |
| FILES CLOSED FOR INCOMPLETENESS | 2 | $170,010 | 1 | $210,870 | 0 | $0 |
2002 - 2011 National Fire Incident Reporting System (NFIRS) incidents
- Fire incident types reported to NFIRS in St. Peters, MO
- 56340.6%Structure Fires
- 49335.6%Outside Fires
- 23817.2%Mobile Property/Vehicle Fires
- 926.6%Other
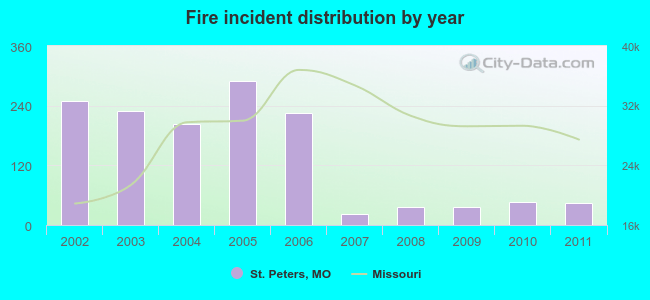 According to the data from the years 2002 - 2011 the average number of fire incidents per year is 139. The highest number of fires - 290 took place in 2005, and the least - 22 in 2007. The data has a dropping trend.
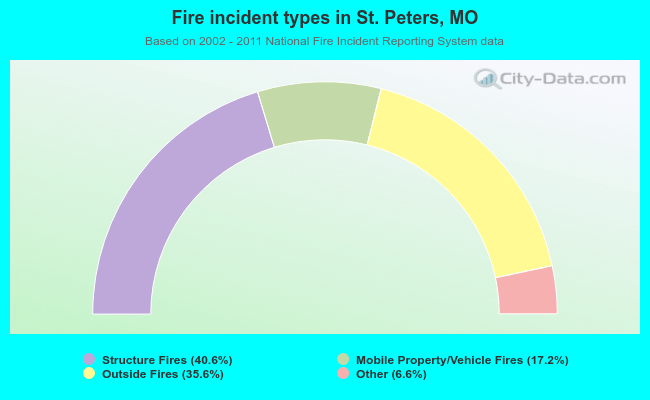 When looking into fire subcategories, the most incidents belonged to: Structure Fires (40.6%), and Outside Fires (35.6%).
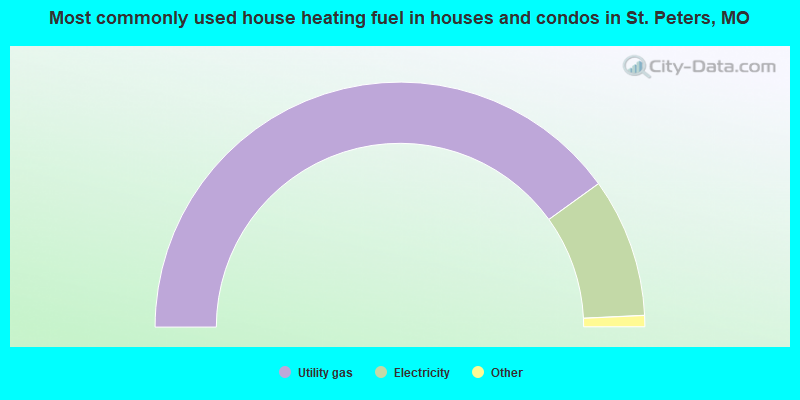
- 80.1%Utility gas
- 18.4%Electricity
- 1.2%Bottled, tank, or LP gas
- 0.1%No fuel used
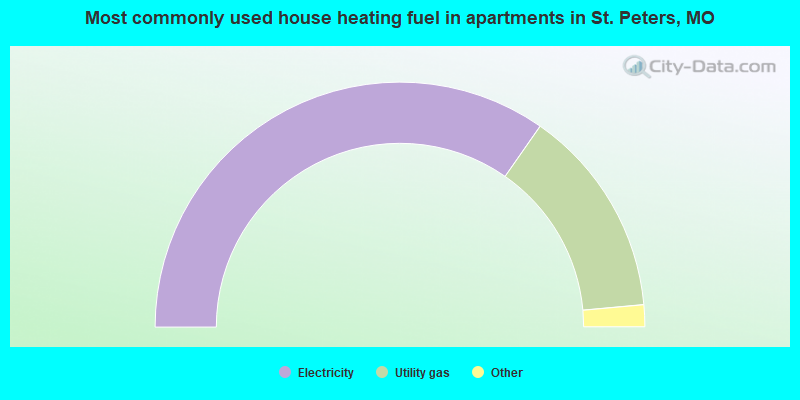
- 69.4%Electricity
- 27.7%Utility gas
- 2.2%Bottled, tank, or LP gas
- 0.7%No fuel used
St. Peters compared to Missouri state average:
- Unemployed percentage significantly below state average.
- Black race population percentage below state average.
- Median age above state average.
- Renting percentage below state average.
- Length of stay since moving in significantly above state average.
- House age below state average.
- Percentage of population with a bachelor's degree or higher above state average.
St. Peters on our top lists:
- #14 on the list of "Top 101 cities with the least people below the poverty level (population 50,000+)"
- #14 on the list of "Top 101 cities with the smallest household incomes disparities (population 50,000+)"
- #15 on the list of "Top 101 cities with the least people below 50% of the poverty level (population 50,000+)"
- #24 on the list of "Top 101 cities with the lowest number of burglaries per 100,000 residents (population 50,000+)"
- #31 on the list of "Top 101 cities with the lowest number of auto thefts per 100,000 residents (population 50,000+)"
- #31 on the list of "Top 100 least racially diverse cities (pop. 50,000+)"
- #38 on the list of "Top 101 cities with the smallest house values disparities (population 50,000+)"
- #43 on the list of "Top 101 cities with the highest percentage of English-only speaking households, population 50,000+"
- #60 on the list of "Top 101 cities with the smallest percentage of likely homosexual households (counted as self-reported same-sex unmarried-partner households) (population 50,000+)"
- #63 on the list of "Top 101 cities with the most users submitting photos to our site per 10,000 residents (population 50,000+)"
- #64 on the list of "Top 101 cities with the least people having Doctorate degrees (population 50,000+)"
- #66 on the list of "Top 101 cities with the largest percentage of elementary and middle school students in private schools (5,000+ students)"
- #69 on the list of "Top 101 cities with the highest ratio of rapes to murders between 2002 and 2012 (population 50,000+)"
- #77 on the list of "Top 101 cities with the largest wind speed differences during a year (population 50,000+)"
- #80 on the list of "Top 101 cities with the least people having professional degrees (population 50,000+)"
- #82 on the list of "Top 101 cities with the lowest number of robberies per 100,000 residents (population 50,000+)"
- #89 on the list of "Top 101 cities with most building permits per 10,000 residents (population 50,000+)"
- #90 on the list of "Top 100 cities with lowest ratio of median house value to median household income (pop. 50,000+)"
- #91 on the list of "Top 101 cities with the smallest differences between morning and afternoon humidity (population 50,000+)"
- #91 on the list of "Top 101 cities with the smallest humidity differences during a year (population 50,000+)"
- #20 on the list of "Top 101 counties with the largest decrease in the number of infant deaths per 1000 residents 2000-2006 to 2007-2013 (pop. 50,000+)"
- #33 on the list of "Top 101 counties with the lowest number of infant deaths per 1000 residents 2007-2013 (pop. 50,000+)"
- #87 on the list of "Top 101 counties with the lowest percentage of residents relocating from foreign countries between 2010 and 2011"

|
|
Total of 668 patent applications in 2008-2024.