Sturgis, Kentucky


Submit your own pictures of this city and show them to the world
- OSM Map
- General Map
- Google Map
- MSN Map
Population change since 2000: -16.9%
 |
| Males: 762 | |
| Females: 924 |
| Median resident age: | 47.8 years |
| Kentucky median age: | 39.4 years |
Zip codes: 42459.
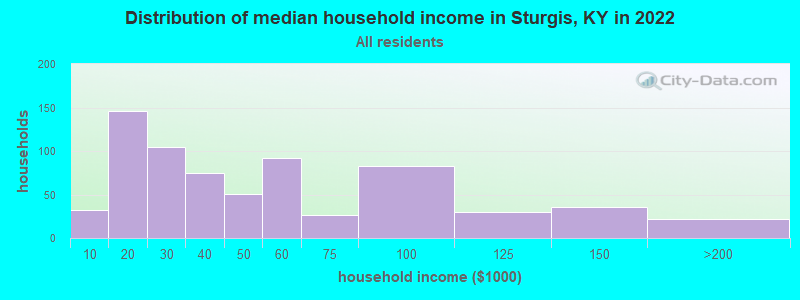
| Sturgis: | $38,600 |
| KY: | $59,341 |
Estimated per capita income in 2022: $23,548 (it was $14,124 in 2000)
Sturgis city income, earnings, and wages data
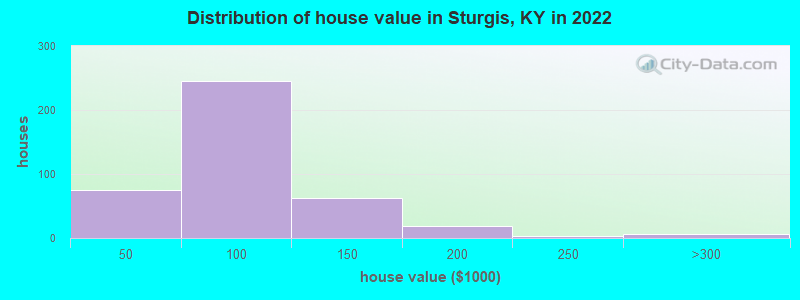
Estimated median house or condo value in 2022: $91,385 (it was $41,400 in 2000)
| Sturgis: | $91,385 |
| KY: | $196,300 |
Mean prices in 2022: all housing units: $109,707; detached houses: $111,260; mobile homes: $52,821
Median gross rent in 2022: $631.
(17.9% for White Non-Hispanic residents, 1.6% for Black residents, 11.8% for two or more races residents)
Detailed information about poverty and poor residents in Sturgis, KY
Compare current foreclosures near Sturgis, KY:
| Photo | Address | Area | Beds / Baths | Price | Details |
|---|---|---|---|---|---|

|
#1
State Route 1177
Sturgis, KY 42459
|
1,376 sq. feet
|
1 baths 3 beds |
show details | |

|
#2
N Jackson St
Sturgis, KY 42459
|
1,156 sq. feet
|
1 baths 3 beds |
show details | |

|
#3
State Route 270 W
Sturgis, KY 42459
|
1,682 sq. feet
|
1 baths 3 beds |
show details | |

|
#4
N Washington St
Sturgis, KY 42459
|
1,536 sq. feet
|
2 baths 4 beds |
show details | |

|
#5
N Kelsey St
Sturgis, KY 42459
|
1,140 sq. feet
|
1 baths 2 beds |
show details | |

|
#6
N Johnson St
Sturgis, KY 42459
|
1,788 sq. feet
|
1 baths 2 beds |
show details | |

|
#7
State Route 270 W
Sturgis, KY 42459
|
954 sq. feet
|
1 baths 3 beds |
show details | |

|
#8
N Kelsey St Apt G1
Sturgis, KY 42459
|
- sq. feet
|
- baths - beds |
show details | |

|
#9
State Route 1508
Sturgis, KY 42459
|
1,456 sq. feet
|
- baths - beds |
show details | |

|
#10
E Webster St
Morganfield, KY 42437
|
2,315 sq. feet
|
2 baths 4 beds |
$69,899
|
show details |
| Photo | Address | Area | Beds / Baths | Price | Details |
|---|---|---|---|---|---|

|
#11
Old Henderson R
Providence, KY 42450
|
2,039 sq. feet
|
2 baths 3 beds |
show details | |

|
#12
Lisman Mount Myria Rd
Dixon, KY 42409
|
1,200 sq. feet
|
2 baths 4 beds |
show details | |

|
#13
Waverly Hitesville Rd
Waverly, KY 42462
|
2,881 sq. feet
|
3 baths 3 beds |
show details | |

|
#14
State Route 130 N
Uniontown, KY 42461
|
1,400 sq. feet
|
1 baths 3 beds |
show details | |

|
#15
Todd Aly
Marion, KY 42064
|
1,460 sq. feet
|
1 baths 2 beds |
show details | |

|
#16
Keeling St
Marion, KY 42064
|
1,413 sq. feet
|
1 baths 3 beds |
show details | |

|
#17
Sycamore St
Providence, KY 42450
|
1,020 sq. feet
|
1 baths 3 beds |
show details | |

|
#18
Cedar St
Providence, KY 42450
|
1,580 sq. feet
|
1 baths 3 beds |
show details | |

|
#19
Chipps Dr
Marion, KY 42064
|
924 sq. feet
|
1 baths 3 beds |
show details | |

|
#20
Church St
Providence, KY 42450
|
932 sq. feet
|
1 baths 2 beds |
show details |
| Photo | Address | Area | Beds / Baths | Price | Details |
|---|---|---|---|---|---|

|
#21
Adamson Ln
Marion, KY 42064
|
938 sq. feet
|
1 baths 1 beds |
show details | |

|
#22
State Route 141 S
Waverly, KY 42462
|
4,368 sq. feet
|
3 baths 3 beds |
show details | |

|
#23
Governor St
Morganfield, KY 42437
|
855 sq. feet
|
1 baths 2 beds |
show details | |

|
#24
N Townsend St
Morganfield, KY 42437
|
1,200 sq. feet
|
1 baths 3 beds |
show details | |

|
#25
Burris Rd
Clay, KY 42404
|
1,698 sq. feet
|
2 baths 3 beds |
show details | |

|
#26
S Broadway St
Providence, KY 42450
|
1,981 sq. feet
|
2 baths - beds |
show details | |

|
#27
S Morgan St
Morganfield, KY 42437
|
- sq. feet
|
- baths - beds |
show details | |

|
#28
Union St
Providence, KY 42450
|
- sq. feet
|
- baths - beds |
show details | |

|
#29
Union St
Providence, KY 42450
|
- sq. feet
|
- baths - beds |
show details | |

|
#30
State Route 360
Uniontown, KY 42461
|
- sq. feet
|
- baths - beds |
show details |
| Photo | Address | Area | Beds / Baths | Price | Details |
|---|---|---|---|---|---|

|
#31
State Route 141 S
Morganfield, KY 42437
|
1,111 sq. feet
|
- baths - beds |
show details | |

|
#32
E Main St
Providence, KY 42450
|
- sq. feet
|
- baths - beds |
show details | |

|
#33
60 Hwy
Morganfield, KY 42437
|
- sq. feet
|
- baths - beds |
show details | |

|
#34
Lisman Mount Myria Rd
Dixon, KY 42409
|
- sq. feet
|
- baths - beds |
show details | |

|
#35
Westerfield Dr
Providence, KY 42450
|
- sq. feet
|
- baths - beds |
show details | |

|
#36
State Route 492
Morganfield, KY 42437
|
- sq. feet
|
- baths - beds |
show details | |

|
#37
Chipps Dr # C
Marion, KY 42064
|
- sq. feet
|
- baths - beds |
show details | |

|
#38
State Route 141 S
Clay, KY 42404
|
- sq. feet
|
- baths - beds |
show details | |

|
#39
Saint Bernard Ave
Providence, KY 42450
|
1,040 sq. feet
|
- baths - beds |
show details | |

|
#40
E Fords Ferry Rd
Cave In Rock, IL 62919
|
- sq. feet
|
- baths - beds |
show details |
| Photo | Address | Area | Beds / Baths | Price | Details |
|---|---|---|---|---|---|

|
#41
State Route 666
Morganfield, KY 42437
|
- sq. feet
|
- baths - beds |
show details | |

|
#42
Main St
Uniontown, KY 42461
|
- sq. feet
|
- baths - beds |
show details | |

|
#43
State Route 132 W
Clay, KY 42404
|
- sq. feet
|
- baths - beds |
show details | |

|
#44
New Hopewell Church Rd
Clay, KY 42404
|
- sq. feet
|
- baths - beds |
show details | |

|
#45
Moon Ln
Morganfield, KY 42437
|
- sq. feet
|
- baths - beds |
show details | |

|
#46
Main Gate Rd
Morganfield, KY 42437
|
- sq. feet
|
- baths - beds |
show details | |

|
#47
Minerva Limp Rd
Morganfield, KY 42437
|
1,920 sq. feet
|
- baths - beds |
show details | |

|
#48
Camp Mine Rd
Clay, KY 42404
|
1,344 sq. feet
|
- baths - beds |
show details | |

|
#49
Providence Rd
Providence, KY 42450
|
1,176 sq. feet
|
- baths - beds |
show details | |

|
Check over 1 million property listings on Foreclosure.com!
|
browse all offers | |||


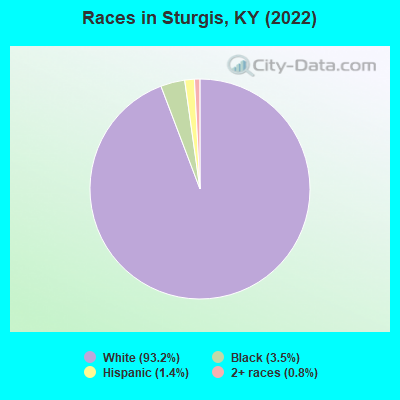
- 1,58093.2%White alone
- 593.5%Black alone
- 241.4%Hispanic
- 140.8%Two or more races
Races in Sturgis detailed stats: ancestries, foreign born residents, place of birth
According to our research of Kentucky and other state lists, there were 6 registered sex offenders living in Sturgis, Kentucky as of April 25, 2024.
The ratio of all residents to sex offenders in Sturgis is 319 to 1.
Type |
2009 |
2010 |
2011 |
2012 |
2013 |
2014 |
2015 |
2016 |
2017 |
2018 |
2019 |
2020 |
2021 |
2022 |
|---|---|---|---|---|---|---|---|---|---|---|---|---|---|---|
| Murders (per 100,000) | 0 (0.0) | 0 (0.0) | 0 (0.0) | 0 (0.0) | 0 (0.0) | 0 (0.0) | 0 (0.0) | 0 (0.0) | 0 (0.0) | 0 (0.0) | 0 (0.0) | 0 (0.0) | 0 (0.0) | 0 (0.0) |
| Rapes (per 100,000) | 1 (52.3) | 0 (0.0) | 0 (0.0) | 0 (0.0) | 0 (0.0) | 0 (0.0) | 0 (0.0) | 0 (0.0) | 1 (53.0) | 0 (0.0) | 0 (0.0) | 0 (0.0) | 0 (0.0) | 0 (0.0) |
| Robberies (per 100,000) | 0 (0.0) | 0 (0.0) | 0 (0.0) | 0 (0.0) | 1 (53.0) | 2 (105.3) | 0 (0.0) | 0 (0.0) | 0 (0.0) | 0 (0.0) | 1 (55.7) | 0 (0.0) | 0 (0.0) | 0 (0.0) |
| Assaults (per 100,000) | 0 (0.0) | 1 (52.7) | 0 (0.0) | 0 (0.0) | 0 (0.0) | 1 (52.6) | 1 (51.9) | 1 (52.2) | 0 (0.0) | 0 (0.0) | 0 (0.0) | 0 (0.0) | 0 (0.0) | 0 (0.0) |
| Burglaries (per 100,000) | 10 (523.0) | 0 (0.0) | 2 (104.7) | 4 (209.3) | 1 (53.0) | 2 (105.3) | 2 (103.8) | 6 (313.5) | 12 (635.6) | 0 (0.0) | 2 (111.5) | 3 (169.6) | 0 (0.0) | 0 (0.0) |
| Thefts (per 100,000) | 10 (523.0) | 7 (368.8) | 3 (157.0) | 2 (104.7) | 6 (317.8) | 8 (421.1) | 11 (570.8) | 10 (522.5) | 21 (1,112) | 0 (0.0) | 7 (390.2) | 6 (339.2) | 6 (336.7) | 2 (126.7) |
| Auto thefts (per 100,000) | 1 (52.3) | 0 (0.0) | 0 (0.0) | 0 (0.0) | 0 (0.0) | 1 (52.6) | 0 (0.0) | 0 (0.0) | 2 (105.9) | 0 (0.0) | 1 (55.7) | 1 (56.5) | 0 (0.0) | 0 (0.0) |
| Arson (per 100,000) | 0 (0.0) | 1 (52.7) | 0 (0.0) | 0 (0.0) | 0 (0.0) | 0 (0.0) | 0 (0.0) | 0 (0.0) | 0 (0.0) | 0 (0.0) | 0 (0.0) | 0 (0.0) | 0 (0.0) | 0 (0.0) |
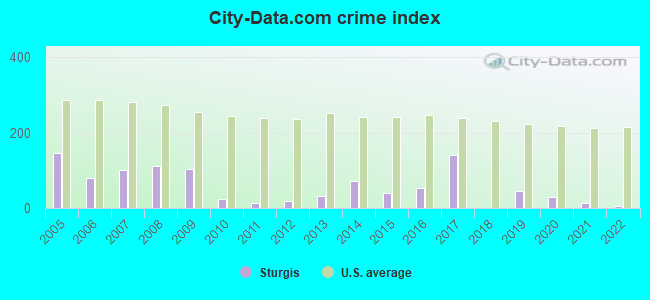
| City-Data.com crime index | 103.6 | 25.3 | 13.6 | 18.8 | 32.3 | 70.5 | 40.5 | 53.3 | 139.8 | 0.0 | 44.6 | 30.0 | 13.5 | 5.1 |
The City-Data.com crime index weighs serious crimes and violent crimes more heavily. Higher means more crime, U.S. average is 246.1. It adjusts for the number of visitors and daily workers commuting into cities.
Crime rate in Sturgis detailed stats: murders, rapes, robberies, assaults, burglaries, thefts, arson
Full-time law enforcement employees in 2013, including police officers: 4 (4 officers - 4 male; 0 female).
| Officers per 1,000 residents here: | 2.12 |
| Kentucky average: | 1.94 |
 Recent articles from our blog. Our writers, many of them Ph.D. graduates or candidates, create easy-to-read articles on a wide variety of topics.

 | Shame on You Kentucky!!! (36 replies) |
| Amish Communities (3 replies) |
| Cincinnati attitudes towards NKY (12 replies) |
| Why are people from northern kentucky considered yankees to the rest of the state (175 replies) |
| Eastern Kentucky (260 replies) |
| Is Owensboro the Barbeque Capital?? (43 replies) |
Latest news from Sturgis, KY collected exclusively by city-data.com from local newspapers, TV, and radio stations
Ancestries: European (22.1%), American (19.4%), English (14.1%), Irish (12.0%), German (8.4%).
Current Local Time: CST time zone
Incorporated on 05/03/1890
Land area: 1.51 square miles.
Population density: 1,116 people per square mile (low).
2 residents are foreign born
| This city: | 0.1% |
| Kentucky: | 4.1% |
Median real estate property taxes paid for housing units with mortgages in 2022: $785 (0.8%)
Median real estate property taxes paid for housing units with no mortgage in 2022: $567 (0.6%)
Nearest city with pop. 50,000+: Evansville, IN  (38.0 miles , pop. 121,582).
Nearest city with pop. 200,000+: Metropolitan Government, TN (117.5 miles , pop. 569,891).
Nearest city with pop. 1,000,000+: Chicago, IL (297.3 miles , pop. 2,896,016).
Nearest cities:
), ), ), )Latitude: 37.55 N, Longitude: 87.98 W
Area code: 270
| Here: | 4.3% |
| Kentucky: | 3.8% |
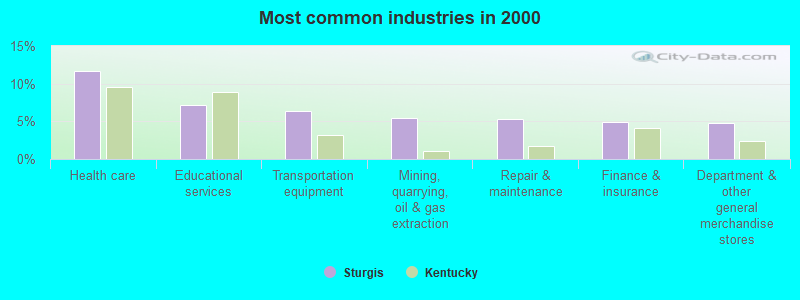
- Health care (11.7%)
- Educational services (7.2%)
- Transportation equipment (6.4%)
- Mining, quarrying, oil & gas extraction (5.5%)
- Repair & maintenance (5.3%)
- Finance & insurance (4.9%)
- Department & other general merchandise stores (4.8%)
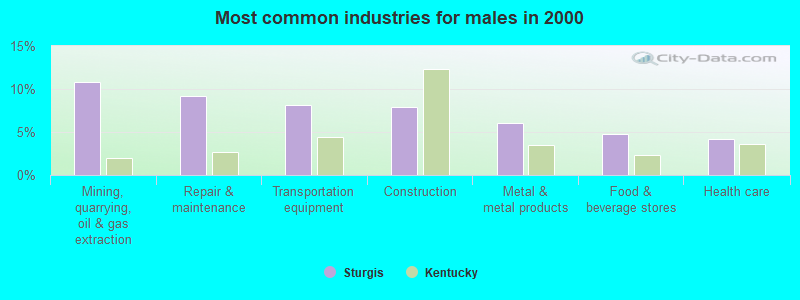
- Mining, quarrying, oil & gas extraction (10.8%)
- Repair & maintenance (9.2%)
- Transportation equipment (8.2%)
- Construction (7.9%)
- Metal & metal products (6.1%)
- Food & beverage stores (4.7%)
- Health care (4.2%)
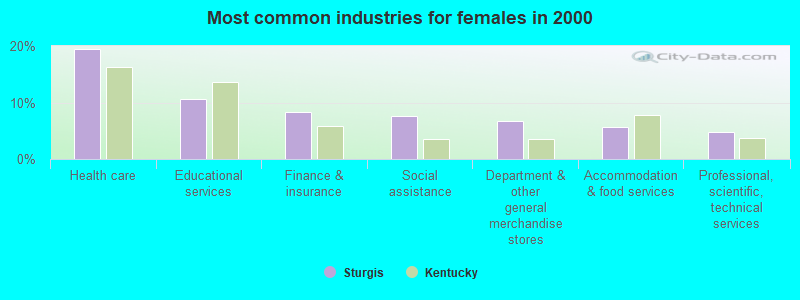
- Health care (19.5%)
- Educational services (10.5%)
- Finance & insurance (8.4%)
- Social assistance (7.6%)
- Department & other general merchandise stores (6.8%)
- Accommodation & food services (5.7%)
- Professional, scientific, technical services (4.9%)
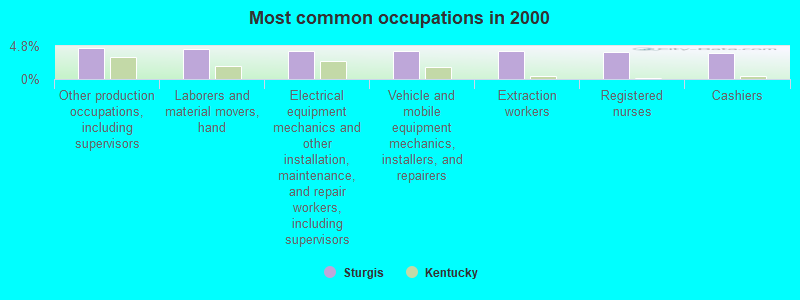
- Other production occupations, including supervisors (4.5%)
- Laborers and material movers, hand (4.4%)
- Electrical equipment mechanics and other installation, maintenance, and repair workers, including supervisors (4.1%)
- Vehicle and mobile equipment mechanics, installers, and repairers (4.1%)
- Extraction workers (4.1%)
- Registered nurses (4.0%)
- Cashiers (3.7%)

- Electrical equipment mechanics and other installation, maintenance, and repair workers, including supervisors (8.2%)
- Vehicle and mobile equipment mechanics, installers, and repairers (8.2%)
- Extraction workers (8.2%)
- Metal workers and plastic workers (7.1%)
- Other production occupations, including supervisors (6.6%)
- Laborers and material movers, hand (5.8%)
- Driver/sales workers and truck drivers (5.3%)

- Registered nurses (8.1%)
- Secretaries and administrative assistants (7.3%)
- Information and record clerks, except customer service representatives (7.0%)
- Cashiers (6.2%)
- Health technologists and technicians (4.9%)
- Child care workers (4.3%)
- Other office and administrative support workers, including supervisors (4.3%)
Average climate in Sturgis, Kentucky
Based on data reported by over 4,000 weather stations


|
|

Tornado activity:
Sturgis-area historical tornado activity is slightly above Kentucky state average. It is 60% greater than the overall U.S. average.
On 5/6/2003, a category F4 (max. wind speeds 207-260 mph) tornado 29.6 miles away from the Sturgis city center killed 2 people and injured 33 people and caused $16 million in damages.
On 11/15/2005, a category F4 tornado 32.4 miles away from the city center injured 40 people and caused $31 million in damages.
Earthquake activity:
Sturgis-area historical earthquake activity is significantly above Kentucky state average. It is 249% greater than the overall U.S. average.On 4/18/2008 at 09:36:59, a magnitude 5.4 (5.1 MB, 4.8 MS, 5.4 MW, 5.2 MW, Class: Moderate, Intensity: VI - VII) earthquake occurred 62.7 miles away from Sturgis center
On 4/18/2008 at 09:36:59, a magnitude 5.2 (5.2 MW, Depth: 8.9 mi) earthquake occurred 62.7 miles away from Sturgis center
On 6/18/2002 at 17:37:15, a magnitude 5.0 (4.3 MB, 4.6 MW, 5.0 LG) earthquake occurred 32.3 miles away from the city center
On 6/10/1987 at 23:48:54, a magnitude 5.1 (4.9 MB, 4.4 MS, 4.6 MS, 5.1 LG) earthquake occurred 88.2 miles away from the city center
On 9/26/1990 at 13:18:51, a magnitude 5.0 (4.7 MB, 4.8 LG, 5.0 LG, Depth: 7.7 mi) earthquake occurred 89.2 miles away from the city center
On 4/18/2008 at 15:14:16, a magnitude 4.8 (4.5 MB, 4.8 MW, 4.6 MW, Class: Light, Intensity: IV - V) earthquake occurred 64.6 miles away from the city center
Magnitude types: regional Lg-wave magnitude (LG), body-wave magnitude (MB), surface-wave magnitude (MS), moment magnitude (MW)
Natural disasters:
The number of natural disasters in Union County (17) is near the US average (15).Major Disasters (Presidential) Declared: 12
Emergencies Declared: 2
Causes of natural disasters: Floods: 11, Storms: 10, Mudslides: 6, Tornadoes: 6, Landslides: 4, Winter Storms: 4, Winds: 2, Blizzard: 1, Hurricane: 1, Snow: 1, Snowstorm: 1, Tropical Depression: 1, Other: 1 (Note: some incidents may be assigned to more than one category).
Airports located in Sturgis:
- Sturgis Municipal Airport (TWT) (Runways: 1, Air Taxi Ops: 800, Itinerant Ops: 4,500, Local Ops: 3,300, Military Ops: 300)
Colleges/universities with over 2000 students nearest to Sturgis:
- Madisonville Community College (about 29 miles; Madisonville, KY; Full-time enrollment: 2,082)
- University of Southern Indiana (about 34 miles; Evansville, IN; FT enrollment: 9,532)
- University of Evansville (about 39 miles; Evansville, IN; FT enrollment: 2,688)
- West Kentucky Community and Technical College (about 51 miles; Paducah, KY; FT enrollment: 4,107)
- Owensboro Community and Technical College (about 51 miles; Owensboro, KY; FT enrollment: 2,754)
- Hopkinsville Community College (about 54 miles; Hopkinsville, KY; FT enrollment: 2,269)
- Wabash Valley College (about 62 miles; Mount Carmel, IL; FT enrollment: 2,142)
Public elementary/middle school in Sturgis:
- STURGIS ELEMENTARY SCHOOL (Students: 405, Location: 1101 GRANT ST, Grades: PK-5)
Points of interest:
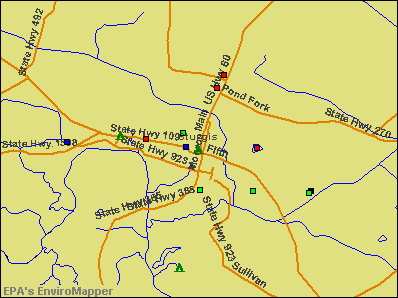
Notable location: Sturgis Fire Department (A). Display/hide its location on the map
Drinking water stations with addresses in Sturgis and their reported violations in the past:
STURGIS WATER WORKS (Population served: 3,677, Surface water):Past health violations:Past monitoring violations:
- MCL, Average - Between JUL-2011 and SEP-2011, Contaminant: TTHM. Follow-up actions: St Public Notif requested (NOV-03-2011), St Formal NOV issued (NOV-03-2011), St Public Notif received (DEC-14-2011), St Compliance achieved (FEB-23-2012)
- MCL, Average - Between APR-2011 and JUN-2011, Contaminant: TTHM. Follow-up actions: St Public Notif requested (AUG-09-2011), St Formal NOV issued (AUG-09-2011), St Public Notif received (SEP-04-2011), St Compliance achieved (FEB-23-2012)
- MCL, Average - Between JAN-2011 and MAR-2011, Contaminant: Total Haloacetic Acids (HAA5). Follow-up actions: St Public Notif requested (MAY-05-2011), St Formal NOV issued (MAY-05-2011), St Public Notif received (JUL-01-2011), St Compliance achieved (FEB-23-2012)
- MCL, Average - Between JAN-2011 and MAR-2011, Contaminant: TTHM. Follow-up actions: St Public Notif requested (MAY-05-2011), St Formal NOV issued (MAY-05-2011), St Public Notif received (DEC-05-2011), St Compliance achieved (FEB-23-2012)
- MCL, Average - Between OCT-2010 and DEC-2010, Contaminant: TTHM. Follow-up actions: St Public Notif requested (FEB-03-2011), St Formal NOV issued (FEB-03-2011), St Public Notif received (MAR-05-2011), St Compliance achieved (FEB-23-2012)
- MCL, Average - Between JUL-2010 and SEP-2010, Contaminant: TTHM. Follow-up actions: St Public Notif requested (NOV-01-2010), St Formal NOV issued (NOV-01-2010), St Public Notif received (DEC-03-2010), St Compliance achieved (FEB-23-2012)
- 27 other older health violations
- Monitoring and Reporting (DBP) - Between APR-2012 and JUN-2012, Contaminant: TTHM. Follow-up actions: St Public Notif requested (JUL-31-2012), St Formal NOV issued (JUL-31-2012), St Public Notif received (SEP-04-2012), St Compliance achieved (NOV-27-2012)
- Monitoring and Reporting (DBP) - Between APR-2012 and JUN-2012, Contaminant: Total Haloacetic Acids (HAA5). Follow-up actions: St Public Notif requested (JUL-31-2012), St Formal NOV issued (JUL-31-2012), St Public Notif received (SEP-04-2012), St Compliance achieved (NOV-27-2012)
- Monitoring, Turbidity (Enhanced SWTR) - In AUG-2009, Contaminant: IESWTR. Follow-up actions: St Public Notif requested (OCT-10-2009), St Formal NOV issued (OCT-10-2009), St Compliance achieved (OCT-29-2009), St Public Notif received (JUN-22-2010)
- Follow-up Or Routine LCR Tap M/R - In OCT-01-2005, Contaminant: Lead and Copper Rule. Follow-up actions: St Formal NOV issued (MAY-09-2006), St Public Notif requested (MAY-09-2006), St Compliance achieved (JUN-19-2006), St Violation/Reminder Notice (JUL-25-2007), St Public Notif received (SEP-20-2007)
- Monthly Turbidity Exceed (Enhanced SWTR) - In JUL-2005, Contaminant: IESWTR. Follow-up actions: St Public Notif requested (SEP-12-2005), St Formal NOV issued (SEP-12-2005), St Compliance achieved (JAN-20-2006), St Public Notif received (JAN-20-2006)
- One minor monitoring violation
- 4 other older monitoring violations
| This city: | 2.3 people |
| Kentucky: | 2.5 people |
| This city: | 63.3% |
| Whole state: | 66.9% |
| This city: | 4.5% |
| Whole state: | 6.4% |
Likely homosexual households (counted as self-reported same-sex unmarried-partner households)
- Lesbian couples: 0.4% of all households
- Gay men: 0.2% of all households
30 people in nursing homes in 2000
Banks with branches in Sturgis (2011 data):
- Old National Bank: Sturgis Branch at 520 Adams St, branch established on 1916/01/01; Sturgis Branch at 14th And Main Streets, branch established on 1968/05/06. Info updated 2011/08/01: Bank assets: $8,467.9 mil, Deposits: $6,653.1 mil, headquarters in Evansville, IN, positive income, 195 total offices, Holding Company: Old National Bancorp
- United Community Bank of West Kentucky, Inc.: Sturgis Branch at 1406 Main Street, branch established on 2002/01/08. Info updated 2006/11/03: Bank assets: $185.2 mil, Deposits: $152.8 mil, headquarters in Morganfield, KY, positive income, 3 total offices, Holding Company: United Community Bancshares, Inc.
For population 15 years and over in Sturgis:
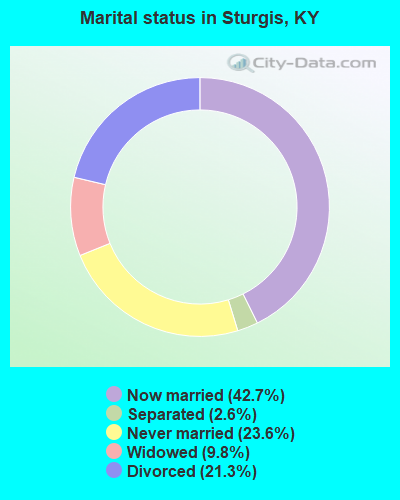
- Never married: 23.6%
- Now married: 42.7%
- Separated: 2.6%
- Widowed: 9.8%
- Divorced: 21.3%
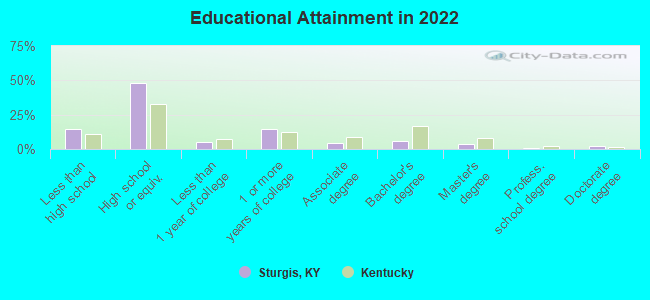
For population 25 years and over in Sturgis:
- High school or higher: 85.0%
- Bachelor's degree or higher: 12.0%
- Graduate or professional degree: 6.5%
- Unemployed: 8.1%
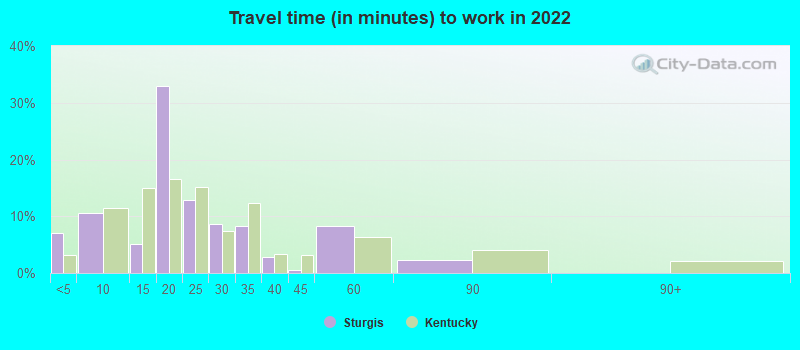
- Mean travel time to work (commute): 17.8 minutes

| Here: | 11.8 |
| Kentucky average: | 11.7 |
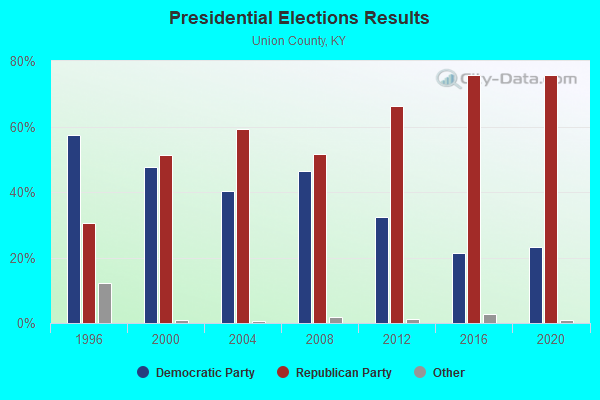
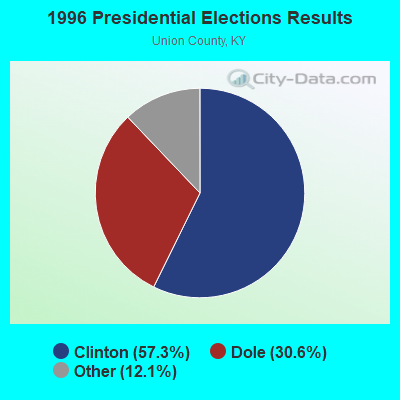
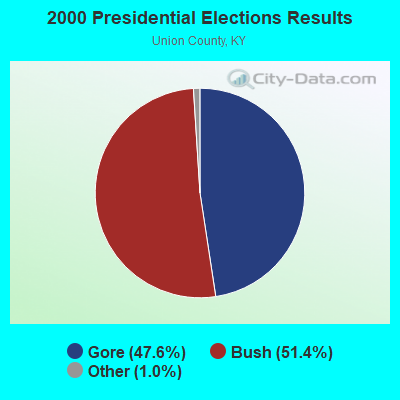


Graphs represent county-level data. Detailed 2008 Election Results
Religion statistics for Sturgis, KY (based on Union County data)
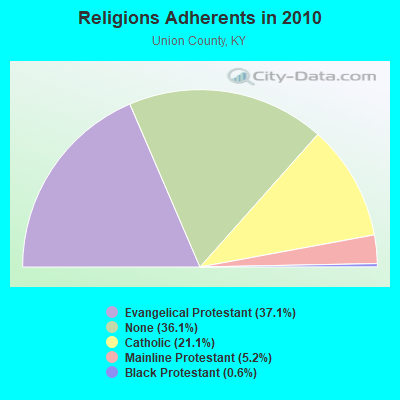
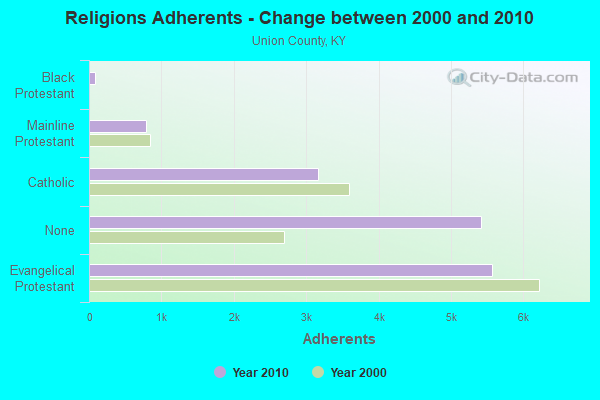
| Religion | Adherents | Congregations |
|---|---|---|
| Evangelical Protestant | 5,561 | 26 |
| Catholic | 3,159 | 6 |
| Mainline Protestant | 785 | 9 |
| Black Protestant | 83 | 3 |
| Other | 1 | - |
| None | 5,418 | - |
Food Environment Statistics:
| Union County: | 3.30 / 10,000 pop. |
| Kentucky: | 2.19 / 10,000 pop. |
| This county: | 0.66 / 10,000 pop. |
| Kentucky: | 0.25 / 10,000 pop. |
| Union County: | 0.66 / 10,000 pop. |
| Kentucky: | 0.74 / 10,000 pop. |
| Here: | 4.62 / 10,000 pop. |
| State: | 4.36 / 10,000 pop. |
| Union County: | 5.94 / 10,000 pop. |
| Kentucky: | 5.74 / 10,000 pop. |
| Here: | 11.6% |
| Kentucky: | 11.0% |
| This county: | 32.2% |
| State: | 30.0% |
| Union County: | 13.9% |
| State: | 15.9% |
Health and Nutrition:
| Here: | 46.0% |
| Kentucky: | 49.9% |
| Here: | 43.1% |
| Kentucky: | 47.0% |
| This city: | 30.5 |
| Kentucky: | 28.6 |
| Sturgis: | 15.4% |
| State: | 21.0% |
| Here: | 12.6% |
| State: | 10.1% |
| This city: | 6.5 |
| State: | 6.8 |
| This city: | 36.6% |
| State: | 33.8% |
| Sturgis: | 52.1% |
| Kentucky: | 56.8% |
| Sturgis: | 83.2% |
| Kentucky: | 78.9% |
More about Health and Nutrition of Sturgis, KY Residents
| Local government employment and payroll (March 2022) | |||||
| Function | Full-time employees | Monthly full-time payroll | Average yearly full-time wage | Part-time employees | Monthly part-time payroll |
|---|---|---|---|---|---|
| Streets and Highways | 9 | $24,769 | $33,025 | 0 | $0 |
| Firefighters | 3 | $9,010 | $36,040 | 3 | $1,256 |
| Police Protection - Officers | 3 | $13,138 | $52,552 | 0 | $0 |
| Sewerage | 2 | $5,688 | $34,128 | 0 | $0 |
| Gas Supply | 2 | $6,852 | $41,112 | 0 | $0 |
| Other Government Administration | 0 | $0 | 9 | $7,298 | |
| Water Supply | 0 | $0 | 3 | $1,878 | |
| Totals for Government | 19 | $59,456 | $37,551 | 15 | $10,432 |
Sturgis government finances - Expenditure in 2017 (per resident):
- Current Operations - Central Staff Services: $493,000 ($292.41)
Water Utilities: $386,000 ($228.94)
Sewerage: $368,000 ($218.27)
Solid Waste Management: $189,000 ($112.10)
Local Fire Protection: $177,000 ($104.98)
Police Protection: $126,000 ($74.73)
Regular Highways: $90,000 ($53.38)
Gas Utilities: $83,000 ($49.23)
Parks and Recreation: $34,000 ($20.17)
- Gas Utilities - Interest on Debt: $17,000 ($10.08)
- General - Interest on Debt: $22,000 ($13.05)
- Intergovernmental to Local - Other - General - Other: $136,000 ($80.66)
- Total Salaries and Wages: $462,000 ($274.02)
- Water Utilities - Interest on Debt: $28,000 ($16.61)
Sturgis government finances - Revenue in 2017 (per resident):
- Charges - Sewerage: $201,000 ($119.22)
Solid Waste Management: $200,000 ($118.62)
- Local Intergovernmental - Other: $19,000 ($11.27)
General Local Government Support: $12,000 ($7.12)
Public Welfare: $9,000 ($5.34)
- Miscellaneous - Rents: $3,000 ($1.78)
Interest Earnings: $2,000 ($1.19)
- Revenue - Water Utilities: $504,000 ($298.93)
Gas Utilities: $481,000 ($285.29)
- State Intergovernmental - Other: $133,000 ($78.88)
- Tax - Insurance Premiums Sales: $309,000 ($183.27)
Property: $253,000 ($150.06)
Public Utilities Sales: $73,000 ($43.30)
Alcoholic Beverage License: $20,000 ($11.86)
Corporation Net Income: $5,000 ($2.97)
Sturgis government finances - Debt in 2017 (per resident):
- Long Term Debt - Beginning Outstanding - Unspecified Public Purpose: $1,644,000 ($975.09)
Outstanding Unspecified Public Purpose: $1,506,000 ($893.24)
Retired Unspecified Public Purpose: $155,000 ($91.93)
Issue, Unspecified Public Purpose: $17,000 ($10.08)
Sturgis government finances - Cash and Securities in 2017 (per resident):
- Other Funds - Cash and Securities: $868,000 ($514.83)
| Businesses in Sturgis, KY | ||||
| Name | Count | Name | Count | |
|---|---|---|---|---|
| Ford | 1 | Pizza Hut | 1 | |
| Lane Furniture | 1 | True Value | 1 | |
| MasterBrand Cabinets | 2 | U-Haul | 1 | |
Strongest AM radio stations in Sturgis:
- WSM (650 AM; 50 kW; NASHVILLE, TN; Owner: GAYLORD ENTERTAINMENT COMPANY)
- WDDD (810 AM; 10 kW; JOHNSTON CITY, IL; Owner: CLEAR CHANNEL BROADCASTING LICENSES, INC.)
- WKDA (1200 AM; 50 kW; NASHVILLE, TN; Owner: RADIO NASHVILLE, INC.)
- WNQM (1300 AM; 50 kW; NASHVILLE, TN; Owner: WNQM. INC.)
- WAMB (1160 AM; 50 kW; DONELSON, TN; Owner: GREAT SOUTHERN BROADCASTING COMPANY, INC.)
- WPAD (1560 AM; 10 kW; PADUCAH, KY; Owner: BRISTOL BROADCASTING COMPANY, INC.)
- WLAC (1510 AM; 50 kW; NASHVILLE, TN; Owner: CAPSTAR TX LIMITED PARTNERSHIP)
- WHAS (840 AM; 50 kW; LOUISVILLE, KY; Owner: CLEAR CHANNEL BROADCASTING LICENSES, INC.)
- KXEN (1010 AM; 50 kW; FESTUS-ST. LOUIS, MO; Owner: BDJ RADIO ENTERPRISES, LLC)
- KMOX (1120 AM; 50 kW; ST. LOUIS, MO; Owner: INFINITY BROADCASTING OPERATIONS, INC.)
- WGBF (1280 AM; 5 kW; EVANSVILLE, IN; Owner: CLEAR CHANNEL BROADCASTING LICENSES, INC.)
- WVHI (1330 AM; 5 kW; EVANSVILLE, IN)
- WCRV (640 AM; 50 kW; COLLIERVILLE, TN; Owner: BOTT BROADCASTING COMPANY/TENNESSEE)
Strongest FM radio stations in Sturgis:
- WMSK-FM (95.3 FM; MORGANFIELD, KY; Owner: UNION COUNTY BROADCASTING CO., INC.)
- WVVR (100.3 FM; HOPKINSVILLE, KY; Owner: SAGA COMMUNICATIONS OF TUCKESSEE, LLC)
- WKDQ (99.5 FM; HENDERSON, KY; Owner: REGENT BROADCASTING OF EVANSVILLE/OWENSBORO, INC.)
- WHRZ (97.7 FM; PROVIDENCE, KY; Owner: HOPKINS-WEBSTER CBC, INC.)
- WMJL-FM (102.7 FM; MARION, KY; Owner: JOEMYERS PRODUCTIONS, INC.)
- WSTO (96.1 FM; OWENSBORO, KY; Owner: TSB III, LLC)
- W266AB (101.1 FM; PROVIDENCE, KY; Owner: PENNYRILE CHRISTIAN COMMUNITY, INC.)
- WKTG (93.9 FM; MADISONVILLE, KY; Owner: SOUND BROADCASTERS, INC.)
- WGBF-FM (103.1 FM; HENDERSON, KY; Owner: CLEAR CHANNEL BROADCASTING LICENSES, INC.)
- WYMV (106.9 FM; MADISONVILLE, KY; Owner: MADISONVILLE CBC, INC.)
TV broadcast stations around Sturgis:
- WEHT (Channel 25; EVANSVILLE, IN; Owner: GILMORE BROADCASTING CORPORATION)
- WDKA (Channel 49; PADUCAH, KY; Owner: WDKA ACQUISITION CORPORATION)
- WEVV (Channel 44; EVANSVILLE, IN; Owner: COMCORP OF INDIANA LICENSE CORP.)
- WKMA-TV (Channel 35; MADISONVILLE, KY; Owner: KENTUCKY AUTHORITY FOR EDUCATIONAL TV)
- WFIE (Channel 14; EVANSVILLE, IN; Owner: LIBCO, INC.)
- WAZE-TV (Channel 19; MADISONVILLE, KY; Owner: SOUTH CENTRAL COMMUNICATIONS CORP.)
- W66CT (Channel 66; MOUNT VERNON, IN; Owner: SOUTH CENTRAL COMMUNICATIONS CORP.)
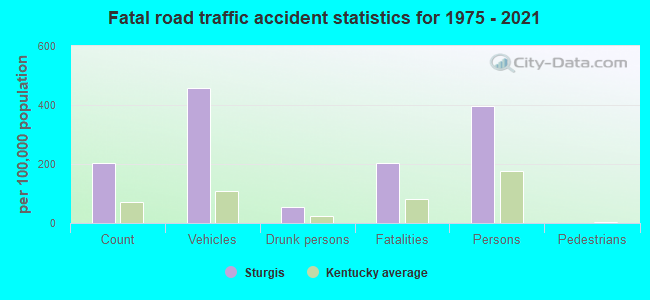
Sturgis fatal accident list:
Sep 26, 2011 07:25 AM, Us-60, Sr-365, Lat: 37.544817, Lon: -87.982678, Vehicles: 2, Persons: 2, Fatalities: 1
May 13, 2004 08:45 AM, Sr-365, Us-60, Vehicles: 2, Persons: 2, Fatalities: 1
Dec 2, 1983 12:58 AM, 109, Vehicles: 2, Persons: 3, Fatalities: 1
- National Bridge Inventory (NBI) Statistics
- 19Number of bridges
- 154ft / 47.4mTotal length
- 14,239Total average daily traffic
- 1,887Total average daily truck traffic
- 12,055Total future (year 2026) average daily traffic
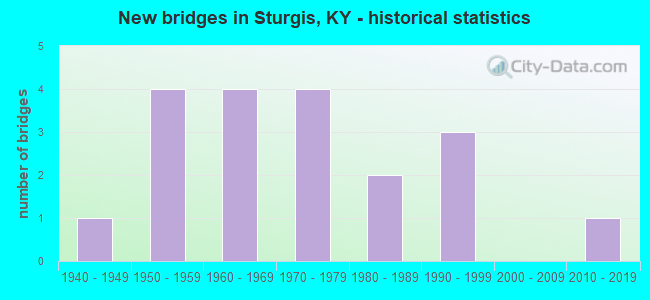
- New bridges - historical statistics
- 11940-1949
- 41950-1959
- 41960-1969
- 41970-1979
- 21980-1989
- 31990-1999
- 12010-2019
FCC Registered Cell Phone Towers:
1 (See the full list of FCC Registered Cell Phone Towers in Sturgis)FCC Registered Antenna Towers:
69 (See the full list of FCC Registered Antenna Towers)FCC Registered Broadcast Land Mobile Towers:
5- Main & 4th St (Lat: 37.544222 Lon: -87.984472), Call Sign: KIV370,
Assigned Frequencies: 155.370 MHz, 155.520 MHz, Grant Date: 08/06/2015, Expiration Date: 08/28/2025, Registrant: City Of Sturgis, 206 West 6th Street, Sturgis, KY 42459, Phone: (270) 333-2166
- On Rt 109 W Edge (Lat: 37.552833 Lon: -87.993083), Call Sign: KQM521,
Assigned Frequencies: 152.300 MHz, Grant Date: 02/24/2004, Expiration Date: 01/19/2014, Cancellation Date: 03/22/2014, Registrant: Universal Licensing Service, 3419 Via Lido Suite 609, Newport Beach, CA 92663-3908, Phone: (877) 677-3639, Fax: (949) 723-2025
- Sturgis Water Treatment Bldg (Lat: 37.540611 Lon: -88.056972), Call Sign: WNFJ527,
Assigned Frequencies: 173.262 MHz, Grant Date: 10/14/2015, Expiration Date: 12/19/2025, Registrant: City Of Sturgis, 201 West 6th Street, Sturgis, KY 42459-1402, Phone: (270) 333-2166, Fax: (270) 333-2724
- TERMINAL, Airport Terminal @ Union County Airport In (Lat: 37.540500 Lon: -87.957861), Type: Mast, Structure height: 6.1 m, Call Sign: WPWY521,
Assigned Frequencies: 453.512 MHz, Grant Date: 12/08/2022, Expiration Date: 02/10/2033, Certifier: Jimmy C Wallace, Registrant: Union Co Air Board, Sturgis, KY 42459, Phone: (270) 333-4487, Fax: (270) 333-9359, Email:
- 524 North Adams Street (Lat: 37.546528 Lon: -87.984722), Call Sign: WRAW850,
Assigned Frequencies: 173.362 MHz, 173.362 MHz, Grant Date: 03/28/2018, Expiration Date: 03/28/2028, Certifier: James D Jackson, Registrant: National License, 12591 Brompton Road, Carmel, IN 46033, Phone: (317) 564-8018, Email:
FCC Registered Microwave Towers:
3- STURGIS, Us Hwy 60 & 641 10 Mi S Of (Lat: 37.435806 Lon: -87.985306), Type: Tower, Structure height: 92.7 m, Overall height: 95.7 m, Call Sign: WPNA944,
Assigned Frequencies: 6171.87 MHz, Grant Date: 02/13/2001, Expiration Date: 02/01/2011, Cancellation Date: 05/05/2004, Certifier: Kellye E Abernathy, Registrant: Bellsouth Personal Communications, LLC, 17330 Preston Rd. Suite 100a, Dallas, TX 75252, Phone: (972) 733-2000, Fax: (972) 733-8141
- 9LV4417A, 10490 West State Road 56 (Lat: 37.677583 Lon: -88.096222), Type: Ltower, Structure height: 86.9 m, Overall height: 91.4 m, Call Sign: WRDN379,
Assigned Frequencies: 6063.80 MHz, 6093.45 MHz, 6063.80 MHz, 6093.45 MHz, 6063.80 MHz, 6093.45 MHz, 6063.80 MHz, 6093.45 MHz, 6063.80 MHz, 6093.45 MHz... (+10 more), Grant Date: 06/11/2019, Expiration Date: 06/11/2029, Cancellation Date: 12/22/2020, Certifier: David Werblow, Registrant: T-Mobile Usa, Inc., 12920 Se 38th Street, Bellevue, WA 98006, Phone: (425) 383-8401, Fax: (425) 383-4040, Email:
- 9LV4417A, 10490 West State Road 56 (Lat: 37.677583 Lon: -88.096222), Type: Gtower, Structure height: 86.9 m, Overall height: 91.4 m, Call Sign: WRUS247,
Assigned Frequencies: 11245.0 MHz, 11405.0 MHz, 11245.0 MHz, 11405.0 MHz, 11245.0 MHz, 11405.0 MHz, 11245.0 MHz, 11405.0 MHz, 11245.0 MHz, 11405.0 MHz... (+12 more), Grant Date: 09/27/2022, Expiration Date: 09/27/2032, Cancellation Date: 03/26/2024, Certifier: Jenny Knopf, Registrant: T-Mobile Usa, Inc., 12920 Se 38th Street, Bellevue, WA 98006, Phone: (425) 383-8401, Email:
FCC Registered Maritime Coast & Aviation Ground Towers:
3- 5 Mi Se (Lat: 37.465056 Lon: -87.948639), Call Sign: WRLB2754,
Assigned Frequencies: 0.27600 MHz, Grant Date: 07/10/2007, Expiration Date: 04/15/2017, Cancellation Date: 06/17/2017, Registrant: Albion Radio Comm Inc, 144 N 8 Street, Albion, IL 62806, Phone: (618) 599-4143, Fax: (618) 445-3193, Email:
- Union County Airport (Lat: 37.543000 Lon: -87.956750), Type: Tower, Structure height: 11.6 m, Call Sign: KSM8,
Assigned Frequencies: 118.775 MHz, Grant Date: 01/22/2018, Expiration Date: 03/18/2028, Registrant: Union County Air Board, 11675 Hwy 60 West, Sturgis, KY 42459, Phone: (270) 333-4487, Fax: (270) 333-9359, Email:
- Sturgis Municipal Airport (Lat: 37.543056 Lon: -88.950333), Type: Mast, Structure height: 6 m, Overall height: 8.2 m, Call Sign: WPXX358,
Assigned Frequencies: 122.800 MHz, Grant Date: 05/13/2008, Expiration Date: 06/25/2018, Cancellation Date: 08/25/2018, Certifier: Mike Cowling, Registrant: Albion Radio Comm Inc, 144 North 8 St, Albion, IL 62806, Phone: (618) 445-3210, Fax: (618) 445-3193, Email:
FCC Registered Amateur Radio Licenses:
22 (See the full list of FCC Registered Amateur Radio Licenses in Sturgis)FAA Registered Aircraft:
7- Aircraft: CESSNA 525A (Category: Land, Engines: 2, Seats: 8, Weight: 12,500 - 19,999 Pounds), Engine: WILLIAMS FJ 44 SERIES (1900 Pounds of Thrust) (Turbo-fan)
N-Number: 184CD, N184CD, N-184CD, Serial Number: 525A0184, Year manufactured: 2003, Airworthiness Date: 11/13/2003, Certificate Issue Date: 07/02/2020
Registrant (Corporation): Gee Aviation Inc, 450 Pryor Blvd, Sturgis, KY 42459
Deregistered: Cancel Date: 10/09/2008, Exported to: United Kingdom - Aircraft: VANS AIRCRAFT INC RV-12 (Category: Land, Seats: 2, Weight: Up to 12,499 Pounds), Engine: ROTAX 912ULS SERIES (100 HP) (4 Cycle)
N-Number: 448TG, N448TG, N-448TG, Serial Number: 120112, Year manufactured: 2011, Airworthiness Date: 12/26/2011, Certificate Issue Date: 07/21/2011
Registrant (Individual): George William Pierce, 142 Chestnut St, Sturgis, KY 42459 - Aircraft: PIERCE GEORGE WM JR A C (Category: Land, Seats: 2, Weight: Up to 12,499 Pounds), Engine: SUBARU ALL MDLS A/B (400 HP) (Reciprocating)
N-Number: 46297, N46297, N-46297, Serial Number: 001, Year manufactured: 2005, Airworthiness Date: 04/05/2005, Certificate Issue Date: 10/12/2004
Registrant (Individual): George Wm Jr Pierce, 142 Chestnut St, Sturgis, KY 42459 - Aircraft: BOEING B75N1 (Category: Land, Seats: 2, Weight: Up to 12,499 Pounds, Speed: 93 mph), Engine: CONT MOTOR W670 SERIES (250 HP) (Reciprocating)
N-Number: 5403N, N5403N, N-5403N, Serial Number: 75-7468, Year manufactured: 1943, Certificate Issue Date: 10/04/1989
Registrant (Individual): Steven D Lambert, 13945 Us Highway 60 W, Sturgis, KY 42459 - Aircraft: CESSNA 210L (Category: Land, Seats: 6, Weight: Up to 12,499 Pounds, Speed: 87 mph), Engine: CONT MOTOR IO 520 SERIES (285 HP) (Reciprocating)
N-Number: 811EC, N811EC, N-811EC, Serial Number: 21060702, Year manufactured: 1975, Airworthiness Date: 02/26/1975, Certificate Issue Date: 04/22/2016
Registrant (Corporation): Gee Aviation Inc, 450 Pryor Blvd, Sturgis, KY 42459 - Aircraft: MAIRE DAVID BAKENG DUCE (Category: Land, Seats: 2, Weight: Up to 12,499 Pounds), Engine: CONT MOTOR C125 SERIES (125 HP) (Reciprocating)
N-Number: 9034Q, N9034Q, N-9034Q, Serial Number: DM-11, Year manufactured: 1979, Airworthiness Date: 02/29/1980, Certificate Issue Date: 06/26/2008
Registrant (Co-Owned): Steven D Lambert, 13945 Us Highway 60 W, Sturgis, KY 42459, Other Owners: Diana L Lambert - Aircraft: CESSNA 525 (Category: Land, Engines: 2, Seats: 8, Weight: Up to 12,499 Pounds), Engine: WILLIAMS FJ 44 SERIES (1900 Pounds of Thrust) (Turbo-fan)
N-Number: 550TF, N550TF, N-550TF, Serial Number: 525-0013, Year manufactured: 1993, Airworthiness Date: 05/14/1993, Certificate Issue Date: 02/19/2016
Registrant (Corporation): Gee Aviation Inc, 450 Pryor Blvd, Sturgis, KY 42459
2002 - 2017 National Fire Incident Reporting System (NFIRS) incidents
- Fire incident types reported to NFIRS in Sturgis, KY
- 13252.2%Structure Fires
- 7630.0%Outside Fires
- 249.5%Mobile Property/Vehicle Fires
- 218.3%Other
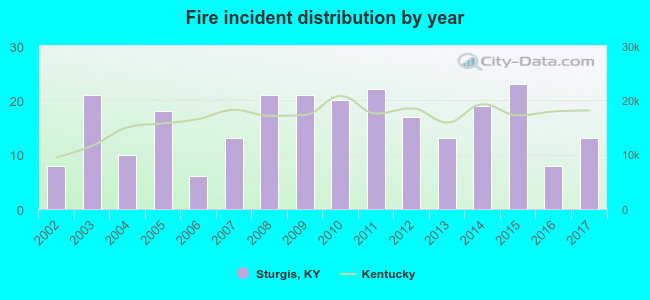 According to the data from the years 2002 - 2017 the average number of fires per year is 16. The highest number of reported fires - 23 took place in 2015, and the least - 6 in 2006. The data has a growing trend.
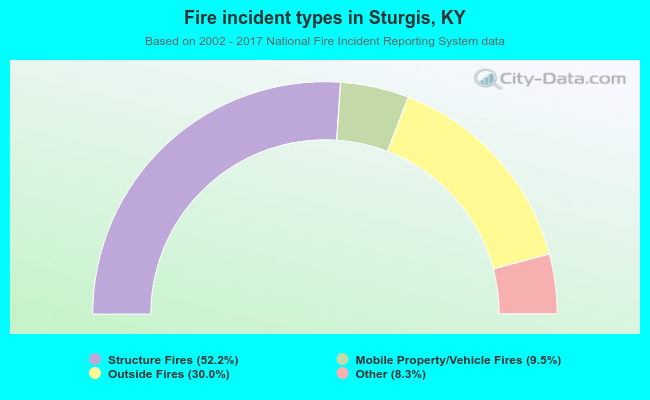 When looking into fire subcategories, the most incidents belonged to: Structure Fires (52.2%), and Outside Fires (30.0%).
| Most common first names in Sturgis, KY among deceased individuals | ||
| Name | Count | Lived (average) |
|---|---|---|
| John | 71 | 73.4 years |
| William | 64 | 71.5 years |
| James | 60 | 71.4 years |
| Mary | 54 | 78.5 years |
| Charles | 36 | 72.8 years |
| Robert | 33 | 68.4 years |
| George | 33 | 72.5 years |
| Thomas | 21 | 80.8 years |
| Roy | 20 | 67.5 years |
| Henry | 19 | 76.8 years |
| Most common last names in Sturgis, KY among deceased individuals | ||
| Last name | Count | Lived (average) |
|---|---|---|
| Collins | 43 | 75.8 years |
| Smith | 21 | 75.1 years |
| Holt | 19 | 75.7 years |
| Williams | 18 | 76.4 years |
| Brown | 18 | 74.4 years |
| Jones | 16 | 75.8 years |
| Owen | 16 | 76.3 years |
| Farthing | 15 | 74.2 years |
| Hinton | 15 | 79.3 years |
| Davis | 15 | 79.3 years |
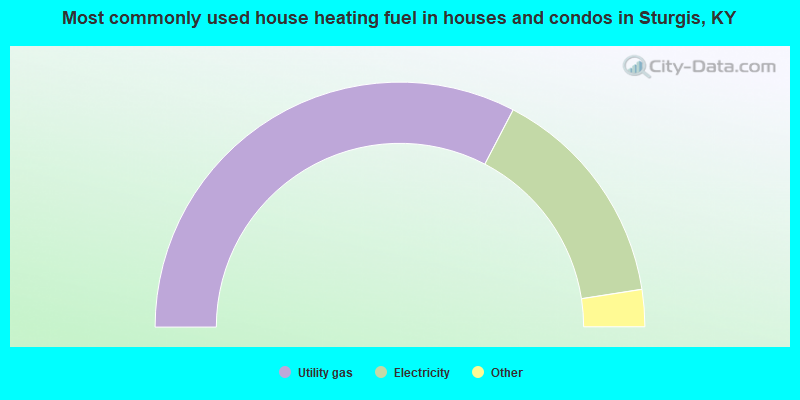
- 65.3%Utility gas
- 29.8%Electricity
- 3.1%Fuel oil, kerosene, etc.
- 1.8%Bottled, tank, or LP gas
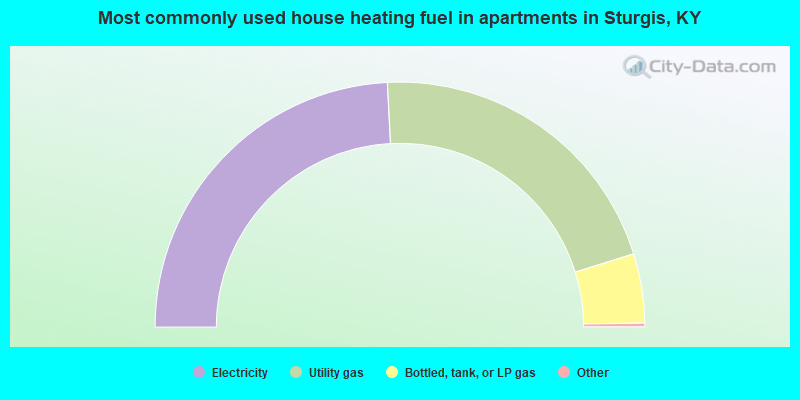
- 48.6%Electricity
- 42.2%Utility gas
- 9.2%Bottled, tank, or LP gas
Sturgis compared to Kentucky state average:
- Median household income below state average.
- Median house value below state average.
- Unemployed percentage below state average.
- Black race population percentage below state average.
- Hispanic race population percentage significantly below state average.
- Foreign-born population percentage significantly below state average.
- Length of stay since moving in significantly above state average.
- House age above state average.
- Number of college students significantly below state average.
- Percentage of population with a bachelor's degree or higher below state average.

|
Total of 9 patent applications in 2008-2024.