Superior, Wisconsin
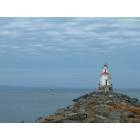
Superior: Wisconsin Point
Superior: Wisconsin Point Lighthouse with ice melting in the springtime, in Superior, Wisconsin.
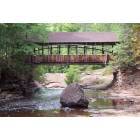
Superior: Horton Bridge At Amnicon Falls State Park

Superior: Whitetail Deer In Superior
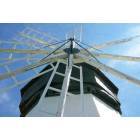
Superior: Davidson Windmill

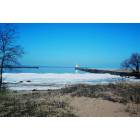
Superior: Lake Superior's Shores Through Driftwood

Superior: Blatnik Bridge
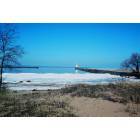
Superior: Wisconsin Point Lighthouse with ice melting in the springtime, in Superior, Wisconsin.
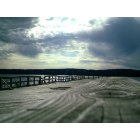
Superior: Arrowhead Pier

Superior: Richard I Bong World War II Museum
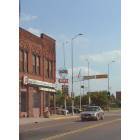
Superior: Globe News Store, Superior Wisconsin
- see
13
more - add
your
Submit your own pictures of this city and show them to the world
- OSM Map
- General Map
- Google Map
- MSN Map
Population change since 2000: -3.3%
 |
| Males: 12,859 | |
| Females: 13,600 |
| Median resident age: | 39.2 years |
| Wisconsin median age: | 40.4 years |
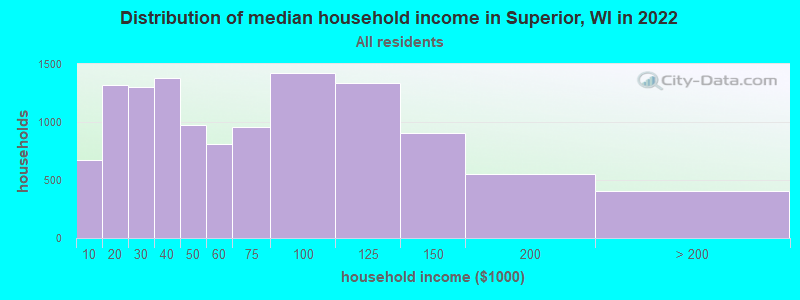
| Superior: | $53,827 |
| WI: | $70,996 |
Estimated per capita income in 2022: $33,071 (it was $17,253 in 2000)
Superior city income, earnings, and wages data
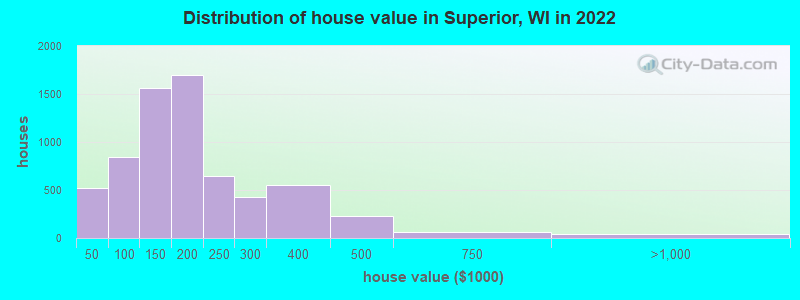
Estimated median house or condo value in 2022: $169,771 (it was $63,900 in 2000)
| Superior: | $169,771 |
| WI: | $252,800 |
Mean prices in 2022: all housing units: $199,125; detached houses: $204,515; townhouses or other attached units: $271,208; in 2-unit structures: $165,325; mobile homes: $65,135
Median gross rent in 2022: $817.
(14.1% for White Non-Hispanic residents, 25.5% for Black residents, 9.4% for Hispanic or Latino residents, 30.9% for American Indian residents, 9.6% for two or more races residents)
Detailed information about poverty and poor residents in Superior, WI


Compare current foreclosures near Superior, WI:
| Photo | Address | Area | Beds / Baths | Price | Details |
|---|---|---|---|---|---|

|
#1
Baxter Ave
Superior, WI 54880
|
- sq. feet
|
1 baths 2 beds |
$57,200
|
show details |

|
#2
Maryland Ave
Superior, WI 54880
|
1,440 sq. feet
|
1 baths 3 beds |
show details | |

|
#3
N 20th St
Superior, WI 54880
|
1,440 sq. feet
|
1 baths 3 beds |
show details | |

|
#4
N 28th St
Superior, WI 54880
|
- sq. feet
|
- baths - beds |
show details | |

|
#5
Iowa Ave
Superior, WI 54880
|
- sq. feet
|
- baths - beds |
show details | |

|
#6
New York Ave
Superior, WI 54880
|
- sq. feet
|
- baths - beds |
show details | |

|
#7
S Tuff Rd
Superior, WI 54880
|
- sq. feet
|
- baths - beds |
show details | |

|
#8
S State Road 35
Superior, WI 54880
|
- sq. feet
|
- baths - beds |
show details | |

|
#9
John Ave Apt L
Superior, WI 54880
|
- sq. feet
|
- baths - beds |
show details | |

|
#10
Tower Ave Apt 311
Superior, WI 54880
|
- sq. feet
|
- baths - beds |
show details |
| Photo | Address | Area | Beds / Baths | Price | Details |
|---|---|---|---|---|---|

|
#11
Aspen Ct
Superior, WI 54880
|
- sq. feet
|
- baths - beds |
show details | |

|
#12
Lamborn Ave
Superior, WI 54880
|
- sq. feet
|
- baths - beds |
show details | |

|
#13
John Ave Apt 3
Superior, WI 54880
|
- sq. feet
|
- baths - beds |
show details | |

|
#14
Butler Ave
Superior, WI 54880
|
- sq. feet
|
- baths - beds |
show details | |

|
#15
Belknap St # 410
Superior, WI 54880
|
- sq. feet
|
- baths - beds |
show details | |

|
#16
Harrison St Apt 201
Superior, WI 54880
|
- sq. feet
|
- baths - beds |
show details | |

|
#17
N 21st St
Superior, WI 54880
|
- sq. feet
|
- baths - beds |
show details | |

|
#18
John Ave
Superior, WI 54880
|
- sq. feet
|
- baths - beds |
show details | |

|
#19
Hammond Ave
Superior, WI 54880
|
- sq. feet
|
- baths - beds |
show details | |

|
#20
E 4th St
Superior, WI 54880
|
- sq. feet
|
- baths - beds |
show details |
| Photo | Address | Area | Beds / Baths | Price | Details |
|---|---|---|---|---|---|

|
#21
Ogden Ave
Superior, WI 54880
|
- sq. feet
|
- baths - beds |
show details | |

|
#22
John Ave
Superior, WI 54880
|
- sq. feet
|
- baths - beds |
show details | |

|
#23
E 11th St
Superior, WI 54880
|
- sq. feet
|
- baths - beds |
show details | |

|
#24
Clough Ave
Superior, WI 54880
|
- sq. feet
|
- baths - beds |
show details | |

|
#25
N 20th St
Superior, WI 54880
|
- sq. feet
|
- baths - beds |
show details | |

|
#26
Kissell Ave
Duluth, MN 55811
|
852 sq. feet
|
- baths 2 beds |
$129,900
|
show details |

|
#27
W 4th St
Duluth, MN 55806
|
1,429 sq. feet
|
1 baths 3 beds |
show details | |

|
#28
S 66th Ave W
Duluth, MN 55807
|
768 sq. feet
|
1 baths 2 beds |
show details | |

|
#29
Chestnut Ave
Carlton, MN 55718
|
1,428 sq. feet
|
2 baths 3 beds |
show details | |

|
#30
105th Ave W
Duluth, MN 55808
|
960 sq. feet
|
1 baths 2 beds |
show details |
| Photo | Address | Area | Beds / Baths | Price | Details |
|---|---|---|---|---|---|

|
#31
W 3rd St
Duluth, MN 55806
|
1,528 sq. feet
|
1 baths 3 beds |
show details | |

|
#32
Highway 194
Saginaw, MN 55779
|
732 sq. feet
|
1 baths 2 beds |
show details | |

|
#33
W 8th St
Duluth, MN 55807
|
983 sq. feet
|
1 baths 2 beds |
show details | |

|
#34
W Buffalo St
Duluth, MN 55811
|
1,155 sq. feet
|
1 baths 2 beds |
show details | |

|
#35
Ivanhoe St
Duluth, MN 55804
|
960 sq. feet
|
1 baths 2 beds |
show details | |

|
#36
Allendale Ave
Duluth, MN 55803
|
788 sq. feet
|
1 baths 2 beds |
show details | |

|
#37
W Owatonna St
Duluth, MN 55803
|
1,212 sq. feet
|
1 baths 3 beds |
show details | |

|
#38
S 55th Ave E
Duluth, MN 55804
|
552 sq. feet
|
1 baths 2 beds |
show details | |

|
#39
Wadena St
Duluth, MN 55803
|
1,296 sq. feet
|
1 baths 4 beds |
show details | |

|
#40
Dodge St
Duluth, MN 55804
|
884 sq. feet
|
1 baths 3 beds |
show details |
| Photo | Address | Area | Beds / Baths | Price | Details |
|---|---|---|---|---|---|

|
#41
Spear Ave
Duluth, MN 55803
|
814 sq. feet
|
1 baths 4 beds |
show details | |

|
#42
Fern Ave
Duluth, MN 55805
|
1,196 sq. feet
|
1 baths 3 beds |
show details | |

|
#43
E 2nd St
Duluth, MN 55812
|
1,260 sq. feet
|
2 baths 6 beds |
show details | |

|
#44
Snelling Ave
Duluth, MN 55812
|
936 sq. feet
|
1 baths 2 beds |
show details | |

|
#45
Martha St
Duluth, MN 55805
|
1,118 sq. feet
|
1 baths 3 beds |
show details | |

|
#46
Linden St
Duluth, MN 55811
|
608 sq. feet
|
1 baths 1 beds |
show details | |

|
#47
Greysolon Rd
Duluth, MN 55812
|
660 sq. feet
|
1 baths 2 beds |
show details | |

|
#48
99th Ave W # 2
Duluth, MN 55808
|
720 sq. feet
|
1 baths 4 beds |
show details | |

|
#49
Maple Bend Dr
Duluth, MN 55811
|
1,065 sq. feet
|
1 baths 2 beds |
show details | |

|
Check over 1 million property listings on Foreclosure.com!
|
browse all offers | |||


- 23,28587.5%White alone
- 1,4355.4%Two or more races
- 6182.3%Hispanic
- 5232.0%Asian alone
- 4541.7%Black alone
- 2571.0%American Indian alone
- 570.2%Other race alone
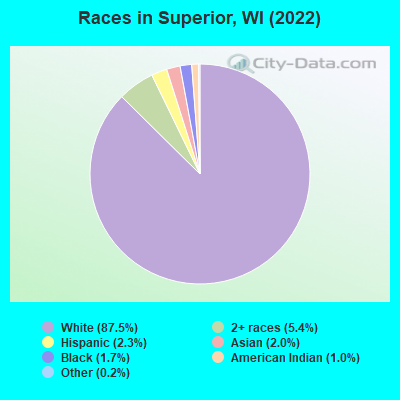
Races in Superior detailed stats: ancestries, foreign born residents, place of birth
According to our research of Wisconsin and other state lists, there were 84 registered sex offenders living in Superior, Wisconsin as of April 27, 2024.
The ratio of all residents to sex offenders in Superior is 319 to 1.
The ratio of registered sex offenders to all residents in this city is near the state average.
Type |
2009 |
2010 |
2011 |
2012 |
2013 |
2014 |
2015 |
2016 |
2017 |
2018 |
2019 |
2020 |
2021 |
2022 |
|---|---|---|---|---|---|---|---|---|---|---|---|---|---|---|
| Murders (per 100,000) | 0 (0.0) | 2 (7.3) | 0 (0.0) | 1 (3.7) | 1 (3.7) | 1 (3.7) | 0 (0.0) | 0 (0.0) | 1 (3.8) | 0 (0.0) | 0 (0.0) | 2 (7.7) | 0 (0.0) | 0 (0.0) |
| Rapes (per 100,000) | 7 (26.8) | 14 (51.4) | 7 (25.6) | 9 (33.0) | 22 (82.3) | 9 (33.6) | 9 (33.9) | 12 (45.4) | 8 (30.4) | 11 (42.2) | 14 (53.9) | 6 (23.2) | 12 (45.9) | 19 (71.9) |
| Robberies (per 100,000) | 19 (72.8) | 18 (66.1) | 27 (98.7) | 22 (80.6) | 22 (82.3) | 23 (85.9) | 13 (48.9) | 12 (45.4) | 8 (30.4) | 16 (61.4) | 4 (15.4) | 10 (38.7) | 7 (26.8) | 3 (11.4) |
| Assaults (per 100,000) | 46 (176.3) | 40 (146.8) | 20 (73.1) | 51 (186.9) | 47 (175.8) | 41 (153.1) | 36 (135.5) | 36 (136.1) | 27 (102.5) | 49 (188.1) | 54 (208.0) | 31 (119.9) | 35 (134.0) | 34 (128.6) |
| Burglaries (per 100,000) | 201 (770.2) | 297 (1,090) | 274 (1,001) | 221 (810.1) | 279 (1,043) | 246 (918.7) | 196 (737.6) | 131 (495.3) | 133 (504.7) | 150 (575.7) | 122 (469.8) | 166 (642.3) | 80 (306.3) | 56 (211.9) |
| Thefts (per 100,000) | 1,147 (4,395) | 1,301 (4,775) | 1,095 (4,002) | 1,016 (3,724) | 1,243 (4,649) | 1,358 (5,072) | 1,215 (4,572) | 1,066 (4,030) | 944 (3,582) | 882 (3,385) | 918 (3,535) | 753 (2,914) | 629 (2,408) | 514 (1,945) |
| Auto thefts (per 100,000) | 48 (183.9) | 70 (256.9) | 50 (182.7) | 72 (263.9) | 100 (374.0) | 135 (504.2) | 68 (255.9) | 58 (219.3) | 71 (269.4) | 82 (314.7) | 61 (234.9) | 95 (367.6) | 96 (367.6) | 60 (227.0) |
| Arson (per 100,000) | 7 (26.8) | 8 (29.4) | 17 (62.1) | 21 (77.0) | 5 (18.7) | 4 (14.9) | 2 (7.5) | 6 (22.7) | 2 (7.6) | 0 (0.0) | 0 (0.0) | 3 (11.6) | 3 (11.5) | 3 (11.4) |
| City-Data.com crime index | 323.0 | 392.9 | 309.5 | 322.1 | 422.1 | 398.3 | 323.9 | 290.5 | 261.6 | 290.7 | 282.4 | 260.6 | 218.8 | 197.4 |
The City-Data.com crime index weighs serious crimes and violent crimes more heavily. Higher means more crime, U.S. average is 246.1. It adjusts for the number of visitors and daily workers commuting into cities.
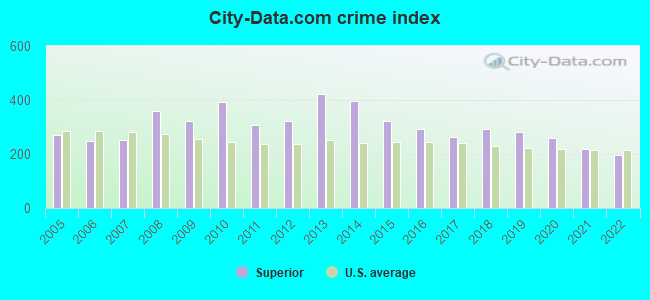
Crime rate in Superior detailed stats: murders, rapes, robberies, assaults, burglaries, thefts, arson
Full-time law enforcement employees in 2021, including police officers: 62 (57 officers - 49 male; 8 female).
| Officers per 1,000 residents here: | 2.18 |
| Wisconsin average: | 2.07 |
 Recent articles from our blog. Our writers, many of them Ph.D. graduates or candidates, create easy-to-read articles on a wide variety of topics.

 | Superior, WI : what is open? things to do? (0 replies) |
| Is Wisconsin a good fit? Which region? (22 replies) |
| Former Wisconsinites...where did you move to and how do you like it in comparison to WI? (480 replies) |
| convert 1930 address (1 reply) |
| Superior, Ashland, and Rhinelander (11 replies) |
| Superior, Wisconsin: The "Other" Port (18 replies) |
Latest news from Superior, WI collected exclusively by city-data.com from local newspapers, TV, and radio stations
Ancestries: German (12.6%), Polish (8.5%), Norwegian (7.5%), American (7.5%), Irish (7.3%), Finnish (5.3%).
Current Local Time: CST time zone
Incorporated in 1858
Elevation: 642 feet
Land area: 36.9 square miles.
Population density: 716 people per square mile (low).
771 residents are foreign born (1.5% Asia, 0.7% Europe, 0.3% Latin America).
| This city: | 2.9% |
| Wisconsin: | 5.0% |
Median real estate property taxes paid for housing units with mortgages in 2022: $2,462 (1.4%)
Median real estate property taxes paid for housing units with no mortgage in 2022: $2,423 (1.6%)
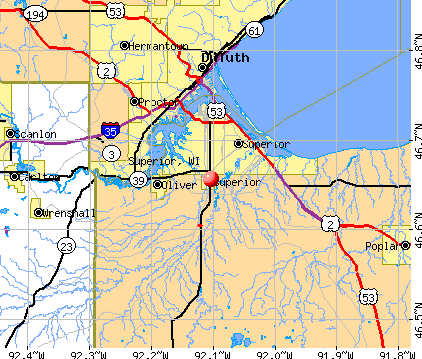
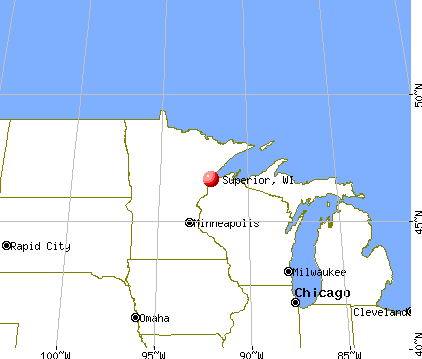
Nearest city with pop. 50,000+: Duluth, MN  (5.3 miles , pop. 86,918).
Nearest city with pop. 200,000+: St. Paul, MN (131.0 miles , pop. 287,151).
Nearest city with pop. 1,000,000+: Chicago, IL (401.0 miles , pop. 2,896,016).
Nearest cities:
), ), ), ), ), ), )Latitude: 46.71 N, Longitude: 92.09 W
Daytime population change due to commuting: +3,127 (+11.8%)
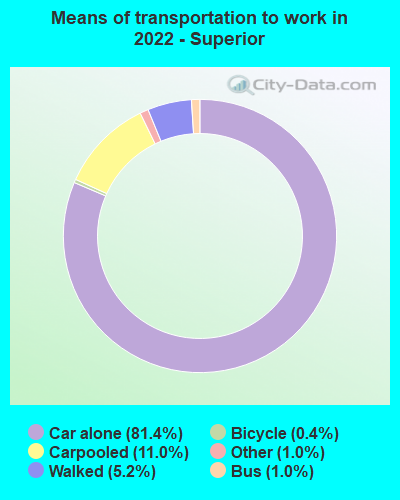
Workers who live and work in this city: 8,771 (63.1%)
Area code: 715
Superior tourist attractions:
Superior, Wisconsin accommodation & food services, waste management - Economy and Business Data
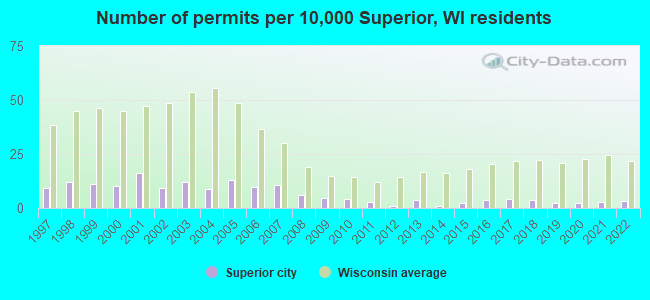
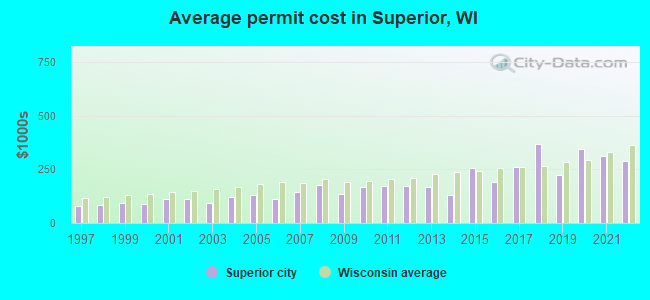
Single-family new house construction building permits:
- 2022: 9 buildings, average cost: $290,600
- 2021: 7 buildings, average cost: $312,400
- 2020: 6 buildings, average cost: $343,400
- 2019: 6 buildings, average cost: $223,300
- 2018: 10 buildings, average cost: $367,200
- 2017: 11 buildings, average cost: $259,900
- 2016: 10 buildings, average cost: $191,200
- 2015: 6 buildings, average cost: $258,300
- 2014: 3 buildings, average cost: $131,700
- 2013: 10 buildings, average cost: $168,300
- 2012: 3 buildings, average cost: $172,700
- 2011: 8 buildings, average cost: $171,400
- 2010: 11 buildings, average cost: $168,000
- 2009: 13 buildings, average cost: $136,200
- 2008: 16 buildings, average cost: $176,900
- 2007: 29 buildings, average cost: $143,700
- 2006: 27 buildings, average cost: $113,100
- 2005: 35 buildings, average cost: $131,400
- 2004: 24 buildings, average cost: $120,900
- 2003: 33 buildings, average cost: $93,000
- 2002: 25 buildings, average cost: $111,400
- 2001: 44 buildings, average cost: $112,800
- 2000: 28 buildings, average cost: $90,200
- 1999: 31 buildings, average cost: $92,500
- 1998: 33 buildings, average cost: $86,200
- 1997: 25 buildings, average cost: $81,400
| Here: | 3.5% |
| Wisconsin: | 2.7% |
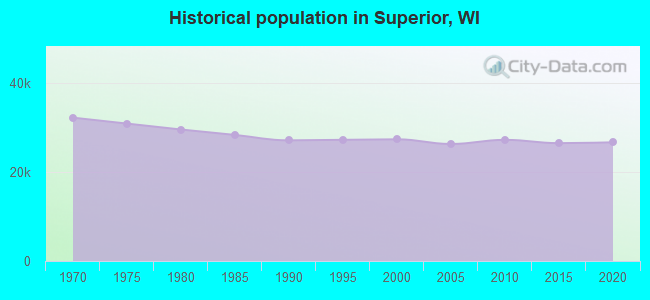
Population change in the 1990s: +54 (+0.2%).
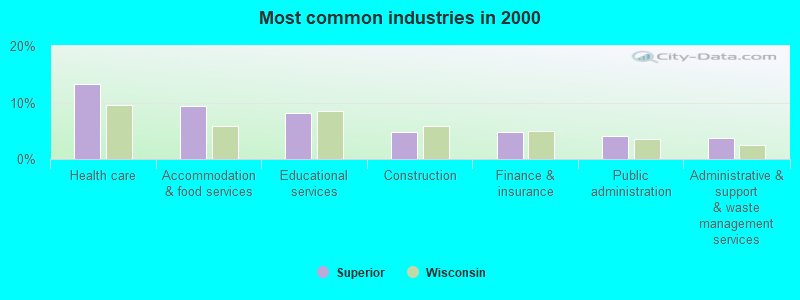
- Health care (13.3%)
- Accommodation & food services (9.4%)
- Educational services (8.2%)
- Construction (4.7%)
- Finance & insurance (4.7%)
- Public administration (4.1%)
- Administrative & support & waste management services (3.8%)
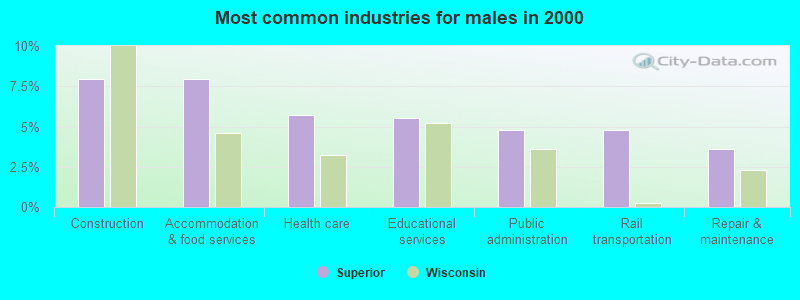
- Construction (7.9%)
- Accommodation & food services (7.9%)
- Health care (5.7%)
- Educational services (5.6%)
- Public administration (4.8%)
- Rail transportation (4.8%)
- Repair & maintenance (3.6%)
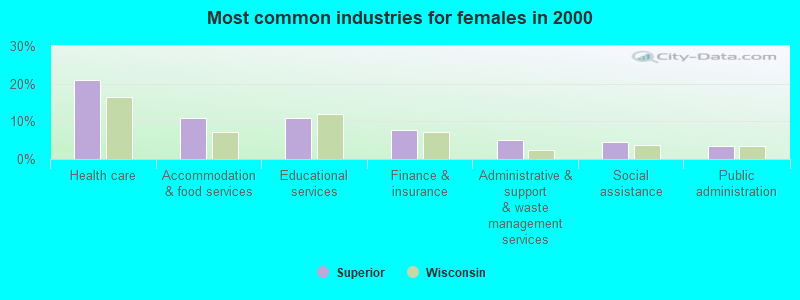
- Health care (20.9%)
- Accommodation & food services (11.0%)
- Educational services (10.8%)
- Finance & insurance (7.6%)
- Administrative & support & waste management services (5.0%)
- Social assistance (4.4%)
- Public administration (3.4%)
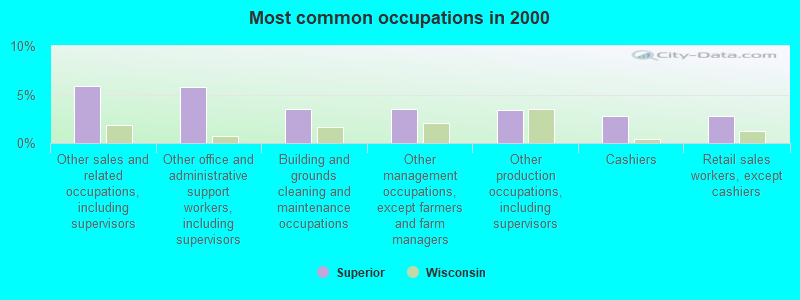
- Other sales and related occupations, including supervisors (5.9%)
- Other office and administrative support workers, including supervisors (5.7%)
- Building and grounds cleaning and maintenance occupations (3.5%)
- Other management occupations, except farmers and farm managers (3.5%)
- Other production occupations, including supervisors (3.4%)
- Cashiers (2.8%)
- Retail sales workers, except cashiers (2.8%)
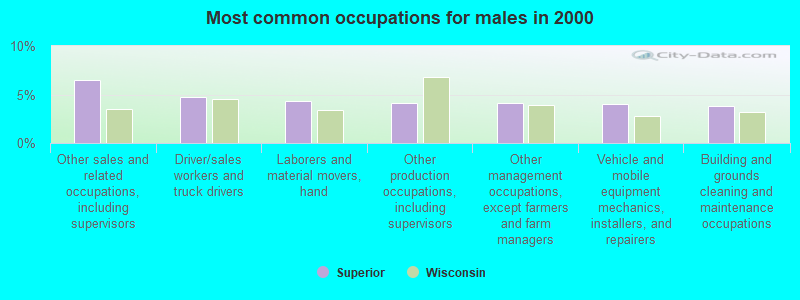
- Other sales and related occupations, including supervisors (6.4%)
- Driver/sales workers and truck drivers (4.8%)
- Laborers and material movers, hand (4.3%)
- Other production occupations, including supervisors (4.1%)
- Other management occupations, except farmers and farm managers (4.1%)
- Vehicle and mobile equipment mechanics, installers, and repairers (4.0%)
- Building and grounds cleaning and maintenance occupations (3.8%)
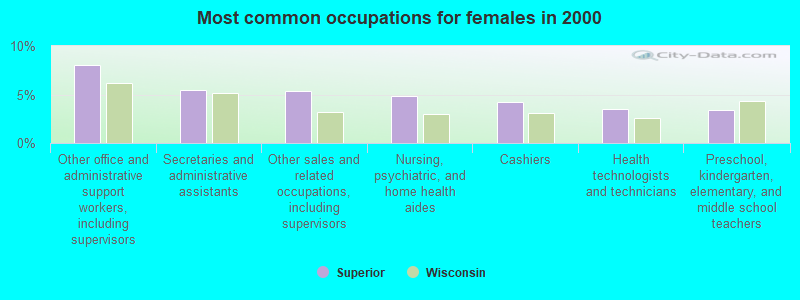
- Other office and administrative support workers, including supervisors (8.0%)
- Secretaries and administrative assistants (5.4%)
- Other sales and related occupations, including supervisors (5.3%)
- Nursing, psychiatric, and home health aides (4.8%)
- Cashiers (4.2%)
- Health technologists and technicians (3.5%)
- Preschool, kindergarten, elementary, and middle school teachers (3.4%)
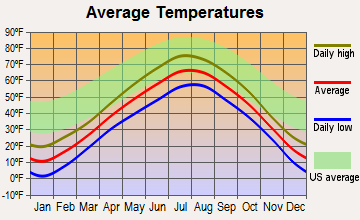
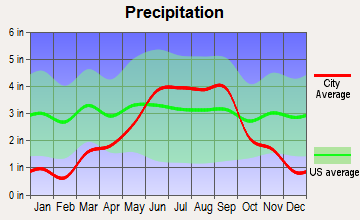
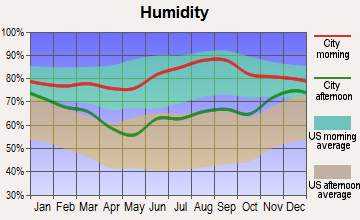
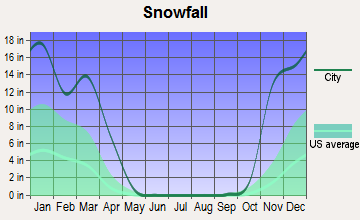
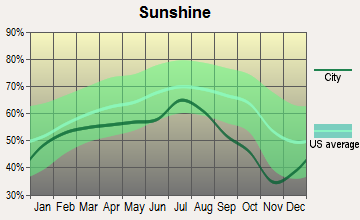
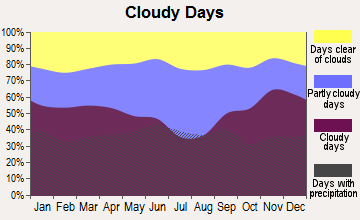
Average climate in Superior, Wisconsin
Based on data reported by over 4,000 weather stations

|
|

(lower is better)
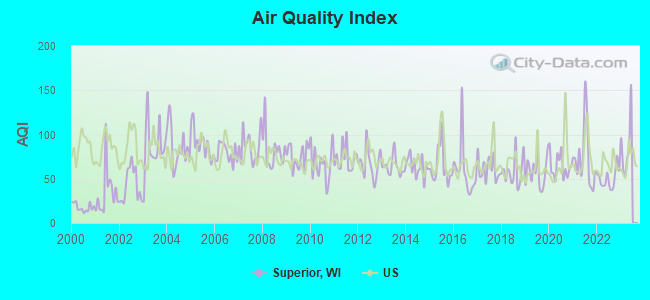
Air Quality Index (AQI) level in 2022 was 50.4. This is significantly better than average.
| City: | 50.4 |
| U.S.: | 72.6 |
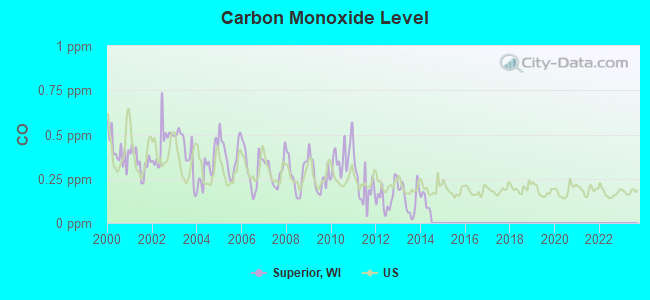
Carbon Monoxide (CO) [ppm] level in 2013 was 0.135. This is significantly better than average. Closest monitor was 1.4 miles away from the city center.
| City: | 0.135 |
| U.S.: | 0.251 |
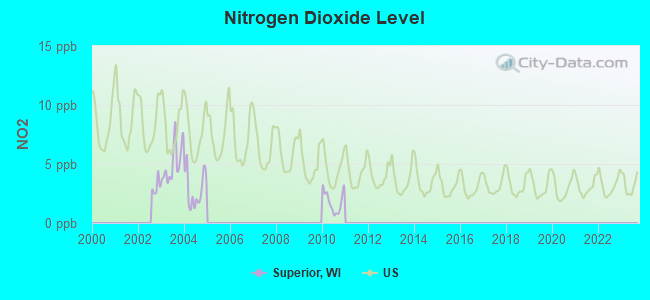
Nitrogen Dioxide (NO2) [ppb] level in 2010 was 1.80. This is significantly better than average. Closest monitor was 1.3 miles away from the city center.
| City: | 1.80 |
| U.S.: | 5.11 |
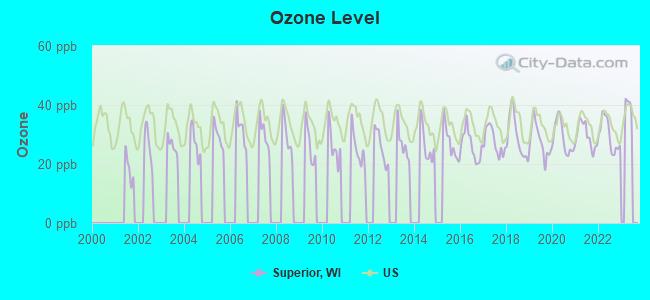
Ozone [ppb] level in 2022 was 29.7. This is about average. Closest monitor was 1.2 miles away from the city center.
| City: | 29.7 |
| U.S.: | 33.3 |
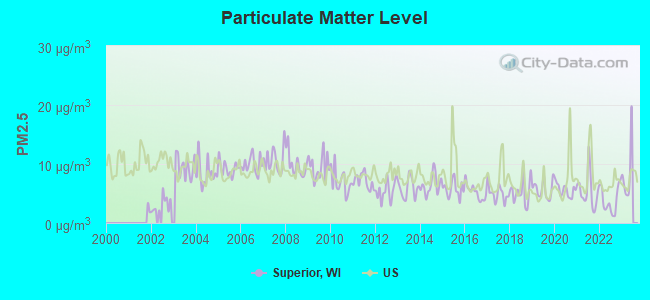
Particulate Matter (PM2.5) [µg/m3] level in 2022 was 3.88. This is significantly better than average. Closest monitor was 4.6 miles away from the city center.
| City: | 3.88 |
| U.S.: | 8.11 |
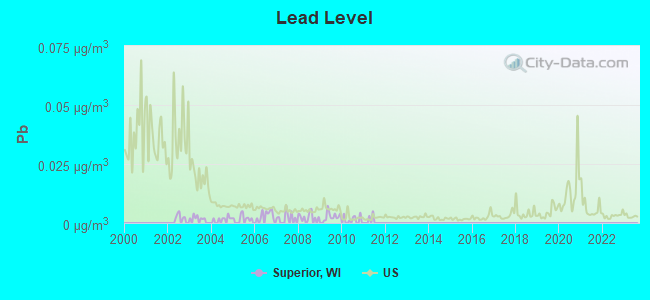
Lead (Pb) [µg/m3] level in 2010 was 0.00123. This is significantly better than average. Closest monitor was 0.9 miles away from the city center.
| City: | 0.00123 |
| U.S.: | 0.00931 |
Tornado activity:
Superior-area historical tornado activity is significantly below Wisconsin state average. It is 72% smaller than the overall U.S. average.
On 6/11/1966, a category F4 (max. wind speeds 207-260 mph) tornado 36.3 miles away from the Superior city center caused between $50,000 and $500,000 in damages.
On 8/6/1969, a category F3 (max. wind speeds 158-206 mph) tornado 23.9 miles away from the city center killed 2 people and injured 3 people and caused between $50,000 and $500,000 in damages.
Earthquake activity:
Superior-area historical earthquake activity is significantly above Wisconsin state average. It is 65% smaller than the overall U.S. average.On 7/9/1975 at 14:54:15, a magnitude 4.6 (4.6 MB, Class: Light, Intensity: IV - V) earthquake occurred 202.5 miles away from the city center
On 6/5/1993 at 01:24:53, a magnitude 4.1 (4.1 LG, Depth: 6.2 mi) earthquake occurred 213.7 miles away from Superior center
On 2/7/2020 at 18:30:28, a magnitude 3.3 (3.3 ML, Class: Light, Intensity: II - III) earthquake occurred 61.3 miles away from the city center
On 1/9/2020 at 18:16:48, a magnitude 3.3 (3.3 MB) earthquake occurred 64.6 miles away from Superior center
On 4/8/2020 at 17:14:33, a magnitude 3.3 (3.3 ML) earthquake occurred 65.1 miles away from the city center
On 4/24/2020 at 17:23:43, a magnitude 3.2 (3.2 ML) earthquake occurred 61.5 miles away from the city center
Magnitude types: regional Lg-wave magnitude (LG), body-wave magnitude (MB), local magnitude (ML)
Natural disasters:
The number of natural disasters in Douglas County (9) is smaller than the US average (15).Major Disasters (Presidential) Declared: 7
Emergencies Declared: 2
Causes of natural disasters: Floods: 6, Storms: 4, Winds: 2, Drought: 1, Heavy Rain: 1, Hurricane: 1, Other: 1 (Note: some incidents may be assigned to more than one category).
Hospitals in Superior:
- ST MARYS HOSPITAL OF SUPERIOR NO 63 (3500 TOWER AVE)
- ST MARYS HSPTL SUPERIOR (Voluntary non-profit - Private, 3500 TOWER AVE)
Nursing Homes in Superior:
- CHAFFEY NURSING HOME INC (1419 HILL AVE)
- COLONIAL HEALTH CARE SERVICES INC (3120 N 21ST STREET)
- GOLDEN LIVINGCENTER-SUPERIOR (1612 N 37TH ST)
- SOUTHDALE HLTH CARE SRVCS (3712 TOWER AVE)
- ST FRANCIS HOME SOUTH 3065 (1500 N 34TH ST)
- ST FRANCIS IN THE PARK HLTH REHAB (1800 NEW YORK AVE)
- VILLA MARINA HEALTH AND REHAB CTR (35 N 28TH ST)
Dialysis Facilities in Superior:
Home Health Centers in Superior:
Airports located in Superior:
- Richard I Bong Airport (SUW) (Runways: 2, Air Taxi Ops: 700, Itinerant Ops: 9,500, Local Ops: 9,000, Military Ops: 50)
- Carlson Airport (9WI9) (Runways: 1)
College/University in Superior:
Other colleges/universities with over 2000 students near Superior:
- Lake Superior College (about 7 miles; Duluth, MN; Full-time enrollment: 3,768)
- The College of Saint Scholastica (about 8 miles; Duluth, MN; FT enrollment: 3,762)
- University of Minnesota-Duluth (about 8 miles; Duluth, MN; FT enrollment: 10,612)
- Wisconsin Indianhead Technical College (about 67 miles; Shell Lake, WI; FT enrollment: 2,414)
- Central Lakes College-Brainerd (about 105 miles; Brainerd, MN; FT enrollment: 3,371)
- Anoka-Ramsey Community College (about 123 miles; Coon Rapids, MN; FT enrollment: 5,918)
- Century College (about 123 miles; White Bear Lake, MN; FT enrollment: 7,393)
Public high school in Superior:
- SUPERIOR HIGH (Students: 1,418, Location: 2600 CATLIN AVE, Grades: 9-12)
Private high schools in Superior:
Public elementary/middle schools in Superior:
- SUPERIOR MIDDLE (Students: 983, Location: 3626 HAMMOND AVE, Grades: 6-8)
- NORTHERN LIGHTS ELEMENTARY (Students: 640, Location: 1201 N 28TH ST, Grades: PK-5)
- GREAT LAKES ELEMENTARY (Students: 383, Location: 129 N 28TH ST E, Grades: PK-5)
- FOUR CORNERS ELEMENTARY (Students: 246, Location: 4465 E COUNTY ROAD B, Grades: PK-5)
- LAKE SUPERIOR ELEMENTARY (Students: 163, Location: 6200 E 3RD ST, Grades: PK-5)
- BRYANT ELEMENTARY (Location: 1423 CENTRAL AVE, Grades: PK-5)
- COOPER ELEMENTARY (Location: 1807 MISSOURI AVE, Grades: PK-5)
Private elementary/middle school in Superior:
User-submitted facts and corrections:
- Northland Secondary is no longer in existance Superior Middle School is now where the students from the former East and Central Middle Schools Students attend school
- East Middle School and Central Middle School are no longer in existance.
- Concordia Lutheran church I believe is still in existance but is not listed??? added by jimjoan813@sbcglobal.net
- East Middle School and Central Middle School are no longer in existance.
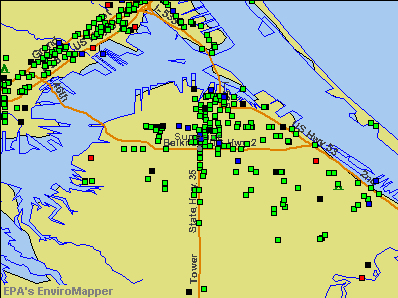
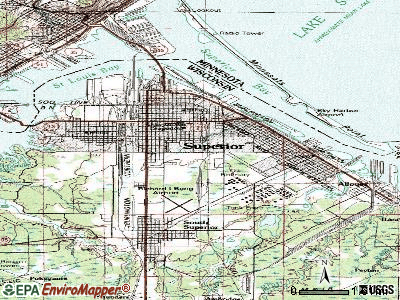
Points of interest:
Notable locations in Superior: Nemadji Golf Club (A), City of Superior Wastewater Treatment Plant (B), Radio Station (C), Superior Landfill (D), Union Station (E), Saint Joseph Orphanage (F), Superior Fire Department Station 1 (G), Superior Fire Department Station 3 (H), Superior Public Library (I), Superior City Hall (J), Sundquist Hall (K), Saint Marys Hall (L), Saint Francis Home (M), Rothwell Student Center (N), Old Main (O), McCaskill Hall (P), Jim Dan Hill Library (Q), Holden Fine Arts Center (R), Gates Field House (S), Fire Station Number 5 (T). Display/hide their locations on the map
Shopping Centers: Mariner Mall Shopping Center (1), Belknap Plaza Shopping Center (2). Display/hide their locations on the map
Churches in Superior include: Apostolic Faith Assembly Church (A), Bethel Lutheran Church (B), Calvary Baptist Church (C), Cathedral Convent (D), Cathedral of Christ the King (E), Central Assembly of God Church (F), Central United Methodist Church (G), Christ Lutheran Church (H), Christian and Missionary Alliance Church (I). Display/hide their locations on the map
Cemeteries: Saint Francis Cemetery (1), Calvary Cemetery (2), Nemadji Cemetery (3). Display/hide their locations on the map
Rivers and creeks: Bear Creek (A), Bluff Creek (B), Morrison Creek (C), Nemadji River (D), Pokegama River (E). Display/hide their locations on the map
Parks in Superior include: Tristate Fair Grounds (1), Billings Park (2), Central Park (3), Gouge Park (4), Hammond Park (5), Kelly Park (6), Priest Field (7), Washington Park (8), Webster Park (9). Display/hide their locations on the map
Tourist attractions: Harrington Arts Center (Museums; 1401 Belknap Street) (1), Fairlawn Mansion & Museum (906 East 2nd Street) (2), Bong P-38 Fund Inc (Museums; 305 East 2nd Street) (3), Old Firehouse & Police Museum (Cultural Attractions- Events- & Facilities; 402 23rd Avenue East) (4), Douglas County Historical Society (Cultural Attractions- Events- & Facilities; 1101 John Avenue) (5), Superior Public Museums (Historical Places & Services; 906 East 2nd Street) (6), SS Meteor Maritime Museum (Historical Places & Services; 300 Marina Drive) (7), Midwest Coin Concepts of Wisconsin (415 Ogden Avenue) (8), Flamingo Excursions (Tours & Charters; 250 Marina Drive) (9). Display/hide their approximate locations on the map
Hotels: Holiday Inn Express Hotel & Suites (303 2nd Avenue East) (1), Androy Lounge (1213 Tower Avenue Suite 3) (2), Manning Motel (3209 Belknap Street) (3), Best Western Brdgeview Mtr Inn (415 Hammond Avenue) (4), Days Inn (110 East 2nd Street) (5), Bay Motel (306 East 3rd Street) (6), Driftwood Motel (2200 East 2nd Street) (7), Best Western Bay Walk Inn (1405 Susquehanna Avenue) (8), Budget Motel (104 East 5th Street) (9). Display/hide their approximate locations on the map
Courts: Courts-Douglas County Of (1313 Belknap Street) (1), Juvenile Court Office-Douglas County Of (1313 Belknap Street) (2). Display/hide their approximate locations on the map
Birthplace of: Bud Grant - Football coach, Richard Bong - Air Force Medal of Honor recipient, David L. Bazelon - Judge, Irvine Lenroot - Politician, Jeffrey Williams (astronaut) - Astronaut, Kris Benson - 2005 Major League Baseball player (New York Mets, born: Nov 7, 1974), Lewis B. Schwellenbach - Secretary of Labor, Marian Nixon - Actress, Morrie Arnovich - Baseball player, Oliver E. Williamson - Economist.
Drinking water stations with addresses in Superior and their reported violations in the past:
WI DNR AMNICON FALLS CMPGRD (Population served: 80, Groundwater):Past monitoring violations:WI DNR PATTISON LITTLE FALLS HP (Population served: 25, Groundwater):
- 2 regular monitoring violations
Past monitoring violations:WI DNR PATTISON RESERVOIR (Population served: 25, Groundwater):
- 3 routine major monitoring violations
- One regular monitoring violation
Past monitoring violations:
- One routine major monitoring violation
- One minor monitoring violation
- 2 regular monitoring violations
Drinking water stations with addresses in Superior that have no violations reported:
- SUPERIOR DOUGLAS CO FAMILY YMCA CAMP (Population served: 25, Primary Water Source Type: Groundwater)
- WABEGON (Population served: 25, Primary Water Source Type: Groundwater)
- WATERFRONT BAR & GRILL (Population served: 25, Primary Water Source Type: Groundwater)
- MONT DU LAC SKI AREA (Population served: 25, Primary Water Source Type: Groundwater)
- MARTY AND GINAS BAR (Population served: 25, Primary Water Source Type: Groundwater)
- PATTISON PARK GOLF COURSE (Population served: 25, Primary Water Source Type: Groundwater)
- SUPERIOR TOWNHALL (Population served: 25, Primary Water Source Type: Groundwater)
- ST WILLIAM CATHOLIC CHURCH (Population served: 25, Primary Water Source Type: Groundwater)
| This city: | 2.2 people |
| Wisconsin: | 2.4 people |
| This city: | 56.1% |
| Whole state: | 64.4% |
| This city: | 10.2% |
| Whole state: | 7.3% |
Likely homosexual households (counted as self-reported same-sex unmarried-partner households)
- Lesbian couples: 0.4% of all households
- Gay men: 0.2% of all households
People in group quarters in Superior in 2010:
- 674 people in college/university student housing
- 234 people in nursing facilities/skilled-nursing facilities
- 157 people in local jails and other municipal confinement facilities
- 80 people in group homes intended for adults
- 20 people in other noninstitutional facilities
- 19 people in emergency and transitional shelters (with sleeping facilities) for people experiencing homelessness
- 5 people in residential treatment centers for adults
- 2 people in in-patient hospice facilities
People in group quarters in Superior in 2000:
- 500 people in college dormitories (includes college quarters off campus)
- 298 people in nursing homes
- 81 people in local jails and other confinement facilities (including police lockups)
- 72 people in other group homes
- 57 people in other noninstitutional group quarters
- 54 people in homes for the mentally retarded
- 26 people in schools, hospitals, or wards for the intellectually disabled
- 12 people in homes for the mentally ill
- 9 people in halfway houses
- 5 people in wards in general hospitals for patients who have no usual home elsewhere
- 5 people in homes for the physically handicapped
- 5 people in crews of maritime vessels
Banks with branches in Superior (2011 data):
- Superior Savings Bank: South Tower Avenue Branch, Belknap Branch, at 1130 Tower Avenue. Info updated 2006/11/03: Bank assets: $63.8 mil, Deposits: $53.3 mil, local headquarters, positive income, Mortgage Lending Specialization, 3 total offices
- National Bank of Commerce: National Bank Of Commerce, Nbc Mortgage Services Branch, Midtown Branch. Info updated 2008/12/02: Bank assets: $539.6 mil, Deposits: $449.5 mil, local headquarters, positive income, Commercial Lending Specialization, 7 total offices, Holding Company: Natcom Bancshares,inc.
- Superior Bank: at 2820 East 2nd Street, branch established on 1897/08/02. Info updated 2012/03/06: Bank assets: $33.9 mil, Deposits: $27.6 mil, local headquarters, positive income, 1 total offices, Holding Company: Superior National Banc Holding Company
- Citizens Bank: Superior Branch at 1612 Belknap Street, branch established on 1917/09/04. Info updated 2011/08/01: Bank assets: $9,212.3 mil, Deposits: $7,452.0 mil, headquarters in Flint, MI, positive income, Commercial Lending Specialization, 220 total offices, Holding Company: Citizens Republic Bancorp, Inc.
- BMO Harris Bank National Association: Superior at 1425 Tower Avenue, branch established on 1887/07/21. Info updated 2011/07/14: Bank assets: $97,264.0 mil, Deposits: $75,624.6 mil, headquarters in Chicago, IL, positive income, 717 total offices, Holding Company: Bank Of Montreal
For population 15 years and over in Superior:
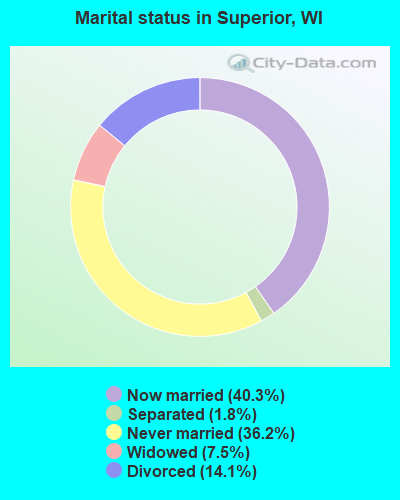
- Never married: 36.2%
- Now married: 40.3%
- Separated: 1.8%
- Widowed: 7.5%
- Divorced: 14.1%
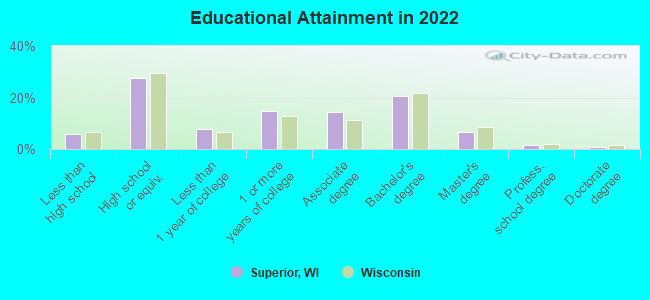
For population 25 years and over in Superior:
- High school or higher: 93.7%
- Bachelor's degree or higher: 28.4%
- Graduate or professional degree: 8.3%
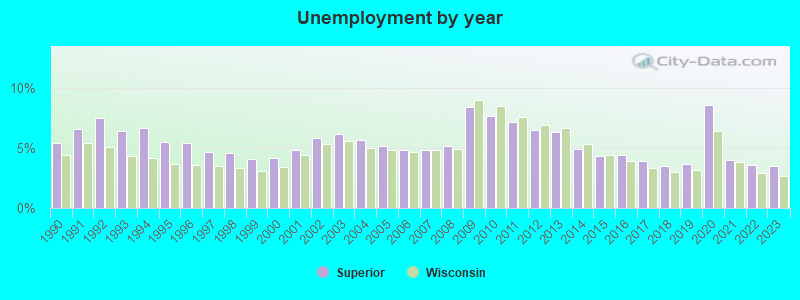
- Unemployed: 7.7%
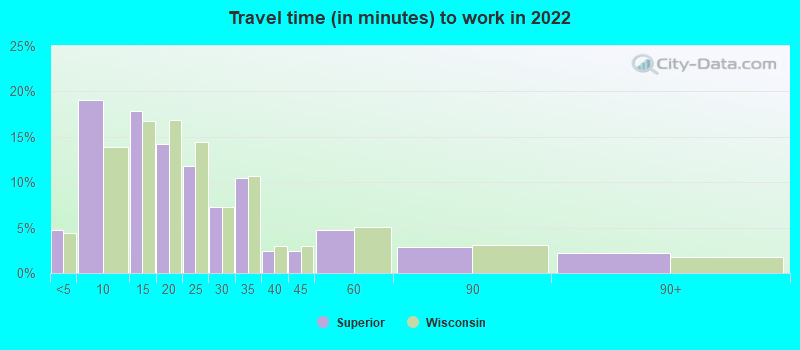
- Mean travel time to work (commute): 14.0 minutes
| Here: | 9.3 |
| Wisconsin average: | 10.4 |
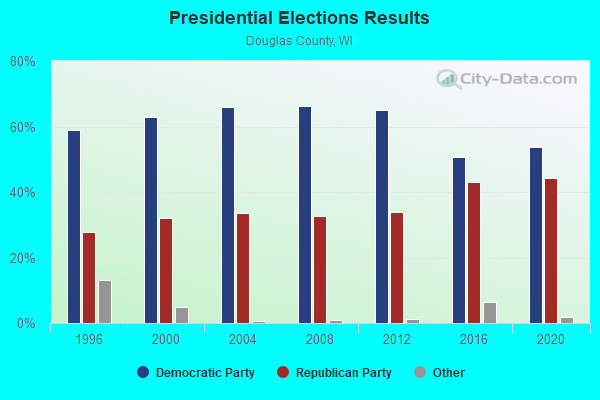
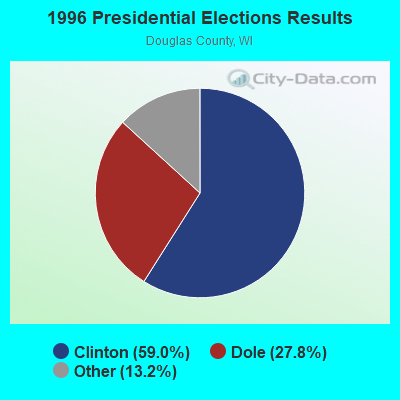
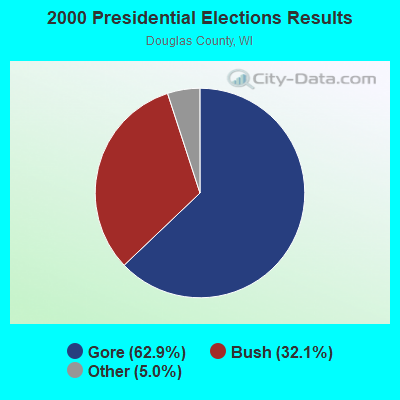

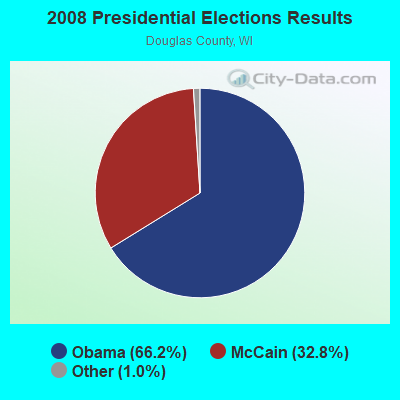
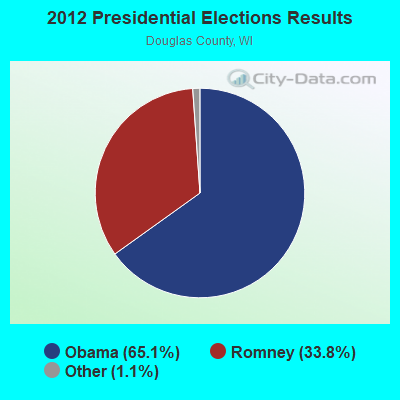
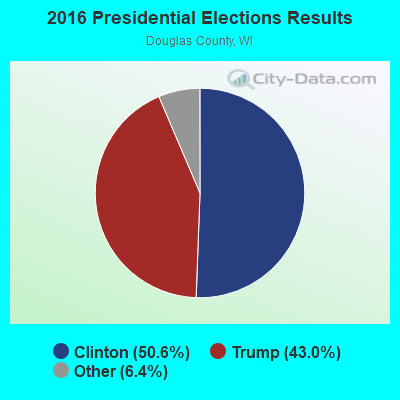
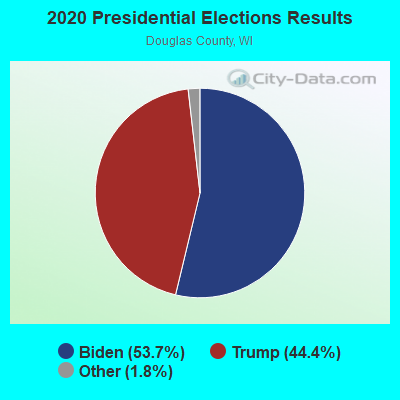
Graphs represent county-level data. Detailed 2008 Election Results
Religion statistics for Superior, WI (based on Douglas County data)
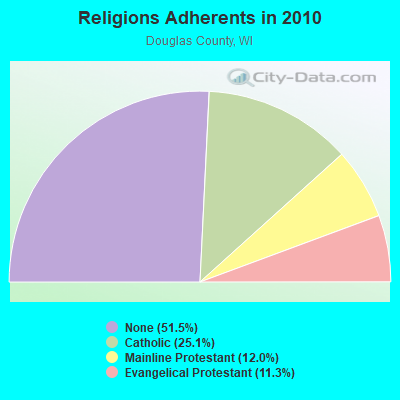
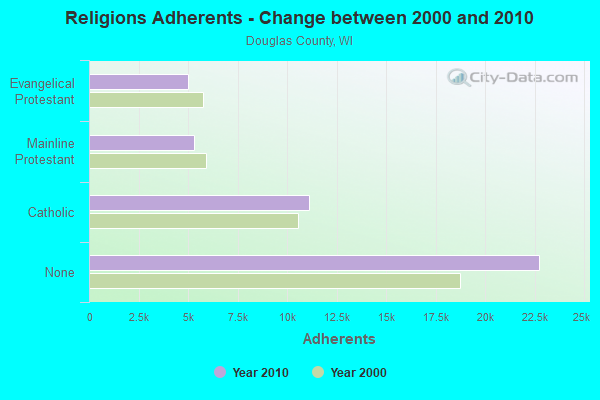
| Religion | Adherents | Congregations |
|---|---|---|
| Catholic | 11,104 | 8 |
| Mainline Protestant | 5,290 | 16 |
| Evangelical Protestant | 5,012 | 29 |
| Other | 14 | 2 |
| None | 22,739 | - |
Food Environment Statistics:
| Douglas County: | 2.06 / 10,000 pop. |
| State: | 1.86 / 10,000 pop. |
| Here: | 0.46 / 10,000 pop. |
| Wisconsin: | 0.38 / 10,000 pop. |
| Here: | 5.26 / 10,000 pop. |
| Wisconsin: | 4.12 / 10,000 pop. |
| Douglas County: | 9.15 / 10,000 pop. |
| Wisconsin: | 8.64 / 10,000 pop. |
| Here: | 7.9% |
| Wisconsin: | 7.6% |
| Douglas County: | 27.0% |
| Wisconsin: | 27.5% |
| Here: | 14.5% |
| Wisconsin: | 13.0% |
Health and Nutrition:
| Superior: | 52.9% |
| State: | 49.5% |
| Superior: | 52.1% |
| Wisconsin: | 46.6% |
| This city: | 28.3 |
| Wisconsin: | 28.7 |
| Superior: | 21.5% |
| Wisconsin: | 21.4% |
| Here: | 10.0% |
| State: | 10.2% |
| Here: | 6.9 |
| Wisconsin: | 6.8 |
| This city: | 33.7% |
| Wisconsin: | 34.0% |
| This city: | 59.7% |
| Wisconsin: | 56.3% |
| This city: | 79.5% |
| State: | 78.5% |
More about Health and Nutrition of Superior, WI Residents
| Local government employment and payroll (March 2022) | |||||
| Function | Full-time employees | Monthly full-time payroll | Average yearly full-time wage | Part-time employees | Monthly part-time payroll |
|---|---|---|---|---|---|
| Police Protection - Officers | 54 | $361,384 | $80,308 | 0 | $0 |
| Sewerage | 42 | $228,525 | $65,293 | 0 | $0 |
| Other and Unallocable | 28 | $159,424 | $68,325 | 1 | $2,955 |
| Fire - Other | 13 | $84,517 | $78,016 | 0 | $0 |
| Local Libraries | 12 | $54,928 | $54,928 | 8 | $11,169 |
| Solid Waste Management | 11 | $59,052 | $64,420 | 1 | $1,039 |
| Parks and Recreation | 10 | $54,878 | $65,854 | 1 | $1,074 |
| Housing and Community Development (Local) | 4 | $26,247 | $78,741 | 0 | $0 |
Superior government finances - Expenditure in 2021 (per resident):
- Construction - Regular Highways: $3,646,000 ($137.80)
Parks and Recreation: $861,000 ($32.54)
Police Protection: $716,000 ($27.06)
Local Fire Protection: $618,000 ($23.36)
General - Other: $5,000 ($0.19)
Air Transportation: $3,000 ($0.11)
- Current Operations - General - Other: $18,514,000 ($699.72)
Police Protection: $8,358,000 ($315.88)
Regular Highways: $7,519,000 ($284.18)
Sewerage: $6,688,000 ($252.77)
Solid Waste Management: $5,745,000 ($217.13)
Local Fire Protection: $4,702,000 ($177.71)
Parks and Recreation: $3,074,000 ($116.18)
Transit Utilities: $1,601,000 ($60.51)
Libraries: $1,416,000 ($53.52)
Financial Administration: $1,209,000 ($45.69)
Central Staff Services: $1,202,000 ($45.43)
Housing and Community Development: $936,000 ($35.38)
General Public Buildings: $745,000 ($28.16)
Protective Inspection and Regulation - Other: $681,000 ($25.74)
Judicial and Legal Services: $307,000 ($11.60)
Health - Other: $147,000 ($5.56)
Natural Resources - Other: $145,000 ($5.48)
Air Transportation: $95,000 ($3.59)
- General - Interest on Debt: $1,580,000 ($59.72)
- Other Capital Outlay - Regular Highways: $7,000 ($0.26)
- Total Salaries and Wages: $15,423,000 ($582.90)
Superior government finances - Revenue in 2021 (per resident):
- Charges - Sewerage: $7,137,000 ($269.74)
Solid Waste Management: $6,284,000 ($237.50)
Regular Highways: $2,536,000 ($95.85)
Parks and Recreation: $1,696,000 ($64.10)
Other: $559,000 ($21.13)
Air Transportation: $57,000 ($2.15)
Housing and Community Development: $9,000 ($0.34)
- Federal Intergovernmental - Housing and Community Development: $821,000 ($31.03)
General Local Government Support: $488,000 ($18.44)
Transit Utilities: $484,000 ($18.29)
Other: $91,000 ($3.44)
- Local Intergovernmental - Other: $269,000 ($10.17)
Highways: $15,000 ($0.57)
- Miscellaneous - General Revenue - Other: $998,000 ($37.72)
Interest Earnings: $715,000 ($27.02)
Sale of Property: $599,000 ($22.64)
Rents: $562,000 ($21.24)
Fines and Forfeits: $315,000 ($11.91)
Special Assessments: $245,000 ($9.26)
Donations From Private Sources: $145,000 ($5.48)
- State Intergovernmental - General Local Government Support: $16,236,000 ($613.63)
Highways: $2,388,000 ($90.25)
Other: $1,738,000 ($65.69)
Education: $534,000 ($20.18)
Transit Utilities: $382,000 ($14.44)
- Tax - Property: $13,633,000 ($515.25)
Occupation and Business License - Other: $696,000 ($26.30)
Other Selective Sales: $664,000 ($25.10)
Other License: $470,000 ($17.76)
Superior government finances - Debt in 2021 (per resident):
- Long Term Debt - Outstanding Unspecified Public Purpose: $48,146,000 ($1819.65)
Beginning Outstanding - Unspecified Public Purpose: $47,275,000 ($1786.73)
Issue, Unspecified Public Purpose: $11,363,000 ($429.46)
Retired Unspecified Public Purpose: $10,492,000 ($396.54)
- Short Term Debt Outstanding - End of Fiscal Year: $8,343,000 ($315.32)
Beginning: $7,232,000 ($273.33)
Superior government finances - Cash and Securities in 2021 (per resident):
- Bond Funds - Cash and Securities: $750,000 ($28.35)
- Other Funds - Cash and Securities: $51,140,000 ($1932.80)
| Businesses in Superior, WI | ||||
| Name | Count | Name | Count | |
|---|---|---|---|---|
| AT&T | 2 | La-Z-Boy | 1 | |
| Applebee's | 1 | Lane Furniture | 2 | |
| Arby's | 1 | Little Caesars Pizza | 1 | |
| Best Western | 2 | MasterBrand Cabinets | 3 | |
| Burger King | 1 | McDonald's | 2 | |
| Carson Pirie Scott | 1 | Menards | 1 | |
| Chevrolet | 1 | Pizza Hut | 1 | |
| Curves | 1 | RadioShack | 1 | |
| Dairy Queen | 1 | Sears | 1 | |
| Days Inn | 1 | Super 8 | 1 | |
| Domino's Pizza | 1 | Target | 1 | |
| FedEx | 4 | Toyota | 1 | |
| GNC | 1 | True Value | 1 | |
| H&R Block | 1 | U-Haul | 2 | |
| Hardee's | 1 | UPS | 3 | |
| Holiday Inn | 1 | Walgreens | 1 | |
| Jones New York | 1 | Walmart | 1 | |
| Kmart | 1 | YMCA | 1 | |
Strongest AM radio stations in Superior:
- WEBC (560 AM; 50 kW; DULUTH, MN)
- WDSM (710 AM; 10 kW; SUPERIOR, WI; Owner: MIDWEST COMMUNICATIONS, INC.)
- KDAL (610 AM; 5 kW; DULUTH, MN; Owner: MIDWEST COMMUNICATIONS, INC.)
- WGEE (970 AM; 1 kW; SUPERIOR, WI; Owner: MIDWEST COMMUNICATIONS, INC.)
- WWJC (850 AM; daytime; 10 kW; DULUTH, MN; Owner: WWJC, INC.)
- KQDS (1490 AM; 1 kW; DULUTH, MN; Owner: RED ROCK RADIO CORP.)
- WCCO (830 AM; 50 kW; MINNEAPOLIS, MN; Owner: INFINITY MEDIA CORPORATION)
- WNMT (650 AM; 10 kW; NASHWAUK, MN; Owner: MIDWEST RADIO NETWORK, L.L.C.)
- WCTS (1030 AM; 50 kW; MAPLEWOOD, MN; Owner: CNTL. BAPT. THEO/AL SEMI MINNEAPOLIS)
- WKLK (1230 AM; 1 kW; CLOQUET, MN; Owner: QB BROADCASTING, LTD.)
- KSTP (1500 AM; 50 kW; ST. PAUL, MN; Owner: KSTP-AM, LLC (DELAWARE))
- KFAN (1130 AM; 50 kW; MINNEAPOLIS, MN; Owner: AMFM RADIO LICENSES, L.L.C.)
- KTIS (900 AM; 25 kW; MINNEAPOLIS, MN; Owner: NORTHWESTERN COLLEGE)
Strongest FM radio stations in Superior:
- KBMX (107.7 FM; PROCTOR, MN; Owner: REGENT BROADCASTING OF DULUTH, INC.)
- WSCN (100.5 FM; CLOQUET, MN; Owner: MINNESOTA PUBLIC RADIO)
- KLDJ (101.7 FM; DULUTH, MN; Owner: REGENT BROADCASTING OF DULUTH, INC.)
- KDNI (90.5 FM; DULUTH, MN; Owner: NORTHWESTERN COLLEGE)
- KDAL-FM (95.7 FM; DULUTH, MN; Owner: MIDWEST COMMUNICATIONS, INC.)
- WWAX (92.1 FM; HERMANTOWN, MN; Owner: RED ROCK RADIO CORP.)
- KKCB (105.1 FM; DULUTH, MN; Owner: REGENT BROADCASTING OF DULUTH, INC.)
- KQDS-FM (94.9 FM; DULUTH, MN; Owner: RED ROCK RADIO CORP.)
- KUMD-FM (103.3 FM; DULUTH, MN; Owner: REGENTS OF UNIVERSITY OF MINNESOTA)
- KUWS (91.3 FM; SUPERIOR, WI; Owner: BD. OF REGENTS, UNIV. OF WISC. SYS.)
- WSCD-FM (92.9 FM; DULUTH, MN; Owner: MINNESOTA PUBLIC RADIO)
- KDNW (97.3 FM; DULUTH, MN; Owner: NORTHWESTERN COLLEGE)
- KRBR-FM (102.5 FM; SUPERIOR, WI; Owner: MIDWEST COMMUNICATIONS, INC.)
- KTCO (98.9 FM; DULUTH, MN; Owner: MIDWEST COMMUNICATIONS, INC.)
- WNCB (89.5 FM; DULUTH, MN; Owner: REFUGE MEDIA GROUP)
- W203AL (88.5 FM; DULUTH, MN; Owner: FAMILY STATIONS, INC.)
- KZIO (104.3 FM; TWO HARBORS, MN; Owner: RED ROCK RADIO CORP.)
- WKLK-FM (96.5 FM; CLOQUET, MN; Owner: QB BROADCASTING, LTD.)
- WHSA (89.9 FM; BRULE, WI; Owner: STATE OF WISCONSIN - EDUCATIONAL COMMUNICATIONS BOARD)
- K292EZ (106.3 FM; DULUTH, MN; Owner: RED ROCK RADIO CORP.)
TV broadcast stations around Superior:
- WDIO-TV (Channel 10; DULUTH, MN; Owner: WDIO-TV, LLC)
- KDLH (Channel 3; DULUTH, MN; Owner: CHELSEY BROADCASTING COMPANY OF DULUTH, LLC)
- KBJR-TV (Channel 6; SUPERIOR, WI; Owner: KBJR LICENSE, INC.)
- KQDS-TV (Channel 21; DULUTH, MN; Owner: KQDS ACQUISITION CORP.)
- WDSE-TV (Channel 8; DULUTH, MN; Owner: DULUTH-SUPERIOR AREA EDUCATIONAL TV CORPORATION)
- K58CM (Channel 58; DULUTH, MN; Owner: TRINITY BROADCASTING NETWORK)
- K38DS (Channel 38; DULUTH, MN; Owner: STEVEN R. ZUKERBERG)
- K62EP (Channel 62; DULUTH, MN; Owner: DAN BLECHMAN)
- K64EF (Channel 64; DULUTH, MN; Owner: STEVEN R. ZUKERBERG)
- K68EA (Channel 68; DULUTH, MN; Owner: MS COMMUNICATIONS, LLC)
- KWMN-LP (Channel 56; DULUTH, MN; Owner: DULUTH DATACASTING PARTNERS, G.P.)
- K15DU (Channel 15; DULUTH, MN; Owner: DAN BLECHMAN)
- K66EO (Channel 66; DULUTH, MN; Owner: HAROLD AND/ OR SUE KROGMAN)
- KDUL-LP (Channel 60; DULUTH, MN; Owner: DULUTH TV PARTNERS, GP)
- National Bridge Inventory (NBI) Statistics
- 29Number of bridges
- 2,254ft / 687mTotal length
- 256,834Total average daily traffic
- 13,025Total average daily truck traffic
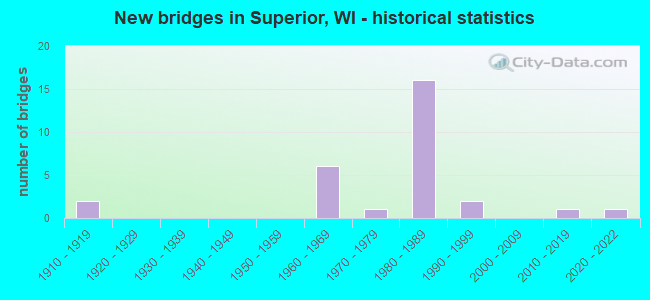
- New bridges - historical statistics
- 21910-1919
- 61960-1969
- 11970-1979
- 161980-1989
- 21990-1999
- 12010-2019
- 12020-2022
FCC Registered Commercial Land Mobile Towers: 3 (See the full list of FCC Registered Commercial Land Mobile Towers in Superior, WI)
FCC Registered Private Land Mobile Towers: 4 (See the full list of FCC Registered Private Land Mobile Towers)
FCC Registered Broadcast Land Mobile Towers: 60 (See the full list of FCC Registered Broadcast Land Mobile Towers)
FCC Registered Microwave Towers: 58 (See the full list of FCC Registered Microwave Towers in this town)
FCC Registered Paging Towers: 1 (See the full list of FCC Registered Paging Towers)
FCC Registered Maritime Coast & Aviation Ground Towers: 10 (See the full list of FCC Registered Maritime Coast & Aviation Ground Towers)
FCC Registered Amateur Radio Licenses: 196 (See the full list of FCC Registered Amateur Radio Licenses in Superior)
FAA Registered Aircraft: 52 (See the full list of FAA Registered Aircraft in Superior)
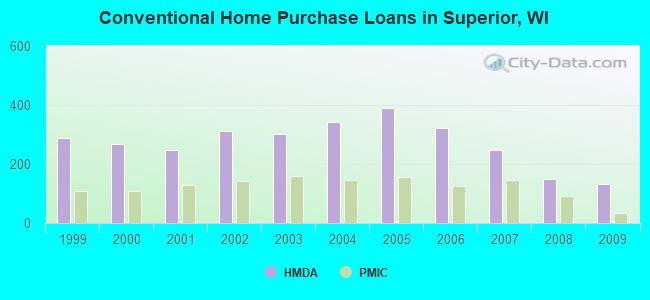
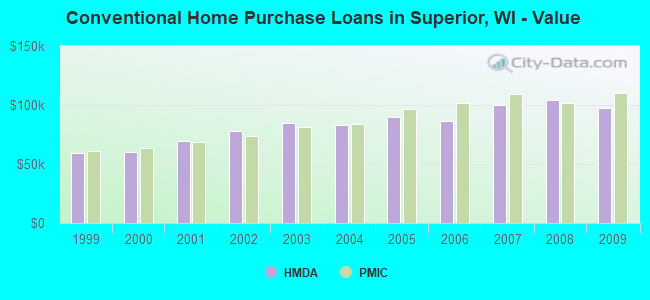
| Home Mortgage Disclosure Act Aggregated Statistics For Year 2009 (Based on 7 full and 3 partial tracts) | ||||||||||||||
| A) FHA, FSA/RHS & VA Home Purchase Loans | B) Conventional Home Purchase Loans | C) Refinancings | D) Home Improvement Loans | E) Loans on Dwellings For 5+ Families | F) Non-occupant Loans on < 5 Family Dwellings (A B C & D) | G) Loans On Manufactured Home Dwelling (A B C & D) | ||||||||
|---|---|---|---|---|---|---|---|---|---|---|---|---|---|---|
| Number | Average Value | Number | Average Value | Number | Average Value | Number | Average Value | Number | Average Value | Number | Average Value | Number | Average Value | |
| LOANS ORIGINATED | 83 | $110,114 | 132 | $97,200 | 564 | $104,959 | 78 | $44,165 | 7 | $279,343 | 83 | $71,878 | 13 | $83,999 |
| APPLICATIONS APPROVED, NOT ACCEPTED | 3 | $97,000 | 11 | $97,830 | 58 | $112,007 | 5 | $55,228 | 0 | $0 | 1 | $103,450 | 0 | $0 |
| APPLICATIONS DENIED | 10 | $104,069 | 29 | $85,212 | 197 | $102,388 | 30 | $46,674 | 1 | $1,004,850 | 16 | $91,844 | 5 | $72,986 |
| APPLICATIONS WITHDRAWN | 7 | $96,607 | 10 | $109,538 | 97 | $105,033 | 3 | $1,712,083 | 0 | $0 | 7 | $782,326 | 2 | $103,055 |
| FILES CLOSED FOR INCOMPLETENESS | 1 | $90,000 | 1 | $359,840 | 29 | $106,628 | 2 | $20,000 | 0 | $0 | 0 | $0 | 0 | $0 |
Detailed mortgage data for all 10 tracts in Superior, WI
| Private Mortgage Insurance Companies Aggregated Statistics For Year 2009 (Based on 5 full and 3 partial tracts) | ||||||||
| A) Conventional Home Purchase Loans | B) Refinancings | C) Non-occupant Loans on < 5 Family Dwellings (A & B) | D) Loans On Manufactured Home Dwelling (A & B) | |||||
|---|---|---|---|---|---|---|---|---|
| Number | Average Value | Number | Average Value | Number | Average Value | Number | Average Value | |
| LOANS ORIGINATED | 33 | $110,515 | 33 | $131,497 | 0 | $0 | 0 | $0 |
| APPLICATIONS APPROVED, NOT ACCEPTED | 9 | $109,646 | 3 | $90,273 | 2 | $109,050 | 0 | $0 |
| APPLICATIONS DENIED | 3 | $109,333 | 5 | $219,166 | 0 | $0 | 1 | $120,000 |
| APPLICATIONS WITHDRAWN | 0 | $0 | 0 | $0 | 0 | $0 | 0 | $0 |
| FILES CLOSED FOR INCOMPLETENESS | 0 | $0 | 1 | $79,000 | 0 | $0 | 0 | $0 |
2002 - 2018 National Fire Incident Reporting System (NFIRS) incidents
- Fire incident types reported to NFIRS in Superior, WI
- 69740.5%Outside Fires
- 62436.2%Structure Fires
- 25714.9%Mobile Property/Vehicle Fires
- 1458.4%Other
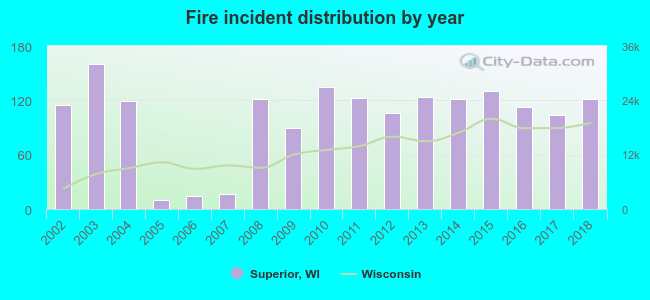 According to the data from the years 2002 - 2018 the average number of fires per year is 101. The highest number of reported fire incidents - 160 took place in 2003, and the least - 10 in 2005. The data has a rising trend.
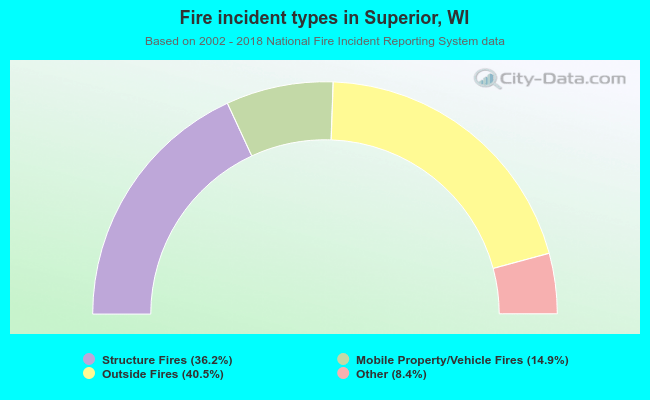 When looking into fire subcategories, the most incidents belonged to: Outside Fires (40.5%), and Structure Fires (36.2%).
Fire-safe hotels and motels in Superior, Wisconsin:
- Super 8 Motel Superior, 4901 E 2ND St, Superior, Wisconsin 54880 , Phone: (715) 398-7686, Fax: (715) 398-7686
- Best Western Bridgeview Motor Inn, 415 Hammond Ave, Superior, Wisconsin 54880 , Phone: (715) 392-8174, Fax: (715) 392-8487
- Barker's Island Inn, 300 Marina Dr, Superior, Wisconsin 54880 , Phone: (715) 392-7152, Fax: (715) 392-1180
- Best Western Bay Walk Inn, 1405 Susquehanna Ave, Superior, Wisconsin 54880 , Phone: (715) 392-7600, Fax: (715) 392-7680
- Holiday Inn Express, 303 2nd Ave E, Superior, Wisconsin 54880 , Phone: (715) 392-3444, Fax: (715) 395-7911
- Days Inn-Superior, 110 E 2nd St, Superior, Wisconsin 54880 , Phone: (715) 392-4783, Fax: (715) 392-4787
- Hampton Inn Superior-Duluth, 66 E 2nd St, Superior, Wisconsin 54880 , Phone: (715) 718-2723, Fax: (715) 718-2724
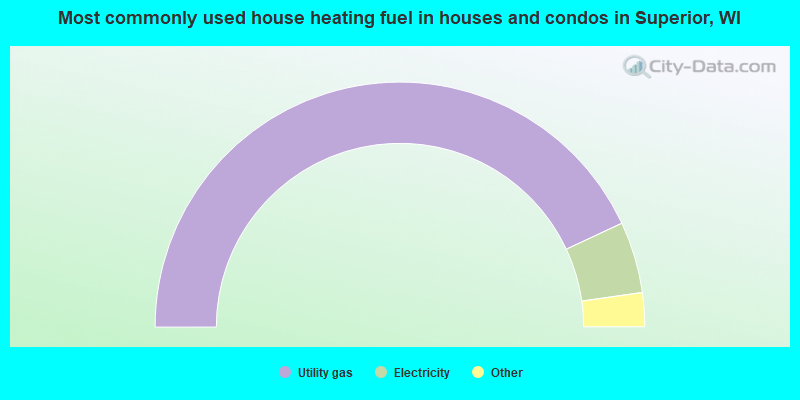
- 86.1%Utility gas
- 9.4%Electricity
- 2.0%Bottled, tank, or LP gas
- 1.9%Fuel oil, kerosene, etc.
- 0.3%Other fuel
- 0.2%Wood
- 0.1%No fuel used
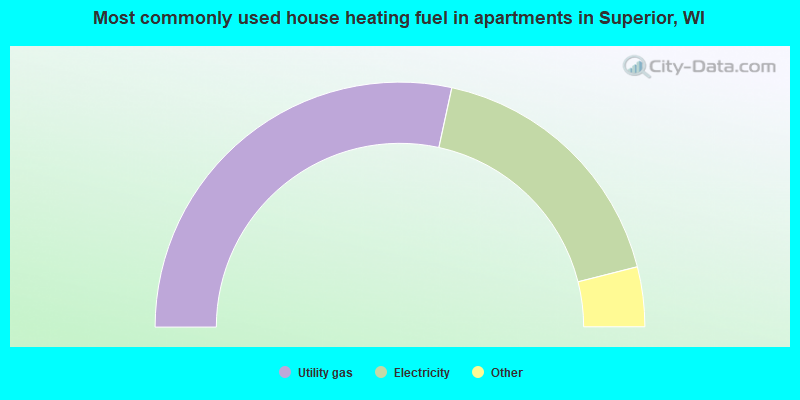
- 56.8%Utility gas
- 35.3%Electricity
- 3.7%Bottled, tank, or LP gas
- 1.9%No fuel used
- 1.5%Other fuel
- 0.9%Fuel oil, kerosene, etc.
Superior compared to Wisconsin state average:
- Black race population percentage significantly below state average.
- Hispanic race population percentage significantly below state average.
- Median age below state average.
- Foreign-born population percentage below state average.
- Length of stay since moving in above state average.
- House age above state average.
Superior on our top lists:
- #39 on the list of "Top 101 cities with the largest percentage of people in crews of maritime vessels (population 1,000+)"
- #62 on the list of "Top 101 cities with the most full-time local library workers per 1000 residents (population 5,000+)"
- #98 on the list of "Top 101 cities with the highest number of arson incidents per 100,000 residents, excludes tourist destinations and others with a lot of outsiders visiting based on city industries data (population 5,000+)"
- #16 (54880) on the list of "Top 101 zip codes with the most alcohol drinking places in 2005"
- #33 (54880) on the list of "Top 101 zip codes with the largest percentage of Swedish first ancestries (pop 5,000+)"
- #3 on the list of "Top 101 counties with the lowest ground withdrawal of fresh water for public supply"

|
|
Total of 36 patent applications in 2008-2024.