Tooele, Utah Submit your own pictures of this city and show them to the world
OSM Map
General Map
Google Map
MSN Map
OSM Map
General Map
Google Map
MSN Map
OSM Map
General Map
Google Map
MSN Map
OSM Map
General Map
Google Map
MSN Map
Please wait while loading the map...
Population in 2022: 38,588 (98% urban, 2% rural). Population change since 2000: +71.5%Males: 19,648 Females: 18,940
March 2022 cost of living index in Tooele: 90.9 (less than average, U.S. average is 100) Percentage of residents living in poverty in 2022: 4.2%for White Non-Hispanic residents , 3.0% for Hispanic or Latino residents , 11.4% for American Indian residents , 18.6% for Native Hawaiian and other Pacific Islander residents , 0.4% for other race residents , 6.1% for two or more races residents )
Profiles of local businesses
Business Search - 14 Million verified businesses
Data:
Median household income ($)
Median household income (% change since 2000)
Household income diversity
Ratio of average income to average house value (%)
Ratio of average income to average rent
Median household income ($) - White
Median household income ($) - Black or African American
Median household income ($) - Asian
Median household income ($) - Hispanic or Latino
Median household income ($) - American Indian and Alaska Native
Median household income ($) - Multirace
Median household income ($) - Other Race
Median household income for houses/condos with a mortgage ($)
Median household income for apartments without a mortgage ($)
Races - White alone (%)
Races - White alone (% change since 2000)
Races - Black alone (%)
Races - Black alone (% change since 2000)
Races - American Indian alone (%)
Races - American Indian alone (% change since 2000)
Races - Asian alone (%)
Races - Asian alone (% change since 2000)
Races - Hispanic (%)
Races - Hispanic (% change since 2000)
Races - Native Hawaiian and Other Pacific Islander alone (%)
Races - Native Hawaiian and Other Pacific Islander alone (% change since 2000)
Races - Two or more races (%)
Races - Two or more races (% change since 2000)
Races - Other race alone (%)
Races - Other race alone (% change since 2000)
Racial diversity
Unemployment (%)
Unemployment (% change since 2000)
Unemployment (%) - White
Unemployment (%) - Black or African American
Unemployment (%) - Asian
Unemployment (%) - Hispanic or Latino
Unemployment (%) - American Indian and Alaska Native
Unemployment (%) - Multirace
Unemployment (%) - Other Race
Population density (people per square mile)
Population - Males (%)
Population - Females (%)
Population - Males (%) - White
Population - Males (%) - Black or African American
Population - Males (%) - Asian
Population - Males (%) - Hispanic or Latino
Population - Males (%) - American Indian and Alaska Native
Population - Males (%) - Multirace
Population - Males (%) - Other Race
Population - Females (%) - White
Population - Females (%) - Black or African American
Population - Females (%) - Asian
Population - Females (%) - Hispanic or Latino
Population - Females (%) - American Indian and Alaska Native
Population - Females (%) - Multirace
Population - Females (%) - Other Race
Coronavirus confirmed cases (Apr 27, 2024)
Deaths caused by coronavirus (Apr 27, 2024)
Coronavirus confirmed cases (per 100k population) (Apr 27, 2024)
Deaths caused by coronavirus (per 100k population) (Apr 27, 2024)
Daily increase in number of cases (Apr 27, 2024)
Weekly increase in number of cases (Apr 27, 2024)
Cases doubled (in days) (Apr 27, 2024)
Hospitalized patients (Apr 18, 2022)
Negative test results (Apr 18, 2022)
Total test results (Apr 18, 2022)
COVID Vaccine doses distributed (per 100k population) (Sep 19, 2023)
COVID Vaccine doses administered (per 100k population) (Sep 19, 2023)
COVID Vaccine doses distributed (Sep 19, 2023)
COVID Vaccine doses administered (Sep 19, 2023)
Likely homosexual households (%)
Likely homosexual households (% change since 2000)
Likely homosexual households - Lesbian couples (%)
Likely homosexual households - Lesbian couples (% change since 2000)
Likely homosexual households - Gay men (%)
Likely homosexual households - Gay men (% change since 2000)
Cost of living index
Median gross rent ($)
Median contract rent ($)
Median monthly housing costs ($)
Median house or condo value ($)
Median house or condo value ($ change since 2000)
Mean house or condo value by units in structure - 1, detached ($)
Mean house or condo value by units in structure - 1, attached ($)
Mean house or condo value by units in structure - 2 ($)
Mean house or condo value by units in structure by units in structure - 3 or 4 ($)
Mean house or condo value by units in structure - 5 or more ($)
Mean house or condo value by units in structure - Boat, RV, van, etc. ($)
Mean house or condo value by units in structure - Mobile home ($)
Median house or condo value ($) - White
Median house or condo value ($) - Black or African American
Median house or condo value ($) - Asian
Median house or condo value ($) - Hispanic or Latino
Median house or condo value ($) - American Indian and Alaska Native
Median house or condo value ($) - Multirace
Median house or condo value ($) - Other Race
Median resident age
Resident age diversity
Median resident age - Males
Median resident age - Females
Median resident age - White
Median resident age - Black or African American
Median resident age - Asian
Median resident age - Hispanic or Latino
Median resident age - American Indian and Alaska Native
Median resident age - Multirace
Median resident age - Other Race
Median resident age - Males - White
Median resident age - Males - Black or African American
Median resident age - Males - Asian
Median resident age - Males - Hispanic or Latino
Median resident age - Males - American Indian and Alaska Native
Median resident age - Males - Multirace
Median resident age - Males - Other Race
Median resident age - Females - White
Median resident age - Females - Black or African American
Median resident age - Females - Asian
Median resident age - Females - Hispanic or Latino
Median resident age - Females - American Indian and Alaska Native
Median resident age - Females - Multirace
Median resident age - Females - Other Race
Commute - mean travel time to work (minutes)
Travel time to work - Less than 5 minutes (%)
Travel time to work - Less than 5 minutes (% change since 2000)
Travel time to work - 5 to 9 minutes (%)
Travel time to work - 5 to 9 minutes (% change since 2000)
Travel time to work - 10 to 19 minutes (%)
Travel time to work - 10 to 19 minutes (% change since 2000)
Travel time to work - 20 to 29 minutes (%)
Travel time to work - 20 to 29 minutes (% change since 2000)
Travel time to work - 30 to 39 minutes (%)
Travel time to work - 30 to 39 minutes (% change since 2000)
Travel time to work - 40 to 59 minutes (%)
Travel time to work - 40 to 59 minutes (% change since 2000)
Travel time to work - 60 to 89 minutes (%)
Travel time to work - 60 to 89 minutes (% change since 2000)
Travel time to work - 90 or more minutes (%)
Travel time to work - 90 or more minutes (% change since 2000)
Marital status - Never married (%)
Marital status - Now married (%)
Marital status - Separated (%)
Marital status - Widowed (%)
Marital status - Divorced (%)
Median family income ($)
Median family income (% change since 2000)
Median non-family income ($)
Median non-family income (% change since 2000)
Median per capita income ($)
Median per capita income (% change since 2000)
Median family income ($) - White
Median family income ($) - Black or African American
Median family income ($) - Asian
Median family income ($) - Hispanic or Latino
Median family income ($) - American Indian and Alaska Native
Median family income ($) - Multirace
Median family income ($) - Other Race
Median year house/condo built
Median year apartment built
Year house built - Built 2005 or later (%)
Year house built - Built 2000 to 2004 (%)
Year house built - Built 1990 to 1999 (%)
Year house built - Built 1980 to 1989 (%)
Year house built - Built 1970 to 1979 (%)
Year house built - Built 1960 to 1969 (%)
Year house built - Built 1950 to 1959 (%)
Year house built - Built 1940 to 1949 (%)
Year house built - Built 1939 or earlier (%)
Average household size
Household density (households per square mile)
Average household size - White
Average household size - Black or African American
Average household size - Asian
Average household size - Hispanic or Latino
Average household size - American Indian and Alaska Native
Average household size - Multirace
Average household size - Other Race
Occupied housing units (%)
Vacant housing units (%)
Owner occupied housing units (%)
Renter occupied housing units (%)
Vacancy status - For rent (%)
Vacancy status - For sale only (%)
Vacancy status - Rented or sold, not occupied (%)
Vacancy status - For seasonal, recreational, or occasional use (%)
Vacancy status - For migrant workers (%)
Vacancy status - Other vacant (%)
Residents with income below the poverty level (%)
Residents with income below 50% of the poverty level (%)
Children below poverty level (%)
Poor families by family type - Married-couple family (%)
Poor families by family type - Male, no wife present (%)
Poor families by family type - Female, no husband present (%)
Poverty status for native-born residents (%)
Poverty status for foreign-born residents (%)
Poverty among high school graduates not in families (%)
Poverty among people who did not graduate high school not in families (%)
Residents with income below the poverty level (%) - White
Residents with income below the poverty level (%) - Black or African American
Residents with income below the poverty level (%) - Asian
Residents with income below the poverty level (%) - Hispanic or Latino
Residents with income below the poverty level (%) - American Indian and Alaska Native
Residents with income below the poverty level (%) - Multirace
Residents with income below the poverty level (%) - Other Race
Air pollution - Air Quality Index (AQI)
Air pollution - CO
Air pollution - NO2
Air pollution - SO2
Air pollution - Ozone
Air pollution - PM10
Air pollution - PM25
Air pollution - Pb
Crime - Murders per 100,000 population
Crime - Rapes per 100,000 population
Crime - Robberies per 100,000 population
Crime - Assaults per 100,000 population
Crime - Burglaries per 100,000 population
Crime - Thefts per 100,000 population
Crime - Auto thefts per 100,000 population
Crime - Arson per 100,000 population
Crime - City-data.com crime index
Crime - Violent crime index
Crime - Property crime index
Crime - Murders per 100,000 population (5 year average)
Crime - Rapes per 100,000 population (5 year average)
Crime - Robberies per 100,000 population (5 year average)
Crime - Assaults per 100,000 population (5 year average)
Crime - Burglaries per 100,000 population (5 year average)
Crime - Thefts per 100,000 population (5 year average)
Crime - Auto thefts per 100,000 population (5 year average)
Crime - Arson per 100,000 population (5 year average)
Crime - City-data.com crime index (5 year average)
Crime - Violent crime index (5 year average)
Crime - Property crime index (5 year average)
1996 Presidential Elections Results (%) - Democratic Party (Clinton)
1996 Presidential Elections Results (%) - Republican Party (Dole)
1996 Presidential Elections Results (%) - Other
2000 Presidential Elections Results (%) - Democratic Party (Gore)
2000 Presidential Elections Results (%) - Republican Party (Bush)
2000 Presidential Elections Results (%) - Other
2004 Presidential Elections Results (%) - Democratic Party (Kerry)
2004 Presidential Elections Results (%) - Republican Party (Bush)
2004 Presidential Elections Results (%) - Other
2008 Presidential Elections Results (%) - Democratic Party (Obama)
2008 Presidential Elections Results (%) - Republican Party (McCain)
2008 Presidential Elections Results (%) - Other
2012 Presidential Elections Results (%) - Democratic Party (Obama)
2012 Presidential Elections Results (%) - Republican Party (Romney)
2012 Presidential Elections Results (%) - Other
2016 Presidential Elections Results (%) - Democratic Party (Clinton)
2016 Presidential Elections Results (%) - Republican Party (Trump)
2016 Presidential Elections Results (%) - Other
2020 Presidential Elections Results (%) - Democratic Party (Biden)
2020 Presidential Elections Results (%) - Republican Party (Trump)
2020 Presidential Elections Results (%) - Other
Ancestries Reported - Arab (%)
Ancestries Reported - Czech (%)
Ancestries Reported - Danish (%)
Ancestries Reported - Dutch (%)
Ancestries Reported - English (%)
Ancestries Reported - French (%)
Ancestries Reported - French Canadian (%)
Ancestries Reported - German (%)
Ancestries Reported - Greek (%)
Ancestries Reported - Hungarian (%)
Ancestries Reported - Irish (%)
Ancestries Reported - Italian (%)
Ancestries Reported - Lithuanian (%)
Ancestries Reported - Norwegian (%)
Ancestries Reported - Polish (%)
Ancestries Reported - Portuguese (%)
Ancestries Reported - Russian (%)
Ancestries Reported - Scotch-Irish (%)
Ancestries Reported - Scottish (%)
Ancestries Reported - Slovak (%)
Ancestries Reported - Subsaharan African (%)
Ancestries Reported - Swedish (%)
Ancestries Reported - Swiss (%)
Ancestries Reported - Ukrainian (%)
Ancestries Reported - United States (%)
Ancestries Reported - Welsh (%)
Ancestries Reported - West Indian (%)
Ancestries Reported - Other (%)
Educational Attainment - No schooling completed (%)
Educational Attainment - Less than high school (%)
Educational Attainment - High school or equivalent (%)
Educational Attainment - Less than 1 year of college (%)
Educational Attainment - 1 or more years of college (%)
Educational Attainment - Associate degree (%)
Educational Attainment - Bachelor's degree (%)
Educational Attainment - Master's degree (%)
Educational Attainment - Professional school degree (%)
Educational Attainment - Doctorate degree (%)
School Enrollment - Nursery, preschool (%)
School Enrollment - Kindergarten (%)
School Enrollment - Grade 1 to 4 (%)
School Enrollment - Grade 5 to 8 (%)
School Enrollment - Grade 9 to 12 (%)
School Enrollment - College undergrad (%)
School Enrollment - Graduate or professional (%)
School Enrollment - Not enrolled in school (%)
School enrollment - Public schools (%)
School enrollment - Private schools (%)
School enrollment - Not enrolled (%)
Median number of rooms in houses and condos
Median number of rooms in apartments
Housing units lacking complete plumbing facilities (%)
Housing units lacking complete kitchen facilities (%)
Density of houses
Urban houses (%)
Rural houses (%)
Households with people 60 years and over (%)
Households with people 65 years and over (%)
Households with people 75 years and over (%)
Households with one or more nonrelatives (%)
Households with no nonrelatives (%)
Population in households (%)
Family households (%)
Nonfamily households (%)
Population in families (%)
Family households with own children (%)
Median number of bedrooms in owner occupied houses
Mean number of bedrooms in owner occupied houses
Median number of bedrooms in renter occupied houses
Mean number of bedrooms in renter occupied houses
Median number of vehichles in owner occupied houses
Mean number of vehichles in owner occupied houses
Median number of vehichles in renter occupied houses
Mean number of vehichles in renter occupied houses
Mortgage status - with mortgage (%)
Mortgage status - with second mortgage (%)
Mortgage status - with home equity loan (%)
Mortgage status - with both second mortgage and home equity loan (%)
Mortgage status - without a mortgage (%)
Average family size
Average family size - White
Average family size - Black or African American
Average family size - Asian
Average family size - Hispanic or Latino
Average family size - American Indian and Alaska Native
Average family size - Multirace
Average family size - Other Race
Geographical mobility - Same house 1 year ago (%)
Geographical mobility - Moved within same county (%)
Geographical mobility - Moved from different county within same state (%)
Geographical mobility - Moved from different state (%)
Geographical mobility - Moved from abroad (%)
Place of birth - Born in state of residence (%)
Place of birth - Born in other state (%)
Place of birth - Native, outside of US (%)
Place of birth - Foreign born (%)
Housing units in structures - 1, detached (%)
Housing units in structures - 1, attached (%)
Housing units in structures - 2 (%)
Housing units in structures - 3 or 4 (%)
Housing units in structures - 5 to 9 (%)
Housing units in structures - 10 to 19 (%)
Housing units in structures - 20 to 49 (%)
Housing units in structures - 50 or more (%)
Housing units in structures - Mobile home (%)
Housing units in structures - Boat, RV, van, etc. (%)
House/condo owner moved in on average (years ago)
Renter moved in on average (years ago)
Year householder moved into unit - Moved in 1999 to March 2000 (%)
Year householder moved into unit - Moved in 1995 to 1998 (%)
Year householder moved into unit - Moved in 1990 to 1994 (%)
Year householder moved into unit - Moved in 1980 to 1989 (%)
Year householder moved into unit - Moved in 1970 to 1979 (%)
Year householder moved into unit - Moved in 1969 or earlier (%)
Means of transportation to work - Drove car alone (%)
Means of transportation to work - Carpooled (%)
Means of transportation to work - Public transportation (%)
Means of transportation to work - Bus or trolley bus (%)
Means of transportation to work - Streetcar or trolley car (%)
Means of transportation to work - Subway or elevated (%)
Means of transportation to work - Railroad (%)
Means of transportation to work - Ferryboat (%)
Means of transportation to work - Taxicab (%)
Means of transportation to work - Motorcycle (%)
Means of transportation to work - Bicycle (%)
Means of transportation to work - Walked (%)
Means of transportation to work - Other means (%)
Working at home (%)
Industry diversity
Most Common Industries - Agriculture, forestry, fishing and hunting, and mining (%)
Most Common Industries - Agriculture, forestry, fishing and hunting (%)
Most Common Industries - Mining, quarrying, and oil and gas extraction (%)
Most Common Industries - Construction (%)
Most Common Industries - Manufacturing (%)
Most Common Industries - Wholesale trade (%)
Most Common Industries - Retail trade (%)
Most Common Industries - Transportation and warehousing, and utilities (%)
Most Common Industries - Transportation and warehousing (%)
Most Common Industries - Utilities (%)
Most Common Industries - Information (%)
Most Common Industries - Finance and insurance, and real estate and rental and leasing (%)
Most Common Industries - Finance and insurance (%)
Most Common Industries - Real estate and rental and leasing (%)
Most Common Industries - Professional, scientific, and management, and administrative and waste management services (%)
Most Common Industries - Professional, scientific, and technical services (%)
Most Common Industries - Management of companies and enterprises (%)
Most Common Industries - Administrative and support and waste management services (%)
Most Common Industries - Educational services, and health care and social assistance (%)
Most Common Industries - Educational services (%)
Most Common Industries - Health care and social assistance (%)
Most Common Industries - Arts, entertainment, and recreation, and accommodation and food services (%)
Most Common Industries - Arts, entertainment, and recreation (%)
Most Common Industries - Accommodation and food services (%)
Most Common Industries - Other services, except public administration (%)
Most Common Industries - Public administration (%)
Occupation diversity
Most Common Occupations - Management, business, science, and arts occupations (%)
Most Common Occupations - Management, business, and financial occupations (%)
Most Common Occupations - Management occupations (%)
Most Common Occupations - Business and financial operations occupations (%)
Most Common Occupations - Computer, engineering, and science occupations (%)
Most Common Occupations - Computer and mathematical occupations (%)
Most Common Occupations - Architecture and engineering occupations (%)
Most Common Occupations - Life, physical, and social science occupations (%)
Most Common Occupations - Education, legal, community service, arts, and media occupations (%)
Most Common Occupations - Community and social service occupations (%)
Most Common Occupations - Legal occupations (%)
Most Common Occupations - Education, training, and library occupations (%)
Most Common Occupations - Arts, design, entertainment, sports, and media occupations (%)
Most Common Occupations - Healthcare practitioners and technical occupations (%)
Most Common Occupations - Health diagnosing and treating practitioners and other technical occupations (%)
Most Common Occupations - Health technologists and technicians (%)
Most Common Occupations - Service occupations (%)
Most Common Occupations - Healthcare support occupations (%)
Most Common Occupations - Protective service occupations (%)
Most Common Occupations - Fire fighting and prevention, and other protective service workers including supervisors (%)
Most Common Occupations - Law enforcement workers including supervisors (%)
Most Common Occupations - Food preparation and serving related occupations (%)
Most Common Occupations - Building and grounds cleaning and maintenance occupations (%)
Most Common Occupations - Personal care and service occupations (%)
Most Common Occupations - Sales and office occupations (%)
Most Common Occupations - Sales and related occupations (%)
Most Common Occupations - Office and administrative support occupations (%)
Most Common Occupations - Natural resources, construction, and maintenance occupations (%)
Most Common Occupations - Farming, fishing, and forestry occupations (%)
Most Common Occupations - Construction and extraction occupations (%)
Most Common Occupations - Installation, maintenance, and repair occupations (%)
Most Common Occupations - Production, transportation, and material moving occupations (%)
Most Common Occupations - Production occupations (%)
Most Common Occupations - Transportation occupations (%)
Most Common Occupations - Material moving occupations (%)
People in Group quarters - Institutionalized population (%)
People in Group quarters - Correctional institutions (%)
People in Group quarters - Federal prisons and detention centers (%)
People in Group quarters - Halfway houses (%)
People in Group quarters - Local jails and other confinement facilities (including police lockups) (%)
People in Group quarters - Military disciplinary barracks (%)
People in Group quarters - State prisons (%)
People in Group quarters - Other types of correctional institutions (%)
People in Group quarters - Nursing homes (%)
People in Group quarters - Hospitals/wards, hospices, and schools for the handicapped (%)
People in Group quarters - Hospitals/wards and hospices for chronically ill (%)
People in Group quarters - Hospices or homes for chronically ill (%)
People in Group quarters - Military hospitals or wards for chronically ill (%)
People in Group quarters - Other hospitals or wards for chronically ill (%)
People in Group quarters - Hospitals or wards for drug/alcohol abuse (%)
People in Group quarters - Mental (Psychiatric) hospitals or wards (%)
People in Group quarters - Schools, hospitals, or wards for the mentally retarded (%)
People in Group quarters - Schools, hospitals, or wards for the physically handicapped (%)
People in Group quarters - Institutions for the deaf (%)
People in Group quarters - Institutions for the blind (%)
People in Group quarters - Orthopedic wards and institutions for the physically handicapped (%)
People in Group quarters - Wards in general hospitals for patients who have no usual home elsewhere (%)
People in Group quarters - Wards in military hospitals for patients who have no usual home elsewhere (%)
People in Group quarters - Juvenile institutions (%)
People in Group quarters - Long-term care (%)
People in Group quarters - Homes for abused, dependent, and neglected children (%)
People in Group quarters - Residential treatment centers for emotionally disturbed children (%)
People in Group quarters - Training schools for juvenile delinquents (%)
People in Group quarters - Short-term care, detention or diagnostic centers for delinquent children (%)
People in Group quarters - Type of juvenile institution unknown (%)
People in Group quarters - Noninstitutionalized population (%)
People in Group quarters - College dormitories (includes college quarters off campus) (%)
People in Group quarters - Military quarters (%)
People in Group quarters - On base (%)
People in Group quarters - Barracks, unaccompanied personnel housing (UPH), (Enlisted/Officer), ;and similar group living quarters for military personnel (%)
People in Group quarters - Transient quarters for temporary residents (%)
People in Group quarters - Military ships (%)
People in Group quarters - Group homes (%)
People in Group quarters - Homes or halfway houses for drug/alcohol abuse (%)
People in Group quarters - Homes for the mentally ill (%)
People in Group quarters - Homes for the mentally retarded (%)
People in Group quarters - Homes for the physically handicapped (%)
People in Group quarters - Other group homes (%)
People in Group quarters - Religious group quarters (%)
People in Group quarters - Dormitories (%)
People in Group quarters - Agriculture workers' dormitories on farms (%)
People in Group quarters - Job Corps and vocational training facilities (%)
People in Group quarters - Other workers' dormitories (%)
People in Group quarters - Crews of maritime vessels (%)
People in Group quarters - Other nonhousehold living situations (%)
People in Group quarters - Other noninstitutional group quarters (%)
Residents speaking English at home (%)
Residents speaking English at home - Born in the United States (%)
Residents speaking English at home - Native, born elsewhere (%)
Residents speaking English at home - Foreign born (%)
Residents speaking Spanish at home (%)
Residents speaking Spanish at home - Born in the United States (%)
Residents speaking Spanish at home - Native, born elsewhere (%)
Residents speaking Spanish at home - Foreign born (%)
Residents speaking other language at home (%)
Residents speaking other language at home - Born in the United States (%)
Residents speaking other language at home - Native, born elsewhere (%)
Residents speaking other language at home - Foreign born (%)
Class of Workers - Employee of private company (%)
Class of Workers - Self-employed in own incorporated business (%)
Class of Workers - Private not-for-profit wage and salary workers (%)
Class of Workers - Local government workers (%)
Class of Workers - State government workers (%)
Class of Workers - Federal government workers (%)
Class of Workers - Self-employed workers in own not incorporated business and Unpaid family workers (%)
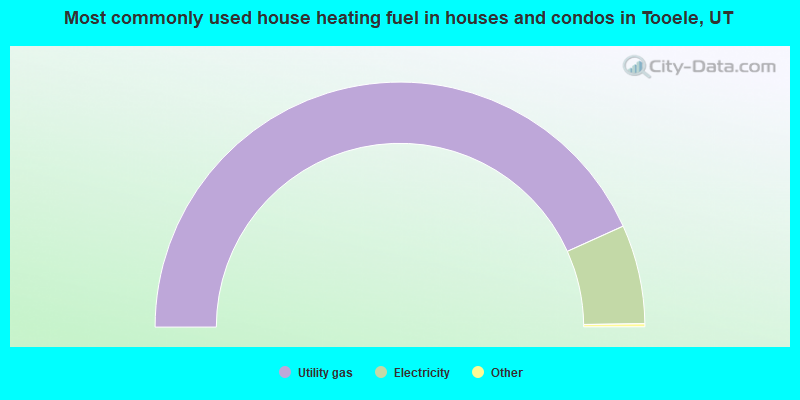
House heating fuel used in houses and condos - Utility gas (%)
House heating fuel used in houses and condos - Bottled, tank, or LP gas (%)
House heating fuel used in houses and condos - Electricity (%)
House heating fuel used in houses and condos - Fuel oil, kerosene, etc. (%)
House heating fuel used in houses and condos - Coal or coke (%)
House heating fuel used in houses and condos - Wood (%)
House heating fuel used in houses and condos - Solar energy (%)
House heating fuel used in houses and condos - Other fuel (%)
House heating fuel used in houses and condos - No fuel used (%)
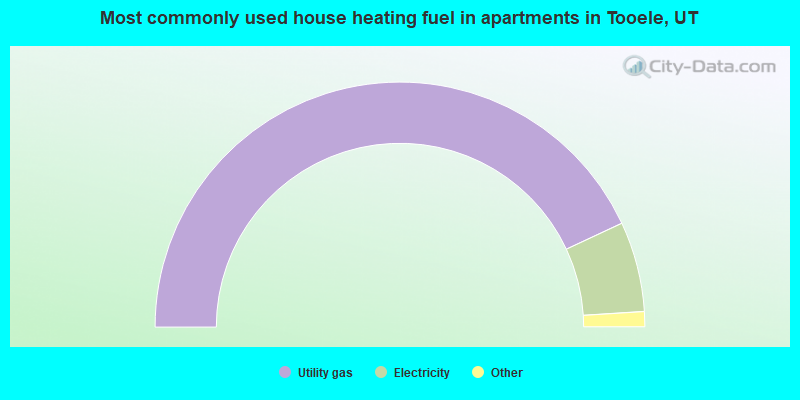
House heating fuel used in apartments - Utility gas (%)
House heating fuel used in apartments - Bottled, tank, or LP gas (%)
House heating fuel used in apartments - Electricity (%)
House heating fuel used in apartments - Fuel oil, kerosene, etc. (%)
House heating fuel used in apartments - Coal or coke (%)
House heating fuel used in apartments - Wood (%)
House heating fuel used in apartments - Solar energy (%)
House heating fuel used in apartments - Other fuel (%)
House heating fuel used in apartments - No fuel used (%)
Armed forces status - In Armed Forces (%)
Armed forces status - Civilian (%)
Armed forces status - Civilian - Veteran (%)
Armed forces status - Civilian - Nonveteran (%)
Fatal accidents locations in years 2005-2021
Fatal accidents locations in 2005
Fatal accidents locations in 2006
Fatal accidents locations in 2007
Fatal accidents locations in 2008
Fatal accidents locations in 2009
Fatal accidents locations in 2010
Fatal accidents locations in 2011
Fatal accidents locations in 2012
Fatal accidents locations in 2013
Fatal accidents locations in 2014
Fatal accidents locations in 2015
Fatal accidents locations in 2016
Fatal accidents locations in 2017
Fatal accidents locations in 2018
Fatal accidents locations in 2019
Fatal accidents locations in 2020
Fatal accidents locations in 2021
Alcohol use - People drinking some alcohol every month (%)
Alcohol use - People not drinking at all (%)
Alcohol use - Average days/month drinking alcohol
Alcohol use - Average drinks/week
Alcohol use - Average days/year people drink much
Audiometry - Average condition of hearing (%)
Audiometry - People that can hear a whisper from across a quiet room (%)
Audiometry - People that can hear normal voice from across a quiet room (%)
Audiometry - Ears ringing, roaring, buzzing (%)
Audiometry - Had a job exposure to loud noise (%)
Audiometry - Had off-work exposure to loud noise (%)
Blood Pressure & Cholesterol - Has high blood pressure (%)
Blood Pressure & Cholesterol - Checking blood pressure at home (%)
Blood Pressure & Cholesterol - Frequently checking blood cholesterol (%)
Blood Pressure & Cholesterol - Has high cholesterol level (%)
Consumer Behavior - Money monthly spent on food at supermarket/grocery store
Consumer Behavior - Money monthly spent on food at other stores
Consumer Behavior - Money monthly spent on eating out
Consumer Behavior - Money monthly spent on carryout/delivered foods
Consumer Behavior - Income spent on food at supermarket/grocery store (%)
Consumer Behavior - Income spent on food at other stores (%)
Consumer Behavior - Income spent on eating out (%)
Consumer Behavior - Income spent on carryout/delivered foods (%)
Current Health Status - General health condition (%)
Current Health Status - Blood donors (%)
Current Health Status - Has blood ever tested for HIV virus (%)
Current Health Status - Left-handed people (%)
Dermatology - People using sunscreen (%)
Diabetes - Diabetics (%)
Diabetes - Had a blood test for high blood sugar (%)
Diabetes - People taking insulin (%)
Diet Behavior & Nutrition - Diet health (%)
Diet Behavior & Nutrition - Milk product consumption (# of products/month)
Diet Behavior & Nutrition - Meals not home prepared (#/week)
Diet Behavior & Nutrition - Meals from fast food or pizza place (#/week)
Diet Behavior & Nutrition - Ready-to-eat foods (#/month)
Diet Behavior & Nutrition - Frozen meals/pizza (#/month)
Drug Use - People that ever used marijuana or hashish (%)
Drug Use - Ever used hard drugs (%)
Drug Use - Ever used any form of cocaine (%)
Drug Use - Ever used heroin (%)
Drug Use - Ever used methamphetamine (%)
Health Insurance - People covered by health insurance (%)
Kidney Conditions-Urology - Avg. # of times urinating at night
Medical Conditions - People with asthma (%)
Medical Conditions - People with anemia (%)
Medical Conditions - People with psoriasis (%)
Medical Conditions - People with overweight (%)
Medical Conditions - Elderly people having difficulties in thinking or remembering (%)
Medical Conditions - People who ever received blood transfusion (%)
Medical Conditions - People having trouble seeing even with glass/contacts (%)
Medical Conditions - People with arthritis (%)
Medical Conditions - People with gout (%)
Medical Conditions - People with congestive heart failure (%)
Medical Conditions - People with coronary heart disease (%)
Medical Conditions - People with angina pectoris (%)
Medical Conditions - People who ever had heart attack (%)
Medical Conditions - People who ever had stroke (%)
Medical Conditions - People with emphysema (%)
Medical Conditions - People with thyroid problem (%)
Medical Conditions - People with chronic bronchitis (%)
Medical Conditions - People with any liver condition (%)
Medical Conditions - People who ever had cancer or malignancy (%)
Mental Health - People who have little interest in doing things (%)
Mental Health - People feeling down, depressed, or hopeless (%)
Mental Health - People who have trouble sleeping or sleeping too much (%)
Mental Health - People feeling tired or having little energy (%)
Mental Health - People with poor appetite or overeating (%)
Mental Health - People feeling bad about themself (%)
Mental Health - People who have trouble concentrating on things (%)
Mental Health - People moving or speaking slowly or too fast (%)
Mental Health - People having thoughts they would be better off dead (%)
Oral Health - Average years since last visit a dentist
Oral Health - People embarrassed because of mouth (%)
Oral Health - People with gum disease (%)
Oral Health - General health of teeth and gums (%)
Oral Health - Average days a week using dental floss/device
Oral Health - Average days a week using mouthwash for dental problem
Oral Health - Average number of teeth
Pesticide Use - Households using pesticides to control insects (%)
Pesticide Use - Households using pesticides to kill weeds (%)
Physical Activity - People doing vigorous-intensity work activities (%)
Physical Activity - People doing moderate-intensity work activities (%)
Physical Activity - People walking or bicycling (%)
Physical Activity - People doing vigorous-intensity recreational activities (%)
Physical Activity - People doing moderate-intensity recreational activities (%)
Physical Activity - Average hours a day doing sedentary activities
Physical Activity - Average hours a day watching TV or videos
Physical Activity - Average hours a day using computer
Physical Functioning - People having limitations keeping them from working (%)
Physical Functioning - People limited in amount of work they can do (%)
Physical Functioning - People that need special equipment to walk (%)
Physical Functioning - People experiencing confusion/memory problems (%)
Physical Functioning - People requiring special healthcare equipment (%)
Prescription Medications - Average number of prescription medicines taking
Preventive Aspirin Use - Adults 40+ taking low-dose aspirin (%)
Reproductive Health - Vaginal deliveries (%)
Reproductive Health - Cesarean deliveries (%)
Reproductive Health - Deliveries resulted in a live birth (%)
Reproductive Health - Pregnancies resulted in a delivery (%)
Reproductive Health - Women breastfeeding newborns (%)
Reproductive Health - Women that had a hysterectomy (%)
Reproductive Health - Women that had both ovaries removed (%)
Reproductive Health - Women that have ever taken birth control pills (%)
Reproductive Health - Women taking birth control pills (%)
Reproductive Health - Women that have ever used Depo-Provera or injectables (%)
Reproductive Health - Women that have ever used female hormones (%)
Sexual Behavior - People 18+ that ever had sex (vaginal, anal, or oral) (%)
Sexual Behavior - Males 18+ that ever had vaginal sex with a woman (%)
Sexual Behavior - Males 18+ that ever performed oral sex on a woman (%)
Sexual Behavior - Males 18+ that ever had anal sex with a woman (%)
Sexual Behavior - Males 18+ that ever had any sex with a man (%)
Sexual Behavior - Females 18+ that ever had vaginal sex with a man (%)
Sexual Behavior - Females 18+ that ever performed oral sex on a man (%)
Sexual Behavior - Females 18+ that ever had anal sex with a man (%)
Sexual Behavior - Females 18+ that ever had any kind of sex with a woman (%)
Sexual Behavior - Average age people first had sex
Sexual Behavior - Average number of female sex partners in lifetime (males 18+)
Sexual Behavior - Average number of female vaginal sex partners in lifetime (males 18+)
Sexual Behavior - Average age people first performed oral sex on a woman (18+)
Sexual Behavior - Average number of woman performed oral sex on in lifetime (18+)
Sexual Behavior - Average number of male sex partners in lifetime (males 18+)
Sexual Behavior - Average number of male anal sex partners in lifetime (males 18+)
Sexual Behavior - Average age people first performed oral sex on a man (18+)
Sexual Behavior - Average number of male oral sex partners in lifetime (18+)
Sexual Behavior - People using protection when performing oral sex (%)
Sexual Behavior - Average number of times people have vaginal or anal sex a year
Sexual Behavior - People having sex without condom (%)
Sexual Behavior - Average number of male sex partners in lifetime (females 18+)
Sexual Behavior - Average number of male vaginal sex partners in lifetime (females 18+)
Sexual Behavior - Average number of female sex partners in lifetime (females 18+)
Sexual Behavior - Circumcised males 18+ (%)
Sleep Disorders - Average hours sleeping at night
Sleep Disorders - People that has trouble sleeping (%)
Smoking-Cigarette Use - People smoking cigarettes (%)
Taste & Smell - People 40+ having problems with smell (%)
Taste & Smell - People 40+ having problems with taste (%)
Taste & Smell - People 40+ that ever had wisdom teeth removed (%)
Taste & Smell - People 40+ that ever had tonsils teeth removed (%)
Taste & Smell - People 40+ that ever had a loss of consciousness because of a head injury (%)
Taste & Smell - People 40+ that ever had a broken nose or other serious injury to face or skull (%)
Taste & Smell - People 40+ that ever had two or more sinus infections (%)
Weight - Average height (inches)
Weight - Average weight (pounds)
Weight - Average BMI
Weight - People that are obese (%)
Weight - People that ever were obese (%)
Weight - People trying to lose weight (%)
According to our research of Utah and other state lists, there were 109 registered sex offenders living in Tooele, Utah as of April 27, 2024 . The ratio of all residents to sex offenders in Tooele is 311 to 1.The ratio of registered sex offenders to all residents in this city is near the state average.
Officers per 1,000 residents here:
1.04Utah average:
1.67
Latest news from Tooele, UT collected exclusively by city-data.com from local newspapers, TV, and radio stations
Ancestries: English (22.9%), American (9.6%), European (6.7%), German (5.9%), Norwegian (2.2%), Irish (2.1%).
Current Local Time:
Incorporated on 06/19/1853
Land area: 21.1 square miles.
Population density: 1,825 people per square mile (low).
1,380 residents are foreign born (2.3% Latin America , 0.7% Europe , 0.4% Asia ).
Median real estate property taxes paid for housing units with mortgages in 2022: $2,185 (0.6%)Median real estate property taxes paid for housing units with no mortgage in 2022: $2,036 (0.5%)
Nearest city with pop. 50,000+: West Jordan, UT
Nearest city with pop. 200,000+: Las Vegas, NV
Nearest city with pop. 1,000,000+: Phoenix, AZ
Nearest cities:
Ophir, UT (3.4 miles),
Latitude: 40.54 N, Longitude: 112.30 W
Daytime population change due to commuting: -5,749 (-14.7%)Workers who live and work in this city: 9,423 (48.5%)
Single-family new house construction building permits:
2022: 256 buildings , average cost: $249,9002021: 448 buildings , average cost: $238,1002020: 288 buildings , average cost: $245,3002019: 163 buildings , average cost: $186,8002018: 146 buildings , average cost: $145,7002017: 90 buildings , average cost: $159,9002016: 129 buildings , average cost: $134,8002015: 91 buildings , average cost: $141,8002014: 85 buildings , average cost: $146,3002013: 69 buildings , average cost: $162,2002012: 62 buildings , average cost: $139,9002011: 22 buildings , average cost: $145,1002010: 41 buildings , average cost: $132,5002009: 62 buildings , average cost: $143,2002008: 78 buildings , average cost: $155,9002007: 150 buildings , average cost: $143,9002006: 236 buildings , average cost: $146,9002005: 186 buildings , average cost: $139,1002004: 185 buildings , average cost: $136,0002003: 175 buildings , average cost: $120,0002002: 257 buildings , average cost: $107,2002001: 370 buildings , average cost: $114,1002000: 508 buildings , average cost: $106,6001999: 724 buildings , average cost: $107,3001998: 621 buildings , average cost: $97,8001997: 305 buildings , average cost: $79,200Unemployment in December 2023:
Population change in the 1990s: +8,523 (+61.0%).
Most common occupations in Tooele, UT (%)
Both Males Females
Other production occupations, including supervisors (4.6%)
Customer service representatives (4.5%)
Other office and administrative support workers, including supervisors (4.0%)
Building and grounds cleaning and maintenance occupations (3.8%)
Electrical equipment mechanics and other installation, maintenance, and repair workers, including supervisors (3.8%)
Material recording, scheduling, dispatching, and distributing workers (3.4%)
Other sales and related occupations, including supervisors (3.3%)
Electrical equipment mechanics and other installation, maintenance, and repair workers, including supervisors (6.4%)
Other production occupations, including supervisors (5.9%)
Construction traders workers except carpenters, electricians, painters, plumbers, and construction laborers (4.5%)
Building and grounds cleaning and maintenance occupations (4.2%)
Driver/sales workers and truck drivers (4.1%)
Laborers and material movers, hand (3.9%)
Vehicle and mobile equipment mechanics, installers, and repairers (3.8%)
Customer service representatives (7.6%)
Other office and administrative support workers, including supervisors (6.6%)
Secretaries and administrative assistants (6.6%)
Information and record clerks, except customer service representatives (6.0%)
Child care workers (4.6%)
Preschool, kindergarten, elementary, and middle school teachers (4.5%)
Material recording, scheduling, dispatching, and distributing workers (3.8%)
Earthquake activity:
Tooele-area historical earthquake activity is significantly above Utah state average. It is 2310% greater than the overall U.S. average. On 8/18/1959 at 06:37:13, a magnitude 7.7 (7.7 UK, Class: Major, Intensity: VIII - XII) earthquake occurred 291.0 miles away from Tooele center, causing $26,000,000 total damage On 10/3/1915 at 06:52:48, a magnitude 7.6 (7.6 UK) earthquake occurred 273.5 miles away from Tooele center On 10/28/1983 at 14:06:06, a magnitude 7.3 (6.2 MB, 7.3 MS, 7.0 MW) earthquake occurred 256.7 miles away from the city center, causing 2 deaths ( 2 shaking deaths) and 3 injuries, causing $15,000,000 total damage On 3/28/1975 at 02:31:05, a magnitude 6.2 (6.1 MB, 6.0 MS, 6.2 ML, Class: Strong, Intensity: VII - IX) earthquake occurred 102.5 miles away from Tooele center On 12/21/1932 at 06:10:09, a magnitude 7.2 (7.2 UK) earthquake occurred 339.0 miles away from Tooele center On 3/18/2020 at 13:09:31, a magnitude 5.7 (5.7 MW, Depth: 7.4 mi, Class: Moderate, Intensity: VI - VII) earthquake occurred 18.8 miles away from Tooele center Magnitude types: body-wave magnitude (MB), local magnitude (ML), surface-wave magnitude (MS), moment magnitude (MW) Natural disasters: The number of natural disasters in Tooele County (7) is smaller than the US average (15).Major Disasters (Presidential) Declared: 4Emergencies Declared: 2Floods: 4, Landslides: 3, Storms: 2, Drought: 1, Hurricane: 1, Mudslide: 1, Other: 1 (Note: some incidents may be assigned to more than one category). Hospitals and medical centers in Tooele: MOUNTAIN WEST MEDICAL CENTER (Proprietary, 2055 NORTH MAIN STREET) ROCKY MOUNTAIN CARE - TOOELE (140 EAST 200 SOUTH)
TOOELE VALLEY DIALYSIS CENTER (196 E 2000 N STE 112)
MOUNTAIN WEST HOME HEALTH (1887 NORTH AARON DRIVE, SUITE D)
College/University in Tooele: Tooele Applied Technology College Full-time enrollment: 98; Location: 88 South Tooele Blvd.; Public; Website: www.tatc.edu)
Colleges/universities with over 2000 students nearest to Tooele:
Salt Lake Community College (about 21 miles; Salt Lake City, UT ; Full-time enrollment: 20,797)
Stevens-Henager College-Murray (about 23 miles; Murray, UT ; FT enrollment: 6,395)
Western Governors University (about 25 miles; Salt Lake City, UT ; FT enrollment: 31,481)
Latter-day Saints Business College (about 27 miles; Salt Lake City, UT ; FT enrollment: 2,059)
Westminster College (about 27 miles; Salt Lake City, UT ; FT enrollment: 2,870)
University of Utah (about 29 miles; Salt Lake City, UT ; FT enrollment: 28,454)
Utah Valley University (about 36 miles; Orem, UT ; FT enrollment: 24,403)
Public high schools in Tooele: TOOELE HIGH Students: 1,329, Location: 301 W VINE, Grades: 9-12)EXCELSIOR ACADEMY Location: 124 E ERDA WAY, Grades: KG-9, Charter school )
BLUE PEAK HIGH Location: 211 S TOOELE BLVD, Grades: 10-12)
TOOELE COMMUNITY LEARNING CENTER Location: 211 S TOOELE BLVD, Grades: 9-12)
Biggest public elementary/middle schools in Tooele: CLARKE N JOHNSEN JR HIGH Students: 846, Location: 2152 N 400 W, Grades: 7-8)TOOELE JR HIGH Students: 693, Location: 411 W VINE ST, Grades: 7-8)SETTLEMENT CANYON SCHOOL Students: 692, Location: 935 WEST TIMPIE ROAD, Grades: KG-6)COPPER CANYON SCHOOL Students: 600, Location: 1600 N BROADWAY, Grades: PK-6)OVERLAKE SCHOOL Students: 572, Location: 2052 N 170 W, Grades: KG-6)NORTHLAKE SCHOOL Students: 561, Location: 268 N COLEMAN, Grades: KG-6)EAST SCHOOL Students: 544, Location: 135 S 7TH STREET, Grades: KG-6)MIDDLE CANYON SCHOOL Students: 527, Location: 751 E 1000 N, Grades: KG-6)WEST SCHOOL Students: 424, Location: 451 W 300 S, Grades: KG-6)HARRIS SCHOOL Location: 251 N 1ST ST, Grades: KG-6)
Private elementary/middle school in Tooele: ST MARGUERITE'S CATHOLIC SCHOOL Students: 172, Location: 510 E VINE ST, Grades: PK-8)
See full list of schools located in Tooele Library in Tooele: TOOELE CITY PUBLIC LIBRARY Operating income: $585,576; Location: 128 WEST VINE STREET; 57,919 books ; 4,447 audio materials ; 1,733 video materials ; 2 local licensed databases ; 39 state licensed databases ; 48 print serial subscriptions )
User-submitted facts and corrections:
New Elem. School: Middle Canyon Elem. 751 E. 1000 N. Tooele Ut. 84074 Ph.# 435-833-1906 call for info.
Notable locations in Tooele: (A) , Mountain View Ambulance (B) , Tooele City Fire Department Station 2 (C) , Tooele City Fire Department Station 1 (D) . Display/hide their locations on the map
Churches in Tooele include: (A) , Church of Christ (B) , First Assembly of God Church (C) , First Baptist Church (D) , First Lutheran Church (E) , Independent Baptist Church (F) , Jehovahs Witnesses Tooele Congregation (G) , Saint Barnabas Episcopal Church (H) , Saint Marguerites Catholic Church (I) . Display/hide their locations on the map
Cemetery: (1) . Display/hide its location on the map
Reservoir: (A) . Display/hide its location on the map
Parks in Tooele include: (1) , Liberty Park (2) , Plat C Park (3) . Display/hide their locations on the map
Tourist attractions:
Hotels:
Courts:
Birthplace of: Eugene E. Campbell - Utah historian, Loren C. Dunn - Latter Day Saint writer, Amy Palmer - Athletics competitor, Joseph W. McMurrin - Mormon missionary, Robert Boyd Brazier - Soilder, Ron Rydalch - Football player.
Tooele County has a predicted average indoor radon screening level between 2 and 4 pCi/L (pico curies per liter) - Moderate Potential Drinking water stations with addresses in Tooele and their reported violations in the past:
TOOELE CITY WATER SYSTEM (Population served: 32,937, Groundwater):
Past health violations:
MCL, Monthly (TCR) - In SEP-2005, Contaminant: Coliform. Follow-up actions: St Violation/Reminder Notice (2 times from NOV-10-2005 to NOV-10-2005), St Compliance achieved (JAN-01-2008)
Past monitoring violations:
Follow-up Or Routine LCR Tap M/R - In OCT-01-2010, Contaminant: Lead and Copper Rule. Follow-up actions: St Public Notif requested (FEB-17-2011), St Formal NOV issued (FEB-17-2011), St Compliance achieved (JUN-08-2011)
176 regular monitoring violations
Population served: 541, Groundwater):
Past monitoring violations:
Follow-up Or Routine LCR Tap M/R - In OCT-01-2012, Contaminant: Lead and Copper Rule. Follow-up actions: St Compliance achieved (AUG-25-2011), St Public Notif requested (JAN-28-2013), St Formal NOV issued (JAN-28-2013)
Follow-up Or Routine LCR Tap M/R - In OCT-01-2011, Contaminant: Lead and Copper Rule. Follow-up actions: St Compliance achieved (AUG-25-2011), St Public Notif requested (OCT-28-2012), St Formal NOV issued (OCT-28-2012)
One regular monitoring violation
Population served: 470, Groundwater):
Past monitoring violations:
Monitoring and Reporting (DBP) - Between JAN-2008 and DEC-2008, Contaminant: TTHM. Follow-up actions: St Compliance achieved (MAY-13-2009)
Initial Tap Sampling for Pb and Cu - In JUL-01-1998, Contaminant: Lead and Copper Rule. Follow-up actions: St Compliance achieved (JUN-30-1996), St Hook-up/Extension Ban (OCT-23-1996)
Initial Tap Sampling for Pb and Cu - In JUL-01-1997, Contaminant: Lead and Copper Rule. Follow-up actions: St Compliance achieved (JUN-30-1996), St Hook-up/Extension Ban (OCT-23-1996)
Initial Tap Sampling for Pb and Cu - In JAN-01-1997, Contaminant: Lead and Copper Rule. Follow-up actions: St Compliance achieved (JUN-30-1996), St Hook-up/Extension Ban (OCT-23-1996)
Initial Tap Sampling for Pb and Cu - In JUL-01-1996, Contaminant: Lead and Copper Rule. Follow-up actions: St Compliance achieved (JUN-30-1996), St Hook-up/Extension Ban (OCT-23-1996)
90 regular monitoring violations
Population served: 449, Groundwater):
Past monitoring violations:
Monitoring, Source Water (GWR) - In JUL-01-2010, Contaminant: E. COLI. Follow-up actions: St Formal NOV issued (DEC-23-2010), St Public Notif requested (DEC-23-2010)
Population served: 80, Groundwater):
Past health violations:
MCL, Monthly (TCR) - In JUL-2007, Contaminant: Coliform. Follow-up actions: St Violation/Reminder Notice (AUG-28-2007), St Public Notif requested (AUG-28-2007), St Compliance achieved (JAN-01-2008)
Past monitoring violations:
Monitoring, Repeat Major (TCR) - In MAY-2008, Contaminant: Coliform (TCR). Follow-up actions: St Compliance achieved (JAN-01-2010)
Follow-up Or Routine LCR Tap M/R - In OCT-01-2007, Contaminant: Lead and Copper Rule. Follow-up actions: St Compliance achieved (FEB-10-2011)
5 routine major monitoring violations
7 minor monitoring violations
2 regular monitoring violations
Population served: 38, Groundwater):
Past health violations:
MCL, Monthly (TCR) - In AUG-2005, Contaminant: Coliform. Follow-up actions: St Violation/Reminder Notice (4 times from NOV-10-2005 to NOV-10-2005), St Compliance achieved (JAN-01-2008)
Past monitoring violations:
Failure To Address Deficiency - In APR-02-2010, Contaminant: GROUNDWATER RULE. Follow-up actions: St Formal NOV issued (3 times from APR-18-2012 to APR-18-2012), St Public Notif requested (3 times from APR-18-2012 to APR-18-2013)
4 routine major monitoring violations
2 regular monitoring violations
Population served: 25, Groundwater):
Past monitoring violations:
2 routine major monitoring violations
3 regular monitoring violations
Population served: 25, Groundwater):
Past monitoring violations:
Failure To Address Deficiency - In APR-02-2010, Contaminant: GROUNDWATER RULE
One regular monitoring violation
Drinking water stations with addresses in Tooele that have no violations reported:
MOTOR VU THEATRE (Population served: 700, Primary Water Source Type: Groundwater)
Average household size: This city:
3.1 peopleUtah:
3.1 people
Percentage of family households: This city:
77.8%Whole state:
75.2%
Percentage of households with unmarried partners: This city:
5.8%Whole state:
4.6%
Likely homosexual households (counted as self-reported same-sex unmarried-partner households)
Lesbian couples: 0.3% of all households Gay men: 0.2% of all households
People in group quarters in Tooele in 2010:
134 people in local jails and other municipal confinement facilities
103 people in nursing facilities/skilled-nursing facilities
6 people in other noninstitutional facilities
People in group quarters in Tooele in 2000:
150 people in military barracks, etc.
90 people in local jails and other confinement facilities (including police lockups)
53 people in nursing homes
2 people in military transient quarters for temporary residents
Banks with branches in Tooele (2011 data):
KeyBank National Association: Tooele Branch at 201 North Main Street, branch established on 1962/03/28. Info updated 2008/03/03: Bank assets: $86,198.8 mil, Deposits: $64,214.8 mil, headquarters in Cleveland, OH, positive income , Commercial Lending Specialization, 1067 total offices , Holding Company: Keycorp
JPMorgan Chase Bank, National Association: Tooele Branch at 99 W 1280 North, branch established on 2001/03/05. Info updated 2011/11/10: Bank assets: $1,811,678.0 mil, Deposits: $1,190,738.0 mil, headquarters in Columbus, OH, positive income , International Specialization, 5577 total offices , Holding Company: Jpmorgan Chase & Co.
Zions First National Bank: Tooele Branch at 998 North Main, branch established on 1982/02/16. Info updated 2006/11/03: Bank assets: $17,531.3 mil, Deposits: $14,905.3 mil, headquarters in Salt Lake City, UT, positive income , Commercial Lending Specialization, 151 total offices , Holding Company: Zions Bancorporation
Wells Fargo Bank, National Association: Tooele Branch at 204 North Main Street, branch established on 1977/09/26. Info updated 2011/04/05: Bank assets: $1,161,490.0 mil, Deposits: $905,653.0 mil, headquarters in Sioux Falls, SD, positive income , 6395 total offices , Holding Company: Wells Fargo & Company
For population 15 years and over in Tooele:
Never married: 32.5%Now married: 52.3%Separated: 1.1%Widowed: 4.9%Divorced: 9.2% For population 25 years and over in Tooele:
High school or higher: 92.1%Bachelor's degree or higher: 16.4%Graduate or professional degree: 5.3%Unemployed: 5.6%Mean travel time to work (commute): 26.3 minutes
Education Gini index (Inequality in education) Here:
8.7Utah average:
10.9
Religion statistics for Tooele, UT (based on Tooele County data)
Religion Adherents Congregations Other 38,895 88 Catholic 10,706 2 Evangelical Protestant 1,250 14 Mainline Protestant 293 2 None 7,074 -
Source: Clifford Grammich, Kirk Hadaway, Richard Houseal, Dale E.Jones, Alexei Krindatch, Richie Stanley and Richard H.Taylor. 2012. 2010 U.S.Religion Census: Religious Congregations & Membership Study. Association of Statisticians of American Religious Bodies. Jones, Dale E., et al. 2002. Congregations and Membership in the United States 2000. Nashville, TN: Glenmary Research Center. Graphs represent county-level data
Food Environment Statistics: Number of grocery stores : 7Tooele County :
1.28 / 10,000 pop.State :
1.37 / 10,000 pop.
Number of supercenters and club stores : 1Tooele County :
0.18 / 10,000 pop.State :
0.18 / 10,000 pop.
Number of convenience stores (no gas) : 3Tooele County :
0.55 / 10,000 pop.Utah :
0.41 / 10,000 pop.
Number of convenience stores (with gas) : 13Tooele County :
2.37 / 10,000 pop.Utah :
2.82 / 10,000 pop.
Number of full-service restaurants : 13Tooele County :
2.37 / 10,000 pop.Utah :
5.09 / 10,000 pop.
Health and Nutrition: Healthy diet rate : This city:
48.1%Utah:
48.9%
Average overall health of teeth and gums : People feeling badly about themselves : This city:
21.2%State:
21.0%
People not drinking alcohol at all : This city:
11.0%State:
10.3%
Average hours sleeping at night : General health condition : Average condition of hearing : More about Health and Nutrition of Tooele, UT Residents
Local government employment and payroll (March 2022)
Function
Full-time employees
Monthly full-time payroll
Average yearly full-time wage
Part-time employees
Monthly part-time payroll
Police Protection - Officers
39 $228,933 $70,441 0 $0 Other Government Administration
20 $102,061 $61,237 15 $11,173 Parks and Recreation
17 $70,842 $50,006 51 $36,593 Police - Other
13 $40,670 $37,542 16 $13,817 Water Supply
12 $51,976 $51,976 0 $0 Financial Administration
11 $50,464 $55,052 0 $0 Streets and Highways
10 $39,691 $47,629 1 $512 Local Libraries
9 $33,236 $44,315 5 $7,790 Sewerage
9 $43,675 $58,233 0 $0 Other and Unallocable
8 $35,778 $53,667 3 $3,423 Natural Resources
5 $17,829 $42,790 5 $4,158 Judicial and Legal
4 $28,436 $85,308 0 $0 Firefighters
0 $0 11 $6,864 Fire - Other
0 $0 3 $292
Totals for Government
157 $743,590 $56,835 110 $84,623
Tooele government finances - Expenditure in 2021 (per resident):
Construction - Regular Highways: $567,000 ($14.69)
General - Other: $562,000 ($14.56)Parks and Recreation: $301,000 ($7.80)Transit Utilities: $13,000 ($0.34)Housing and Community Development: $11,000 ($0.29)Current Operations - General - Other: $4,074,000 ($105.58)
Police Protection: $3,855,000 ($99.90)Parks and Recreation: $3,031,000 ($78.55)Water Utilities: $2,472,000 ($64.06)Central Staff Services: $2,336,000 ($60.54)Sewerage: $1,988,000 ($51.52)Solid Waste Management: $1,910,000 ($49.50)Health - Other: $1,572,000 ($40.74)Regular Highways: $1,104,000 ($28.61)Libraries: $964,000 ($24.98)Financial Administration: $823,000 ($21.33)Judicial and Legal Services: $523,000 ($13.55)Miscellaneous Commercial Activities - Other: $379,000 ($9.82)Local Fire Protection: $341,000 ($8.84)Housing and Community Development: $321,000 ($8.32)General Public Buildings: $192,000 ($4.98)Natural Resources - Other: $57,000 ($1.48)General - Interest on Debt: $98,000 ($2.54)
Intergovernmental to Local - Other - Police Protection: $320,000 ($8.29)
Other - Housing and Community Development: $117,000 ($3.03)Other - General - Other: $1,000 ($0.03)Intergovernmental to State - General - Other: $22,000 ($0.57)
Other Capital Outlay - Regular Highways: $388,000 ($10.05)
Police Protection: $289,000 ($7.49)Local Fire Protection: $163,000 ($4.22)General - Other: $143,000 ($3.71)Parks and Recreation: $120,000 ($3.11)Total Salaries and Wages: $9,391,000 ($243.37)
Water Utilities - Interest on Debt: $6,000 ($0.16)
Tooele government finances - Revenue in 2021 (per resident):
Charges - Sewerage: $4,224,000 ($109.46)
Other: $3,783,000 ($98.04)Parks and Recreation: $682,000 ($17.67)Regular Highways: $244,000 ($6.32)Miscellaneous Commercial Activities: $221,000 ($5.73)Federal Intergovernmental - Other: $2,265,000 ($58.70)
Local Intergovernmental - General Local Government Support: $418,000 ($10.83)
Other: $20,000 ($0.52)Miscellaneous - General Revenue - Other: $4,527,000 ($117.32)
Special Assessments: $1,877,000 ($48.64)Rents: $812,000 ($21.04)Interest Earnings: $207,000 ($5.36)Fines and Forfeits: $77,000 ($2.00)Sale of Property: $73,000 ($1.89)Revenue - Water Utilities: $7,236,000 ($187.52)
State Intergovernmental - Other: $1,657,000 ($42.94)
General Local Government Support: $147,000 ($3.81)Tax - Property: $8,439,000 ($218.69)
General Sales and Gross Receipts: $8,188,000 ($212.19)Other Selective Sales: $3,228,000 ($83.65)Public Utilities Sales: $2,202,000 ($57.06)Other License: $1,131,000 ($29.31)Occupation and Business License - Other: $59,000 ($1.53)Other: $6,000 ($0.16)
Tooele government finances - Debt in 2021 (per resident):
Long Term Debt - Outstanding Unspecified Public Purpose: $11,656,000 ($302.06)
Issue, Unspecified Public Purpose: $11,656,000 ($302.06)Retired Unspecified Public Purpose: $2,571,000 ($66.63)Beginning Outstanding - Unspecified Public Purpose: $2,571,000 ($66.63)
Tooele government finances - Cash and Securities in 2021 (per resident):
Bond Funds - Cash and Securities: $6,527,000 ($169.15)
Other Funds - Cash and Securities: $36,000 ($0.93)
Businesses in Tooele, UT
Name Count Name Count
7-Eleven 1 H&R Block 2 AT&T 2 Hilton 1 Albertsons 1 Holiday Inn 1 Applebee's 1 Home Depot 1 Arby's 1 La-Z-Boy 1 AutoZone 1 Maurices 1 Best Western 1 Panda Express 1 Big O Tires 1 Payless 1 Blockbuster 1 Pizza Hut 1 Burger King 2 RadioShack 1 Carl\s Jr. 1 Sears 1 Chevrolet 1 Sprint Nextel 1 Cold Stone Creamery 1 Subway 2 Cricket Wireless 1 T-Mobile 2 Curves 1 Taco Bell 1 Dennys 1 U-Haul 2 FedEx 2 UPS 4 Ford 1 Walmart 1 GNC 1 Wendy's 1 GameStop 1
Strongest AM radio stations in Tooele:
KSL (1160 AM; 50 kW; SALT LAKE CITY, UT; Owner: BONNEVILLE HOLDING COMPANY)
KIQN (1010 AM; 50 kW; TOOELE, UT)
KALL (700 AM; 50 kW; NORTH SALT LAKE CITY, UT; Owner: CITICASTERS LICENSES, L.P.)
KKDS (1060 AM; 10 kW; SOUTH SALT LAKE, UT; Owner: HOLIDAY BROADCASTING COMPANY)
KTKK (630 AM; 10 kW; SANDY, UT; Owner: UNITED BROADCASTING COMPANY)
KLLB (1510 AM; daytime; 10 kW; WEST JORDAN, UT; Owner: UNITED SECURITY FINANCIAL, INC.)
KWDZ (910 AM; 5 kW; SALT LAKE CITY, UT; Owner: ABC, INC.)
KBEE (860 AM; 10 kW; SALT LAKE CITY, UT; Owner: CITADEL BROADCASTING COMPANY)
KMRI (1550 AM; 10 kW; WEST VALLEY CITY, UT; Owner: KMRI RADIO, LLC)
KBJA (1640 AM; 10 kW; SANDY, UT; Owner: UNITED BROADCASTING COMPANY, INC)
KNRS (570 AM; 5 kW; SALT LAKE CITY, UT; Owner: CITICASTERS LICENSES, L.P.)
KZNS (1280 AM; 10 kW; SALT LAKE CITY, UT; Owner: SIMMONS-SLC, LS, LLC)
KFNZ (1320 AM; 5 kW; SALT LAKE CITY, UT; Owner: CITADEL BROADCASTING COMPANY)
Strongest FM radio stations in Tooele:
KSOP-FM (104.3 FM; SALT LAKE CITY, UT; Owner: KSOP, INC.)
K272DP (102.3 FM; TOOELE, UT; Owner: FAMILY STATIONS, INC.)
KRCL (90.9 FM; SALT LAKE CITY, UT; Owner: LISTENERS COMMUNITY RADIO OF UTAH)
KBZN (97.9 FM; OGDEN, UT; Owner: CAPITOL BROADCASTING, INC.)
KOSY-FM (106.5 FM; SPANISH FORK, UT; Owner: MERCURY BROADCASTING COMPANY, INC.)
KRSP-FM (103.5 FM; SALT LAKE CITY, UT; Owner: SIMMONS-SLC, LS, LLC)
KBER (101.1 FM; OGDEN, UT; Owner: CITADEL BROADCASTING COMPANY)
KISN-FM (97.1 FM; SALT LAKE CITY, UT; Owner: CLEAR CHANNEL BROADCASTING LICENSES, INC.)
KKAT (101.9 FM; OGDEN, UT; Owner: CITICASTERS LICENSES, L.P.)
KSFI (100.3 FM; SALT LAKE CITY, UT; Owner: SIMMONS-SLC, LS, LLC)
KUBL-FM (93.3 FM; SALT LAKE CITY, UT; Owner: CITADEL BROADCASTING COMPANY)
KODJ (94.1 FM; SALT LAKE CITY, UT; Owner: CITICASTERS LICENSES, L.P.)
KUER-FM (90.1 FM; SALT LAKE CITY, UT; Owner: UNIVERSITY OF UTAH)
KBYU-FM (89.1 FM; PROVO, UT; Owner: BRIGHAM YOUNG UNIVERSITY)
KURR (99.5 FM; BOUNTIFUL, UT; Owner: CITICASTERS LICENSES, L.P.)
KBEE-FM (98.7 FM; SALT LAKE CITY, UT; Owner: CITADEL BROADCASTING COMPANY)
K248AK (97.5 FM; DRAPER, UT; Owner: CITICASTERS LICENSES, L.P.)
KUUU (92.1 FM; TOOELE, UT; Owner: MILLCREEK BROADCASTING, L.L.C.)
KXRK (96.3 FM; PROVO, UT; Owner: SIMMONS-SLC, LS, LLC)
KQMB (102.7 FM; MIDVALE, UT; Owner: SIMMONS-SLC, LS, LLC)
TV broadcast stations around Tooele:
KUTV (Channel 2; SALT LAKE CITY, UT; Owner: KUTV HOLDINGS, INC.)
KEJT-LP (Channel 48; SALT LAKE CITY, UT; Owner: TELEMUNDO OF NORTHERN CALIFORNIA LICENSE CORP.)
KUED (Channel 7; SALT LAKE CITY, UT; Owner: UNIVERSITY OF UTAH)
KULC (Channel 9; OGDEN, UT; Owner: UTAH STATE BOARD OF REGENTS)
KBYU-TV (Channel 11; PROVO, UT; Owner: BRIGHAM YOUNG UNIVERSITY)
KSL-TV (Channel 5; SALT LAKE CITY, UT; Owner: BONNEVILLE HOLDING COMPANY)
KUWB (Channel 30; OGDEN, UT; Owner: ACME TV LICENSES OF UTAH, LLC)
KTVX (Channel 4; SALT LAKE CITY, UT; Owner: CLEAR CHANNEL BROADCASTING LICENSES, INC.)
KJZZ-TV (Channel 14; SALT LAKE CITY, UT; Owner: LARRY H. MILLER COMMUNICATIONS CORP.)
KSTU (Channel 13; SALT LAKE CITY, UT; Owner: FOX TELEVISION STATIONS INC.)
KTMW (Channel 20; SALT LAKE CITY, UT; Owner: ALPHA & OMEGA COMMUNICATIONS, LLC)
KUBX-LP (Channel 58; SALT LAKE CITY, UT; Owner: EQUITY BROADCASTING CORPORATION)
K68FY (Channel 68; SALT LAKE CITY, UT; Owner: PRICE BROADCASTING, INC.)
K59GS (Channel 59; SALT LAKE CITY, UT; Owner: ALPHA & OMEGA COMMUNICATIONS, LLC)
K18FJ (Channel 18; SALT LAKE CITY, UT; Owner: NATIONAL MINORITY T.V., INC.)
National Bridge Inventory (NBI) Statistics 3 Number of bridges26ft / 7.7m Total length35,794 Total average daily traffic5,533 Total average daily truck traffic
Home Mortgage Disclosure Act Aggregated Statistics For Year 2009(Based on 3 full and 1 partial tracts) A) FHA, FSA/RHS & VA B) Conventional C) Refinancings D) Home Improvement Loans F) Non-occupant Loans on G) Loans On Manufactured Number Average Value Number Average Value Number Average Value Number Average Value Number Average Value Number Average Value
LOANS ORIGINATED 240 $157,425 75 $107,356 955 $145,302 15 $91,135 29 $99,765 20 $88,968 APPLICATIONS APPROVED, NOT ACCEPTED 19 $183,362 3 $57,187 96 $156,633 5 $87,334 3 $120,333 1 $34,000 APPLICATIONS DENIED 33 $150,010 19 $124,889 249 $151,427 22 $42,195 14 $97,314 11 $61,474 APPLICATIONS WITHDRAWN 17 $170,424 25 $169,145 184 $151,066 13 $85,741 4 $118,480 4 $79,498 FILES CLOSED FOR INCOMPLETENESS 5 $142,424 2 $118,475 33 $177,647 1 $10,000 0 $0 0 $0
Aggregated Statistics For Year 2008(Based on 3 full and 1 partial tracts) A) FHA, FSA/RHS & VA B) Conventional C) Refinancings D) Home Improvement Loans E) Loans on Dwellings For 5+ Families F) Non-occupant Loans on G) Loans On Manufactured Number Average Value Number Average Value Number Average Value Number Average Value Number Average Value Number Average Value Number Average Value
LOANS ORIGINATED 200 $166,717 147 $134,229 717 $143,863 49 $75,441 3 $280,170 28 $116,296 25 $61,915 APPLICATIONS APPROVED, NOT ACCEPTED 10 $188,312 12 $172,103 94 $148,761 5 $79,932 0 $0 7 $120,613 4 $82,702 APPLICATIONS DENIED 33 $165,150 37 $113,813 336 $143,048 92 $114,335 2 $384,710 11 $122,136 28 $72,365 APPLICATIONS WITHDRAWN 31 $164,753 25 $126,036 208 $161,915 22 $96,955 1 $3,207,050 9 $97,241 4 $90,860 FILES CLOSED FOR INCOMPLETENESS 2 $133,775 2 $132,425 17 $148,129 2 $99,500 0 $0 0 $0 0 $0
Aggregated Statistics For Year 2007(Based on 3 full and 1 partial tracts) A) FHA, FSA/RHS & VA B) Conventional C) Refinancings D) Home Improvement Loans E) Loans on Dwellings For 5+ Families F) Non-occupant Loans on G) Loans On Manufactured Number Average Value Number Average Value Number Average Value Number Average Value Number Average Value Number Average Value Number Average Value
LOANS ORIGINATED 135 $165,111 544 $127,098 884 $126,830 103 $60,752 2 $2,229,910 127 $107,765 15 $63,657 APPLICATIONS APPROVED, NOT ACCEPTED 6 $169,473 43 $128,959 135 $130,638 19 $55,261 0 $0 16 $111,864 4 $84,260 APPLICATIONS DENIED 20 $171,364 145 $132,035 442 $131,848 114 $74,704 0 $0 47 $120,798 23 $58,676 APPLICATIONS WITHDRAWN 16 $152,671 70 $127,567 163 $137,237 29 $79,212 0 $0 20 $118,053 1 $126,810 FILES CLOSED FOR INCOMPLETENESS 0 $0 5 $131,652 41 $129,828 6 $57,023 0 $0 2 $135,500 0 $0
Aggregated Statistics For Year 2006(Based on 3 full and 1 partial tracts) A) FHA, FSA/RHS & VA B) Conventional C) Refinancings D) Home Improvement Loans E) Loans on Dwellings For 5+ Families F) Non-occupant Loans on G) Loans On Manufactured Number Average Value Number Average Value Number Average Value Number Average Value Number Average Value Number Average Value Number Average Value
LOANS ORIGINATED 172 $139,841 997 $99,284 739 $100,961 66 $38,512 3 $383,800 213 $95,170 11 $66,009 APPLICATIONS APPROVED, NOT ACCEPTED 3 $116,593 113 $94,819 137 $104,422 13 $52,834 0 $0 27 $82,454 1 $152,370 APPLICATIONS DENIED 19 $134,719 204 $96,921 419 $107,929 102 $48,685 1 $516,080 52 $96,544 19 $52,865 APPLICATIONS WITHDRAWN 9 $118,846 92 $88,160 193 $112,245 20 $65,588 0 $0 24 $96,230 1 $108,130 FILES CLOSED FOR INCOMPLETENESS 3 $146,067 13 $106,569 55 $109,839 1 $33,900 0 $0 6 $86,485 0 $0
Aggregated Statistics For Year 2005(Based on 3 full and 1 partial tracts) A) FHA, FSA/RHS & VA B) Conventional C) Refinancings D) Home Improvement Loans E) Loans on Dwellings For 5+ Families F) Non-occupant Loans on G) Loans On Manufactured Number Average Value Number Average Value Number Average Value Number Average Value Number Average Value Number Average Value Number Average Value
LOANS ORIGINATED 168 $119,217 720 $80,602 596 $90,905 48 $50,319 1 $497,550 141 $79,678 14 $74,313 APPLICATIONS APPROVED, NOT ACCEPTED 4 $112,680 82 $76,349 115 $93,588 12 $37,764 0 $0 15 $76,898 5 $66,472 APPLICATIONS DENIED 22 $105,162 218 $81,107 430 $99,970 99 $37,436 0 $0 45 $95,968 22 $68,246 APPLICATIONS WITHDRAWN 20 $115,850 127 $82,885 237 $117,816 37 $117,348 0 $0 27 $70,854 5 $56,334 FILES CLOSED FOR INCOMPLETENESS 3 $132,017 26 $89,322 87 $123,780 0 $0 0 $0 5 $91,224 1 $86,500
Aggregated Statistics For Year 2004(Based on 3 full and 1 partial tracts) A) FHA, FSA/RHS & VA B) Conventional C) Refinancings D) Home Improvement Loans E) Loans on Dwellings For 5+ Families F) Non-occupant Loans on G) Loans On Manufactured Number Average Value Number Average Value Number Average Value Number Average Value Number Average Value Number Average Value Number Average Value
LOANS ORIGINATED 205 $117,088 452 $78,176 566 $97,482 57 $28,215 0 $0 95 $75,637 10 $47,414 APPLICATIONS APPROVED, NOT ACCEPTED 8 $104,072 94 $88,296 114 $102,609 12 $26,767 0 $0 17 $82,411 10 $45,502 APPLICATIONS DENIED 18 $113,566 138 $79,321 429 $101,380 100 $29,259 1 $6,410 38 $83,358 38 $45,201 APPLICATIONS WITHDRAWN 21 $123,650 59 $75,933 229 $108,018 20 $45,488 0 $0 21 $80,156 7 $90,266 FILES CLOSED FOR INCOMPLETENESS 5 $110,322 8 $72,486 81 $129,077 2 $18,995 0 $0 8 $73,591 0 $0
Detailed HMDA statistics for the following Tracts:
1309.00
, 1310.00 , 1311.00 , 1312.00
Private Mortgage Insurance Companies Aggregated Statistics For Year 2009(Based on 3 full and 1 partial tracts) A) Conventional B) Refinancings C) Non-occupant Loans on Number Average Value Number Average Value Number Average Value
LOANS ORIGINATED 6 $200,368 35 $160,492 1 $153,000 APPLICATIONS APPROVED, NOT ACCEPTED 2 $147,670 14 $202,791 1 $146,470 APPLICATIONS DENIED 2 $118,315 13 $151,590 0 $0 APPLICATIONS WITHDRAWN 1 $144,500 4 $167,472 0 $0 FILES CLOSED FOR INCOMPLETENESS 1 $126,810 2 $184,970 1 $126,810
Aggregated Statistics For Year 2008(Based on 3 full and 1 partial tracts) A) Conventional B) Refinancings C) Non-occupant Loans on Number Average Value Number Average Value Number Average Value
LOANS ORIGINATED 78 $169,702 70 $173,441 10 $134,282 APPLICATIONS APPROVED, NOT ACCEPTED 17 $168,088 19 $175,368 1 $138,000 APPLICATIONS DENIED 1 $154,000 6 $178,907 1 $236,900 APPLICATIONS WITHDRAWN 5 $154,006 3 $224,353 1 $101,710 FILES CLOSED FOR INCOMPLETENESS 0 $0 5 $152,560 1 $189,670
Aggregated Statistics For Year 2007(Based on 3 full and 1 partial tracts) A) Conventional B) Refinancings C) Non-occupant Loans on Number Average Value Number Average Value Number Average Value
LOANS ORIGINATED 218 $161,914 101 $153,750 23 $139,029 APPLICATIONS APPROVED, NOT ACCEPTED 22 $166,443 10 $166,182 5 $143,264 APPLICATIONS DENIED 5 $127,060 3 $256,100 3 $124,213 APPLICATIONS WITHDRAWN 9 $181,649 3 $145,040 1 $148,440 FILES CLOSED FOR INCOMPLETENESS 1 $113,620 0 $0 0 $0
Aggregated Statistics For Year 2006(Based on 3 full and 1 partial tracts) A) Conventional B) Refinancings C) Non-occupant Loans on D) Loans On Manufactured Number Average Value Number Average Value Number Average Value Number Average Value
LOANS ORIGINATED 149 $137,361 56 $128,300 25 $119,371 1 $80,000 APPLICATIONS APPROVED, NOT ACCEPTED 9 $130,378 11 $133,377 2 $100,335 0 $0 APPLICATIONS DENIED 1 $106,160 0 $0 0 $0 0 $0 APPLICATIONS WITHDRAWN 5 $107,000 4 $159,898 1 $93,390 0 $0 FILES CLOSED FOR INCOMPLETENESS 0 $0 0 $0 0 $0 0 $0
Aggregated Statistics For Year 2005(Based on 3 full and 1 partial tracts) A) Conventional B) Refinancings C) Non-occupant Loans on Number Average Value Number Average Value Number Average Value
LOANS ORIGINATED 76 $113,897 60 $122,293 20 $93,494 APPLICATIONS APPROVED, NOT ACCEPTED 11 $102,158 7 $157,374 1 $98,300 APPLICATIONS DENIED 1 $69,790 2 $99,025 1 $69,790 APPLICATIONS WITHDRAWN 5 $123,058 5 $112,572 4 $97,905 FILES CLOSED FOR INCOMPLETENESS 0 $0 0 $0 0 $0
Aggregated Statistics For Year 2004(Based on 3 full and 1 partial tracts) A) Conventional B) Refinancings C) Non-occupant Loans on D) Loans On Manufactured Number Average Value Number Average Value Number Average Value Number Average Value
LOANS ORIGINATED 69 $104,436 87 $118,290 17 $84,325 0 $0 APPLICATIONS APPROVED, NOT ACCEPTED 6 $94,160 27 $114,321 4 $88,785 1 $97,320 APPLICATIONS DENIED 1 $62,310 3 $169,213 1 $65,060 0 $0 APPLICATIONS WITHDRAWN 6 $94,515 7 $109,964 3 $91,697 0 $0 FILES CLOSED FOR INCOMPLETENESS 2 $131,585 0 $0 1 $97,320 0 $0
Detailed PMIC statistics for the following Tracts:
1309.00
, 1310.00 , 1311.00 , 1312.00 Fire-safe hotels and motels in Tooele, Utah:
American Inn & Suites, 491 S Main St, Tooele, Utah 84074 Phone: (435) 882-6100, Fax: (435) 882-6102
Best Western Inn Tooele, 365 N Main St, Tooele, Utah 84074 Phone: (435) 882-5010, Fax: (435) 882-5746
Hampton Inn, 461 S Main St, Tooele, Utah 84074 Phone: (435) 843-7700, Fax: (435) 843-7703
Holiday Inn Express Hotel, 1531 N Main, Tooele, Utah 84074 Phone: (435) 833-0500, Fax: (435) 833-0500
Comfort Inn & Suites, 8580 North Hwy 36, Tooele, Utah 84074 Phone: (801) 250-3600, Fax: (801) 250-3611
All 5 fire-safe hotels and motels in Tooele, Utah Tooele compared to Utah state average:
Unemployed percentage below state average. Black race population percentage below state average. Hispanic race population percentage above state average. Length of stay since moving in significantly above state average.
#92 on the list of "Top 101 cities with the largest percentage of people in military transient quarters for temporary residents (population 1,000+)"
#30 (84074) on the list of "Top 101 zip codes with the largest percentage of Danish first ancestries (pop 5,000+)"
#7 on the list of "Top 101 counties with the highest Ozone (1-hour) air pollution readings in 2012 (ppm)"
#10 on the list of "Top 101 counties with the highest percentage of residents that keep firearms around their homes"
#11 on the list of "Top 101 counties with the lowest percentage of residents that drank alcohol in the past 30 days"
#15 on the list of "Top 101 counties with the lowest percentage of residents that smoked 100+ cigarettes in their lives"
#49 on the list of "Top 101 counties with the lowest Particulate Matter (PM2.5 ) Annual air pollution readings in 2012 (µg/m3 )"
Top Patent Applicants
Lamar Edward May (4)
Benjamin Bradly Petersen (2)
David J. Erekson (2)
Rodrick G. Shannon (2)
Donald J. Thomas (2)
Keith L. Davis (2)
Edward Peterson (1)
Bret David Nicholson (1)
Carl E. Cole (1)
Mary Peterson (1)
Total of 38 patent applications in 2008-2024.
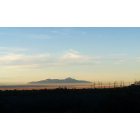
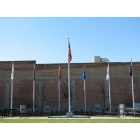
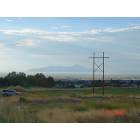
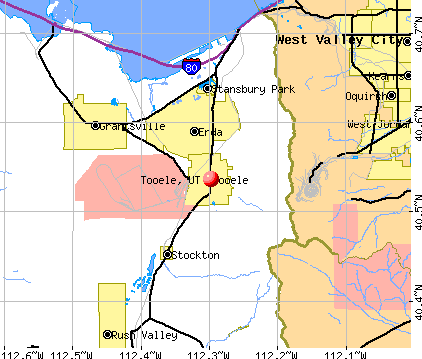


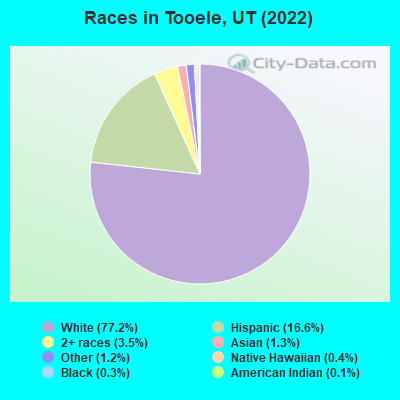
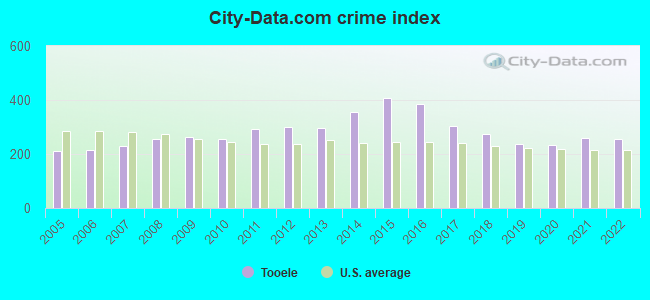
 Recent articles from our blog. Our writers, many of them Ph.D. graduates or candidates, create easy-to-read articles on a wide variety of topics.

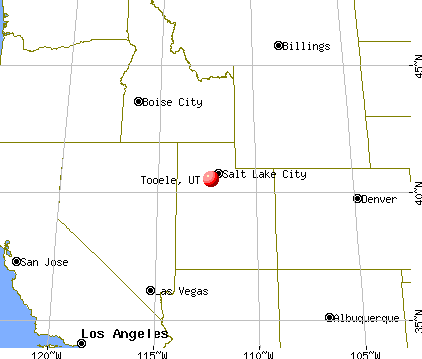
 (17.6 miles
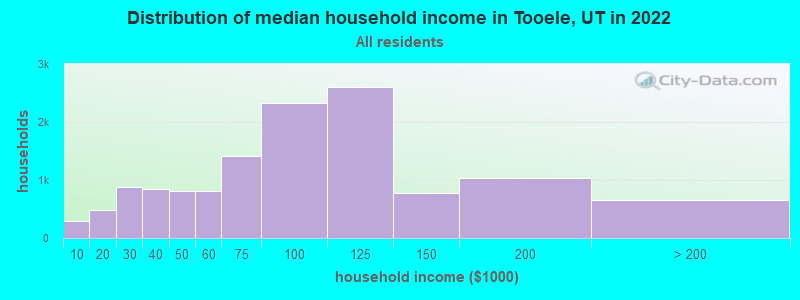
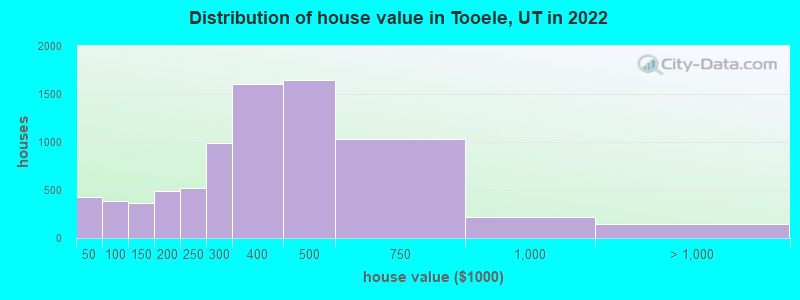
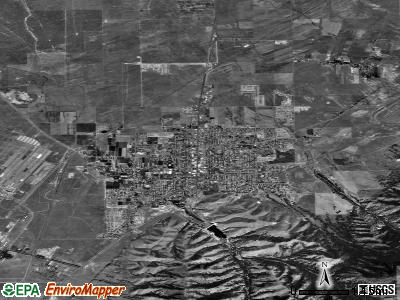
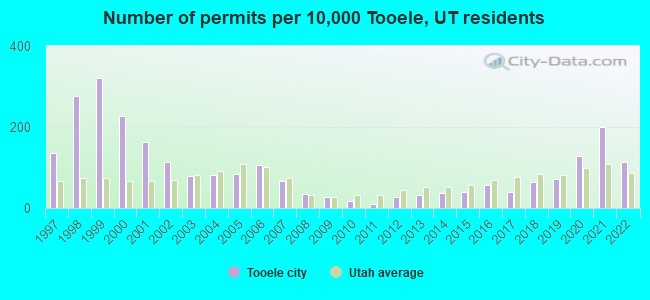
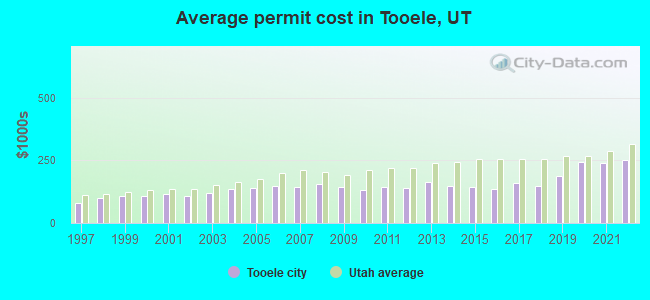
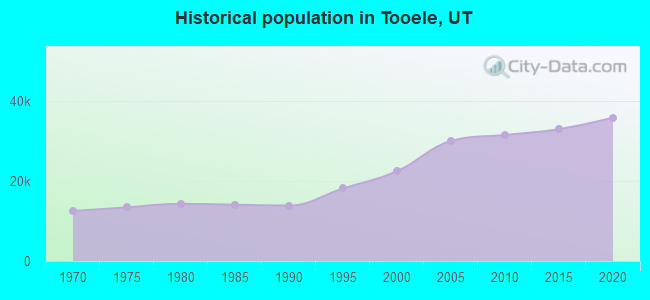
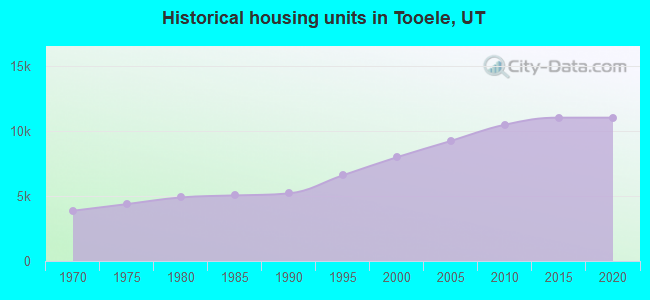
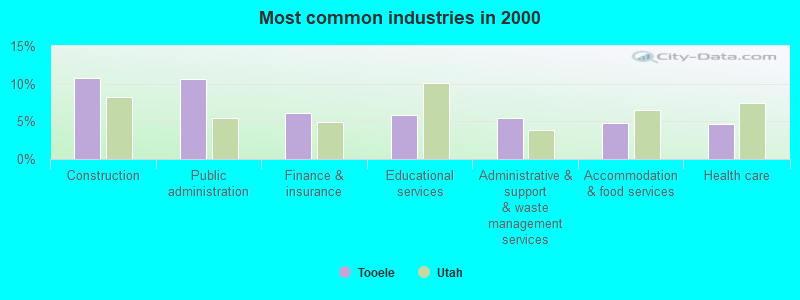
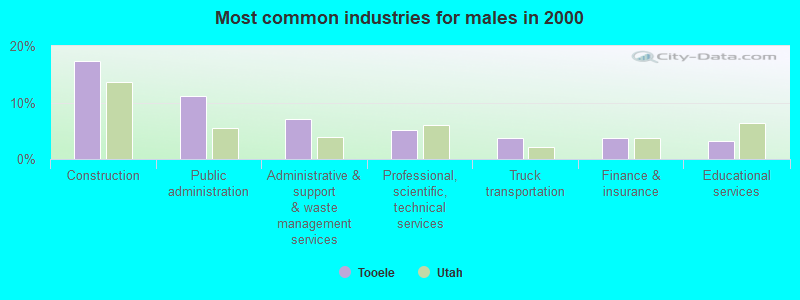
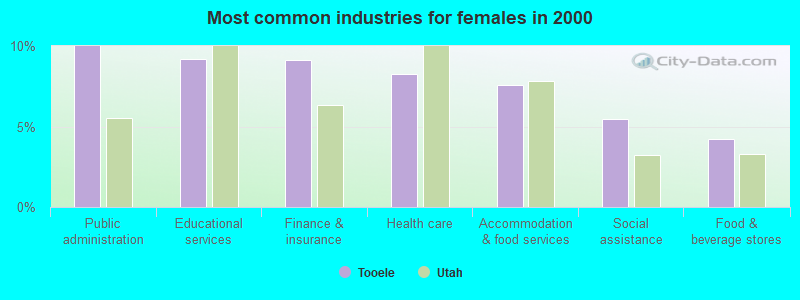
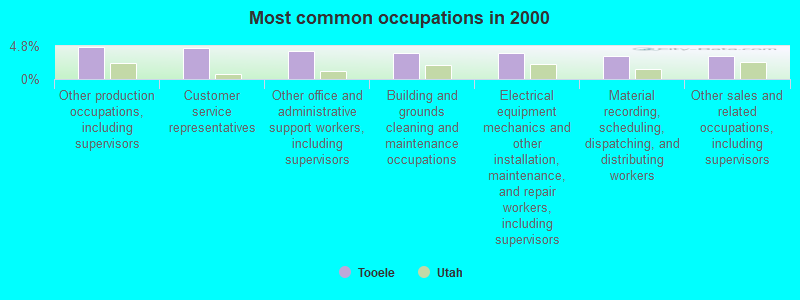
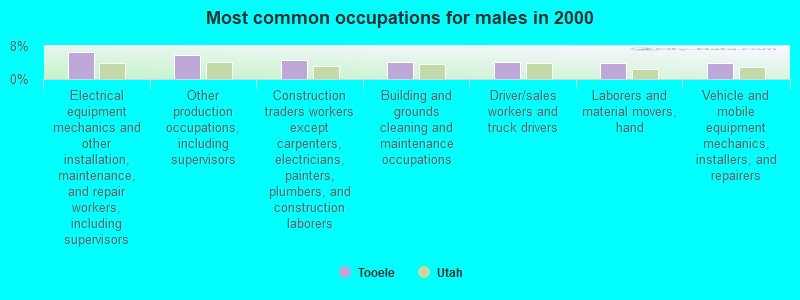
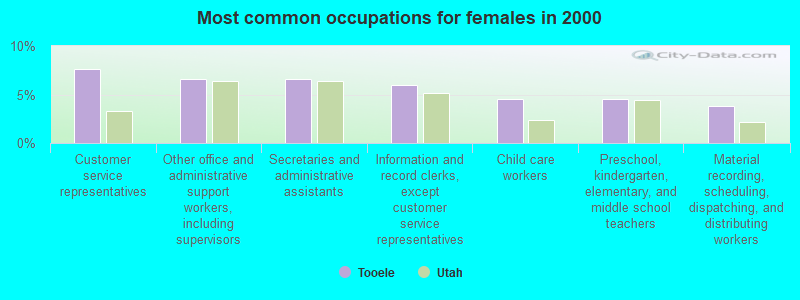
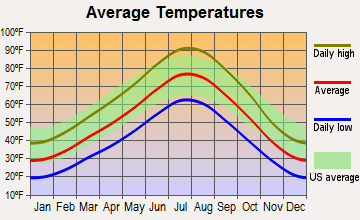
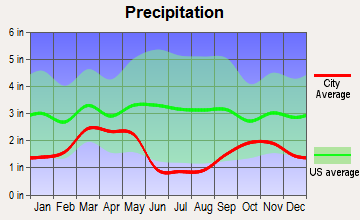
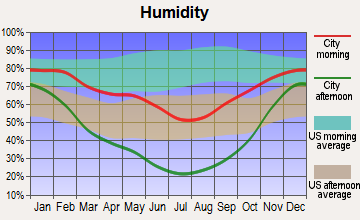
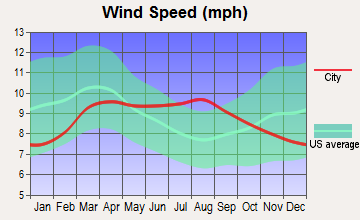
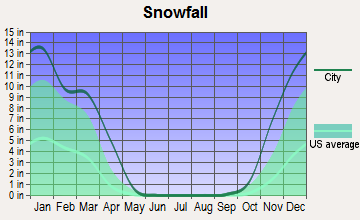
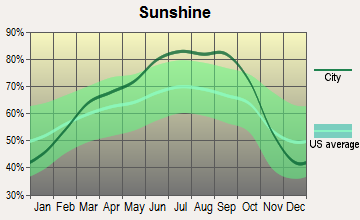
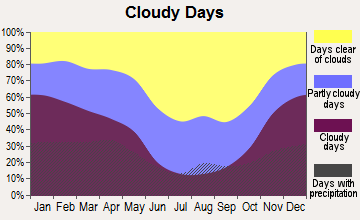


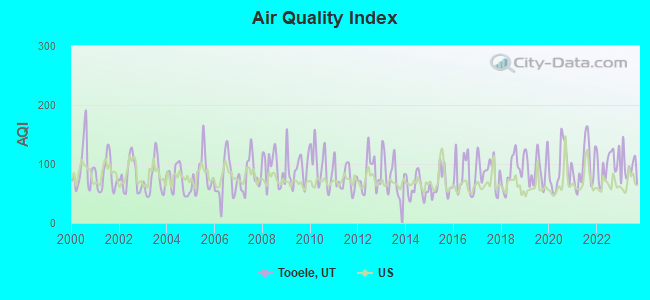
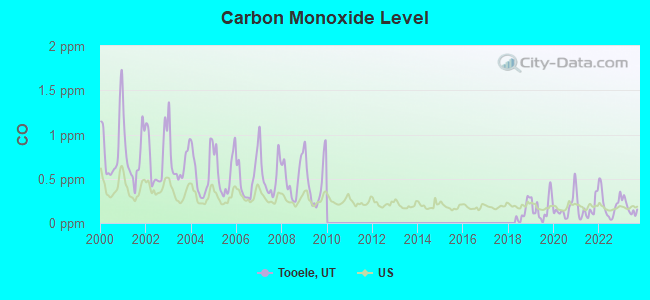
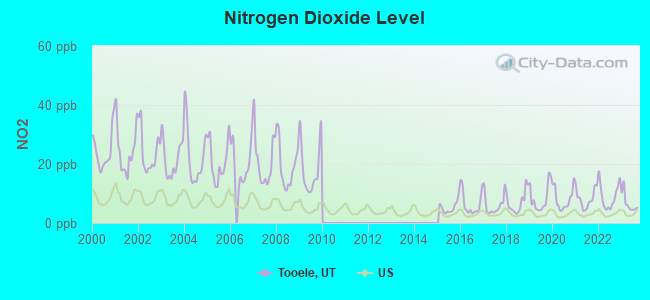
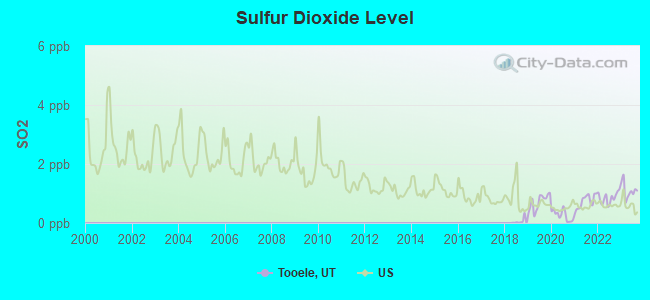
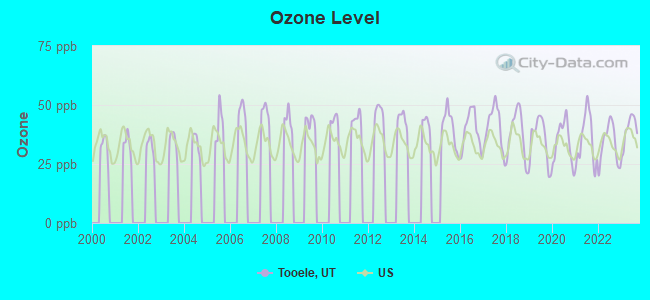
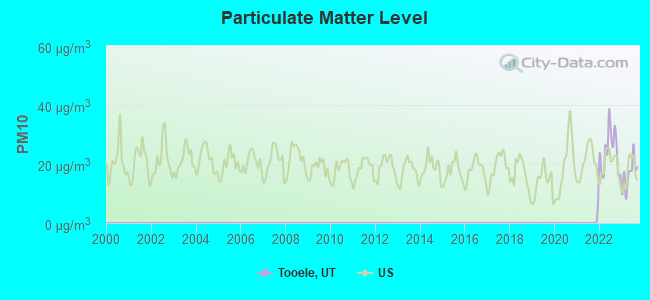
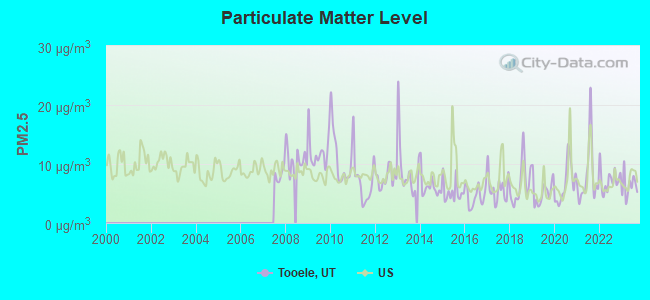
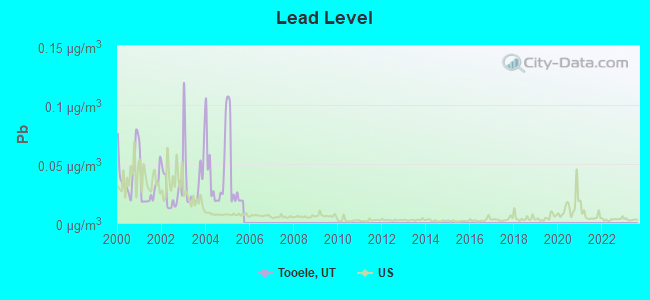
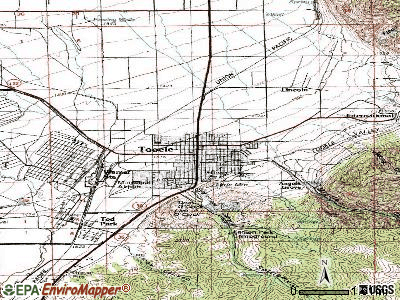
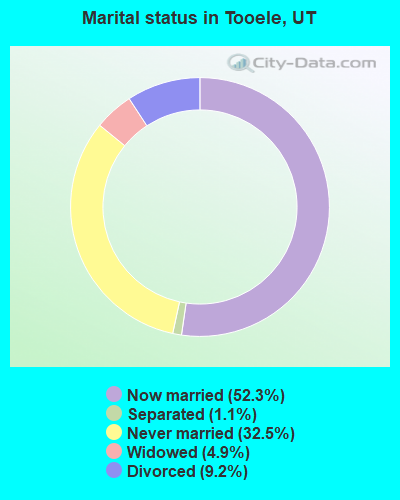
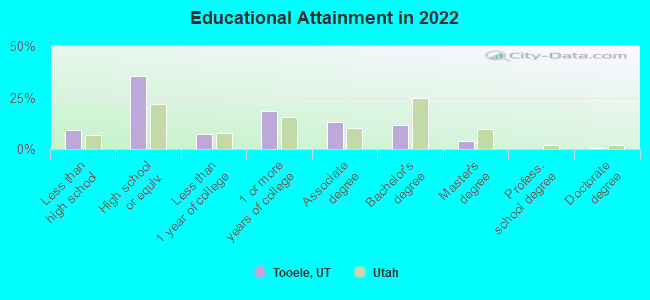
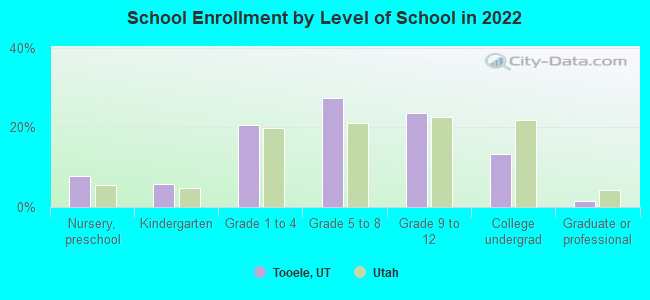
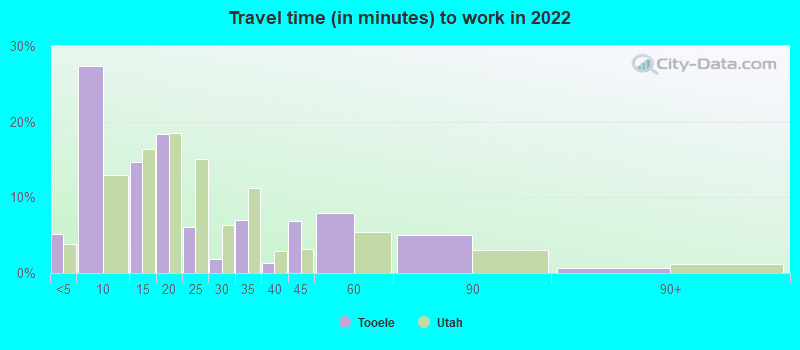
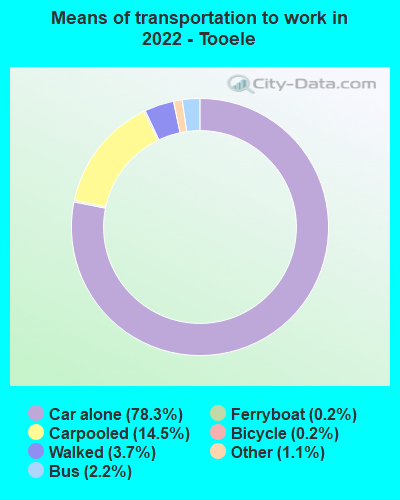
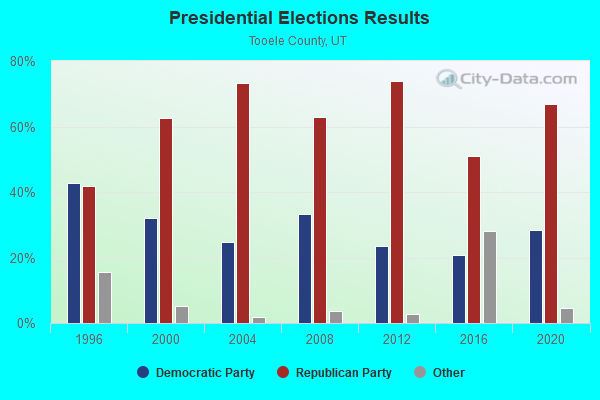
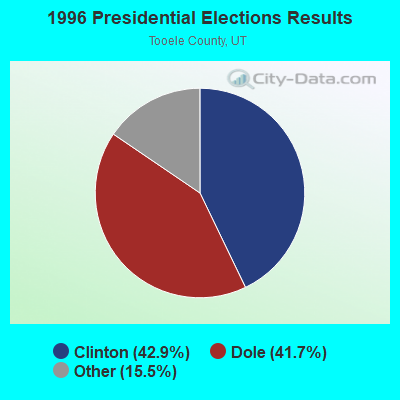
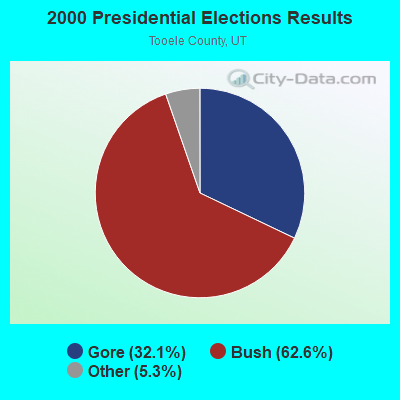
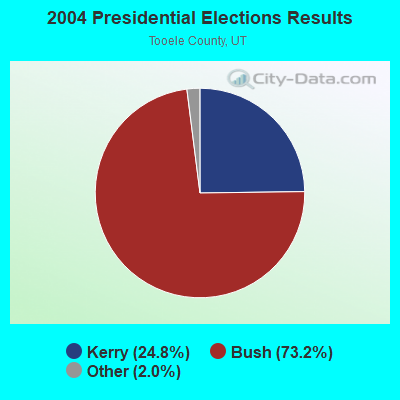
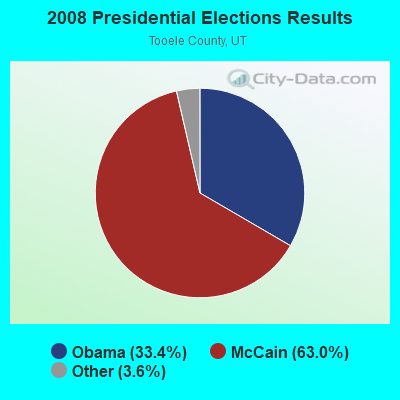
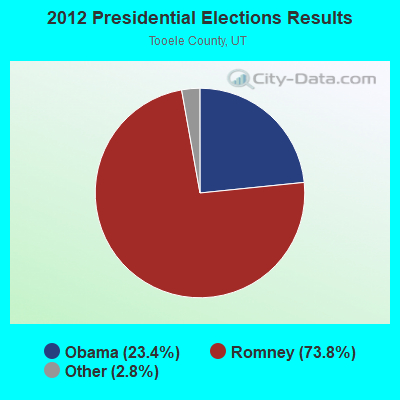
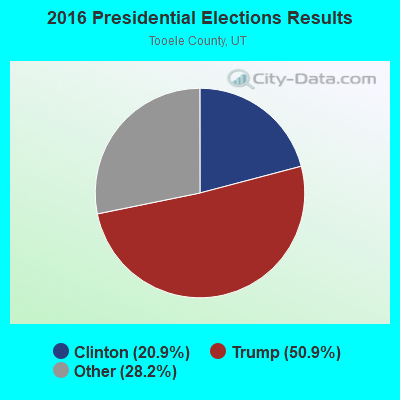
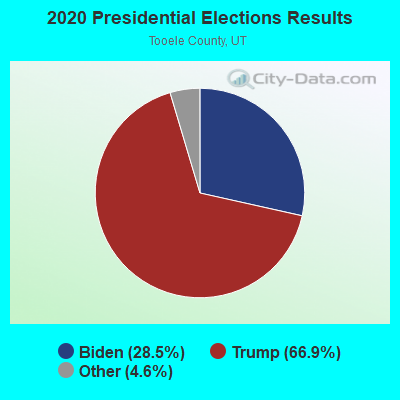
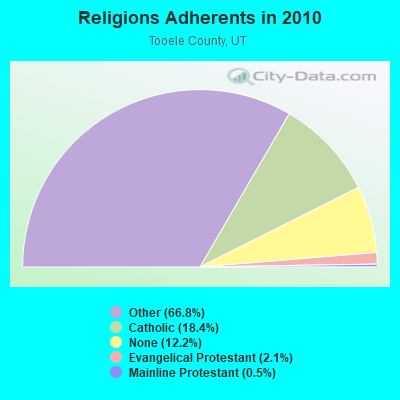
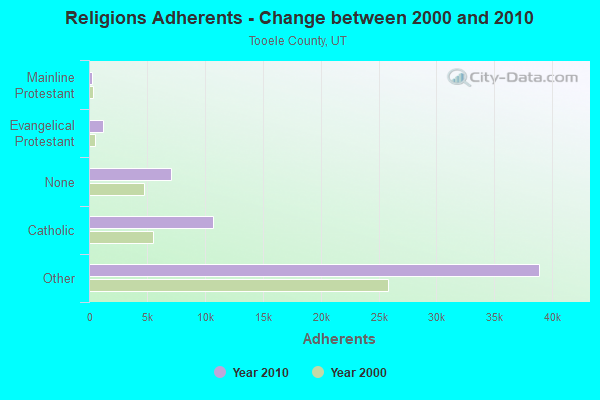
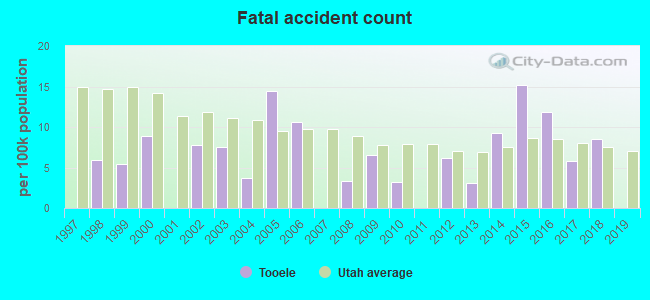
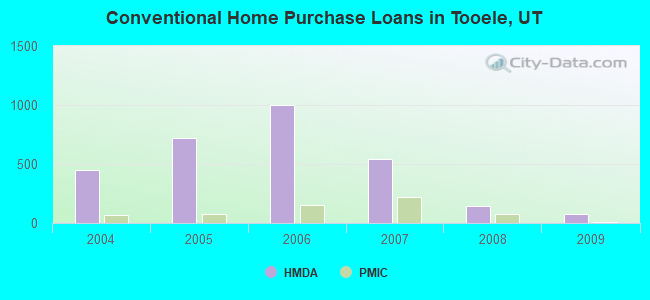
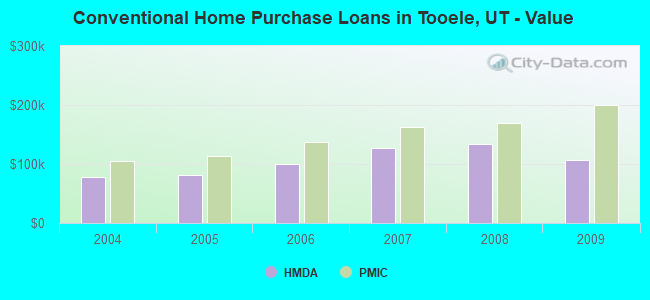
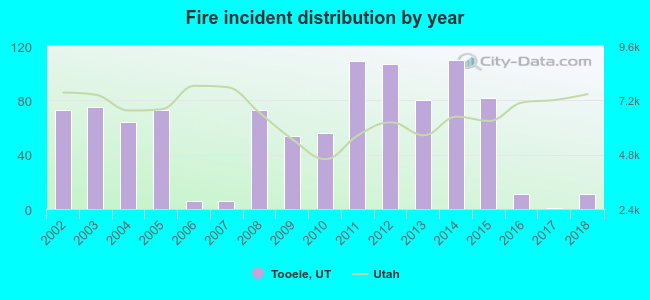 Based on the data from the years 2002 - 2018 the average number of fire incidents per year is 58. The highest number of fires - 110 took place in 2014, and the least - 1 in 2017. The data has a decreasing trend.
 When looking into fire subcategories, the most incidents belonged to: Outside Fires (50.2%), and Structure Fires (32.8%).