West Jordan, Utah Submit your own pictures of this city and show them to the world
OSM Map
General Map
Google Map
MSN Map
OSM Map
General Map
Google Map
MSN Map
OSM Map
General Map
Google Map
MSN Map
OSM Map
General Map
Google Map
MSN Map
Please wait while loading the map...
Population in 2022: 116,664 (100% urban, 0% rural). Population change since 2000: +70.7%Males: 59,225 Females: 57,439
March 2022 cost of living index in West Jordan: 92.6 (less than average, U.S. average is 100) Percentage of residents living in poverty in 2022: 5.7%for White Non-Hispanic residents , 33.7% for Black residents , 11.0% for Hispanic or Latino residents , 19.1% for American Indian residents , 27.4% for Native Hawaiian and other Pacific Islander residents , 13.8% for other race residents , 8.9% for two or more races residents )
Profiles of local businesses
Business Search - 14 Million verified businesses
Data:
Median household income ($)
Median household income (% change since 2000)
Household income diversity
Ratio of average income to average house value (%)
Ratio of average income to average rent
Median household income ($) - White
Median household income ($) - Black or African American
Median household income ($) - Asian
Median household income ($) - Hispanic or Latino
Median household income ($) - American Indian and Alaska Native
Median household income ($) - Multirace
Median household income ($) - Other Race
Median household income for houses/condos with a mortgage ($)
Median household income for apartments without a mortgage ($)
Races - White alone (%)
Races - White alone (% change since 2000)
Races - Black alone (%)
Races - Black alone (% change since 2000)
Races - American Indian alone (%)
Races - American Indian alone (% change since 2000)
Races - Asian alone (%)
Races - Asian alone (% change since 2000)
Races - Hispanic (%)
Races - Hispanic (% change since 2000)
Races - Native Hawaiian and Other Pacific Islander alone (%)
Races - Native Hawaiian and Other Pacific Islander alone (% change since 2000)
Races - Two or more races (%)
Races - Two or more races (% change since 2000)
Races - Other race alone (%)
Races - Other race alone (% change since 2000)
Racial diversity
Unemployment (%)
Unemployment (% change since 2000)
Unemployment (%) - White
Unemployment (%) - Black or African American
Unemployment (%) - Asian
Unemployment (%) - Hispanic or Latino
Unemployment (%) - American Indian and Alaska Native
Unemployment (%) - Multirace
Unemployment (%) - Other Race
Population density (people per square mile)
Population - Males (%)
Population - Females (%)
Population - Males (%) - White
Population - Males (%) - Black or African American
Population - Males (%) - Asian
Population - Males (%) - Hispanic or Latino
Population - Males (%) - American Indian and Alaska Native
Population - Males (%) - Multirace
Population - Males (%) - Other Race
Population - Females (%) - White
Population - Females (%) - Black or African American
Population - Females (%) - Asian
Population - Females (%) - Hispanic or Latino
Population - Females (%) - American Indian and Alaska Native
Population - Females (%) - Multirace
Population - Females (%) - Other Race
Coronavirus confirmed cases (Apr 27, 2024)
Deaths caused by coronavirus (Apr 27, 2024)
Coronavirus confirmed cases (per 100k population) (Apr 27, 2024)
Deaths caused by coronavirus (per 100k population) (Apr 27, 2024)
Daily increase in number of cases (Apr 27, 2024)
Weekly increase in number of cases (Apr 27, 2024)
Cases doubled (in days) (Apr 27, 2024)
Hospitalized patients (Apr 18, 2022)
Negative test results (Apr 18, 2022)
Total test results (Apr 18, 2022)
COVID Vaccine doses distributed (per 100k population) (Sep 19, 2023)
COVID Vaccine doses administered (per 100k population) (Sep 19, 2023)
COVID Vaccine doses distributed (Sep 19, 2023)
COVID Vaccine doses administered (Sep 19, 2023)
Likely homosexual households (%)
Likely homosexual households (% change since 2000)
Likely homosexual households - Lesbian couples (%)
Likely homosexual households - Lesbian couples (% change since 2000)
Likely homosexual households - Gay men (%)
Likely homosexual households - Gay men (% change since 2000)
Cost of living index
Median gross rent ($)
Median contract rent ($)
Median monthly housing costs ($)
Median house or condo value ($)
Median house or condo value ($ change since 2000)
Mean house or condo value by units in structure - 1, detached ($)
Mean house or condo value by units in structure - 1, attached ($)
Mean house or condo value by units in structure - 2 ($)
Mean house or condo value by units in structure by units in structure - 3 or 4 ($)
Mean house or condo value by units in structure - 5 or more ($)
Mean house or condo value by units in structure - Boat, RV, van, etc. ($)
Mean house or condo value by units in structure - Mobile home ($)
Median house or condo value ($) - White
Median house or condo value ($) - Black or African American
Median house or condo value ($) - Asian
Median house or condo value ($) - Hispanic or Latino
Median house or condo value ($) - American Indian and Alaska Native
Median house or condo value ($) - Multirace
Median house or condo value ($) - Other Race
Median resident age
Resident age diversity
Median resident age - Males
Median resident age - Females
Median resident age - White
Median resident age - Black or African American
Median resident age - Asian
Median resident age - Hispanic or Latino
Median resident age - American Indian and Alaska Native
Median resident age - Multirace
Median resident age - Other Race
Median resident age - Males - White
Median resident age - Males - Black or African American
Median resident age - Males - Asian
Median resident age - Males - Hispanic or Latino
Median resident age - Males - American Indian and Alaska Native
Median resident age - Males - Multirace
Median resident age - Males - Other Race
Median resident age - Females - White
Median resident age - Females - Black or African American
Median resident age - Females - Asian
Median resident age - Females - Hispanic or Latino
Median resident age - Females - American Indian and Alaska Native
Median resident age - Females - Multirace
Median resident age - Females - Other Race
Commute - mean travel time to work (minutes)
Travel time to work - Less than 5 minutes (%)
Travel time to work - Less than 5 minutes (% change since 2000)
Travel time to work - 5 to 9 minutes (%)
Travel time to work - 5 to 9 minutes (% change since 2000)
Travel time to work - 10 to 19 minutes (%)
Travel time to work - 10 to 19 minutes (% change since 2000)
Travel time to work - 20 to 29 minutes (%)
Travel time to work - 20 to 29 minutes (% change since 2000)
Travel time to work - 30 to 39 minutes (%)
Travel time to work - 30 to 39 minutes (% change since 2000)
Travel time to work - 40 to 59 minutes (%)
Travel time to work - 40 to 59 minutes (% change since 2000)
Travel time to work - 60 to 89 minutes (%)
Travel time to work - 60 to 89 minutes (% change since 2000)
Travel time to work - 90 or more minutes (%)
Travel time to work - 90 or more minutes (% change since 2000)
Marital status - Never married (%)
Marital status - Now married (%)
Marital status - Separated (%)
Marital status - Widowed (%)
Marital status - Divorced (%)
Median family income ($)
Median family income (% change since 2000)
Median non-family income ($)
Median non-family income (% change since 2000)
Median per capita income ($)
Median per capita income (% change since 2000)
Median family income ($) - White
Median family income ($) - Black or African American
Median family income ($) - Asian
Median family income ($) - Hispanic or Latino
Median family income ($) - American Indian and Alaska Native
Median family income ($) - Multirace
Median family income ($) - Other Race
Median year house/condo built
Median year apartment built
Year house built - Built 2005 or later (%)
Year house built - Built 2000 to 2004 (%)
Year house built - Built 1990 to 1999 (%)
Year house built - Built 1980 to 1989 (%)
Year house built - Built 1970 to 1979 (%)
Year house built - Built 1960 to 1969 (%)
Year house built - Built 1950 to 1959 (%)
Year house built - Built 1940 to 1949 (%)
Year house built - Built 1939 or earlier (%)
Average household size
Household density (households per square mile)
Average household size - White
Average household size - Black or African American
Average household size - Asian
Average household size - Hispanic or Latino
Average household size - American Indian and Alaska Native
Average household size - Multirace
Average household size - Other Race
Occupied housing units (%)
Vacant housing units (%)
Owner occupied housing units (%)
Renter occupied housing units (%)
Vacancy status - For rent (%)
Vacancy status - For sale only (%)
Vacancy status - Rented or sold, not occupied (%)
Vacancy status - For seasonal, recreational, or occasional use (%)
Vacancy status - For migrant workers (%)
Vacancy status - Other vacant (%)
Residents with income below the poverty level (%)
Residents with income below 50% of the poverty level (%)
Children below poverty level (%)
Poor families by family type - Married-couple family (%)
Poor families by family type - Male, no wife present (%)
Poor families by family type - Female, no husband present (%)
Poverty status for native-born residents (%)
Poverty status for foreign-born residents (%)
Poverty among high school graduates not in families (%)
Poverty among people who did not graduate high school not in families (%)
Residents with income below the poverty level (%) - White
Residents with income below the poverty level (%) - Black or African American
Residents with income below the poverty level (%) - Asian
Residents with income below the poverty level (%) - Hispanic or Latino
Residents with income below the poverty level (%) - American Indian and Alaska Native
Residents with income below the poverty level (%) - Multirace
Residents with income below the poverty level (%) - Other Race
Air pollution - Air Quality Index (AQI)
Air pollution - CO
Air pollution - NO2
Air pollution - SO2
Air pollution - Ozone
Air pollution - PM10
Air pollution - PM25
Air pollution - Pb
Crime - Murders per 100,000 population
Crime - Rapes per 100,000 population
Crime - Robberies per 100,000 population
Crime - Assaults per 100,000 population
Crime - Burglaries per 100,000 population
Crime - Thefts per 100,000 population
Crime - Auto thefts per 100,000 population
Crime - Arson per 100,000 population
Crime - City-data.com crime index
Crime - Violent crime index
Crime - Property crime index
Crime - Murders per 100,000 population (5 year average)
Crime - Rapes per 100,000 population (5 year average)
Crime - Robberies per 100,000 population (5 year average)
Crime - Assaults per 100,000 population (5 year average)
Crime - Burglaries per 100,000 population (5 year average)
Crime - Thefts per 100,000 population (5 year average)
Crime - Auto thefts per 100,000 population (5 year average)
Crime - Arson per 100,000 population (5 year average)
Crime - City-data.com crime index (5 year average)
Crime - Violent crime index (5 year average)
Crime - Property crime index (5 year average)
1996 Presidential Elections Results (%) - Democratic Party (Clinton)
1996 Presidential Elections Results (%) - Republican Party (Dole)
1996 Presidential Elections Results (%) - Other
2000 Presidential Elections Results (%) - Democratic Party (Gore)
2000 Presidential Elections Results (%) - Republican Party (Bush)
2000 Presidential Elections Results (%) - Other
2004 Presidential Elections Results (%) - Democratic Party (Kerry)
2004 Presidential Elections Results (%) - Republican Party (Bush)
2004 Presidential Elections Results (%) - Other
2008 Presidential Elections Results (%) - Democratic Party (Obama)
2008 Presidential Elections Results (%) - Republican Party (McCain)
2008 Presidential Elections Results (%) - Other
2012 Presidential Elections Results (%) - Democratic Party (Obama)
2012 Presidential Elections Results (%) - Republican Party (Romney)
2012 Presidential Elections Results (%) - Other
2016 Presidential Elections Results (%) - Democratic Party (Clinton)
2016 Presidential Elections Results (%) - Republican Party (Trump)
2016 Presidential Elections Results (%) - Other
2020 Presidential Elections Results (%) - Democratic Party (Biden)
2020 Presidential Elections Results (%) - Republican Party (Trump)
2020 Presidential Elections Results (%) - Other
Ancestries Reported - Arab (%)
Ancestries Reported - Czech (%)
Ancestries Reported - Danish (%)
Ancestries Reported - Dutch (%)
Ancestries Reported - English (%)
Ancestries Reported - French (%)
Ancestries Reported - French Canadian (%)
Ancestries Reported - German (%)
Ancestries Reported - Greek (%)
Ancestries Reported - Hungarian (%)
Ancestries Reported - Irish (%)
Ancestries Reported - Italian (%)
Ancestries Reported - Lithuanian (%)
Ancestries Reported - Norwegian (%)
Ancestries Reported - Polish (%)
Ancestries Reported - Portuguese (%)
Ancestries Reported - Russian (%)
Ancestries Reported - Scotch-Irish (%)
Ancestries Reported - Scottish (%)
Ancestries Reported - Slovak (%)
Ancestries Reported - Subsaharan African (%)
Ancestries Reported - Swedish (%)
Ancestries Reported - Swiss (%)
Ancestries Reported - Ukrainian (%)
Ancestries Reported - United States (%)
Ancestries Reported - Welsh (%)
Ancestries Reported - West Indian (%)
Ancestries Reported - Other (%)
Educational Attainment - No schooling completed (%)
Educational Attainment - Less than high school (%)
Educational Attainment - High school or equivalent (%)
Educational Attainment - Less than 1 year of college (%)
Educational Attainment - 1 or more years of college (%)
Educational Attainment - Associate degree (%)
Educational Attainment - Bachelor's degree (%)
Educational Attainment - Master's degree (%)
Educational Attainment - Professional school degree (%)
Educational Attainment - Doctorate degree (%)
School Enrollment - Nursery, preschool (%)
School Enrollment - Kindergarten (%)
School Enrollment - Grade 1 to 4 (%)
School Enrollment - Grade 5 to 8 (%)
School Enrollment - Grade 9 to 12 (%)
School Enrollment - College undergrad (%)
School Enrollment - Graduate or professional (%)
School Enrollment - Not enrolled in school (%)
School enrollment - Public schools (%)
School enrollment - Private schools (%)
School enrollment - Not enrolled (%)
Median number of rooms in houses and condos
Median number of rooms in apartments
Housing units lacking complete plumbing facilities (%)
Housing units lacking complete kitchen facilities (%)
Density of houses
Urban houses (%)
Rural houses (%)
Households with people 60 years and over (%)
Households with people 65 years and over (%)
Households with people 75 years and over (%)
Households with one or more nonrelatives (%)
Households with no nonrelatives (%)
Population in households (%)
Family households (%)
Nonfamily households (%)
Population in families (%)
Family households with own children (%)
Median number of bedrooms in owner occupied houses
Mean number of bedrooms in owner occupied houses
Median number of bedrooms in renter occupied houses
Mean number of bedrooms in renter occupied houses
Median number of vehichles in owner occupied houses
Mean number of vehichles in owner occupied houses
Median number of vehichles in renter occupied houses
Mean number of vehichles in renter occupied houses
Mortgage status - with mortgage (%)
Mortgage status - with second mortgage (%)
Mortgage status - with home equity loan (%)
Mortgage status - with both second mortgage and home equity loan (%)
Mortgage status - without a mortgage (%)
Average family size
Average family size - White
Average family size - Black or African American
Average family size - Asian
Average family size - Hispanic or Latino
Average family size - American Indian and Alaska Native
Average family size - Multirace
Average family size - Other Race
Geographical mobility - Same house 1 year ago (%)
Geographical mobility - Moved within same county (%)
Geographical mobility - Moved from different county within same state (%)
Geographical mobility - Moved from different state (%)
Geographical mobility - Moved from abroad (%)
Place of birth - Born in state of residence (%)
Place of birth - Born in other state (%)
Place of birth - Native, outside of US (%)
Place of birth - Foreign born (%)
Housing units in structures - 1, detached (%)
Housing units in structures - 1, attached (%)
Housing units in structures - 2 (%)
Housing units in structures - 3 or 4 (%)
Housing units in structures - 5 to 9 (%)
Housing units in structures - 10 to 19 (%)
Housing units in structures - 20 to 49 (%)
Housing units in structures - 50 or more (%)
Housing units in structures - Mobile home (%)
Housing units in structures - Boat, RV, van, etc. (%)
House/condo owner moved in on average (years ago)
Renter moved in on average (years ago)
Year householder moved into unit - Moved in 1999 to March 2000 (%)
Year householder moved into unit - Moved in 1995 to 1998 (%)
Year householder moved into unit - Moved in 1990 to 1994 (%)
Year householder moved into unit - Moved in 1980 to 1989 (%)
Year householder moved into unit - Moved in 1970 to 1979 (%)
Year householder moved into unit - Moved in 1969 or earlier (%)
Means of transportation to work - Drove car alone (%)
Means of transportation to work - Carpooled (%)
Means of transportation to work - Public transportation (%)
Means of transportation to work - Bus or trolley bus (%)
Means of transportation to work - Streetcar or trolley car (%)
Means of transportation to work - Subway or elevated (%)
Means of transportation to work - Railroad (%)
Means of transportation to work - Ferryboat (%)
Means of transportation to work - Taxicab (%)
Means of transportation to work - Motorcycle (%)
Means of transportation to work - Bicycle (%)
Means of transportation to work - Walked (%)
Means of transportation to work - Other means (%)
Working at home (%)
Industry diversity
Most Common Industries - Agriculture, forestry, fishing and hunting, and mining (%)
Most Common Industries - Agriculture, forestry, fishing and hunting (%)
Most Common Industries - Mining, quarrying, and oil and gas extraction (%)
Most Common Industries - Construction (%)
Most Common Industries - Manufacturing (%)
Most Common Industries - Wholesale trade (%)
Most Common Industries - Retail trade (%)
Most Common Industries - Transportation and warehousing, and utilities (%)
Most Common Industries - Transportation and warehousing (%)
Most Common Industries - Utilities (%)
Most Common Industries - Information (%)
Most Common Industries - Finance and insurance, and real estate and rental and leasing (%)
Most Common Industries - Finance and insurance (%)
Most Common Industries - Real estate and rental and leasing (%)
Most Common Industries - Professional, scientific, and management, and administrative and waste management services (%)
Most Common Industries - Professional, scientific, and technical services (%)
Most Common Industries - Management of companies and enterprises (%)
Most Common Industries - Administrative and support and waste management services (%)
Most Common Industries - Educational services, and health care and social assistance (%)
Most Common Industries - Educational services (%)
Most Common Industries - Health care and social assistance (%)
Most Common Industries - Arts, entertainment, and recreation, and accommodation and food services (%)
Most Common Industries - Arts, entertainment, and recreation (%)
Most Common Industries - Accommodation and food services (%)
Most Common Industries - Other services, except public administration (%)
Most Common Industries - Public administration (%)
Occupation diversity
Most Common Occupations - Management, business, science, and arts occupations (%)
Most Common Occupations - Management, business, and financial occupations (%)
Most Common Occupations - Management occupations (%)
Most Common Occupations - Business and financial operations occupations (%)
Most Common Occupations - Computer, engineering, and science occupations (%)
Most Common Occupations - Computer and mathematical occupations (%)
Most Common Occupations - Architecture and engineering occupations (%)
Most Common Occupations - Life, physical, and social science occupations (%)
Most Common Occupations - Education, legal, community service, arts, and media occupations (%)
Most Common Occupations - Community and social service occupations (%)
Most Common Occupations - Legal occupations (%)
Most Common Occupations - Education, training, and library occupations (%)
Most Common Occupations - Arts, design, entertainment, sports, and media occupations (%)
Most Common Occupations - Healthcare practitioners and technical occupations (%)
Most Common Occupations - Health diagnosing and treating practitioners and other technical occupations (%)
Most Common Occupations - Health technologists and technicians (%)
Most Common Occupations - Service occupations (%)
Most Common Occupations - Healthcare support occupations (%)
Most Common Occupations - Protective service occupations (%)
Most Common Occupations - Fire fighting and prevention, and other protective service workers including supervisors (%)
Most Common Occupations - Law enforcement workers including supervisors (%)
Most Common Occupations - Food preparation and serving related occupations (%)
Most Common Occupations - Building and grounds cleaning and maintenance occupations (%)
Most Common Occupations - Personal care and service occupations (%)
Most Common Occupations - Sales and office occupations (%)
Most Common Occupations - Sales and related occupations (%)
Most Common Occupations - Office and administrative support occupations (%)
Most Common Occupations - Natural resources, construction, and maintenance occupations (%)
Most Common Occupations - Farming, fishing, and forestry occupations (%)
Most Common Occupations - Construction and extraction occupations (%)
Most Common Occupations - Installation, maintenance, and repair occupations (%)
Most Common Occupations - Production, transportation, and material moving occupations (%)
Most Common Occupations - Production occupations (%)
Most Common Occupations - Transportation occupations (%)
Most Common Occupations - Material moving occupations (%)
People in Group quarters - Institutionalized population (%)
People in Group quarters - Correctional institutions (%)
People in Group quarters - Federal prisons and detention centers (%)
People in Group quarters - Halfway houses (%)
People in Group quarters - Local jails and other confinement facilities (including police lockups) (%)
People in Group quarters - Military disciplinary barracks (%)
People in Group quarters - State prisons (%)
People in Group quarters - Other types of correctional institutions (%)
People in Group quarters - Nursing homes (%)
People in Group quarters - Hospitals/wards, hospices, and schools for the handicapped (%)
People in Group quarters - Hospitals/wards and hospices for chronically ill (%)
People in Group quarters - Hospices or homes for chronically ill (%)
People in Group quarters - Military hospitals or wards for chronically ill (%)
People in Group quarters - Other hospitals or wards for chronically ill (%)
People in Group quarters - Hospitals or wards for drug/alcohol abuse (%)
People in Group quarters - Mental (Psychiatric) hospitals or wards (%)
People in Group quarters - Schools, hospitals, or wards for the mentally retarded (%)
People in Group quarters - Schools, hospitals, or wards for the physically handicapped (%)
People in Group quarters - Institutions for the deaf (%)
People in Group quarters - Institutions for the blind (%)
People in Group quarters - Orthopedic wards and institutions for the physically handicapped (%)
People in Group quarters - Wards in general hospitals for patients who have no usual home elsewhere (%)
People in Group quarters - Wards in military hospitals for patients who have no usual home elsewhere (%)
People in Group quarters - Juvenile institutions (%)
People in Group quarters - Long-term care (%)
People in Group quarters - Homes for abused, dependent, and neglected children (%)
People in Group quarters - Residential treatment centers for emotionally disturbed children (%)
People in Group quarters - Training schools for juvenile delinquents (%)
People in Group quarters - Short-term care, detention or diagnostic centers for delinquent children (%)
People in Group quarters - Type of juvenile institution unknown (%)
People in Group quarters - Noninstitutionalized population (%)
People in Group quarters - College dormitories (includes college quarters off campus) (%)
People in Group quarters - Military quarters (%)
People in Group quarters - On base (%)
People in Group quarters - Barracks, unaccompanied personnel housing (UPH), (Enlisted/Officer), ;and similar group living quarters for military personnel (%)
People in Group quarters - Transient quarters for temporary residents (%)
People in Group quarters - Military ships (%)
People in Group quarters - Group homes (%)
People in Group quarters - Homes or halfway houses for drug/alcohol abuse (%)
People in Group quarters - Homes for the mentally ill (%)
People in Group quarters - Homes for the mentally retarded (%)
People in Group quarters - Homes for the physically handicapped (%)
People in Group quarters - Other group homes (%)
People in Group quarters - Religious group quarters (%)
People in Group quarters - Dormitories (%)
People in Group quarters - Agriculture workers' dormitories on farms (%)
People in Group quarters - Job Corps and vocational training facilities (%)
People in Group quarters - Other workers' dormitories (%)
People in Group quarters - Crews of maritime vessels (%)
People in Group quarters - Other nonhousehold living situations (%)
People in Group quarters - Other noninstitutional group quarters (%)
Residents speaking English at home (%)
Residents speaking English at home - Born in the United States (%)
Residents speaking English at home - Native, born elsewhere (%)
Residents speaking English at home - Foreign born (%)
Residents speaking Spanish at home (%)
Residents speaking Spanish at home - Born in the United States (%)
Residents speaking Spanish at home - Native, born elsewhere (%)
Residents speaking Spanish at home - Foreign born (%)
Residents speaking other language at home (%)
Residents speaking other language at home - Born in the United States (%)
Residents speaking other language at home - Native, born elsewhere (%)
Residents speaking other language at home - Foreign born (%)
Class of Workers - Employee of private company (%)
Class of Workers - Self-employed in own incorporated business (%)
Class of Workers - Private not-for-profit wage and salary workers (%)
Class of Workers - Local government workers (%)
Class of Workers - State government workers (%)
Class of Workers - Federal government workers (%)
Class of Workers - Self-employed workers in own not incorporated business and Unpaid family workers (%)
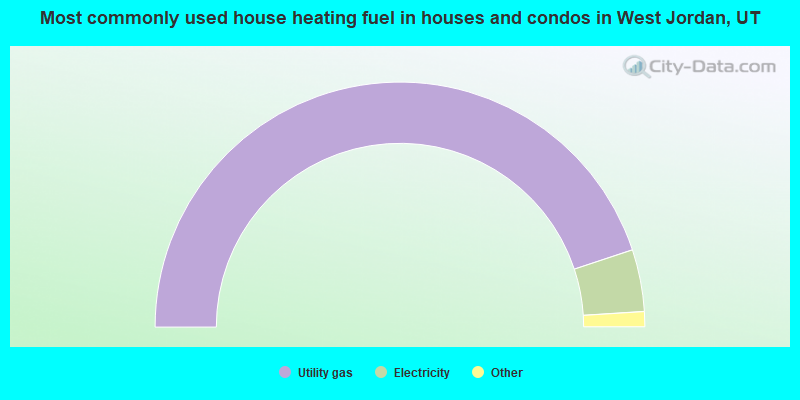
House heating fuel used in houses and condos - Utility gas (%)
House heating fuel used in houses and condos - Bottled, tank, or LP gas (%)
House heating fuel used in houses and condos - Electricity (%)
House heating fuel used in houses and condos - Fuel oil, kerosene, etc. (%)
House heating fuel used in houses and condos - Coal or coke (%)
House heating fuel used in houses and condos - Wood (%)
House heating fuel used in houses and condos - Solar energy (%)
House heating fuel used in houses and condos - Other fuel (%)
House heating fuel used in houses and condos - No fuel used (%)
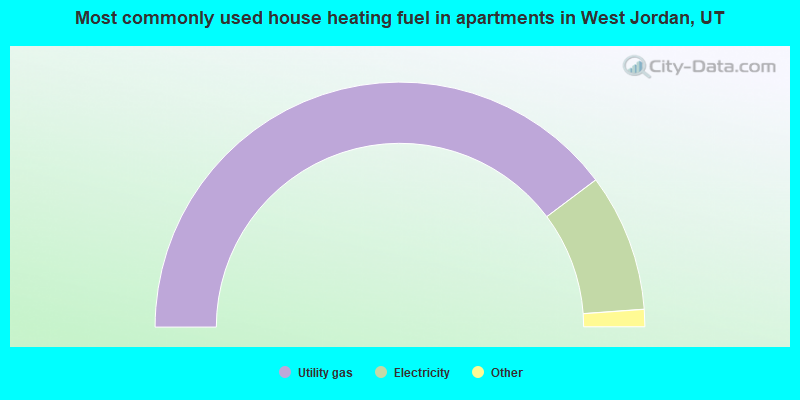
House heating fuel used in apartments - Utility gas (%)
House heating fuel used in apartments - Bottled, tank, or LP gas (%)
House heating fuel used in apartments - Electricity (%)
House heating fuel used in apartments - Fuel oil, kerosene, etc. (%)
House heating fuel used in apartments - Coal or coke (%)
House heating fuel used in apartments - Wood (%)
House heating fuel used in apartments - Solar energy (%)
House heating fuel used in apartments - Other fuel (%)
House heating fuel used in apartments - No fuel used (%)
Armed forces status - In Armed Forces (%)
Armed forces status - Civilian (%)
Armed forces status - Civilian - Veteran (%)
Armed forces status - Civilian - Nonveteran (%)
Fatal accidents locations in years 2005-2021
Fatal accidents locations in 2005
Fatal accidents locations in 2006
Fatal accidents locations in 2007
Fatal accidents locations in 2008
Fatal accidents locations in 2009
Fatal accidents locations in 2010
Fatal accidents locations in 2011
Fatal accidents locations in 2012
Fatal accidents locations in 2013
Fatal accidents locations in 2014
Fatal accidents locations in 2015
Fatal accidents locations in 2016
Fatal accidents locations in 2017
Fatal accidents locations in 2018
Fatal accidents locations in 2019
Fatal accidents locations in 2020
Fatal accidents locations in 2021
Alcohol use - People drinking some alcohol every month (%)
Alcohol use - People not drinking at all (%)
Alcohol use - Average days/month drinking alcohol
Alcohol use - Average drinks/week
Alcohol use - Average days/year people drink much
Audiometry - Average condition of hearing (%)
Audiometry - People that can hear a whisper from across a quiet room (%)
Audiometry - People that can hear normal voice from across a quiet room (%)
Audiometry - Ears ringing, roaring, buzzing (%)
Audiometry - Had a job exposure to loud noise (%)
Audiometry - Had off-work exposure to loud noise (%)
Blood Pressure & Cholesterol - Has high blood pressure (%)
Blood Pressure & Cholesterol - Checking blood pressure at home (%)
Blood Pressure & Cholesterol - Frequently checking blood cholesterol (%)
Blood Pressure & Cholesterol - Has high cholesterol level (%)
Consumer Behavior - Money monthly spent on food at supermarket/grocery store
Consumer Behavior - Money monthly spent on food at other stores
Consumer Behavior - Money monthly spent on eating out
Consumer Behavior - Money monthly spent on carryout/delivered foods
Consumer Behavior - Income spent on food at supermarket/grocery store (%)
Consumer Behavior - Income spent on food at other stores (%)
Consumer Behavior - Income spent on eating out (%)
Consumer Behavior - Income spent on carryout/delivered foods (%)
Current Health Status - General health condition (%)
Current Health Status - Blood donors (%)
Current Health Status - Has blood ever tested for HIV virus (%)
Current Health Status - Left-handed people (%)
Dermatology - People using sunscreen (%)
Diabetes - Diabetics (%)
Diabetes - Had a blood test for high blood sugar (%)
Diabetes - People taking insulin (%)
Diet Behavior & Nutrition - Diet health (%)
Diet Behavior & Nutrition - Milk product consumption (# of products/month)
Diet Behavior & Nutrition - Meals not home prepared (#/week)
Diet Behavior & Nutrition - Meals from fast food or pizza place (#/week)
Diet Behavior & Nutrition - Ready-to-eat foods (#/month)
Diet Behavior & Nutrition - Frozen meals/pizza (#/month)
Drug Use - People that ever used marijuana or hashish (%)
Drug Use - Ever used hard drugs (%)
Drug Use - Ever used any form of cocaine (%)
Drug Use - Ever used heroin (%)
Drug Use - Ever used methamphetamine (%)
Health Insurance - People covered by health insurance (%)
Kidney Conditions-Urology - Avg. # of times urinating at night
Medical Conditions - People with asthma (%)
Medical Conditions - People with anemia (%)
Medical Conditions - People with psoriasis (%)
Medical Conditions - People with overweight (%)
Medical Conditions - Elderly people having difficulties in thinking or remembering (%)
Medical Conditions - People who ever received blood transfusion (%)
Medical Conditions - People having trouble seeing even with glass/contacts (%)
Medical Conditions - People with arthritis (%)
Medical Conditions - People with gout (%)
Medical Conditions - People with congestive heart failure (%)
Medical Conditions - People with coronary heart disease (%)
Medical Conditions - People with angina pectoris (%)
Medical Conditions - People who ever had heart attack (%)
Medical Conditions - People who ever had stroke (%)
Medical Conditions - People with emphysema (%)
Medical Conditions - People with thyroid problem (%)
Medical Conditions - People with chronic bronchitis (%)
Medical Conditions - People with any liver condition (%)
Medical Conditions - People who ever had cancer or malignancy (%)
Mental Health - People who have little interest in doing things (%)
Mental Health - People feeling down, depressed, or hopeless (%)
Mental Health - People who have trouble sleeping or sleeping too much (%)
Mental Health - People feeling tired or having little energy (%)
Mental Health - People with poor appetite or overeating (%)
Mental Health - People feeling bad about themself (%)
Mental Health - People who have trouble concentrating on things (%)
Mental Health - People moving or speaking slowly or too fast (%)
Mental Health - People having thoughts they would be better off dead (%)
Oral Health - Average years since last visit a dentist
Oral Health - People embarrassed because of mouth (%)
Oral Health - People with gum disease (%)
Oral Health - General health of teeth and gums (%)
Oral Health - Average days a week using dental floss/device
Oral Health - Average days a week using mouthwash for dental problem
Oral Health - Average number of teeth
Pesticide Use - Households using pesticides to control insects (%)
Pesticide Use - Households using pesticides to kill weeds (%)
Physical Activity - People doing vigorous-intensity work activities (%)
Physical Activity - People doing moderate-intensity work activities (%)
Physical Activity - People walking or bicycling (%)
Physical Activity - People doing vigorous-intensity recreational activities (%)
Physical Activity - People doing moderate-intensity recreational activities (%)
Physical Activity - Average hours a day doing sedentary activities
Physical Activity - Average hours a day watching TV or videos
Physical Activity - Average hours a day using computer
Physical Functioning - People having limitations keeping them from working (%)
Physical Functioning - People limited in amount of work they can do (%)
Physical Functioning - People that need special equipment to walk (%)
Physical Functioning - People experiencing confusion/memory problems (%)
Physical Functioning - People requiring special healthcare equipment (%)
Prescription Medications - Average number of prescription medicines taking
Preventive Aspirin Use - Adults 40+ taking low-dose aspirin (%)
Reproductive Health - Vaginal deliveries (%)
Reproductive Health - Cesarean deliveries (%)
Reproductive Health - Deliveries resulted in a live birth (%)
Reproductive Health - Pregnancies resulted in a delivery (%)
Reproductive Health - Women breastfeeding newborns (%)
Reproductive Health - Women that had a hysterectomy (%)
Reproductive Health - Women that had both ovaries removed (%)
Reproductive Health - Women that have ever taken birth control pills (%)
Reproductive Health - Women taking birth control pills (%)
Reproductive Health - Women that have ever used Depo-Provera or injectables (%)
Reproductive Health - Women that have ever used female hormones (%)
Sexual Behavior - People 18+ that ever had sex (vaginal, anal, or oral) (%)
Sexual Behavior - Males 18+ that ever had vaginal sex with a woman (%)
Sexual Behavior - Males 18+ that ever performed oral sex on a woman (%)
Sexual Behavior - Males 18+ that ever had anal sex with a woman (%)
Sexual Behavior - Males 18+ that ever had any sex with a man (%)
Sexual Behavior - Females 18+ that ever had vaginal sex with a man (%)
Sexual Behavior - Females 18+ that ever performed oral sex on a man (%)
Sexual Behavior - Females 18+ that ever had anal sex with a man (%)
Sexual Behavior - Females 18+ that ever had any kind of sex with a woman (%)
Sexual Behavior - Average age people first had sex
Sexual Behavior - Average number of female sex partners in lifetime (males 18+)
Sexual Behavior - Average number of female vaginal sex partners in lifetime (males 18+)
Sexual Behavior - Average age people first performed oral sex on a woman (18+)
Sexual Behavior - Average number of woman performed oral sex on in lifetime (18+)
Sexual Behavior - Average number of male sex partners in lifetime (males 18+)
Sexual Behavior - Average number of male anal sex partners in lifetime (males 18+)
Sexual Behavior - Average age people first performed oral sex on a man (18+)
Sexual Behavior - Average number of male oral sex partners in lifetime (18+)
Sexual Behavior - People using protection when performing oral sex (%)
Sexual Behavior - Average number of times people have vaginal or anal sex a year
Sexual Behavior - People having sex without condom (%)
Sexual Behavior - Average number of male sex partners in lifetime (females 18+)
Sexual Behavior - Average number of male vaginal sex partners in lifetime (females 18+)
Sexual Behavior - Average number of female sex partners in lifetime (females 18+)
Sexual Behavior - Circumcised males 18+ (%)
Sleep Disorders - Average hours sleeping at night
Sleep Disorders - People that has trouble sleeping (%)
Smoking-Cigarette Use - People smoking cigarettes (%)
Taste & Smell - People 40+ having problems with smell (%)
Taste & Smell - People 40+ having problems with taste (%)
Taste & Smell - People 40+ that ever had wisdom teeth removed (%)
Taste & Smell - People 40+ that ever had tonsils teeth removed (%)
Taste & Smell - People 40+ that ever had a loss of consciousness because of a head injury (%)
Taste & Smell - People 40+ that ever had a broken nose or other serious injury to face or skull (%)
Taste & Smell - People 40+ that ever had two or more sinus infections (%)
Weight - Average height (inches)
Weight - Average weight (pounds)
Weight - Average BMI
Weight - People that are obese (%)
Weight - People that ever were obese (%)
Weight - People trying to lose weight (%)
According to our research of Utah and other state lists, there were 168 registered sex offenders living in West Jordan, Utah as of April 27, 2024 . The ratio of all residents to sex offenders in West Jordan is 677 to 1.The ratio of registered sex offenders to all residents in this city is lower than the state average.
The City-Data.com crime index weighs serious crimes and violent crimes more heavily. Higher means more crime, U.S. average is 246.1. It adjusts for the number of visitors and daily workers commuting into cities.
- means the value is smaller than the state average.
- means the value is about the same as the state average.
- means the value is bigger than the state average.
- means the value is much bigger than the state average.
Crime rate in West Jordan detailed stats: murders, rapes, robberies, assaults, burglaries, thefts, arson Officers per 1,000 residents here:
0.98Utah average:
1.67
Latest news from West Jordan, UT collected exclusively by city-data.com from local newspapers, TV, and radio stations
Ancestries: English (19.1%), American (8.4%), European (4.8%), German (4.1%), Irish (2.9%), British (2.2%).
Current Local Time:
Incorporated on 01/10/1941
Land area: 30.9 square miles.
Population density: 3,775 people per square mile (average).
14,461 residents are foreign born (8.5% Latin America , 2.0% Asia ).
Median real estate property taxes paid for housing units with mortgages in 2022: $2,515 (0.5%)Median real estate property taxes paid for housing units with no mortgage in 2022: $2,252 (0.5%)
Nearest city with pop. 200,000+: Las Vegas, NV
Nearest city with pop. 1,000,000+: Phoenix, AZ
Nearest cities:
Latitude: 40.61 N, Longitude: 111.98 W
Daytime population change due to commuting: -23,140 (-19.8%)Workers who live and work in this city: 24,182 (37.6%)
Area code commonly used in this area: 801
West Jordan tourist attractions:
Single-family new house construction building permits:
2022: 170 buildings , average cost: $337,6002021: 463 buildings , average cost: $307,9002020: 353 buildings , average cost: $273,0002019: 335 buildings , average cost: $259,2002018: 424 buildings , average cost: $245,8002017: 452 buildings , average cost: $255,4002016: 385 buildings , average cost: $265,1002015: 370 buildings , average cost: $260,5002014: 281 buildings , average cost: $240,6002013: 273 buildings , average cost: $237,6002012: 263 buildings , average cost: $228,3002011: 158 buildings , average cost: $199,9002010: 185 buildings , average cost: $177,6002009: 173 buildings , average cost: $189,8002008: 102 buildings , average cost: $217,7002007: 184 buildings , average cost: $239,2002006: 560 buildings , average cost: $200,0002005: 858 buildings , average cost: $159,9002004: 742 buildings , average cost: $152,8002003: 1107 buildings , average cost: $148,7002002: 441 buildings , average cost: $122,7002001: 373 buildings , average cost: $140,5002000: 434 buildings , average cost: $135,4001999: 758 buildings , average cost: $134,7001998: 844 buildings , average cost: $144,7001997: 713 buildings , average cost: $126,600Unemployment in December 2023: Earthquake activity:
West Jordan-area historical earthquake activity is significantly above Utah state average. It is 2220% greater than the overall U.S. average. On 8/18/1959 at 06:37:13, a magnitude 7.7 (7.7 UK, Class: Major, Intensity: VIII - XII) earthquake occurred 282.0 miles away from the city center, causing $26,000,000 total damage On 10/3/1915 at 06:52:48, a magnitude 7.6 (7.6 UK) earthquake occurred 290.3 miles away from the city center On 10/28/1983 at 14:06:06, a magnitude 7.3 (6.2 MB, 7.3 MS, 7.0 MW) earthquake occurred 257.5 miles away from the city center, causing 2 deaths ( 2 shaking deaths) and 3 injuries, causing $15,000,000 total damage On 3/28/1975 at 02:31:05, a magnitude 6.2 (6.1 MB, 6.0 MS, 6.2 ML, Class: Strong, Intensity: VII - IX) earthquake occurred 100.6 miles away from West Jordan center On 3/18/2020 at 13:09:31, a magnitude 5.7 (5.7 MW, Depth: 7.4 mi, Class: Moderate, Intensity: VI - VII) earthquake occurred 11.3 miles away from West Jordan center On 12/21/1932 at 06:10:09, a magnitude 7.2 (7.2 UK) earthquake occurred 356.4 miles away from the city center Magnitude types: body-wave magnitude (MB), local magnitude (ML), surface-wave magnitude (MS), moment magnitude (MW) Natural disasters: The number of natural disasters in Salt Lake County (9) is smaller than the US average (15).Major Disasters (Presidential) Declared: 4Emergencies Declared: 1Floods: 3, Storms: 3, Fires: 2, Landslides: 2, Earthquake: 1, Hurricane: 1, Mudslide: 1, Tornado: 1, Other: 1 (Note: some incidents may be assigned to more than one category). Hospitals and medical centers in West Jordan: JORDAN VALLEY MEDICAL CENTER (Voluntary non-profit - Other, provides emergency services, 3580 WEST 9000 SOUTH) RIVENDELL OF UTAH (5899 WEST RIVENDELL DRIVE) WEST JORDAN CARE CENTER (3350 WEST 7800 SOUTH) COPPER RIDGE HEALTH CARE (3706 WEST 9000 SOUTH)
LIBERTY DIALYSIS WEST JORDAN (3823 W 9000 S STE D)
ANGEL TOUCH HOME HEALTH CARE, INC (4705 ODIN LANE)
COMMUNITY NURSING SERVICES (6271 SOUTH DIXIE DRIVE)
HEARTWOOD HOME HEALTH (6671 SOUTH REDWOOD ROAD)
Heliports located in West Jordan: Amtrak station near West Jordan: 12 miles: SALT LAKE CITY (320 S. RIO GRANDE ST.) Services: ticket office, fully wheelchair accessible, enclosed waiting area, public restrooms, public payphones, vending machines, free short-term parking, free long-term parking, call for car rental service, taxi stand.
Colleges/Universities in West Jordan: Broadview University-West Jordan Full-time enrollment: 240; Location: 1902 W 7800 S; Private, for-profit; Website: www.broadviewuniversity.edu; Offers Master's degree )
Taylor Andrews Academy of Hair Design-West Jordan Full-time enrollment: 77; Location: 9052 South 1510 West; Private, for-profit; Website: www.taylorandrew.com/)
Colleges/universities with over 2000 students nearest to West Jordan:
Salt Lake Community College (about 5 miles; Salt Lake City, UT ; Full-time enrollment: 20,797)
Stevens-Henager College-Murray (about 6 miles; Murray, UT ; FT enrollment: 6,395)
Western Governors University (about 8 miles; Salt Lake City, UT ; FT enrollment: 31,481)
Westminster College (about 11 miles; Salt Lake City, UT ; FT enrollment: 2,870)
Latter-day Saints Business College (about 13 miles; Salt Lake City, UT ; FT enrollment: 2,059)
University of Utah (about 13 miles; Salt Lake City, UT ; FT enrollment: 28,454)
Utah Valley University (about 27 miles; Orem, UT ; FT enrollment: 24,403)
Biggest public high schools in West Jordan: COPPER HILLS HIGH Students: 2,360, Location: 5445 W 7800 S, Grades: 10-12)WEST JORDAN HIGH Students: 1,827, Location: 8136 S 2700 W, Grades: 10-12)SUNSET RIDGE MIDDLE Students: 1,279, Location: 6881 W 8200 S, Grades: 7-9)WEST HILLS MIDDLE Students: 1,157, Location: 8270 SO 5290 W, Grades: 7-9)WEST JORDAN MIDDLE Students: 975, Location: 7550 S 1700 W, Grades: 7-9)JOEL P JENSEN MIDDLE Students: 819, Location: 8105 S 3200 W, Grades: 7-9)SOUTH VALLEY SCHOOL Students: 117, Location: 8400 S 1700 W, Grades: 9-12)ITINERIS EARLY COLLEGE HIGH Location: 8714 ROY DEL CIRCLE, Grades: 10-12, Charter school )
HAWTHORN ACADEMY Location: 9062 S 2200 W, Grades: KG-9, Charter school )
MOUNTAIN HEIGHTS ACADEMY Location: 9067 S 1300 W SUITE 204, Grades: 7-12, Charter school )
Private high schools in West Jordan: COPPER HILLS YOUTH CENTER Students: 99, Location: 5899 RIVENDELL DR, Grades: 7-12)
WEST RIDGE ACADEMY Students: 80, Location: 5500 BAGLEY PARK RD, Grades: 6-12)
Biggest public elementary/middle schools in West Jordan: RIVERSIDE SCHOOL Students: 1,978, Location: 8737 S 1220 W, Grades: KG-6)OAKCREST SCHOOL Students: 1,292, Location: 8462 S HILLTOP OAK DR, Grades: KG-6)HAYDEN PEAK SCHOOL Students: 1,194, Location: 5120 W HAYDEN PEAK DR, Grades: KG-6)MOUNTAIN SHADOWS SCHOOL Students: 1,081, Location: 5255 W 7000 S, Grades: KG-6)JORDAN HILLS SCHOOL Students: 1,025, Location: 8892 S 4800 W, Grades: KG-6)FALCON RIDGE SCHOOL Students: 884, Location: 6111 W 7000 S, Grades: KG-6)COPPER CANYON SCHOOL Students: 823, Location: 8917 S COPPERWOOD DR, Grades: KG-6)OQUIRRH SCHOOL Students: 791, Location: 7165 S 3285 W, Grades: KG-6)MAJESTIC SCHOOL Students: 755, Location: 7430 S 1700 W, Grades: KG-6)COLUMBIA SCHOOL Students: 748, Location: 3505 W 7800 S, Grades: KG-6)Private elementary/middle school in West Jordan: CHILDREN S CHRISTIAN SCHOOL Students: 119, Location: 3138 W 7000 S, Grades: PK-8)
See full list of schools located in West Jordan
Notable locations in West Jordan: (A) , Jordan Industrial Center (B) , Gardner Mountain View Golf Course (C) , Bingham Canyon Industrial Park (D) , Redwood Village (E) , E J Garn Aviation Complex (F) , West Jordan City Fire Department Station 53 (G) , West Jordan City Fire Department Station 54 (H) , West Jordan City Fire Department Station 55 (I) , West Jordan City Fire Department Station 52 (J) . Display/hide their locations on the map
Shopping Centers: (1) , River Pointe Plaza Shopping Center (2) , Redwood Village Shopping Center (3) , Jordan Square Shopping Center (4) , Jordan Landing Shopping Center (5) , Gardner Historic Village Shopping Center (6) , Briarwood Center Shopping Center (7) . Display/hide their locations on the map
Churches in West Jordan include: (A) , Saint Joseph the Worker Catholic Church (B) , Sonrise Baptist Church (C) , Trinity Baptist Church (D) , The Church of Jesus Christ of Latter Day Saints (E) . Display/hide their locations on the map
Cemeteries: (1) , Redwood Memorial Estates (2) , West Jordan City Cemetery (3) . Display/hide their locations on the map
Streams, rivers, and creeks: (A) , Barneys Wash (B) , Barneys Creek (C) . Display/hide their locations on the map
Park in West Jordan: (1) . Display/hide its location on the map
Tourist attractions: (1) , Manhattan Pizza (Amusement & Theme Parks; 8021 South Redwood Road) (2) , All-Star Lanes (Arcades & Amusements; 1776 W 7800 S) (3) . Display/hide their approximate locations on the map
Hotels: (1) , River Oaks Apartments & Suites (9035 South 1075 West) (2) , All Seasons (7729.Ebrier Laurie In) (3) . Display/hide their approximate locations on the map
Court: (1) . Display/hide its approximate location on the map
Birthplace of: Gene Fullmer - Boxer, DaMarques Johnson - Martial artist, Jordan Halliday - Vegan, Martin Casaus - Professional wrestler, Rad Martinez - Martial artist, Jack Roberts - College football player (Southern Utah Thunderbirds), Sealver Siliga - Football player.
Salt Lake County has a predicted average indoor radon screening level between 2 and 4 pCi/L (pico curies per liter) - Moderate Potential Drinking water stations with addresses in West Jordan and their reported violations in the past:
S AND W TRAILER PARK (Population served: 300, Groundwater):
Past monitoring violations:
Follow-up Or Routine LCR Tap M/R - In JAN-01-2002, Contaminant: Lead and Copper Rule. Follow-up actions: St Compliance achieved (JUL-15-2010)
One regular monitoring violation
Drinking water stations with addresses in West Jordan that have no violations reported:
JORDAN VALLEY WCD (Population served: 82,500, Primary Water Source Type: Surface water)
Average household size: This city:
3.5 peopleUtah:
3.1 people
Percentage of family households: This city:
83.0%Whole state:
75.2%
Percentage of households with unmarried partners: This city:
5.2%Whole state:
4.6%
Likely homosexual households (counted as self-reported same-sex unmarried-partner households)
Lesbian couples: 0.4% of all households Gay men: 0.3% of all households
People in group quarters in West Jordan in 2010:
211 people in residential treatment centers for juveniles (non-correctional)
162 people in nursing facilities/skilled-nursing facilities
40 people in other noninstitutional facilities
34 people in group homes intended for adults
21 people in workers' group living quarters and job corps centers
19 people in correctional facilities intended for juveniles
13 people in residential treatment centers for adults
2 people in local jails and other municipal confinement facilities
People in group quarters in West Jordan in 2000:
129 people in nursing homes
97 people in training schools for juvenile delinquents
90 people in homes for the mentally retarded
51 people in homes or halfway houses for drug/alcohol abuse
14 people in homes for the physically handicapped
10 people in residential treatment centers for emotionally disturbed children
4 people in religious group quarters
Banks with branches in West Jordan (2011 data):
JPMorgan Chase Bank, National Association: West Jordan Branch, Jordan Landing Banking Center Branch, West Jordon City Hall Branch. Info updated 2011/11/10: Bank assets: $1,811,678.0 mil, Deposits: $1,190,738.0 mil, headquarters in Columbus, OH, positive income , International Specialization, 5577 total offices , Holding Company: Jpmorgan Chase & Co.
Wells Fargo Bank, National Association: West Jordan Branch, Jordan Landing Branch, 90th South Branch. Info updated 2011/04/05: Bank assets: $1,161,490.0 mil, Deposits: $905,653.0 mil, headquarters in Sioux Falls, SD, positive income , 6395 total offices , Holding Company: Wells Fargo & Company
U.S. Bank National Association: 90th South Smith's Branch, West Jordan Smith's Branch, West Jordan Branch. Info updated 2012/01/30: Bank assets: $330,470.8 mil, Deposits: $236,091.5 mil, headquarters in Cincinnati, OH, positive income , 3121 total offices , Holding Company: U.S. Bancorp
Zions First National Bank: West Jordan/Copper Hills Office at 3913 West 9000 South, branch established on 1997/11/12; West Jordan Branch at 1835 West 7800 South, branch established on 1976/12/03. Info updated 2006/11/03: Bank assets: $17,531.3 mil, Deposits: $14,905.3 mil, headquarters in Salt Lake City, UT, positive income , Commercial Lending Specialization, 151 total offices , Holding Company: Zions Bancorporation
KeyBank National Association: West Jordan Branch at 1435 W 9000 S, branch established on 1993/10/04; 70th South Keycenter Branch at 1607 7000 South, branch established on 2001/10/22. Info updated 2008/03/03: Bank assets: $86,198.8 mil, Deposits: $64,214.8 mil, headquarters in Cleveland, OH, positive income , Commercial Lending Specialization, 1067 total offices , Holding Company: Keycorp
For population 15 years and over in West Jordan:
Never married: 31.1%Now married: 54.3%Separated: 1.2%Widowed: 3.5%Divorced: 9.9% For population 25 years and over in West Jordan:
High school or higher: 90.6%Bachelor's degree or higher: 26.7%Graduate or professional degree: 8.6%Unemployed: 4.2%Mean travel time to work (commute): 18.5 minutes
Education Gini index (Inequality in education) Here:
10.2Utah average:
10.9
Religion statistics for West Jordan, UT (based on Salt Lake County data)
Religion Adherents Congregations Other 622,807 1,452 Catholic 84,342 24 Evangelical Protestant 27,497 144 Mainline Protestant 12,789 38 Orthodox 5,352 7 Black Protestant 1,302 6 None 275,566 -
Source: Clifford Grammich, Kirk Hadaway, Richard Houseal, Dale E.Jones, Alexei Krindatch, Richie Stanley and Richard H.Taylor. 2012. 2010 U.S.Religion Census: Religious Congregations & Membership Study. Association of Statisticians of American Religious Bodies. Jones, Dale E., et al. 2002. Congregations and Membership in the United States 2000. Nashville, TN: Glenmary Research Center. Graphs represent county-level data
Food Environment Statistics: Number of grocery stores : 146This county :
1.45 / 10,000 pop.Utah :
1.37 / 10,000 pop.
Number of supercenters and club stores : 16Salt Lake County :
0.16 / 10,000 pop.State :
0.18 / 10,000 pop.
Number of convenience stores (no gas) : 47Here :
0.47 / 10,000 pop.State :
0.41 / 10,000 pop.
Number of convenience stores (with gas) : 246Salt Lake County :
2.45 / 10,000 pop.Utah :
2.82 / 10,000 pop.
Number of full-service restaurants : 558Salt Lake County :
5.55 / 10,000 pop.Utah :
5.09 / 10,000 pop.
Adult diabetes rate : Salt Lake County :
6.5%Utah :
6.3%
Adult obesity rate : This county :
22.7%Utah :
23.6%
Health and Nutrition: Healthy diet rate : West Jordan:
47.9%Utah:
48.9%
Average overall health of teeth and gums : West Jordan:
46.4%Utah:
47.0%
Average BMI : West Jordan:
28.6Utah:
28.4
People feeling badly about themselves : People not drinking alcohol at all : West Jordan:
10.1%Utah:
10.3%
Average hours sleeping at night : Overweight people : West Jordan:
31.8%State:
31.9%
General health condition : This city:
57.6%State:
57.4%
Average condition of hearing : West Jordan:
81.7%Utah:
80.1%
More about Health and Nutrition of West Jordan, UT Residents
Local government employment and payroll (March 2022)
Function
Full-time employees
Monthly full-time payroll
Average yearly full-time wage
Part-time employees
Monthly part-time payroll
Police Protection - Officers
123 $812,492 $79,268 0 $0 Firefighters
90 $603,256 $80,434 0 $0 Other and Unallocable
62 $424,948 $82,248 1 $715 Other Government Administration
36 $190,163 $63,388 11 $6,992 Sewerage
29 $137,932 $57,075 0 $0 Streets and Highways
28 $134,438 $57,616 0 $0 Police - Other
26 $107,893 $49,797 86 $86,875 Judicial and Legal
25 $171,592 $82,364 1 $3,547 Water Supply
22 $99,550 $54,300 0 $0 Parks and Recreation
16 $80,159 $60,119 2 $3,426 Financial Administration
12 $80,403 $80,403 1 $128
Totals for Government
469 $2,842,826 $72,738 102 $101,683
West Jordan government finances - Expenditure in 2021 (per resident):
Construction - Parks and Recreation: $5,878,000 ($50.38)
Water Utilities: $5,482,000 ($46.99)Housing and Community Development: $3,044,000 ($26.09)General - Other: $2,779,000 ($23.82)Regular Highways: $2,543,000 ($21.80)Financial Administration: $1,857,000 ($15.92)Sewerage: $1,572,000 ($13.47)Central Staff Services: $201,000 ($1.72)General Public Buildings: $18,000 ($0.15)Solid Waste Management: $4,000 ($0.03)Transit Utilities: $2,000 ($0.02)Current Operations - Police Protection: $16,595,000 ($142.25)
Water Utilities: $14,607,000 ($125.21)Local Fire Protection: $10,280,000 ($88.12)Sewerage: $9,947,000 ($85.26)General - Other: $9,115,000 ($78.13)Central Staff Services: $8,382,000 ($71.85)Parks and Recreation: $7,191,000 ($61.64)Solid Waste Management: $5,443,000 ($46.66)Regular Highways: $3,518,000 ($30.15)Judicial and Legal Services: $2,527,000 ($21.66)Financial Administration: $2,384,000 ($20.43)Transit Utilities: $2,133,000 ($18.28)Housing and Community Development: $1,264,000 ($10.83)Protective Inspection and Regulation - Other: $583,000 ($5.00)General - Interest on Debt: $2,885,000 ($24.73)
Other Capital Outlay - General - Other: $302,000 ($2.59)
Police Protection: $105,000 ($0.90)Parks and Recreation: $22,000 ($0.19)Financial Administration: $15,000 ($0.13)Total Salaries and Wages: $61,474,000 ($526.93)
West Jordan government finances - Revenue in 2021 (per resident):
Charges - Other: $63,009,000 ($540.09)
Sewerage: $1,161,000 ($9.95)Miscellaneous Commercial Activities: $243,000 ($2.08)Federal Intergovernmental - General Local Government Support: $3,436,000 ($29.45)
Other: $1,864,000 ($15.98)Local Intergovernmental - General Local Government Support: $450,000 ($3.86)
Miscellaneous - General Revenue - Other: $1,336,000 ($11.45)
Fines and Forfeits: $1,126,000 ($9.65)Rents: $566,000 ($4.85)Donations From Private Sources: $231,000 ($1.98)Interest Earnings: $132,000 ($1.13)Special Assessments: $97,000 ($0.83)Sale of Property: $23,000 ($0.20)Revenue - Water Utilities: $1,639,000 ($14.05)
State Intergovernmental - Highways: $3,365,000 ($28.84)
General Local Government Support: $12,000 ($0.10)Tax - General Sales and Gross Receipts: $23,487,000 ($201.32)
Property: $9,473,000 ($81.20)Public Utilities Sales: $6,775,000 ($58.07)Other License: $3,095,000 ($26.53)Occupation and Business License - Other: $699,000 ($5.99)Other Selective Sales: $45,000 ($0.39)
West Jordan government finances - Debt in 2021 (per resident):
Long Term Debt - Beginning Outstanding - Unspecified Public Purpose: $72,126,000 ($618.24)
Outstanding Unspecified Public Purpose: $62,896,000 ($539.12)Retired Unspecified Public Purpose: $16,510,000 ($141.52)Issue, Unspecified Public Purpose: $7,280,000 ($62.40)
West Jordan government finances - Cash and Securities in 2021 (per resident):
Bond Funds - Cash and Securities: $35,518,000 ($304.45)
Other Funds - Cash and Securities: $76,726,000 ($657.67)
Sinking Funds - Cash and Securities: $2,000 ($0.02)
6.29% of this county's 2021 resident taxpayers lived in other counties in 2020 ($73,956 average adjusted gross income )
Here:
6.29%Utah average:
7.95%
0.01% of residents moved from foreign countries ($111 average AGI )Salt Lake County:
0.01%Utah average:
0.02%
Top counties from which taxpayers relocated into this county between 2020 and 2021:
6.63% of this county's 2020 resident taxpayers moved to other counties in 2021 ($71,033 average adjusted gross income )
Here:
6.63%Utah average:
7.39%
0.01% of residents moved to foreign countries ($100 average AGI )Salt Lake County:
0.01%Utah average:
0.02%
Top counties to which taxpayers relocated from this county between 2020 and 2021:
Businesses in West Jordan, UT
Name Count Name Count
24 Hour Fitness 1 Little Caesars Pizza 4 7-Eleven 4 Lowe's 1 AT&T 3 MasterBrand Cabinets 7 Aeropostale 1 Maurices 1 Applebee's 1 McDonald's 5 Arby's 2 Men's Wearhouse 1 AutoZone 2 New Balance 2 Barnes & Noble 1 Nike 6 Bath & Body Works 1 Office Depot 1 Bed Bath & Beyond 1 OfficeMax 1 Big O Tires 1 Old Navy 1 Blockbuster 2 Panda Express 2 Burger King 2 Papa John's Pizza 1 Carl\s Jr. 2 Payless 3 Chick-Fil-A 1 PetSmart 1 Cold Stone Creamery 1 Pier 1 Imports 1 Cricket Wireless 2 Pizza Hut 1 Curves 1 RadioShack 2 Dairy Queen 1 Rue21 1 Decora Cabinetry 2 SONIC Drive-In 1 Discount Tire 1 Sam's Club 1 Domino's Pizza 1 Sears 3 DressBarn 1 Shoe Carnival 1 Dressbarn 1 Sprint Nextel 1 Famous Footwear 1 Starbucks 2 FedEx 7 Subway 4 Firestone Complete Auto Care 1 T-Mobile 2 GNC 2 T.J.Maxx 1 GameStop 2 Taco Bell 2 H&R Block 3 Target 2 Home Depot 1 The Room Place 1 IHOP 1 U-Haul 1 Jamba Juice 1 UPS 5 Kmart 1 Verizon Wireless 2 Kohl's 1 Village Inn 1 Kroger 4 Walgreens 1 La-Z-Boy 1 Walmart 1 Lane Bryant 1
Strongest AM radio stations in West Jordan:
KLLB (1510 AM; daytime; 10 kW; WEST JORDAN, UT; Owner: UNITED SECURITY FINANCIAL, INC.)
KIQN (1010 AM; 50 kW; TOOELE, UT)
KTKK (630 AM; 10 kW; SANDY, UT; Owner: UNITED BROADCASTING COMPANY)
KFNZ (1320 AM; 5 kW; SALT LAKE CITY, UT; Owner: CITADEL BROADCASTING COMPANY)
KSL (1160 AM; 50 kW; SALT LAKE CITY, UT; Owner: BONNEVILLE HOLDING COMPANY)
KBEE (860 AM; 10 kW; SALT LAKE CITY, UT; Owner: CITADEL BROADCASTING COMPANY)
KKDS (1060 AM; 10 kW; SOUTH SALT LAKE, UT; Owner: HOLIDAY BROADCASTING COMPANY)
KALL (700 AM; 50 kW; NORTH SALT LAKE CITY, UT; Owner: CITICASTERS LICENSES, L.P.)
KWDZ (910 AM; 5 kW; SALT LAKE CITY, UT; Owner: ABC, INC.)
KBJA (1640 AM; 10 kW; SANDY, UT; Owner: UNITED BROADCASTING COMPANY, INC)
KMRI (1550 AM; 10 kW; WEST VALLEY CITY, UT; Owner: KMRI RADIO, LLC)
KSOP (1370 AM; 5 kW; SOUTH SALT LAKE, UT; Owner: KSOP, INC.)
KNRS (570 AM; 5 kW; SALT LAKE CITY, UT; Owner: CITICASTERS LICENSES, L.P.)
Strongest FM radio stations in West Jordan:
KUER-FM (90.1 FM; SALT LAKE CITY, UT; Owner: UNIVERSITY OF UTAH)
KBYU-FM (89.1 FM; PROVO, UT; Owner: BRIGHAM YOUNG UNIVERSITY)
KODJ (94.1 FM; SALT LAKE CITY, UT; Owner: CITICASTERS LICENSES, L.P.)
KURR (99.5 FM; BOUNTIFUL, UT; Owner: CITICASTERS LICENSES, L.P.)
KBEE-FM (98.7 FM; SALT LAKE CITY, UT; Owner: CITADEL BROADCASTING COMPANY)
KSOP-FM (104.3 FM; SALT LAKE CITY, UT; Owner: KSOP, INC.)
K248AK (97.5 FM; DRAPER, UT; Owner: CITICASTERS LICENSES, L.P.)
K272DP (102.3 FM; TOOELE, UT; Owner: FAMILY STATIONS, INC.)
KRCL (90.9 FM; SALT LAKE CITY, UT; Owner: LISTENERS COMMUNITY RADIO OF UTAH)
KBZN (97.9 FM; OGDEN, UT; Owner: CAPITOL BROADCASTING, INC.)
KOSY-FM (106.5 FM; SPANISH FORK, UT; Owner: MERCURY BROADCASTING COMPANY, INC.)
KRSP-FM (103.5 FM; SALT LAKE CITY, UT; Owner: SIMMONS-SLC, LS, LLC)
KBER (101.1 FM; OGDEN, UT; Owner: CITADEL BROADCASTING COMPANY)
KISN-FM (97.1 FM; SALT LAKE CITY, UT; Owner: CLEAR CHANNEL BROADCASTING LICENSES, INC.)
KKAT (101.9 FM; OGDEN, UT; Owner: CITICASTERS LICENSES, L.P.)
KSFI (100.3 FM; SALT LAKE CITY, UT; Owner: SIMMONS-SLC, LS, LLC)
KUBL-FM (93.3 FM; SALT LAKE CITY, UT; Owner: CITADEL BROADCASTING COMPANY)
KCPX (105.7 FM; CENTERVILLE, UT; Owner: MERCURY BROADCASTING COMPANY, INC.)
KXRK (96.3 FM; PROVO, UT; Owner: SIMMONS-SLC, LS, LLC)
KQMB (102.7 FM; MIDVALE, UT; Owner: SIMMONS-SLC, LS, LLC)
TV broadcast stations around West Jordan:
KUTV (Channel 2; SALT LAKE CITY, UT; Owner: KUTV HOLDINGS, INC.)
KULC (Channel 9; OGDEN, UT; Owner: UTAH STATE BOARD OF REGENTS)
KUED (Channel 7; SALT LAKE CITY, UT; Owner: UNIVERSITY OF UTAH)
KBYU-TV (Channel 11; PROVO, UT; Owner: BRIGHAM YOUNG UNIVERSITY)
KEJT-LP (Channel 48; SALT LAKE CITY, UT; Owner: TELEMUNDO OF NORTHERN CALIFORNIA LICENSE CORP.)
K59GS (Channel 59; SALT LAKE CITY, UT; Owner: ALPHA & OMEGA COMMUNICATIONS, LLC)
KSL-TV (Channel 5; SALT LAKE CITY, UT; Owner: BONNEVILLE HOLDING COMPANY)
KUWB (Channel 30; OGDEN, UT; Owner: ACME TV LICENSES OF UTAH, LLC)
KTVX (Channel 4; SALT LAKE CITY, UT; Owner: CLEAR CHANNEL BROADCASTING LICENSES, INC.)
KJZZ-TV (Channel 14; SALT LAKE CITY, UT; Owner: LARRY H. MILLER COMMUNICATIONS CORP.)
KSTU (Channel 13; SALT LAKE CITY, UT; Owner: FOX TELEVISION STATIONS INC.)
KTMW (Channel 20; SALT LAKE CITY, UT; Owner: ALPHA & OMEGA COMMUNICATIONS, LLC)
KUBX-LP (Channel 58; SALT LAKE CITY, UT; Owner: EQUITY BROADCASTING CORPORATION)
K66FN (Channel 66; SALT LAKE CITY, UT; Owner: AZTECA BROADCASTING CORPORATION)
K68FY (Channel 68; SALT LAKE CITY, UT; Owner: PRICE BROADCASTING, INC.)
KUCL-LP (Channel 26; SALT LAKE CITY, UT; Owner: CHRISTIAN LIFE BROADCASTING)
K18FJ (Channel 18; SALT LAKE CITY, UT; Owner: NATIONAL MINORITY T.V., INC.)
National Bridge Inventory (NBI) Statistics 40 Number of bridges236ft / 71.6m Total length1,093,258 Total average daily traffic198,790 Total average daily truck traffic
New bridges - historical statistics
1 1930-1939 1 1940-1949 1 1950-1959 1 1960-1969 1 1970-1979 3 1980-1989 9 1990-1999 2 2000-2009 21 2010-2019
See full National Bridge Inventory statistics for West Jordan, UT
Home Mortgage Disclosure Act Aggregated Statistics For Year 2009(Based on 11 full and 7 partial tracts) A) FHA, FSA/RHS & VA B) Conventional C) Refinancings D) Home Improvement Loans F) Non-occupant Loans on G) Loans On Manufactured Number Average Value Number Average Value Number Average Value Number Average Value Number Average Value Number Average Value
LOANS ORIGINATED 679 $208,478 299 $183,873 3,655 $192,317 76 $96,298 69 $146,303 14 $76,287 APPLICATIONS APPROVED, NOT ACCEPTED 48 $219,482 33 $181,796 412 $204,528 19 $51,934 12 $140,981 4 $55,168 APPLICATIONS DENIED 92 $202,767 42 $181,889 949 $209,429 51 $74,536 43 $160,474 21 $65,881 APPLICATIONS WITHDRAWN 62 $214,143 37 $188,152 600 $210,400 30 $108,961 11 $164,696 2 $100,860 FILES CLOSED FOR INCOMPLETENESS 12 $195,416 5 $198,124 121 $210,639 9 $150,286 5 $272,398 0 $0
Aggregated Statistics For Year 2008(Based on 11 full and 7 partial tracts) A) FHA, FSA/RHS & VA B) Conventional C) Refinancings D) Home Improvement Loans E) Loans on Dwellings For 5+ Families F) Non-occupant Loans on G) Loans On Manufactured Number Average Value Number Average Value Number Average Value Number Average Value Number Average Value Number Average Value Number Average Value
LOANS ORIGINATED 486 $214,564 592 $201,049 2,501 $197,369 156 $88,267 2 $10,680,885 118 $171,712 26 $74,312 APPLICATIONS APPROVED, NOT ACCEPTED 23 $211,459 61 $208,297 379 $199,899 31 $76,823 1 $13,200,000 26 $160,957 2 $30,500 APPLICATIONS DENIED 67 $225,521 160 $191,236 1,128 $207,765 202 $104,054 0 $0 106 $150,717 21 $55,066 APPLICATIONS WITHDRAWN 85 $216,812 61 $220,174 542 $207,676 55 $139,284 0 $0 29 $173,690 2 $125,335 FILES CLOSED FOR INCOMPLETENESS 7 $230,183 16 $232,499 77 $194,852 17 $113,322 0 $0 5 $226,778 1 $76,090
Aggregated Statistics For Year 2007(Based on 11 full and 7 partial tracts) A) FHA, FSA/RHS & VA B) Conventional C) Refinancings D) Home Improvement Loans E) Loans on Dwellings For 5+ Families F) Non-occupant Loans on G) Loans On Manufactured Number Average Value Number Average Value Number Average Value Number Average Value Number Average Value Number Average Value Number Average Value
LOANS ORIGINATED 175 $201,310 1,820 $180,233 2,982 $173,668 361 $89,486 4 $10,342,210 296 $165,758 22 $82,766 APPLICATIONS APPROVED, NOT ACCEPTED 9 $204,204 264 $179,657 501 $173,214 70 $92,982 0 $0 46 $151,304 3 $25,207 APPLICATIONS DENIED 34 $218,319 596 $200,310 1,225 $181,249 262 $95,886 0 $0 146 $171,241 30 $45,150 APPLICATIONS WITHDRAWN 19 $192,112 152 $197,986 523 $183,571 83 $133,889 0 $0 40 $144,711 5 $119,012 FILES CLOSED FOR INCOMPLETENESS 3 $218,067 47 $190,553 133 $192,063 9 $139,256 0 $0 10 $183,348 0 $0
Aggregated Statistics For Year 2006(Based on 11 full and 7 partial tracts) A) FHA, FSA/RHS & VA B) Conventional C) Refinancings D) Home Improvement Loans E) Loans on Dwellings For 5+ Families F) Non-occupant Loans on G) Loans On Manufactured Number Average Value Number Average Value Number Average Value Number Average Value Number Average Value Number Average Value Number Average Value
LOANS ORIGINATED 267 $171,313 3,433 $139,067 3,015 $142,266 314 $66,544 1 $475,750 720 $134,047 25 $80,938 APPLICATIONS APPROVED, NOT ACCEPTED 14 $153,944 444 $134,272 556 $141,796 76 $69,738 0 $0 103 $114,582 9 $85,730 APPLICATIONS DENIED 40 $178,526 891 $132,194 1,220 $142,882 238 $67,749 1 $960 182 $130,248 46 $63,804 APPLICATIONS WITHDRAWN 17 $184,031 387 $138,550 716 $152,806 62 $114,469 0 $0 97 $129,054 3 $133,510 FILES CLOSED FOR INCOMPLETENESS 0 $0 96 $140,877 189 $162,354 11 $74,158 0 $0 12 $169,560 0 $0
Aggregated Statistics For Year 2005(Based on 11 full and 7 partial tracts) A) FHA, FSA/RHS & VA B) Conventional C) Refinancings D) Home Improvement Loans E) Loans on Dwellings For 5+ Families F) Non-occupant Loans on G) Loans On Manufactured Number Average Value Number Average Value Number Average Value Number Average Value Number Average Value Number Average Value Number Average Value
LOANS ORIGINATED 404 $157,532 3,369 $114,919 2,490 $131,565 171 $55,383 4 $1,560,668 471 $111,425 30 $49,671 APPLICATIONS APPROVED, NOT ACCEPTED 23 $161,942 387 $112,881 488 $125,856 29 $44,424 0 $0 69 $124,155 10 $70,115 APPLICATIONS DENIED 51 $153,551 846 $106,429 1,266 $129,735 224 $44,109 0 $0 144 $110,994 46 $73,577 APPLICATIONS WITHDRAWN 29 $152,827 596 $117,121 756 $140,797 80 $131,763 3 $754,753 116 $124,617 11 $33,033 FILES CLOSED FOR INCOMPLETENESS 5 $189,158 99 $109,152 396 $161,774 10 $82,805 0 $0 16 $110,974 0 $0
Aggregated Statistics For Year 2004(Based on 11 full and 7 partial tracts) A) FHA, FSA/RHS & VA B) Conventional C) Refinancings D) Home Improvement Loans E) Loans on Dwellings For 5+ Families F) Non-occupant Loans on G) Loans On Manufactured Number Average Value Number Average Value Number Average Value Number Average Value Number Average Value Number Average Value Number Average Value
LOANS ORIGINATED 630 $152,762 2,233 $117,890 2,665 $135,256 145 $43,768 2 $5,010,000 243 $111,650 13 $60,480 APPLICATIONS APPROVED, NOT ACCEPTED 15 $145,710 373 $117,537 523 $127,045 29 $48,090 0 $0 37 $109,188 7 $81,064 APPLICATIONS DENIED 90 $146,696 576 $107,054 1,245 $131,332 165 $38,486 0 $0 81 $113,800 38 $57,098 APPLICATIONS WITHDRAWN 53 $147,692 232 $120,743 697 $142,159 36 $28,084 1 $397,690 43 $106,757 6 $53,840 FILES CLOSED FOR INCOMPLETENESS 8 $173,129 50 $128,833 262 $151,266 8 $37,196 0 $0 6 $116,975 0 $0
Aggregated Statistics For Year 2003(Based on 11 full and 7 partial tracts) A) FHA, FSA/RHS & VA B) Conventional C) Refinancings D) Home Improvement Loans F) Non-occupant Loans on Number Average Value Number Average Value Number Average Value Number Average Value Number Average Value
LOANS ORIGINATED 758 $144,507 1,537 $127,541 5,851 $131,723 122 $31,198 220 $113,788 APPLICATIONS APPROVED, NOT ACCEPTED 21 $154,392 215 $121,100 738 $130,789 25 $25,332 45 $107,429 APPLICATIONS DENIED 63 $139,772 300 $112,044 1,303 $129,806 119 $19,845 71 $103,625 APPLICATIONS WITHDRAWN 46 $140,850 142 $127,961 884 $143,581 22 $23,380 36 $105,587 FILES CLOSED FOR INCOMPLETENESS 10 $142,849 57 $122,609 228 $140,616 7 $32,790 8 $132,354
Aggregated Statistics For Year 2002(Based on 1 full and 3 partial tracts) A) FHA, FSA/RHS & VA B) Conventional C) Refinancings D) Home Improvement Loans F) Non-occupant Loans on Number Average Value Number Average Value Number Average Value Number Average Value Number Average Value
LOANS ORIGINATED 135 $132,787 264 $123,408 1,058 $127,480 28 $35,084 93 $120,080 APPLICATIONS APPROVED, NOT ACCEPTED 5 $115,716 45 $123,630 125 $132,084 5 $55,450 6 $92,632 APPLICATIONS DENIED 22 $145,940 67 $101,849 238 $130,090 23 $16,752 8 $121,830 APPLICATIONS WITHDRAWN 11 $134,473 29 $127,328 201 $132,416 4 $18,770 13 $113,756 FILES CLOSED FOR INCOMPLETENESS 4 $128,070 13 $112,748 59 $135,669 1 $58,960 3 $128,767
Aggregated Statistics For Year 2001(Based on 1 full and 3 partial tracts) A) FHA, FSA/RHS & VA B) Conventional C) Refinancings D) Home Improvement Loans E) Loans on Dwellings For 5+ Families F) Non-occupant Loans on Number Average Value Number Average Value Number Average Value Number Average Value Number Average Value Number Average Value
LOANS ORIGINATED 157 $128,649 243 $133,853 844 $122,383 27 $30,235 1 $630,350 30 $110,419 APPLICATIONS APPROVED, NOT ACCEPTED 3 $145,870 32 $144,855 93 $118,925 14 $28,489 0 $0 4 $111,725 APPLICATIONS DENIED 10 $125,711 47 $97,253 255 $117,433 29 $18,919 0 $0 11 $108,227 APPLICATIONS WITHDRAWN 8 $138,938 20 $129,968 183 $124,219 15 $38,597 0 $0 4 $128,825 FILES CLOSED FOR INCOMPLETENESS 1 $181,620 6 $122,257 64 $135,373 1 $63,120 0 $0 1 $203,720
Aggregated Statistics For Year 2000(Based on 1 full and 3 partial tracts) A) FHA, FSA/RHS & VA B) Conventional C) Refinancings D) Home Improvement Loans F) Non-occupant Loans on Number Average Value Number Average Value Number Average Value Number Average Value Number Average Value
LOANS ORIGINATED 122 $124,078 265 $126,952 223 $101,248 39 $25,469 15 $95,302 APPLICATIONS APPROVED, NOT ACCEPTED 4 $99,840 36 $91,692 46 $91,735 13 $27,091 1 $16,850 APPLICATIONS DENIED 13 $116,551 72 $98,153 167 $90,666 35 $22,810 0 $0 APPLICATIONS WITHDRAWN 13 $122,395 42 $140,245 100 $104,801 5 $27,154 1 $74,960 FILES CLOSED FOR INCOMPLETENESS 2 $132,705 20 $120,427 53 $117,629 1 $28,120 1 $55,650
Aggregated Statistics For Year 1999(Based on 4 full and 5 partial tracts) A) FHA, FSA/RHS & VA B) Conventional C) Refinancings D) Home Improvement Loans E) Loans on Dwellings For 5+ Families F) Non-occupant Loans on Number Average Value Number Average Value Number Average Value Number Average Value Number Average Value Number Average Value
LOANS ORIGINATED 605 $130,850 1,018 $125,708 1,707 $98,172 175 $25,189 1 $9,454,590 70 $102,651 APPLICATIONS APPROVED, NOT ACCEPTED 13 $112,018 124 $98,189 338 $100,505 29 $19,255 0 $0 12 $106,938 APPLICATIONS DENIED 40 $131,862 334 $101,103 758 $96,258 131 $22,507 0 $0 16 $97,078 APPLICATIONS WITHDRAWN 38 $127,736 191 $117,824 539 $104,456 35 $52,264 0 $0 16 $82,142 FILES CLOSED FOR INCOMPLETENESS 9 $123,782 44 $125,610 324 $113,390 0 $0 0 $0 10 $84,484
Detailed mortgage data for all 18 tracts in West Jordan, UT
Private Mortgage Insurance Companies Aggregated Statistics For Year 2009(Based on 11 full and 7 partial tracts) A) Conventional B) Refinancings C) Non-occupant Loans on Number Average Value Number Average Value Number Average Value
LOANS ORIGINATED 68 $232,621 129 $231,950 0 $0 APPLICATIONS APPROVED, NOT ACCEPTED 34 $237,905 68 $239,604 2 $194,920 APPLICATIONS DENIED 8 $221,322 31 $228,119 0 $0 APPLICATIONS WITHDRAWN 5 $194,062 21 $220,121 0 $0 FILES CLOSED FOR INCOMPLETENESS 0 $0 3 $282,743 0 $0
Aggregated Statistics For Year 2008(Based on 11 full and 7 partial tracts) A) Conventional B) Refinancings C) Non-occupant Loans on Number Average Value Number Average Value Number Average Value
LOANS ORIGINATED 251 $226,666 213 $236,178 21 $220,654 APPLICATIONS APPROVED, NOT ACCEPTED 93 $237,227 87 $260,844 8 $262,708 APPLICATIONS DENIED 19 $196,244 26 $249,616 14 $213,656 APPLICATIONS WITHDRAWN 13 $209,437 10 $225,588 4 $147,025 FILES CLOSED FOR INCOMPLETENESS 3 $248,530 3 $242,240 2 $228,825
Aggregated Statistics For Year 2007(Based on 11 full and 7 partial tracts) A) Conventional B) Refinancings C) Non-occupant Loans on D) Loans On Manufactured Number Average Value Number Average Value Number Average Value Number Average Value
LOANS ORIGINATED 546 $231,306 218 $233,169 44 $221,145 2 $108,665 APPLICATIONS APPROVED, NOT ACCEPTED 51 $225,780 35 $238,591 5 $221,406 0 $0 APPLICATIONS DENIED 10 $239,177 2 $270,175 4 $189,162 0 $0 APPLICATIONS WITHDRAWN 28 $236,766 13 $246,558 5 $226,694 0 $0 FILES CLOSED FOR INCOMPLETENESS 0 $0 2 $217,755 0 $0 0 $0
Aggregated Statistics For Year 2006(Based on 11 full and 7 partial tracts) A) Conventional B) Refinancings C) Non-occupant Loans on D) Loans On Manufactured Number Average Value Number Average Value Number Average Value Number Average Value
LOANS ORIGINATED 293 $199,618 148 $200,141 40 $183,362 1 $56,700 APPLICATIONS APPROVED, NOT ACCEPTED 21 $213,936 29 $183,593 5 $203,454 0 $0 APPLICATIONS DENIED 5 $175,240 5 $162,484 3 $134,443 0 $0 APPLICATIONS WITHDRAWN 12 $252,859 9 $213,528 0 $0 0 $0 FILES CLOSED FOR INCOMPLETENESS 0 $0 1 $150,120 0 $0 0 $0
Aggregated Statistics For Year 2005(Based on 11 full and 7 partial tracts) A) Conventional B) Refinancings C) Non-occupant Loans on D) Loans On Manufactured Number Average Value Number Average Value Number Average Value Number Average Value
LOANS ORIGINATED 249 $172,549 207 $175,671 33 $159,908 3 $95,667 APPLICATIONS APPROVED, NOT ACCEPTED 37 $186,257 35 $174,564 8 $156,656 0 $0 APPLICATIONS DENIED 7 $150,421 2 $185,325 3 $157,087 0 $0 APPLICATIONS WITHDRAWN 14 $156,373 12 $161,935 5 $152,668 0 $0 FILES CLOSED FOR INCOMPLETENESS 1 $167,810 1 $98,990 1 $84,870 0 $0
Aggregated Statistics For Year 2004(Based on 11 full and 7 partial tracts) A) Conventional B) Refinancings C) Non-occupant Loans on D) Loans On Manufactured Number Average Value Number Average Value Number Average Value Number Average Value
LOANS ORIGINATED 253 $164,594 299 $165,248 25 $135,053 3 $92,167 APPLICATIONS APPROVED, NOT ACCEPTED 44 $157,591 92 $165,099 4 $153,740 0 $0 APPLICATIONS DENIED 3 $168,113 6 $152,827 0 $0 0 $0 APPLICATIONS WITHDRAWN 21 $166,325 39 $158,172 6 $174,422 0 $0 FILES CLOSED FOR INCOMPLETENESS 1 $236,000 2 $180,215 1 $91,070 0 $0
Aggregated Statistics For Year 2003(Based on 11 full and 7 partial tracts) A) Conventional B) Refinancings C) Non-occupant Loans on Number Average Value Number Average Value Number Average Value
LOANS ORIGINATED 390 $162,959 919 $159,245 40 $133,790 APPLICATIONS APPROVED, NOT ACCEPTED 54 $155,637 214 $160,124 12 $119,815 APPLICATIONS DENIED 4 $144,360 18 $154,851 3 $104,100 APPLICATIONS WITHDRAWN 12 $147,215 73 $172,120 12 $172,546 FILES CLOSED FOR INCOMPLETENESS 0 $0 2 $159,670 0 $0
Aggregated Statistics For Year 2002(Based on 1 full and 3 partial tracts) A) Conventional B) Refinancings C) Non-occupant Loans on Number Average Value Number Average Value Number Average Value
LOANS ORIGINATED 98 $139,025 176 $163,436 12 $125,067 APPLICATIONS APPROVED, NOT ACCEPTED 13 $135,098 26 $168,701 3 $139,127 APPLICATIONS DENIED 5 $143,316 3 $169,580 2 $162,965 APPLICATIONS WITHDRAWN 5 $116,976 12 $146,879 3 $134,570 FILES CLOSED FOR INCOMPLETENESS 1 $100,230 2 $131,230 0 $0
Aggregated Statistics For Year 2001(Based on 1 full and 3 partial tracts) A) Conventional B) Refinancings C) Non-occupant Loans on Number Average Value Number Average Value Number Average Value
LOANS ORIGINATED 82 $167,972 150 $159,314 2 $123,805 APPLICATIONS APPROVED, NOT ACCEPTED 15 $177,762 33 $149,242 1 $119,330 APPLICATIONS DENIED 2 $129,070 11 $167,746 0 $0 APPLICATIONS WITHDRAWN 1 $171,710 3 $110,320 0 $0 FILES CLOSED FOR INCOMPLETENESS 1 $150,990 2 $94,570 0 $0
Aggregated Statistics For Year 2000(Based on 1 full and 3 partial tracts) A) Conventional B) Refinancings C) Non-occupant Loans on Number Average Value Number Average Value Number Average Value
LOANS ORIGINATED 106 $157,602 36 $140,152 3 $100,590 APPLICATIONS APPROVED, NOT ACCEPTED 8 $143,519 8 $126,250 2 $91,115 APPLICATIONS DENIED 4 $103,570 2 $112,870 1 $82,550 APPLICATIONS WITHDRAWN 2 $158,980 2 $151,045 0 $0 FILES CLOSED FOR INCOMPLETENESS 1 $95,460 0 $0 0 $0
Aggregated Statistics For Year 1999(Based on 4 full and 5 partial tracts) A) Conventional B) Refinancings C) Non-occupant Loans on Number Average Value Number Average Value Number Average Value
LOANS ORIGINATED 499 $143,178 302 $136,173 10 $115,110 APPLICATIONS APPROVED, NOT ACCEPTED 30 $132,194 65 $137,822 0 $0 APPLICATIONS DENIED 34 $137,661 20 $139,433 2 $153,470 APPLICATIONS WITHDRAWN 11 $136,772 22 $137,315 0 $0 FILES CLOSED FOR INCOMPLETENESS 8 $129,420 10 $137,259 0 $0
Fire-safe hotels and motels in West Jordan, Utah:
Hampton Inn And Suites West Jordan/Salt Lake City, 3923 W Ctr Park Dr, West Jordan, Utah 84084 Phone: (801) 280-7300, Fax: (801) 280-1815
Hotel Barons, JLA, LLC dba West Jordan My Place Hotel, 7424 S Campus View Dr, West jordan, Utah 84084 Phone: (855) 200-5685, Fax: (801) 285-5207
Residence Inn, 7558 S Plz Center Dr, West jordan, Utah 84084 Phone: (801) 282-1800, Fax: (801) 282-1805
All 3 fire-safe hotels and motels in West Jordan, Utah
Most common first names in West Jordan, UT among deceased individuals Name Count Lived (average)
John 54 69.1 years Mary 51 78.6 years James 49 71.5 years William 48 69.4 years Robert 45 68.1 years George 32 79.4 years Richard 31 59.5 years Dorothy 29 77.1 years Joseph 28 77.0 years Kenneth 26 69.2 years
Most common last names in West Jordan, UT among deceased individuals Last name Count Lived (average)
Smith 43 68.6 years Johnson 29 77.1 years Peterson 29 72.4 years Anderson 27 79.2 years Jones 26 75.9 years Williams 24 71.1 years Christensen 20 71.2 years Gardner 20 75.4 years Martinez 19 70.4 years Brown 19 69.5 years
West Jordan compared to Utah state average:
Unemployed percentage significantly below state average. Black race population percentage above state average. Hispanic race population percentage above state average. Foreign-born population percentage significantly above state average. House age below state average. West Jordan on our top lists :
#9 on the list of "Top 101 cities with the smallest household incomes disparities (population 50,000+)"
#9 on the list of "Top 101 cities with the smallest percentage of high school students in private schools (3,000+ students)"
#10 on the list of "Top 101 cities with the most cars per house, population 50,000+"
#10 on the list of "Top 101 cities with the highest percentage of family households, population 100,000+"
#13 on the list of "Top 101 cities with the least people having professional degrees (population 50,000+)"
#14 on the list of "Top 101 cities with the highest ratio of rapes to murders between 2002 and 2012 (population 50,000+)"
#29 on the list of "Top 101 cities with the least people having Doctorate degrees (population 50,000+)"
#34 on the list of "Top 101 cities with the lowest number of police officers per 1000 residents (population 50,000+)"
#37 on the list of "Top 100 cities with biggest houses (pop. 50,000+)"
#38 on the list of "Top 101 cities with the smallest percentage of elementary and middle school students in private schools (5,000+ students)"
#39 on the list of "Top 101 cities with the smallest house values disparities (population 50,000+)"
#39 on the list of "Top 100 highest located cities (pop. 50,000+)"
#39 on the list of "Top 100 low-educated but high-earning cities (pop. 50,000+)"
#43 on the list of "Top 101 cities with largest percentage of females in industries: transportation and warehousing (population 50,000+)"
#44 on the list of "Top 101 cities with largest percentage of females in occupations: production occupations (population 50,000+)"
#46 on the list of "Top 100 cities with youngest residents (pop. 50,000+)"
#47 on the list of "Top 101 cities with the lowest minimum monthly morning or afternoon humidity (population 50,000+)"
#54 on the list of "Top 101 cities with the largest percentage population increase from 2000 (population 50,000+)"
#59 on the list of "Top 101 cities with the least people below 50% of the poverty level (population 50,000+)"
#61 on the list of "Top 101 cities with largest percentage of females in occupations: material moving occupations (population 50,000+)"
#1 on the list of "Top 101 counties with the most Other adherents"
#1 on the list of "Top 101 counties with the most Other congregations"
#4 on the list of "Top 101 counties with the lowest percentage of residents that smoked 100+ cigarettes in their lives"
#11 on the list of "Top 101 counties with the highest Nitrogen Dioxide air pollution readings in 2012 (ppm)"
#14 on the list of "Top 101 counties with the highest number of births per 1000 residents 2007-2013"
Top Patent Applicants
Sai Bhavaraju (69)
James Pan (28)
Dean E. Probst (23)
Steven Bandis (15)
James V. Mercer (14)
Robert J. Purtell (12)
Dean Probst (12)
Kevin S. Warner (12)
Aaron Gelter (12)
Steve Pierce (11)
Total of 784 patent applications in 2008-2024.
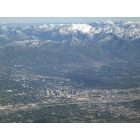
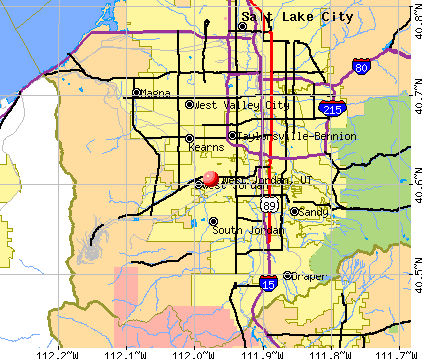


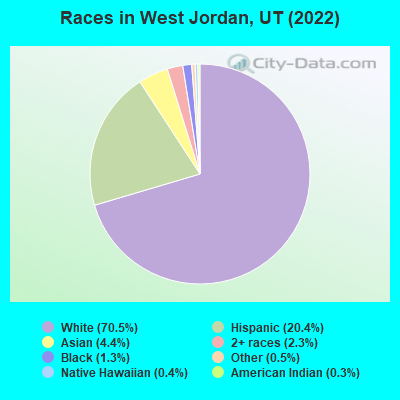
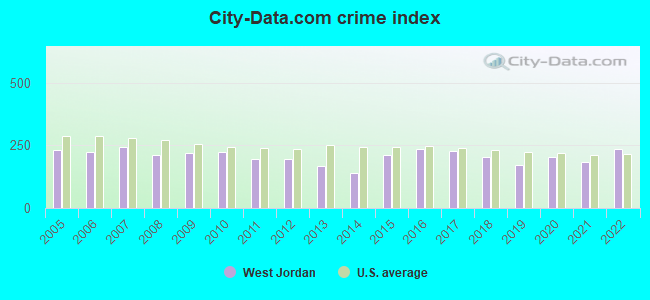
 Recent articles from our blog. Our writers, many of them Ph.D. graduates or candidates, create easy-to-read articles on a wide variety of topics.

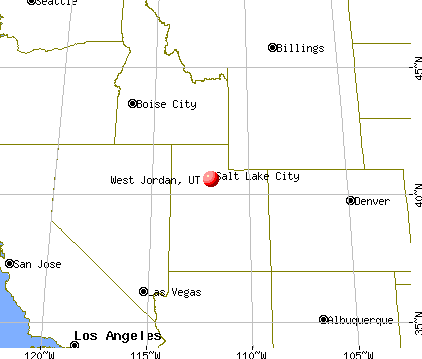
 (352.2 miles
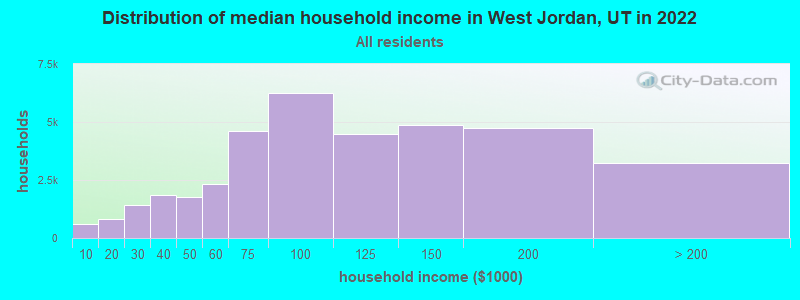
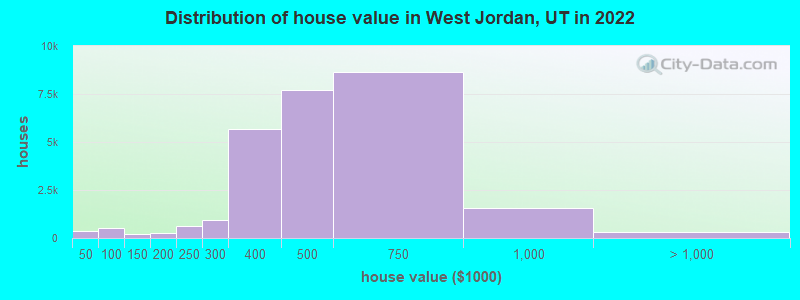
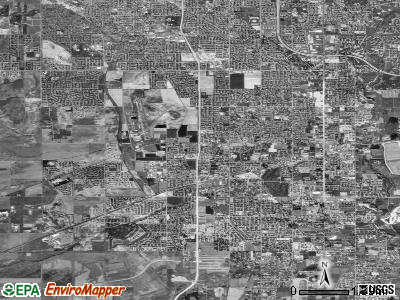
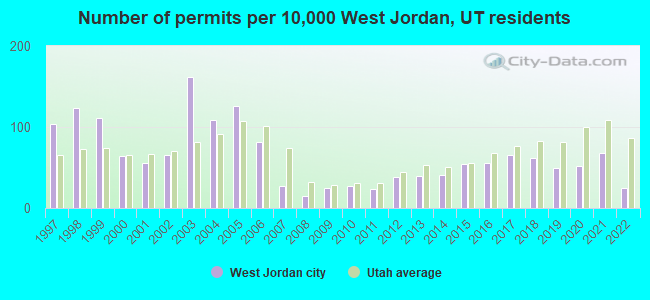
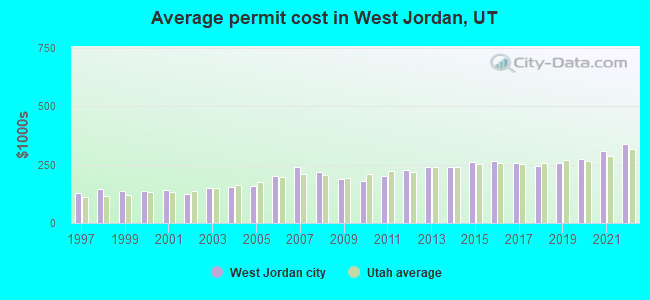
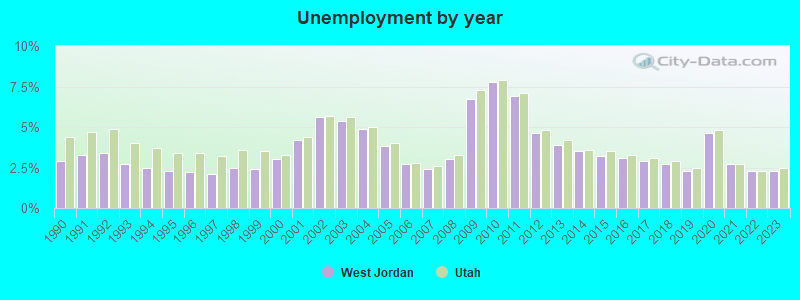
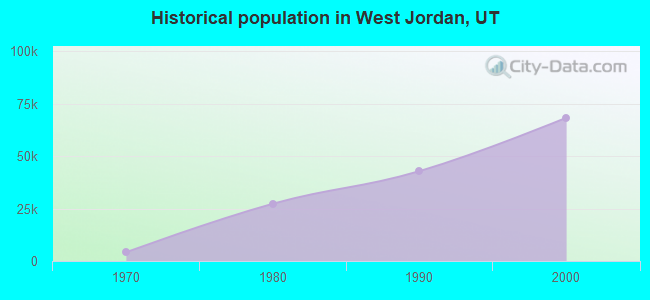
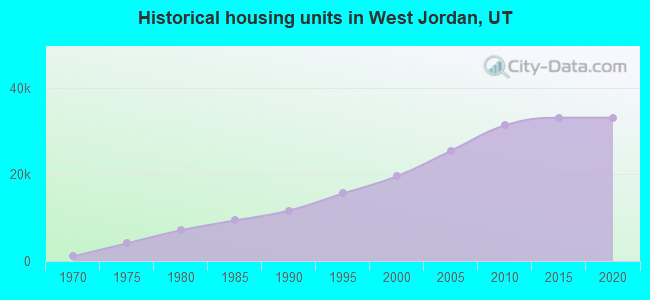
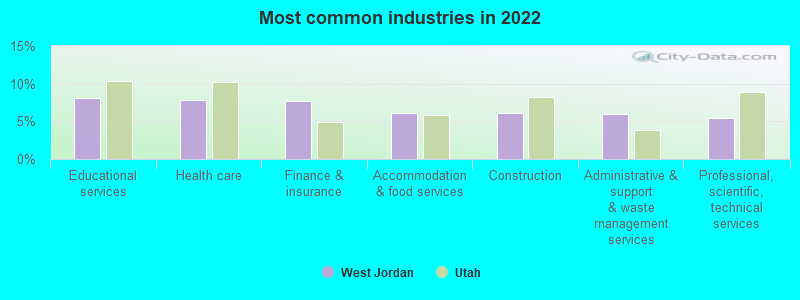
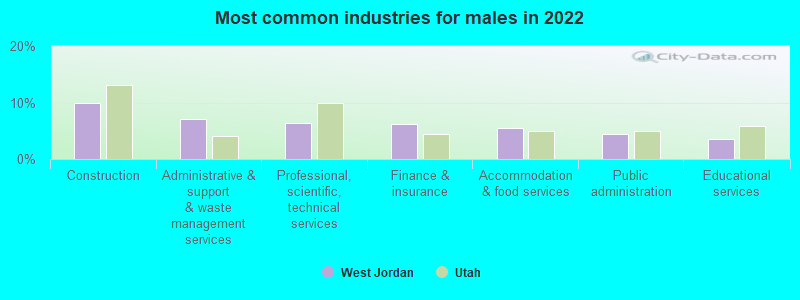
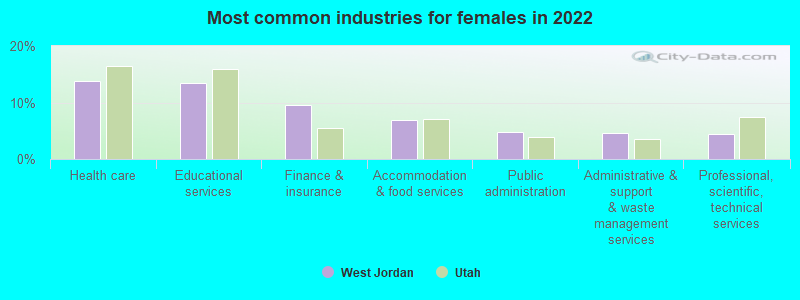
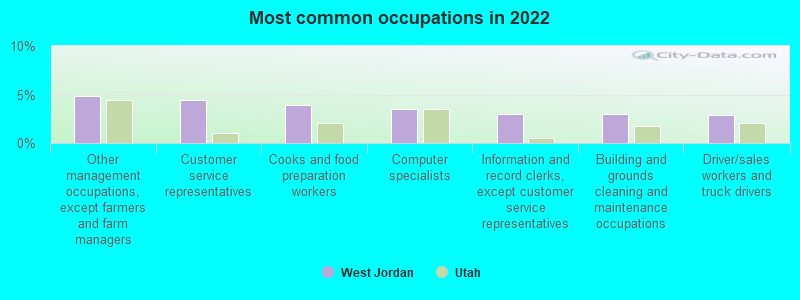
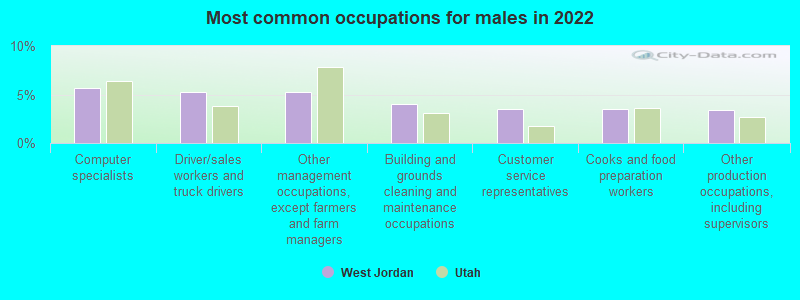
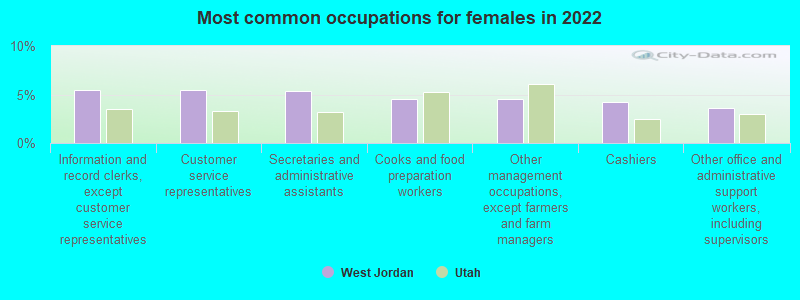
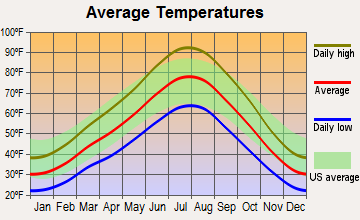
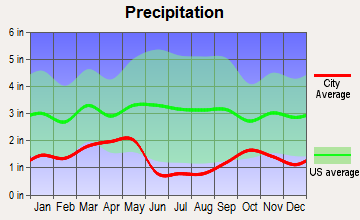
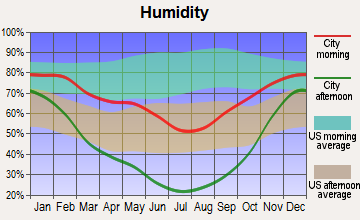
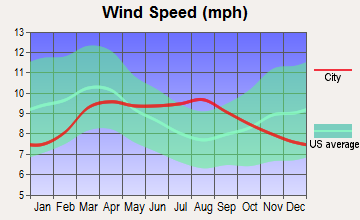
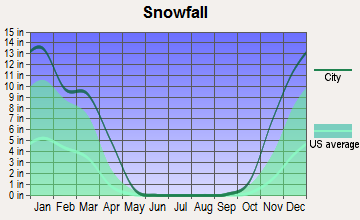
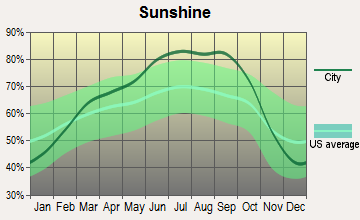
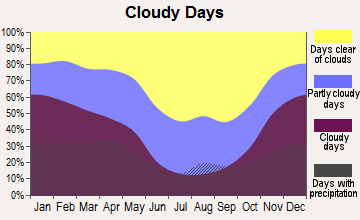
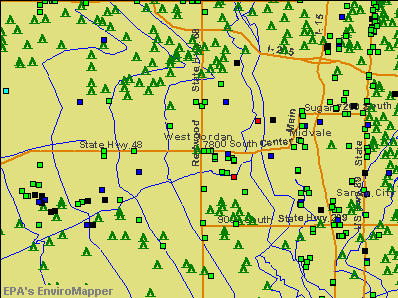

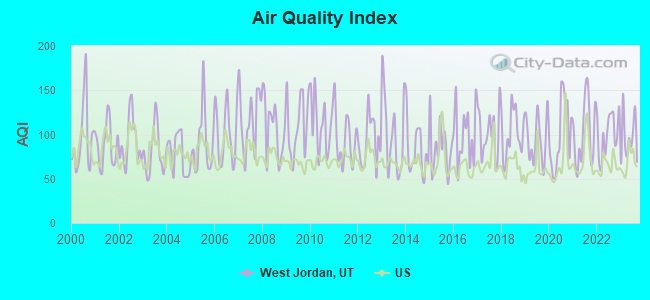
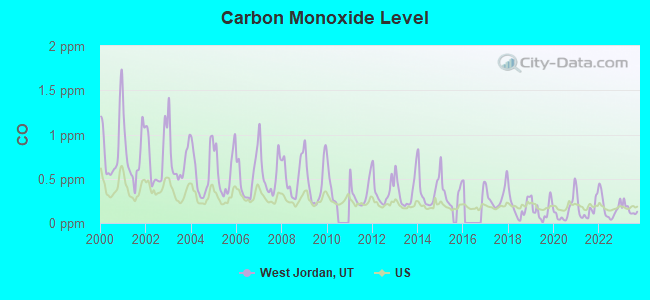
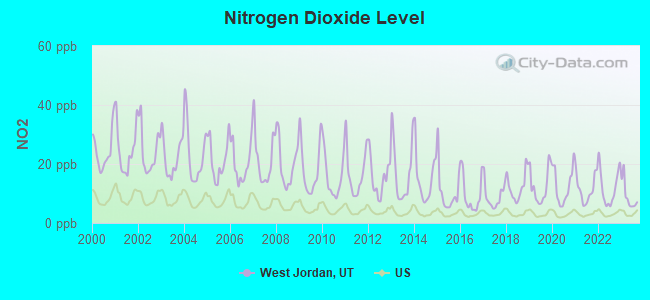
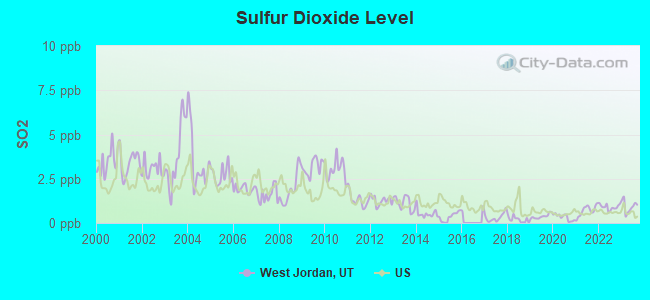
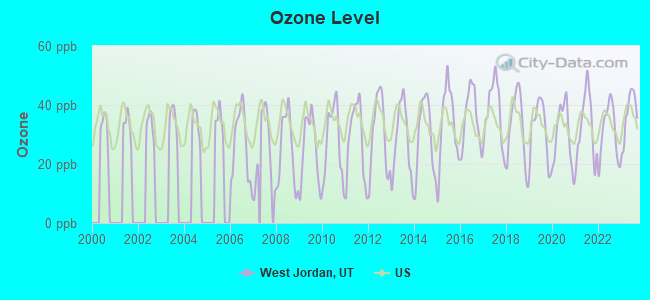
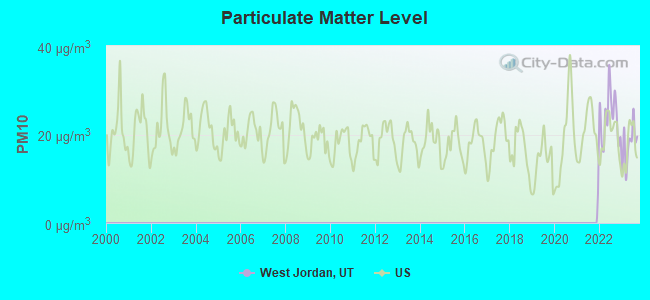
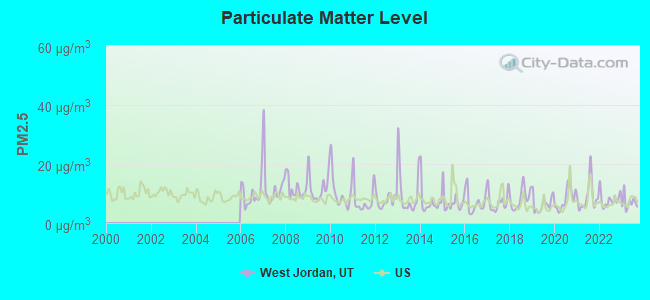
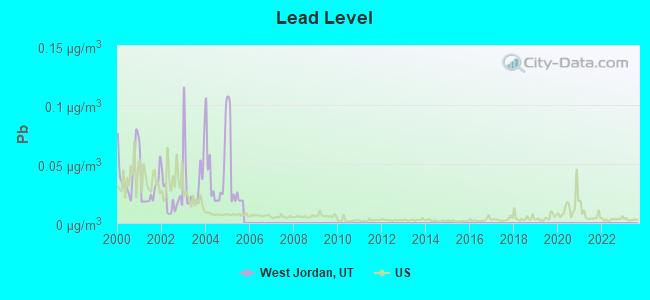
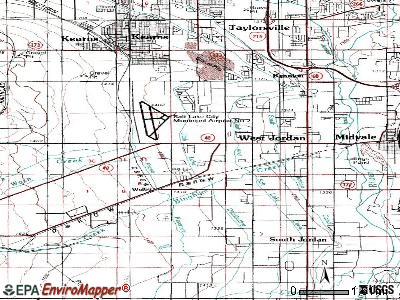
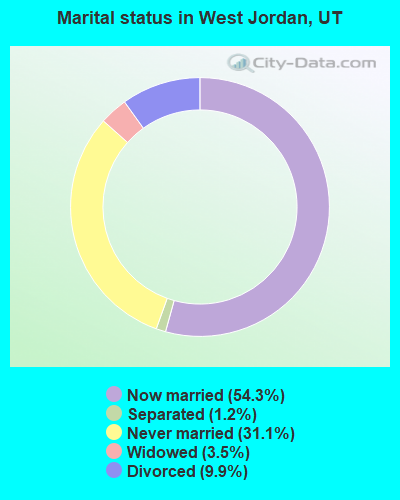
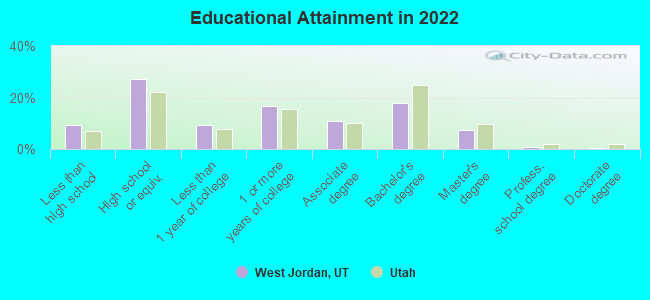
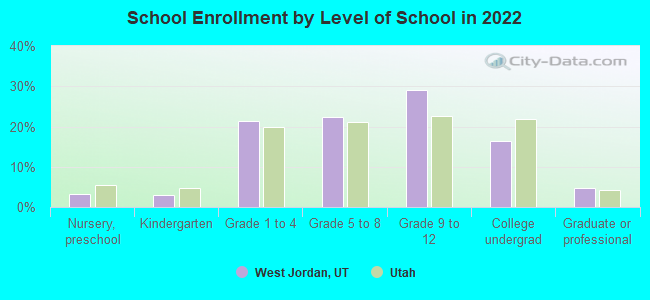
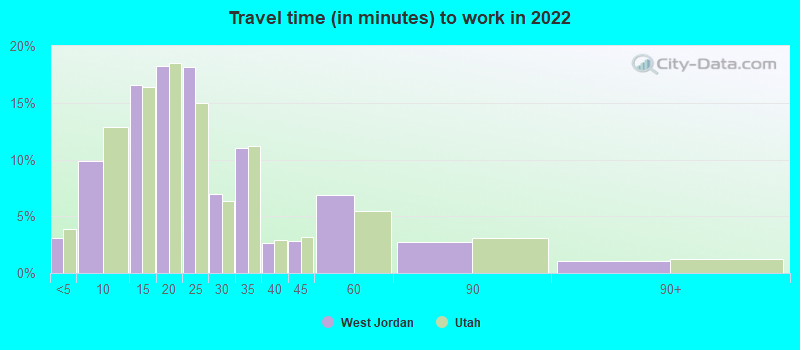
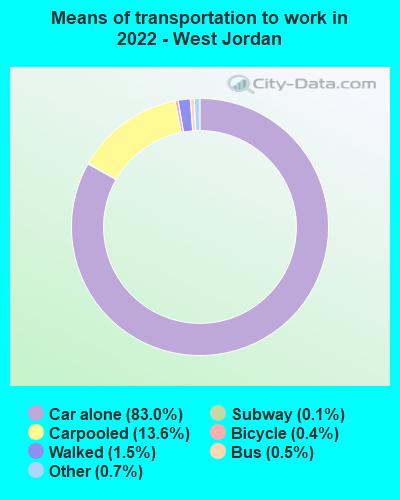
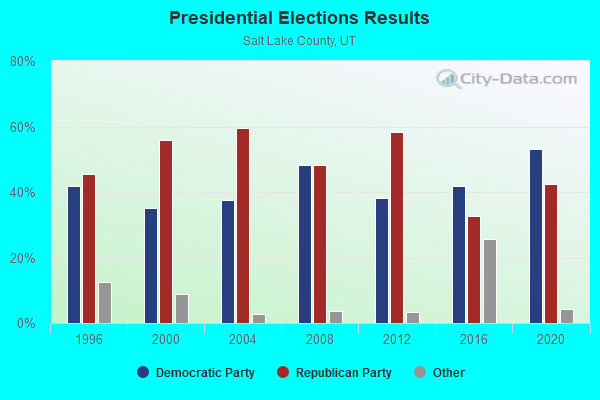
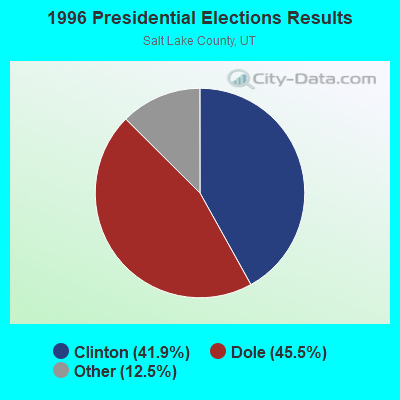
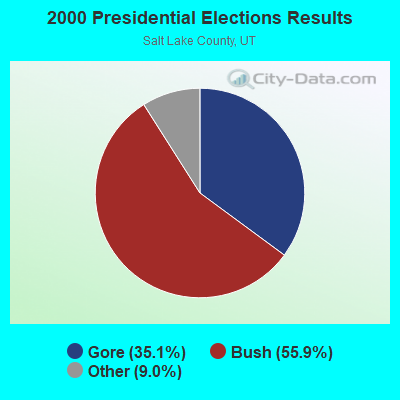
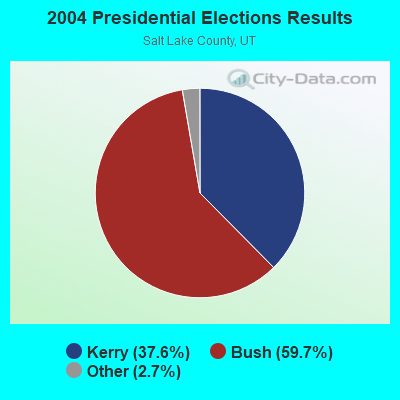
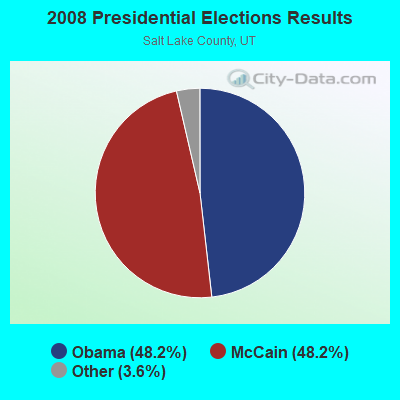

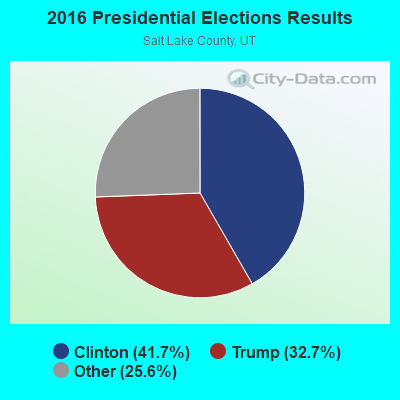
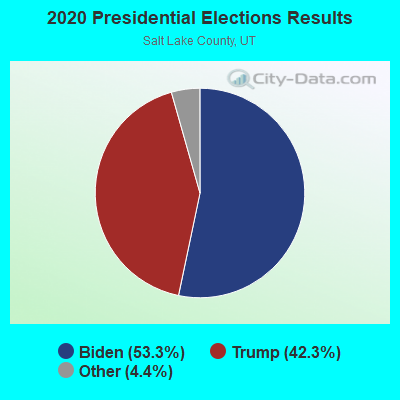
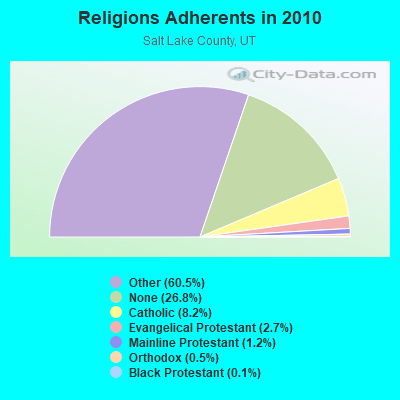
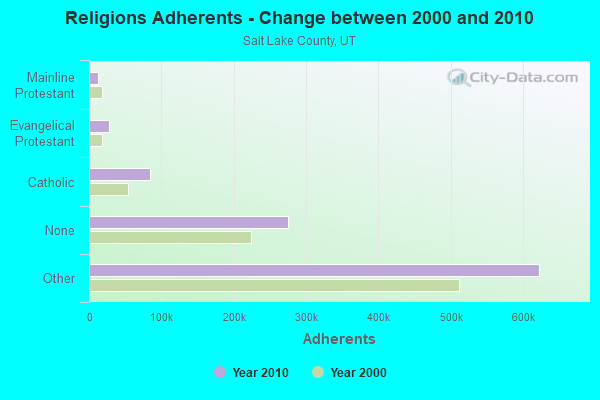
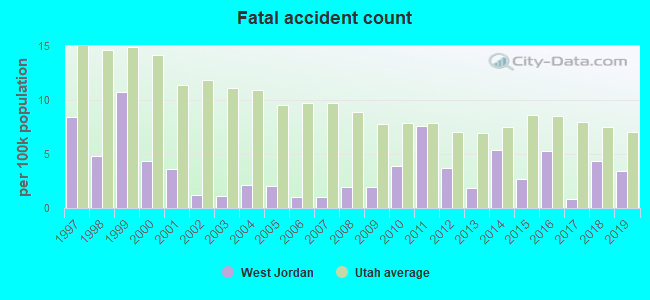
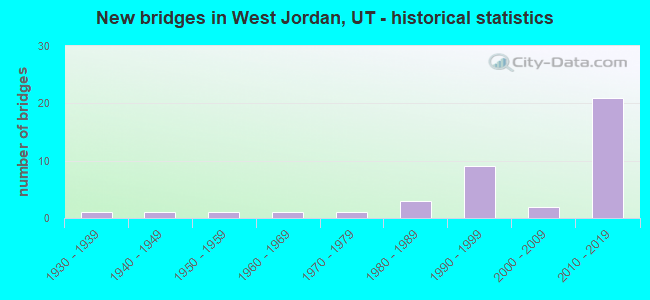
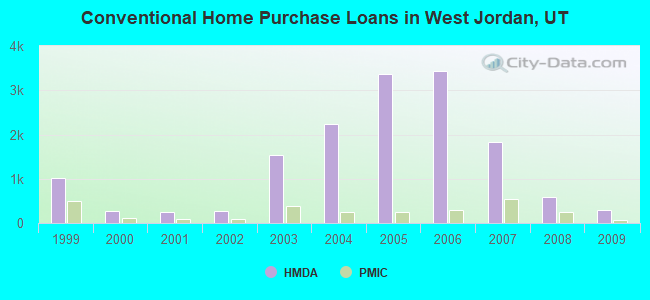

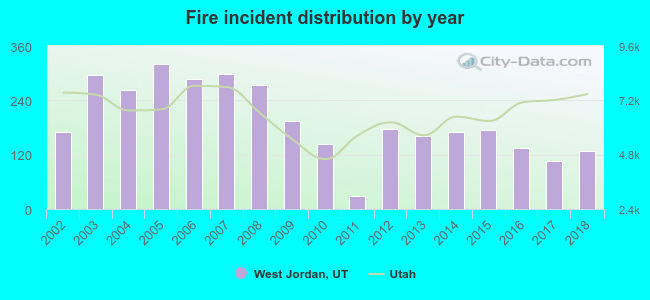 Based on the data from the years 2002 - 2018 the average number of fires per year is 196. The highest number of reported fire incidents - 320 took place in 2005, and the least - 28 in 2011. The data has a decreasing trend.
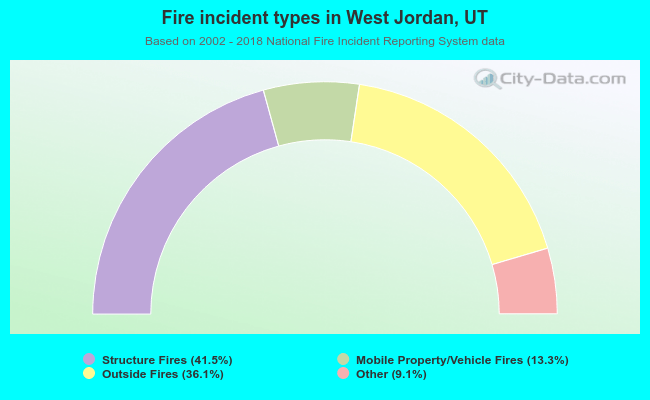 When looking into fire subcategories, the most incidents belonged to: Structure Fires (41.5%), and Outside Fires (36.1%).