Verona, Pennsylvania
Submit your own pictures of this borough and show them to the world
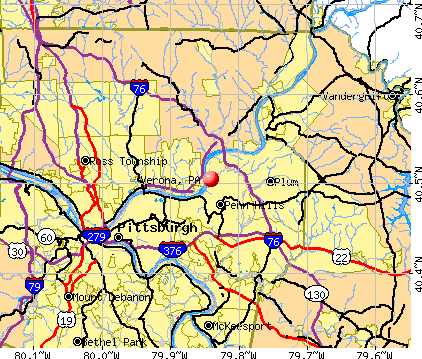
- OSM Map
- General Map
- Google Map
- MSN Map
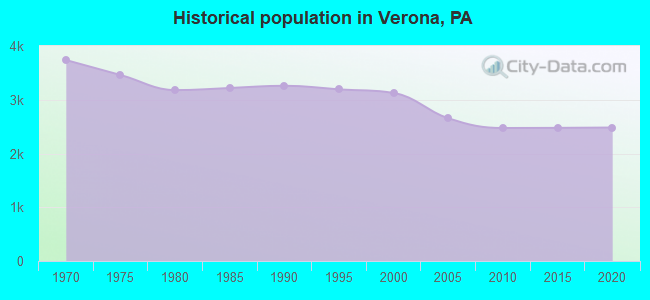
Population change since 2000: -22.3%
| Males: 1,206 | |
| Females: 1,220 |
| Median resident age: | 38.9 years |
| Pennsylvania median age: | 40.9 years |
Zip codes: 15147.
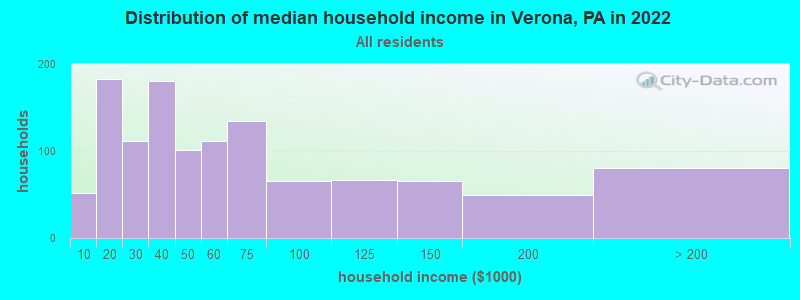
| Verona: | $46,285 |
| PA: | $71,798 |
Estimated per capita income in 2022: $35,002 (it was $15,881 in 2000)
Verona borough income, earnings, and wages data
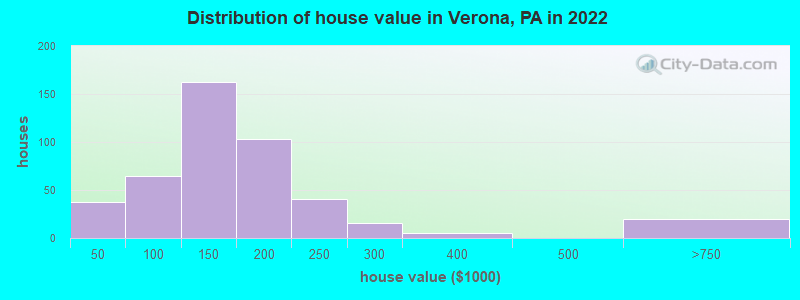
Estimated median house or condo value in 2022: $147,283 (it was $57,100 in 2000)
| Verona: | $147,283 |
| PA: | $245,500 |
Mean prices in 2022: all housing units: $266,371; detached houses: $267,242; townhouses or other attached units: $265,484; in 2-unit structures: $230,538; in 3-to-4-unit structures: $231,495; in 5-or-more-unit structures: $287,359; mobile homes: $84,841; occupied boats, rvs, vans, etc.: $316,945
Median gross rent in 2022: $743.
(5.0% for White Non-Hispanic residents, 33.5% for Black residents, 100.0% for other race residents, 20.5% for two or more races residents)
Detailed information about poverty and poor residents in Verona, PA


Compare current foreclosures in Verona, PA:
| Photo | Address | Area | Beds / Baths | Price | Details |
|---|---|---|---|---|---|

|
#1
Summit Dr
Verona, PA 15147
|
1,545 sq. feet
|
1 baths 3 beds |
show details | |

|
#2
Hulton Rd
Verona, PA 15147
|
1,008 sq. feet
|
1 baths 2 beds |
show details | |

|
#3
3rd St
Verona, PA 15147
|
1,025 sq. feet
|
1 baths 2 beds |
show details | |

|
#4
Stephens Ln
Verona, PA 15147
|
1,152 sq. feet
|
1 baths 2 beds |
show details | |

|
#5
Courtney Dr
Verona, PA 15147
|
1,008 sq. feet
|
1 baths 2 beds |
show details | |

|
#6
Fox Chase Dr
Verona, PA 15147
|
1,334 sq. feet
|
1 baths 3 beds |
show details | |

|
#7
Swan Ave
Verona, PA 15147
|
1,313 sq. feet
|
1 baths 3 beds |
show details | |

|
#8
Hulton Rd
Verona, PA 15147
|
1,008 sq. feet
|
1 baths 2 beds |
show details | |

|
#9
Verona Rd
Verona, PA 15147
|
1,436 sq. feet
|
1 baths 3 beds |
show details | |

|
#10
1st St
Verona, PA 15147
|
1,460 sq. feet
|
2 baths 3 beds |
show details |
| Photo | Address | Area | Beds / Baths | Price | Details |
|---|---|---|---|---|---|

|
#11
Poketa Rd
Verona, PA 15147
|
1,460 sq. feet
|
1 baths 3 beds |
show details | |

|
#12
Clearview Dr
Verona, PA 15147
|
1,072 sq. feet
|
1 baths 3 beds |
show details | |

|
#13
Aber Rd
Verona, PA 15147
|
1,443 sq. feet
|
1 baths 3 beds |
show details | |

|
#14
Leechburg Rd
Verona, PA 15147
|
2,397 sq. feet
|
2 baths 3 beds |
show details | |

|
#15
Verona Rd
Verona, PA 15147
|
1,104 sq. feet
|
1 baths 2 beds |
show details | |

|
#16
Aber Rd
Verona, PA 15147
|
1,092 sq. feet
|
1 baths 2 beds |
show details | |

|
#17
Arthur Dr
Verona, PA 15147
|
1,256 sq. feet
|
1 baths 2 beds |
show details | |

|
#18
Crescent Pines Dr
Verona, PA 15147
|
1,100 sq. feet
|
1 baths 3 beds |
show details | |

|
#19
Kirk Dr
Verona, PA 15147
|
780 sq. feet
|
1 baths 2 beds |
show details | |

|
#20
Greenridge Dr
Verona, PA 15147
|
1,164 sq. feet
|
2 baths 3 beds |
show details |
| Photo | Address | Area | Beds / Baths | Price | Details |
|---|---|---|---|---|---|

|
#21
Thon Dr
Verona, PA 15147
|
1,092 sq. feet
|
1 baths 2 beds |
show details | |

|
#22
Mark Dr
Verona, PA 15147
|
875 sq. feet
|
1 baths 3 beds |
show details | |

|
#23
Mary St
Verona, PA 15147
|
868 sq. feet
|
1 baths 2 beds |
show details | |

|
#24
Vogels Ln
Verona, PA 15147
|
870 sq. feet
|
2 baths 4 beds |
show details | |

|
#25
Lisa Dr
Verona, PA 15147
|
1,026 sq. feet
|
1 baths 3 beds |
show details | |

|
#26
1st St
Verona, PA 15147
|
1,184 sq. feet
|
1 baths 2 beds |
show details | |

|
#27
Mark Dr
Verona, PA 15147
|
1,190 sq. feet
|
2 baths 2 beds |
show details | |

|
#28
Gail Dr
Verona, PA 15147
|
1,529 sq. feet
|
1 baths 3 beds |
show details | |

|
#29
Clearview Dr
Verona, PA 15147
|
950 sq. feet
|
1 baths 3 beds |
show details | |

|
#30
Chaske St
Verona, PA 15147
|
1,120 sq. feet
|
1 baths 3 beds |
show details |
| Photo | Address | Area | Beds / Baths | Price | Details |
|---|---|---|---|---|---|

|
#31
Center Ave
Verona, PA 15147
|
1,000 sq. feet
|
1 baths 3 beds |
show details | |

|
#32
Suncrest Dr
Verona, PA 15147
|
1,729 sq. feet
|
2 baths 3 beds |
show details | |

|
#33
Leechburg Rd Apt 309
Verona, PA 15147
|
- sq. feet
|
- baths - beds |
show details | |

|
#34
Saltsburg Rd # 311
Verona, PA 15147
|
- sq. feet
|
- baths - beds |
show details | |

|
#35
Brinley Dr
Verona, PA 15147
|
- sq. feet
|
- baths - beds |
show details | |

|
#36
Church St
Verona, PA 15147
|
- sq. feet
|
- baths - beds |
show details | |

|
#37
Homestead Rd # 2
Verona, PA 15147
|
- sq. feet
|
- baths - beds |
show details | |

|
#38
Suncrest Dr
Verona, PA 15147
|
- sq. feet
|
- baths - beds |
show details | |

|
#39
Hunter Rd
Verona, PA 15147
|
- sq. feet
|
- baths - beds |
show details | |

|
Check over 1 million property listings on Foreclosure.com!
|
browse all offers | |||


- 2,11481.2%White alone
- 30111.6%Black alone
- 1596.1%Two or more races
- 220.8%Hispanic
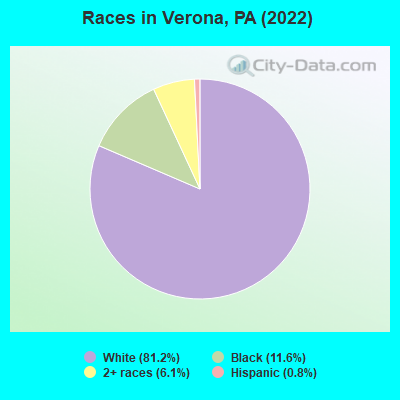
Races in Verona detailed stats: ancestries, foreign born residents, place of birth
According to our research of Pennsylvania and other state lists, there were 17 registered sex offenders living in Verona, Pennsylvania as of April 27, 2024.
The ratio of all residents to sex offenders in Verona is 152 to 1.
Type |
2009 |
2010 |
2011 |
2012 |
2013 |
2014 |
2015 |
2016 |
2017 |
2018 |
2019 |
2020 |
2022 |
|---|---|---|---|---|---|---|---|---|---|---|---|---|---|
| Murders (per 100,000) | 0 (0.0) | 0 (0.0) | 0 (0.0) | 0 (0.0) | 0 (0.0) | 0 (0.0) | 0 (0.0) | 0 (0.0) | 0 (0.0) | 0 (0.0) | 0 (0.0) | 0 (0.0) | 0 (0.0) |
| Rapes (per 100,000) | 2 (71.1) | 2 (80.8) | 1 (40.3) | 0 (0.0) | 0 (0.0) | 0 (0.0) | 0 (0.0) | 3 (123.2) | 1 (41.5) | 0 (0.0) | 1 (41.5) | 0 (0.0) | 0 (0.0) |
| Robberies (per 100,000) | 6 (213.3) | 3 (121.3) | 0 (0.0) | 1 (40.3) | 4 (162.1) | 2 (81.2) | 1 (40.8) | 1 (41.1) | 5 (207.5) | 2 (83.3) | 0 (0.0) | 2 (83.3) | 0 (0.0) |
| Assaults (per 100,000) | 12 (426.6) | 4 (161.7) | 5 (201.5) | 10 (402.6) | 10 (405.2) | 5 (202.9) | 7 (285.6) | 13 (533.7) | 4 (166.0) | 3 (124.9) | 4 (166.2) | 5 (208.2) | 0 (0.0) |
| Burglaries (per 100,000) | 23 (817.6) | 22 (889.2) | 13 (523.8) | 13 (523.3) | 17 (688.8) | 16 (649.4) | 17 (693.6) | 18 (738.9) | 18 (746.9) | 3 (124.9) | 6 (249.3) | 6 (249.9) | 1 (41.3) |
| Thefts (per 100,000) | 78 (2,773) | 73 (2,951) | 81 (3,263) | 67 (2,697) | 68 (2,755) | 81 (3,287) | 104 (4,243) | 42 (1,724) | 64 (2,656) | 78 (3,247) | 75 (3,116) | 59 (2,457) | 20 (826.1) |
| Auto thefts (per 100,000) | 0 (0.0) | 2 (80.8) | 1 (40.3) | 3 (120.8) | 1 (40.5) | 1 (40.6) | 3 (122.4) | 4 (164.2) | 1 (41.5) | 2 (83.3) | 1 (41.5) | 1 (41.6) | 0 (0.0) |
| Arson (per 100,000) | 0 (0.0) | 0 (0.0) | 0 (0.0) | 0 (0.0) | 0 (0.0) | 0 (0.0) | 0 (0.0) | 0 (0.0) | 0 (0.0) | 0 (0.0) | 0 (0.0) | 0 (0.0) | 0 (0.0) |
| City-Data.com crime index | 374.3 | 320.1 | 242.9 | 246.8 | 291.3 | 245.1 | 297.4 | 351.4 | 290.5 | 195.3 | 211.9 | 185.8 | 35.9 |
The City-Data.com crime index weighs serious crimes and violent crimes more heavily. Higher means more crime, U.S. average is 246.1. It adjusts for the number of visitors and daily workers commuting into cities.
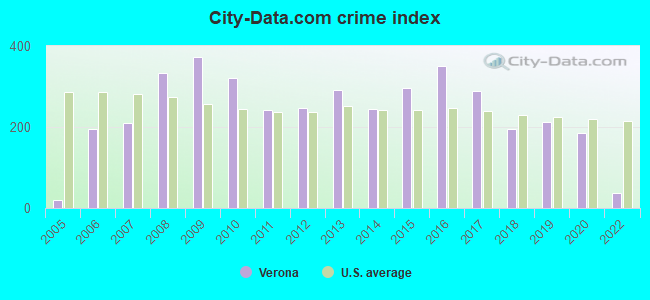
Crime rate in Verona detailed stats: murders, rapes, robberies, assaults, burglaries, thefts, arson
Full-time law enforcement employees in 2021, including police officers: 4 (3 officers - 3 male; 0 female).
| Officers per 1,000 residents here: | 1.26 |
| Pennsylvania average: | 2.55 |
 Recent articles from our blog. Our writers, many of them Ph.D. graduates or candidates, create easy-to-read articles on a wide variety of topics.

 | Pittsburgh MSA municipal population data (2020) (125 replies) |
| Suburb of the week: Verona (7 replies) |
| LESS than anemic job growth for region, #84/90 (290 replies) |
| Decent access to public transportation at least. (49 replies) |
| Financial impact on City gov't (56 replies) |
| Help Picking a Pittsburgh Neighborhood (140 replies) |
Latest news from Verona, PA collected exclusively by city-data.com from local newspapers, TV, and radio stations
Ancestries: Italian (15.5%), Irish (9.0%), American (8.7%), German (7.5%), Greek (6.6%), Croatian (6.3%).
Current Local Time: EST time zone
Incorporated on 05/10/1871
Elevation: 760 feet
Land area: 0.53 square miles.
Population density: 4,536 people per square mile (average).
36 residents are foreign born
| This borough: | 1.4% |
| Pennsylvania: | 7.3% |
Median real estate property taxes paid for housing units with mortgages in 2022: $2,500 (1.7%)
Median real estate property taxes paid for housing units with no mortgage in 2022: $1,500 (1.0%)
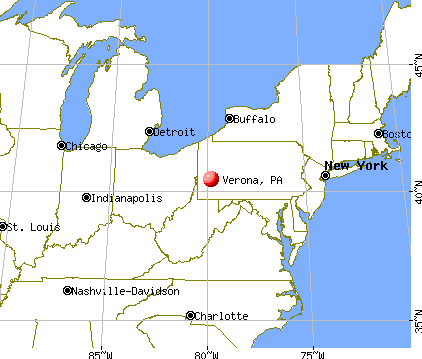
Nearest city with pop. 50,000+: Pittsburgh, PA  (8.4 miles , pop. 334,563).
Nearest city with pop. 1,000,000+: Philadelphia, PA (250.3 miles , pop. 1,517,550).
Nearest cities:
), ), ), Latitude: 40.50 N, Longitude: 79.84 W
Area code commonly used in this area: 724
Property values in Verona, PA

Verona, Pennsylvania accommodation & food services, waste management - Economy and Business Data
| Here: | 2.8% |
| Pennsylvania: | 2.9% |
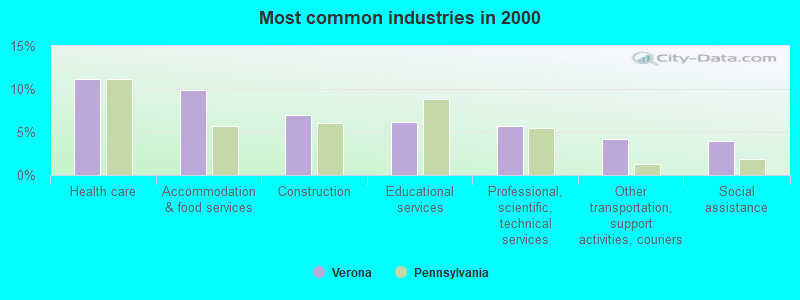
- Health care (11.1%)
- Accommodation & food services (9.9%)
- Construction (6.9%)
- Educational services (6.1%)
- Professional, scientific, technical services (5.8%)
- Other transportation, support activities, couriers (4.1%)
- Social assistance (4.0%)
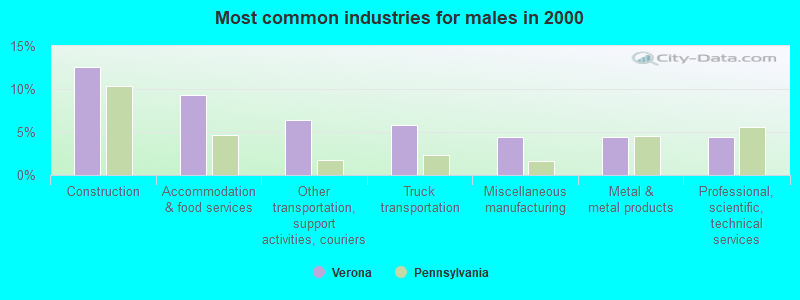
- Construction (12.5%)
- Accommodation & food services (9.2%)
- Other transportation, support activities, couriers (6.4%)
- Truck transportation (5.8%)
- Miscellaneous manufacturing (4.4%)
- Metal & metal products (4.4%)
- Professional, scientific, technical services (4.4%)
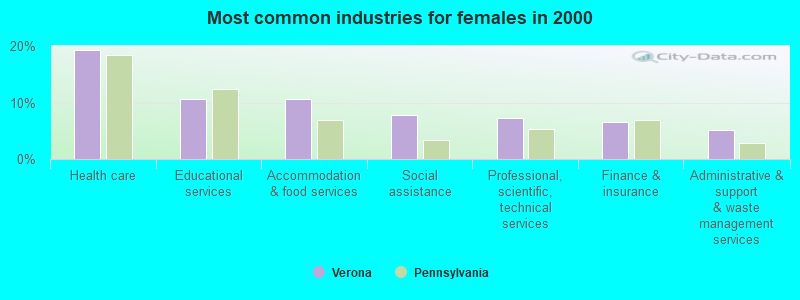
- Health care (19.3%)
- Educational services (10.6%)
- Accommodation & food services (10.6%)
- Social assistance (7.8%)
- Professional, scientific, technical services (7.2%)
- Finance & insurance (6.6%)
- Administrative & support & waste management services (5.1%)
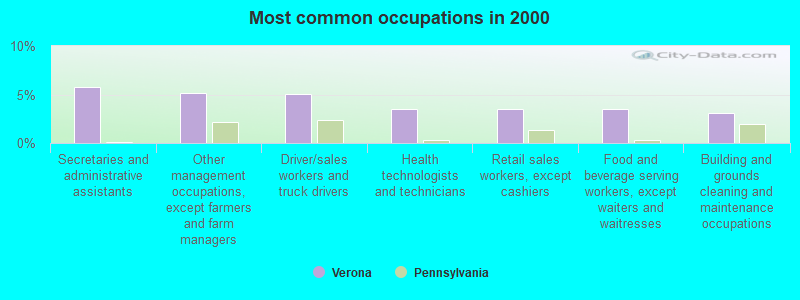
- Secretaries and administrative assistants (5.8%)
- Other management occupations, except farmers and farm managers (5.2%)
- Driver/sales workers and truck drivers (5.0%)
- Health technologists and technicians (3.5%)
- Retail sales workers, except cashiers (3.5%)
- Food and beverage serving workers, except waiters and waitresses (3.5%)
- Building and grounds cleaning and maintenance occupations (3.1%)
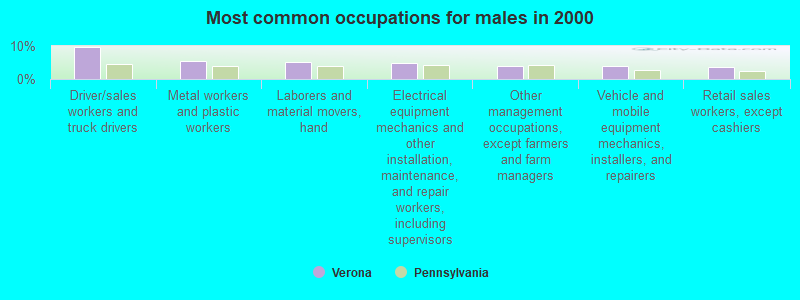
- Driver/sales workers and truck drivers (9.7%)
- Metal workers and plastic workers (5.5%)
- Laborers and material movers, hand (5.3%)
- Electrical equipment mechanics and other installation, maintenance, and repair workers, including supervisors (5.0%)
- Other management occupations, except farmers and farm managers (3.8%)
- Vehicle and mobile equipment mechanics, installers, and repairers (3.8%)
- Retail sales workers, except cashiers (3.6%)
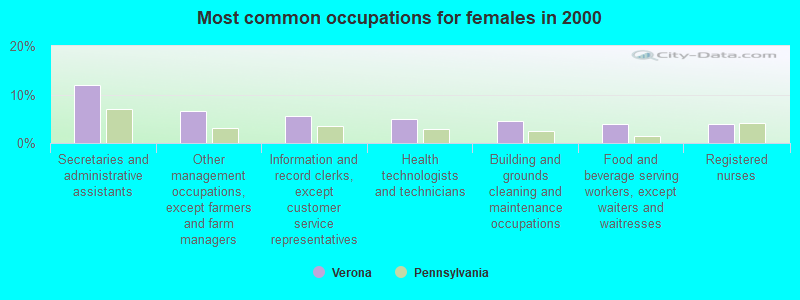
- Secretaries and administrative assistants (11.9%)
- Other management occupations, except farmers and farm managers (6.6%)
- Information and record clerks, except customer service representatives (5.5%)
- Health technologists and technicians (4.9%)
- Building and grounds cleaning and maintenance occupations (4.6%)
- Food and beverage serving workers, except waiters and waitresses (4.0%)
- Registered nurses (4.0%)
Average climate in Verona, Pennsylvania
Based on data reported by over 4,000 weather stations


|
|

(lower is better)
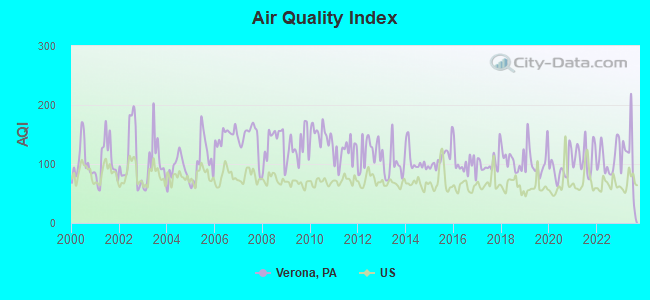
Air Quality Index (AQI) level in 2023 was 111. This is significantly worse than average.
| City: | 111 |
| U.S.: | 73 |
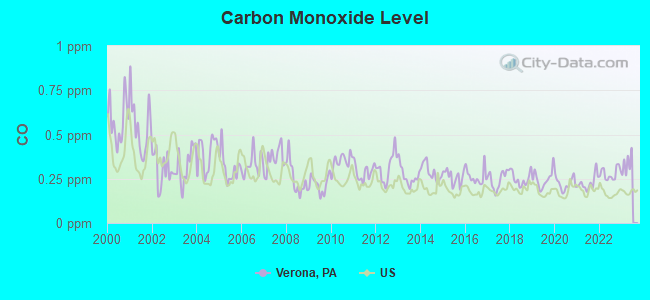
Carbon Monoxide (CO) [ppm] level in 2022 was 0.279. This is about average. Closest monitor was 5.3 miles away from the city center.
| City: | 0.279 |
| U.S.: | 0.251 |
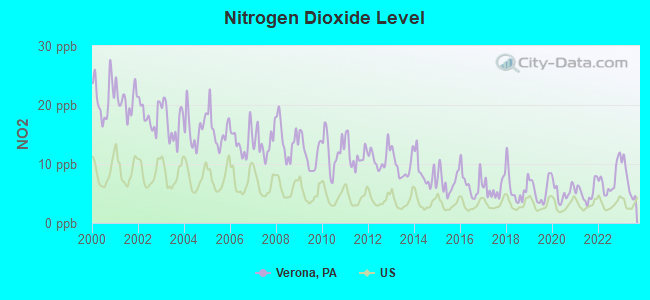
Nitrogen Dioxide (NO2) [ppb] level in 2023 was 7.13. This is worse than average. Closest monitor was 5.1 miles away from the city center.
| City: | 7.13 |
| U.S.: | 5.11 |
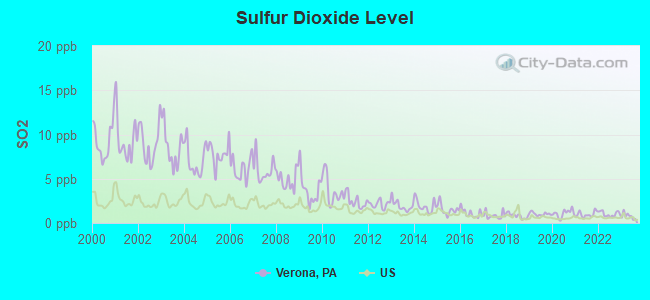
Sulfur Dioxide (SO2) [ppb] level in 2023 was 0.783. This is significantly better than average. Closest monitor was 3.7 miles away from the city center.
| City: | 0.783 |
| U.S.: | 1.515 |
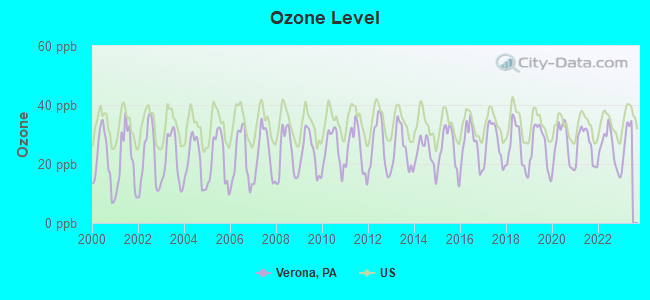
Ozone [ppb] level in 2022 was 25.4. This is better than average. Closest monitor was 2.5 miles away from the city center.
| City: | 25.4 |
| U.S.: | 33.3 |
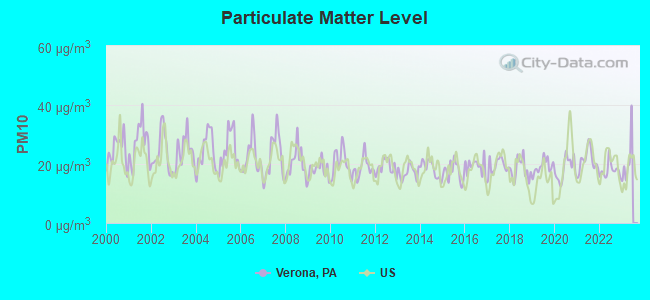
Particulate Matter (PM10) [µg/m3] level in 2022 was 17.8. This is about average. Closest monitor was 4.2 miles away from the city center.
| City: | 17.8 |
| U.S.: | 19.2 |
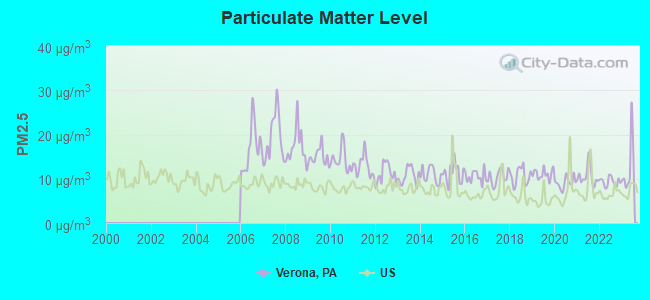
Particulate Matter (PM2.5) [µg/m3] level in 2023 was 12.6. This is significantly worse than average. Closest monitor was 4.2 miles away from the city center.
| City: | 12.6 |
| U.S.: | 8.1 |
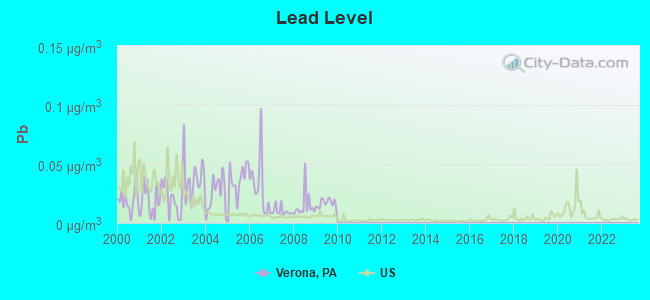
Lead (Pb) [µg/m3] level in 2009 was 0.0168. This is significantly worse than average. Closest monitor was 4.2 miles away from the city center.
| City: | 0.0168 |
| U.S.: | 0.0093 |
Tornado activity:
Verona-area historical tornado activity is near Pennsylvania state average. It is 19% smaller than the overall U.S. average.
On 6/3/1980, a category F4 (max. wind speeds 207-260 mph) tornado 11.6 miles away from the Verona borough center injured 140 people and caused between $50,000,000 and $500,000,000 in damages.
On 8/3/1963, a category F3 (max. wind speeds 158-206 mph) tornado 13.0 miles away from the borough center killed 2 people and injured 70 people and caused between $5,000,000 and $50,000,000 in damages.
Earthquake activity:
Verona-area historical earthquake activity is significantly above Pennsylvania state average. It is 56% smaller than the overall U.S. average.On 9/25/1998 at 19:52:52, a magnitude 5.2 (4.8 MB, 4.3 MS, 5.2 LG, 4.5 MW, Depth: 3.1 mi, Class: Moderate, Intensity: VI - VII) earthquake occurred 74.1 miles away from Verona center
On 8/23/2011 at 17:51:04, a magnitude 5.8 (5.8 MW, Depth: 3.7 mi) earthquake occurred 206.5 miles away from the city center
On 1/31/1986 at 16:46:43, a magnitude 5.0 (5.0 MB) earthquake occurred 102.4 miles away from Verona center
On 7/27/1980 at 18:52:21, a magnitude 5.2 (5.1 MB, 4.7 MS, 5.0 UK, 5.2 UK) earthquake occurred 270.9 miles away from Verona center
On 12/31/2011 at 20:05:01, a magnitude 4.0 (4.0 ML, Depth: 3.1 mi, Class: Light, Intensity: IV - V) earthquake occurred 61.4 miles away from Verona center
On 8/9/2020 at 12:07:37, a magnitude 5.1 (5.1 MW, Depth: 4.7 mi) earthquake occurred 286.8 miles away from Verona center
Magnitude types: regional Lg-wave magnitude (LG), body-wave magnitude (MB), local magnitude (ML), surface-wave magnitude (MS), moment magnitude (MW)
Natural disasters:
The number of natural disasters in Allegheny County (15) is near the US average (15).Major Disasters (Presidential) Declared: 12
Emergencies Declared: 3
Causes of natural disasters: Floods: 6, Storms: 6, Winter Storms: 3, Hurricanes: 2, Tornadoes: 2, Blizzard: 1, Snowfall: 1, Snowstorm: 1, Tropical Depression: 1, Tropical Storm: 1, Other: 1 (Note: some incidents may be assigned to more than one category).

Hospitals and medical centers in Verona:
Other hospitals and medical centers near Verona:
- GOLDEN LIVINGCENTER-OAKMONT (Nursing Home, about 2 miles away; OAKMONT, PA)
- GRANE HOSPICE CARE (Hospital, about 2 miles away; PITTSBURGH, PA)
- WILLOWS OF PRESBYTERIAN SENIOR (Nursing Home, about 2 miles away; OAKMONT, PA)
- GRANE HOME HEALTH CARE INC (Home Health Center, about 2 miles away; PITTSBURGH, PA)
- CARE AT HOME PREFERRED, INC. (Home Health Center, about 2 miles away; PITTSBURGH, PA)
- HARMAR VILLAGE CARE CENTER (Nursing Home, about 3 miles away; CHESWICK, PA)
- DCI RENAL SERVICES OF PITTSBURGH, LLC - HARMAR VILLAGE (Dialysis Facility, about 3 miles away; CHESWICK, PA)
Amtrak station near Verona:
- 10 miles: PITTSBURGH (1100 LIBERTY AVE.) . Services: ticket office, fully wheelchair accessible, enclosed waiting area, public restrooms, public payphones, vending machines, ATM, free short-term parking, paid long-term parking, call for car rental service, call for taxi service, intercity bus service, public transit connection.
Colleges/universities with over 2000 students nearest to Verona:
- Carnegie Mellon University (about 7 miles; Pittsburgh, PA; Full-time enrollment: 14,186)
- University of Pittsburgh-Pittsburgh Campus (about 8 miles; Pittsburgh, PA; FT enrollment: 27,137)
- The Art Institute of Pittsburgh-Online Division (about 9 miles; Pittsburgh, PA; FT enrollment: 11,040)
- Duquesne University (about 10 miles; Pittsburgh, PA; FT enrollment: 8,211)
- Point Park University (about 10 miles; Pittsburgh, PA; FT enrollment: 3,525)
- Community College of Allegheny County (about 11 miles; Pittsburgh, PA; FT enrollment: 13,486)
- Pittsburgh Technical Institute (about 20 miles; Oakdale, PA; FT enrollment: 2,805)
Private high school in Verona:
Public elementary/middle schools in Verona:
- VERNER EL SCH (Students: 190, Location: 700 1ST ST, Grades: KG-6)
- PENN HILLS CHARTER SCHOOL FOR ENTREPRENE (Location: 200 PENN SCHOOL DRIVE, Grades: KG-6, Charter school)
Private elementary/middle school in Verona:
Points of interest:
Notable locations in Verona: Riverview Childrens Center (A), Verner Elementary School Library (B), Verona Borough Hall (C), Verona Volunteer Fire Company Station 285 (D). Display/hide their locations on the map
Church in Verona: Verona United Methodist Church (A). Display/hide its location on the map
Creek: Indian Creek (A). Display/hide its location on the map
Birthplace of: Tom Flynn (American football) - Football player, Tom O'Brien (outfielder) - Baseball player.
| This borough: | 2.2 people |
| Pennsylvania: | 2.5 people |
| This borough: | 55.4% |
| Whole state: | 65.0% |
| This borough: | 8.2% |
| Whole state: | 6.6% |
Likely homosexual households (counted as self-reported same-sex unmarried-partner households)
- Lesbian couples: 0.1% of all households
- Gay men: 0.3% of all households
Banks with branches in Verona (2011 data):
- Citizens Bank of Pennsylvania: Verona Giant Eagle Branch at 200 Allegheny River Boulevard, branch established on 1998/03/23; Penn Hills Branch at 6125 Saltsburg Road, branch established on 1973/11/02. Info updated 2010/09/24: Bank assets: $32,316.9 mil, Deposits: $25,297.1 mil, headquarters in Philadelphia, PA, positive income, 396 total offices, Holding Company: Uk Financial Investments Limited
- First National Bank of Pennsylvania: Verona Branch at 74 Allegheny River Blvd, branch established on 1924/01/01. Info updated 2012/01/10: Bank assets: $9,581.0 mil, Deposits: $7,462.2 mil, headquarters in Greenville, PA, positive income, Commercial Lending Specialization, 291 total offices, Holding Company: F.N.b. Corporation
- First Niagara Bank, National Association: Penn Hills Saltsburg Branch at 6145 Saltsburg Road, branch established on 1871/01/01. Info updated 2011/06/09: Bank assets: $32,750.6 mil, Deposits: $19,595.4 mil, headquarters in Buffalo, NY, positive income, Commercial Lending Specialization, 351 total offices, Holding Company: First Niagara Financial Group, Inc.
- S&T Bank: East Oakmont Branch at 2190 Hulton Road, branch established on 1978/12/13. Info updated 2012/03/14: Bank assets: $4,099.9 mil, Deposits: $3,349.5 mil, headquarters in Indiana, PA, positive income, Commercial Lending Specialization, 60 total offices, Holding Company: S & T Bancorp, Inc.
For population 15 years and over in Verona:
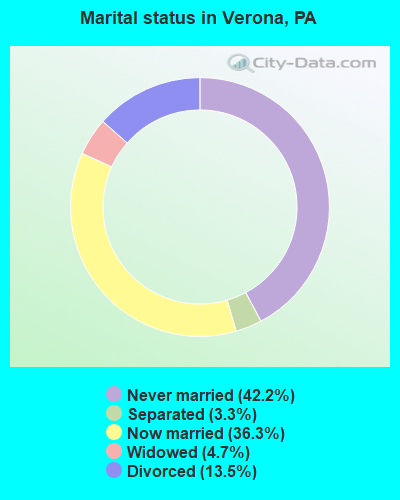
- Never married: 42.2%
- Now married: 36.3%
- Separated: 3.3%
- Widowed: 4.7%
- Divorced: 13.5%
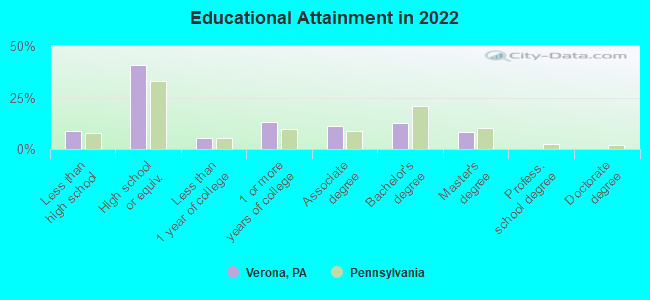
For population 25 years and over in Verona:
- High school or higher: 91.0%
- Bachelor's degree or higher: 20.2%
- Graduate or professional degree: 8.1%
- Unemployed: 9.8%
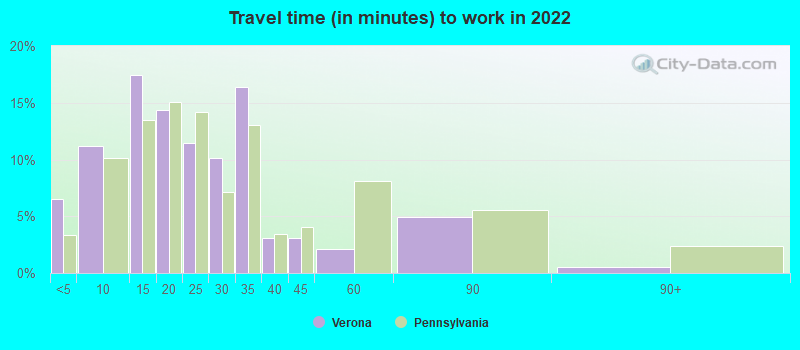
- Mean travel time to work (commute): 18.6 minutes
| Here: | 8.9 |
| Pennsylvania average: | 11.4 |
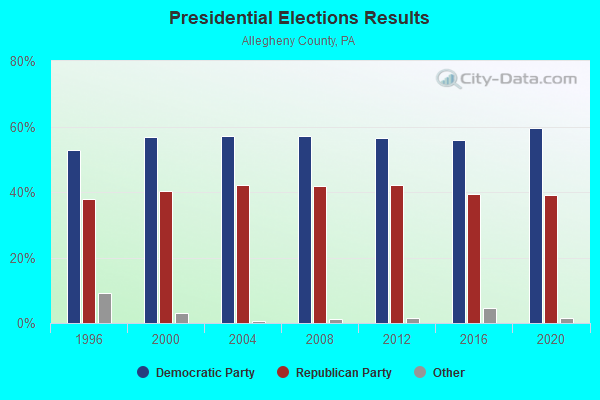
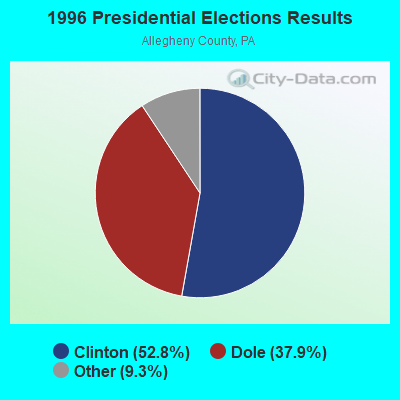
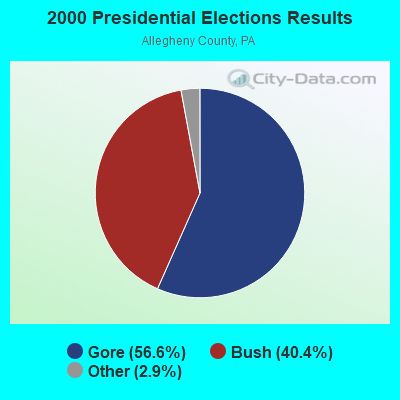
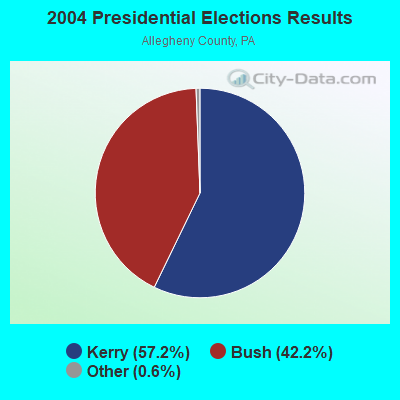

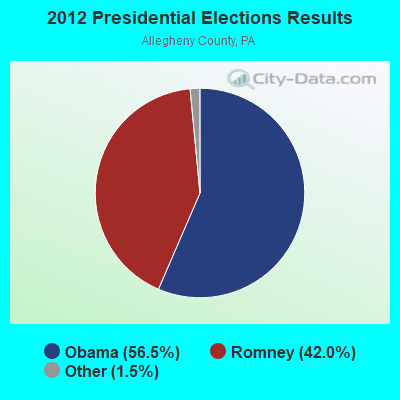

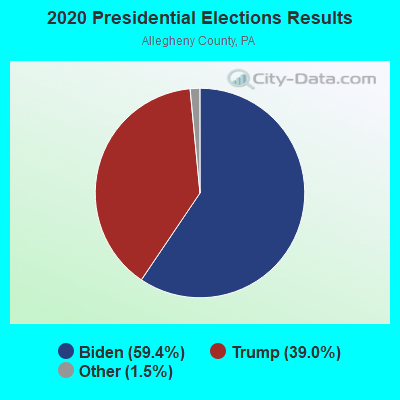
Graphs represent county-level data. Detailed 2008 Election Results
Religion statistics for Verona, PA (based on Allegheny County data)
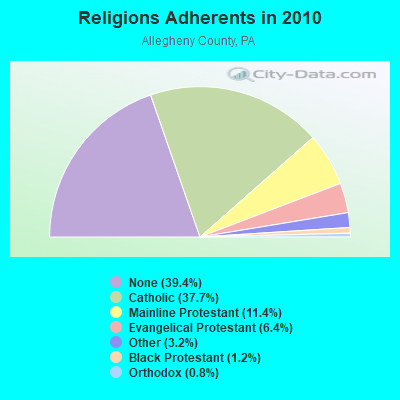
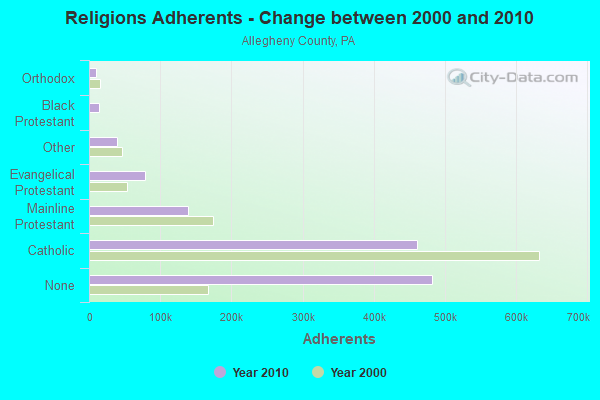
| Religion | Adherents | Congregations |
|---|---|---|
| Catholic | 460,672 | 183 |
| Mainline Protestant | 139,551 | 414 |
| Evangelical Protestant | 78,101 | 349 |
| Other | 38,781 | 98 |
| Black Protestant | 14,268 | 75 |
| Orthodox | 9,606 | 29 |
| None | 482,369 | - |
Food Environment Statistics:
| Here: | 1.72 / 10,000 pop. |
| State: | 2.04 / 10,000 pop. |
| Allegheny County: | 0.09 / 10,000 pop. |
| Pennsylvania: | 0.09 / 10,000 pop. |
| This county: | 1.09 / 10,000 pop. |
| Pennsylvania: | 0.88 / 10,000 pop. |
| Allegheny County: | 2.44 / 10,000 pop. |
| Pennsylvania: | 2.52 / 10,000 pop. |
| Allegheny County: | 8.15 / 10,000 pop. |
| State: | 7.12 / 10,000 pop. |
| Here: | 8.7% |
| Pennsylvania: | 9.1% |
| This county: | 26.3% |
| State: | 27.2% |
| Allegheny County: | 12.9% |
| Pennsylvania: | 11.5% |
Health and Nutrition:
| Verona: | 57.1% |
| State: | 50.2% |
| Verona: | 57.8% |
| Pennsylvania: | 47.1% |
| Verona: | 27.8 |
| Pennsylvania: | 28.7 |
| Verona: | 20.5% |
| State: | 20.8% |
| Verona: | 7.6% |
| Pennsylvania: | 10.9% |
| This city: | 7.1 |
| Pennsylvania: | 6.8 |
| Verona: | 33.9% |
| Pennsylvania: | 34.3% |
| Verona: | 63.8% |
| Pennsylvania: | 56.2% |
| This city: | 80.8% |
| Pennsylvania: | 78.3% |
More about Health and Nutrition of Verona, PA Residents
| Local government employment and payroll (March 2022) | |||||
| Function | Full-time employees | Monthly full-time payroll | Average yearly full-time wage | Part-time employees | Monthly part-time payroll |
|---|---|---|---|---|---|
| Streets and Highways | 3 | $12,987 | $51,948 | 0 | $0 |
| Police Protection - Officers | 3 | $16,366 | $65,464 | 5 | $7,709 |
| Other Government Administration | 1 | $5,962 | $71,544 | 1 | $1,661 |
| Police - Other | 0 | $0 | 5 | $9,203 | |
| Totals for Government | 7 | $35,314 | $60,538 | 11 | $18,572 |
Verona government finances - Expenditure in 2017 (per resident):
- Current Operations - Police Protection: $494,000 ($203.63)
Regular Highways: $413,000 ($170.24)
General - Other: $232,000 ($95.63)
Central Staff Services: $77,000 ($31.74)
Sewerage: $54,000 ($22.26)
General Public Buildings: $49,000 ($20.20)
Local Fire Protection: $42,000 ($17.31)
Parks and Recreation: $37,000 ($15.25)
Judicial and Legal Services: $33,000 ($13.60)
Financial Administration: $25,000 ($10.31)
Protective Inspection and Regulation - Other: $19,000 ($7.83)
- General - Interest on Debt: $15,000 ($6.18)
- Other Capital Outlay - Police Protection: $22,000 ($9.07)
- Total Salaries and Wages: $465,000 ($191.67)
Verona government finances - Revenue in 2017 (per resident):
- Charges - Sewerage: $61,000 ($25.14)
Parks and Recreation: $4,000 ($1.65)
Parking Facilities: $3,000 ($1.24)
- Local Intergovernmental - Other: $19,000 ($7.83)
- Miscellaneous - Fines and Forfeits: $34,000 ($14.01)
Interest Earnings: $11,000 ($4.53)
General Revenue - Other: $9,000 ($3.71)
Rents: $5,000 ($2.06)
Donations From Private Sources: $5,000 ($2.06)
- State Intergovernmental - Highways: $72,000 ($29.68)
Other: $65,000 ($26.79)
General Local Government Support: $3,000 ($1.24)
- Tax - Property: $865,000 ($356.55)
Individual Income: $168,000 ($69.25)
Occupation and Business License - Other: $129,000 ($53.17)
Public Utility License: $49,000 ($20.20)
Documentary and Stock Transfer: $9,000 ($3.71)
Verona government finances - Debt in 2017 (per resident):
- Long Term Debt - Beginning Outstanding - Unspecified Public Purpose: $226,000 ($93.16)
Retired Unspecified Public Purpose: $117,000 ($48.23)
Outstanding Unspecified Public Purpose: $109,000 ($44.93)
Verona government finances - Cash and Securities in 2017 (per resident):
- Bond Funds - Cash and Securities: $241,000 ($99.34)
- Other Funds - Cash and Securities: $274,000 ($112.94)
4.01% of this county's 2021 resident taxpayers lived in other counties in 2020 ($71,916 average adjusted gross income)
| Here: | 4.01% |
| Pennsylvania average: | 5.27% |
0.01% of residents moved from foreign countries ($162 average AGI)
Allegheny County: 0.01% Pennsylvania average: 0.01%
Top counties from which taxpayers relocated into this county between 2020 and 2021:
| from Westmoreland County, PA | |
| from Washington County, PA | |
| from Butler County, PA |
4.90% of this county's 2020 resident taxpayers moved to other counties in 2021 ($87,789 average adjusted gross income)
| Here: | 4.90% |
| Pennsylvania average: | 5.44% |
0.01% of residents moved to foreign countries ($61 average AGI)
Allegheny County: 0.01% Pennsylvania average: 0.01%
Top counties to which taxpayers relocated from this county between 2020 and 2021:
| to Westmoreland County, PA | |
| to Washington County, PA | |
| to Butler County, PA |
| Businesses in Verona, PA | ||||
| Name | Count | Name | Count | |
|---|---|---|---|---|
| AT&T | 1 | H&R Block | 1 | |
| Arby's | 1 | MasterBrand Cabinets | 1 | |
| Burger King | 1 | McDonald's | 1 | |
| Dairy Queen | 1 | New Balance | 1 | |
| Dunkin Donuts | 1 | Pizza Hut | 1 | |
| FedEx | 1 | Starbucks | 1 | |
Strongest AM radio stations in Verona:
- KDKA (1020 AM; 50 kW; PITTSBURGH, PA; Owner: INFINITY BROADCASTING OPERATIONS, INC.)
- WPGR (1510 AM; 5 kW; MONROEVILLE, PA; Owner: MCL/ MCM- INC.)
- WPIT (730 AM; 5 kW; PITTSBURGH, PA; Owner: PENNSYLVANIA MEDIA ASSOCIATES, INC.)
- WJAS (1320 AM; 6 kW; PITTSBURGH, PA; Owner: RENDA BROADCASTING CORP. OF NEVADA)
- WBGG (970 AM; 5 kW; PITTSBURGH, PA; Owner: AMFM RADIO LICENSES, L.L.C.)
- WPTT (1360 AM; 5 kW; MCKEESPORT, PA; Owner: RENDA BROADCASTING CORPORATION OF NEVADA)
- KQV (1410 AM; 5 kW; PITTSBURGH, PA; Owner: CALVARY, INC.)
- WEAE (1250 AM; 5 kW; PITTSBURGH, PA; Owner: ABC, INC.)
- WKHB (620 AM; 6 kW; IRWIN, PA; Owner: BROADCAST COMMUNICATIONS, INC.)
- WGBN (1150 AM; 1 kW; NEW KENSINGTON, PA; Owner: PENTECOSTAL TEMPLE DEVELOPMENT CORP.)
- WAMO (860 AM; 1 kW; MILLVALE, PA; Owner: SHERIDAN BROADCASTING CORPORATION)
- WAVL (910 AM; 5 kW; APOLLO, PA; Owner: EVANGEL HEIGHTS ASSEMBLY OF GOD)
- WURP (1550 AM; 1 kW; BRADDOCK, PA; Owner: URBAN RADIO OF PENNSYLVANIA, L.L.C.)
Strongest FM radio stations in Verona:
- WZPT (100.7 FM; NEW KENSINGTON, PA; Owner: INFINITY RADIO SUBSIDIARY OPERATIONS INC.)
- WSHH (99.7 FM; PITTSBURGH, PA; Owner: RENDA B/CING CORP. OF NEVADA)
- WDSY-FM (107.9 FM; PITTSBURGH, PA; Owner: INFINITY RADIO SUBSIDIARY OPERATIONS INC.)
- WJJJ (104.7 FM; PITTSBURGH, PA; Owner: CAPSTAR TX LIMITED PARTNERSHIP)
- WLTJ (92.9 FM; PITTSBURGH, PA; Owner: WPNT, INC.)
- WQED-FM (89.3 FM; PITTSBURGH, PA; Owner: WQED MULTIMEDIA)
- WWSW-FM (94.5 FM; PITTSBURGH, PA; Owner: AMFM RADIO LICENSES, L.L.C.)
- WDVE (102.5 FM; PITTSBURGH, PA; Owner: CAPSTAR TX LIMITED PARTNERSHIP)
- WRRK (96.9 FM; BRADDOCK, PA; Owner: WPNT INC)
- WPTS-FM (92.1 FM; PITTSBURGH, PA; Owner: UNIV. OF PITTSBURGH COMMONWEALTH SYS)
- WORD-FM (101.5 FM; PITTSBURGH, PA; Owner: PENNSYLVANIA MEDIA ASSOCIATES, INC.)
- WXDX-FM (105.9 FM; PITTSBURGH, PA; Owner: CAPSTAR TX LIMITED PARTNERSHIP)
- WOGI (98.3 FM; DUQUESNE, PA; Owner: KEYMARKET LICENSES, LLC)
- WKST-FM (96.1 FM; PITTSBURGH, PA; Owner: CAPSTAR TX LIMITED PARTNERSHIP)
- WYEP-FM (91.3 FM; PITTSBURGH, PA; Owner: PITTSBURGH COMM. B/CING. CORP.)
- WBZZ (93.7 FM; PITTSBURGH, PA; Owner: INFINITY RADIO SUBSIDIARY OPERATIONS INC.)
- WDUQ (90.5 FM; PITTSBURGH, PA; Owner: DUQUESNE UNIVERSITY)
- WRWJ (88.1 FM; MURRYSVILLE, PA; Owner: HE'S ALIVE, INCORPORATED)
- WSSZ (107.1 FM; GREENSBURG, PA; Owner: MCL/MCM-INC.)
- WOGG (94.9 FM; OLIVER, PA; Owner: KEYMARKET LICENSES, LLC)
TV broadcast stations around Verona:
- WBGN-LP (Channel 59; PITTSBURGH, PA; Owner: BRUNO GOODWORTH NETWORK, INC.)
- WPTG-LP (Channel 69; PITTSBURGH, PA; Owner: ABACUS TELEVISION)
- WPXI (Channel 11; PITTSBURGH, PA; Owner: WPXI-TV HOLDINGS, INC.)
- WQEX (Channel 16; PITTSBURGH, PA; Owner: WQED MULTIMEDIA)
- WCWB (Channel 22; PITTSBURGH, PA; Owner: WCWB LICENSEE, LLC)
- W65CG (Channel 65; PITTSBURGH, PA; Owner: TRINITY BROADCASTING NETWORK)
- WPCB-TV (Channel 40; GREENSBURG, PA; Owner: CORNERSTONE TELEVISION, INC.)
- KDKA-TV (Channel 2; PITTSBURGH, PA; Owner: CBS BROADCASTING INC.)
- WPGH-TV (Channel 53; PITTSBURGH, PA; Owner: WPGH LICENSEE, LLC)
- WQED (Channel 13; PITTSBURGH, PA; Owner: WQED MULTIMEDIA)
- W61CC (Channel 61; PITTSBURGH, PA; Owner: THE VIDEOHOUSE, INC.)
- WIIC-LP (Channel 29; PITTSBURGH, PA; Owner: ABACUS TELEVISION)
- WBPA-LP (Channel 29; PITTSBURGH, PA; Owner: VENTURE TECHNOLOGIES GROUP, LLC)
- WTAE-TV (Channel 4; PITTSBURGH, PA; Owner: WTAE HEARST-ARGYLE TV, INC. (CA CORP.))
- WBYD-CA (Channel 35; JOHNSTOWN, PA; Owner: BENJAMIN PEREZ)
- W63AU (Channel 63; PITTSBURGH, PA; Owner: THE BON-TELE NETWORK, INC.)
- WTOV-TV (Channel 9; STEUBENVILLE, OH; Owner: WTOV-TV HOLDINGS, INC.)
- WLLS-LP (Channel 49; INDIANA, PA; Owner: LARRY L. SCHRECONGOST)
- W66BQ (Channel 66; BEAVER, PA; Owner: BRUNO-GOODWORTH NETWORK, INC.)
- W25AX (Channel 25; KITTANNING, PA; Owner: TURNPIKE TELEVISION)
- WQVC-CA (Channel 28; GREENSBURG, PA; Owner: ABACUS TELEVISION)
- W56CG (Channel 56; GREENSBURG, PA; Owner: TURNPIKE TELEVISION)
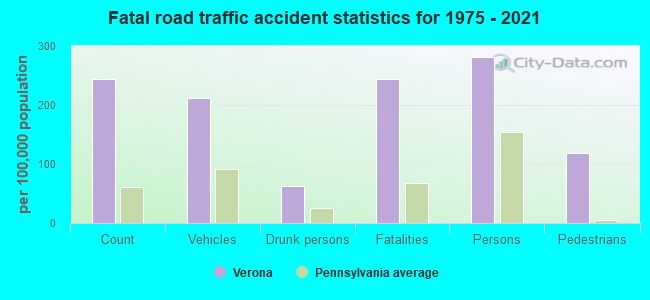
Verona fatal accident list:
Oct 29, 2011 11:23 AM, Center Avenue, Sr 2073, Lat: 40.506578, Lon: -79.842875, Vehicles: 1, Persons: 1, Pedestrians: 1, Fatalities: 1
Aug 27, 2007 10:12 AM, Sr-2073, Lat: 40.504236, Lon: -79.843175, Vehicles: 1, Persons: 2, Pedestrians: 1, Fatalities: 1
Jul 27, 1993 01:05 PM, South Ave, Vehicles: 1, Persons: 1, Fatalities: 1
Aug 3, 1983 01:99 AM, Railroad A, Vehicles: 1, Persons: 1, Fatalities: 1, Drunk persons involved: 1
Feb 16, 1980 09:00 PM, Vehicles: 1, Persons: 1, Fatalities: 1, Drunk persons involved: 1
Dec 27, 1980 05:00 PM, Persons: 1, Fatalities: 1
- National Bridge Inventory (NBI) Statistics
- 3Number of bridges
- 13ft / 3.6mTotal length
- $117,000Total costs
- 20,961Total average daily traffic
- 628Total average daily truck traffic
FCC Registered Antenna Towers:
7- EDWARD G ROACH, 184 Hulton Road (Lat: 40.517583 Lon: -79.814306), Type: 60.7, Overall height: 57.9 m, Registrant: None
- EDWARD G ROACH, 184 Hulton Road (Lat: 40.517583 Lon: -79.814306), Type: 60.7, Overall height: 57.9 m, Registrant: None
- Edward G Roach, 184 Hulton Road (Lat: 40.517583 Lon: -79.814306), Type: 60.7, Overall height: 57.9 m, Registrant: None
- Edward G Roach, 184 Hulton Road (Lat: 40.517583 Lon: -79.814306), Type: 60.7, Structure height: 42003 m, Overall height: 57.9 m, Registrant: Sba Towers, LLC, Eroach@sbasite.Com, , Boca -Raton, Phone: (561) 995-7670
- Edward G Roach, 255 Haskell Drive (Pa01398-B) (Lat: 40.517583 Lon: -79.814306), Type: 60.7, Structure height: 42003 m, Overall height: 57.9 m, Registrant: Sba Towers, LLC, Eroach@sbasite.Com, , Boca -Raton, Phone: (561) 995-7670
- Edward G Roach, 255 Haskell Drive (Pa01398-B) (Lat: 40.517583 Lon: -79.814306), Type: 60.7, Structure height: 42003 m, Overall height: 57.9 m, Registrant: Sba Towers, LLC, Eroach@sbasite.Com, , Boca -Raton, Phone: (561) 995-7670
- 7603 Tyler Rd (Lat: 40.468889 Lon: -79.878889), Type: 37.0, Overall height: 26.9 m, Registrant: Wilkinsburg Penn Jt Water Authority, Pitts-burgh, Phone: (412) 243-6200
FCC Registered Broadcast Land Mobile Towers:
6- 6th At Center St (Lat: 40.505889 Lon: -79.822556), Call Sign: KYU869, Licensee ID: L00123905,
Assigned Frequencies: 33.8000 MHz, 33.8600 MHz, 154.010 MHz, 154.400 MHz, Grant Date: 07/21/2004, Expiration Date: 07/24/2014, Cancellation Date: 09/27/2014, Registrant: Point Breeze Vol Fire Dept, 6th & Center Sts, Verona, PA 15147, Phone: (412) 828-0690, Fax: (412) 828-1608, Email:
- Lat: 40.486722 Lon: -79.847000, Call Sign: WPLF935,
Assigned Frequencies: 464.375 MHz, 464.975 MHz, Grant Date: 03/14/2022, Expiration Date: 03/26/2032, Certifier: Rick Shriver, Registrant: Green Oaks Country Club, 5741 3rd Street, Verona, PA 15147, Phone: (412) 793-4062, Fax: (412) 793-4948, Email:
- Longwood Tank, Ridgemead Drive (Lat: 40.525833 Lon: -79.799167), Type: Tank, Structure height: 9 m, Call Sign: WPLZ813,
Assigned Frequencies: 457.300 MHz, Grant Date: 07/03/2003, Expiration Date: 04/28/2013, Cancellation Date: 06/29/2013, Certifier: Cheryl E Stezoski, Registrant: National License Corporation, 9050 Briarclift Rd, Indianapolis, IN 46256-2206, Phone: (317) 849-5866, Fax: (800) 841-0516, Email:
- Lat: 40.486111 Lon: -79.873056, Call Sign: WQAT531,
Assigned Frequencies: 452.262 MHz, 457.262 MHz, Grant Date: 08/03/2004, Expiration Date: 08/03/2014, Cancellation Date: 11/22/2010, Certifier: Gary Tener, Registrant: Business Radio Licensing, 30251 Golden Lantern Ste E 501, Laguna Niguel, CA 92677-5993, Phone: (949) 348-8510, Fax: (949) 348-8514, Email:
- 5340 Saltsburg Rd (Lat: 40.479528 Lon: -79.835472), Type: Bant, Structure height: 6 m, Overall height: 8 m, Call Sign: WQLA526,
Assigned Frequencies: 462.750 MHz, Grant Date: 11/12/2009, Expiration Date: 11/12/2019, Cancellation Date: 01/18/2020, Certifier: Henry R Meier, Registrant: Visiplex, Inc., 100 N Fairway Drive, Suite 120, Vernon Hills, IL 60061, Phone: (847) 918-0250, Fax: (847) 918-0259, Email:
- Lat: 40.510306 Lon: -79.838000, Call Sign: WQZI441,
Assigned Frequencies: 451.362 MHz, 456.362 MHz, 457.200 MHz, 463.262 MHz, 468.262 MHz, Grant Date: 05/25/2017, Expiration Date: 05/25/2027, Certifier: Sheri Errico, Registrant: Lauttamus Communications Inc, 1344 Cove Mill Road, Weirton, WV 26062, Phone: (304) 723-7420, Email:
FCC Registered Microwave Towers:
5- PA-PIT1006A, 4300 Longue Vue Drive (Lat: 40.482000 Lon: -79.861444), Type: Pole, Structure height: 44.8 m, Call Sign: WQMA532,
Assigned Frequencies: 11345.0 MHz, 19575.0 MHz, 19325.0 MHz, 21975.0 MHz, 19675.0 MHz, 19375.0 MHz, 21575.0 MHz, 19475.0 MHz, Grant Date: 06/11/2010, Expiration Date: 06/11/2020, Cancellation Date: 06/09/2020, Certifier: Nadja S Sodos-Wallace, Registrant: Sprint Corporation, 12502 Sunrise Valley Drive, M/S: Varesa0209, Reston, VA 20196, Phone: (800) 572-8256, Fax: (703) 433-4483, Email:
- PA-PIT080A, 184 Hulton Road (Lat: 40.517583 Lon: -79.814306), Type: Tower, Structure height: 57.9 m, Overall height: 60.7 m, Call Sign: WQMA638,
Assigned Frequencies: 17865.0 MHz, Grant Date: 06/14/2010, Expiration Date: 06/14/2020, Cancellation Date: 06/09/2020, Certifier: Nadja S Sodos-Wallace, Registrant: Sprint Corporation, 12502 Sunrise Valley Drive, M/S: Varesa0209, Reston, VA 20196, Phone: (800) 572-8256, Fax: (703) 433-4483, Email:
- PA-PIT200A, 1 Demor Dr. (Lat: 40.504111 Lon: -79.845861), Type: Bant, Structure height: 24.4 m, Call Sign: WQMA697,
Assigned Frequencies: 22525.0 MHz, 22775.0 MHz, Grant Date: 06/14/2010, Expiration Date: 06/14/2020, Cancellation Date: 06/09/2020, Certifier: Nadja S Sodos-Wallace, Registrant: Sprint Corporation, 12502 Sunrise Valley Drive, M/S: Varesa0209, Reston, VA 20196, Phone: (800) 572-8256, Fax: (703) 433-4483, Email:
- LONGUE VUE, 4300 Longue Vue Dr (Lat: 40.481917 Lon: -79.861417), Type: Mtower, Structure height: 46 m, Overall height: 51.8 m, Call Sign: WQQR482,
Assigned Frequencies: 21870.0 MHz, 21920.0 MHz, 22020.0 MHz, 22070.0 MHz, Grant Date: 01/10/2023, Expiration Date: 02/15/2033, Certifier: John E Monday, Registrant: At&t Services, Inc., 208 S Akard St, 20f, Dallas, TX 75202, Phone: (855) 699-7073, Email:
- LONGVUE, 400 Longvue Dr (Lat: 40.481722 Lon: -79.861139), Overall height: 49.4 m, Call Sign: WLU837,
Assigned Frequencies: 19015.0 MHz, Grant Date: 03/06/2001, Expiration Date: 02/01/2011, Cancellation Date: 05/08/2007, Certifier: Carol L Tacker, Registrant: Cingular Wireless LLC, 11760 U.S. Highway 1, 6th Floor, North Palm Beach, FL 33408, Phone: (202) 255-1679, Fax: (561) 279-2097, Email:
FCC Registered Amateur Radio Licenses:
66 (See the full list of FCC Registered Amateur Radio Licenses in Verona)FAA Registered Aircraft:
5- Aircraft: S.O.C.A.T.A. RALLYE 235E (Category: Land, Seats: 4, Weight: Up to 12,499 Pounds), Engine: LYCOMING 0-540 SERIES (250 HP) (Reciprocating)
N-Number: 14EE, N14EE, N-14EE, Serial Number: 13117, Year manufactured: 1978, Airworthiness Date: 11/15/1979, Certificate Issue Date: 10/30/2002
Registrant (Corporation): 14ee Corp, Po Box 5, Verona, PA 15147 - Aircraft: PIPER PA-28-181 (Category: Land, Seats: 4, Weight: Up to 12,499 Pounds, Speed: 105 mph), Engine: LYCOMING O-360 SERIES (180 HP) (Reciprocating)
N-Number: 293HP, N293HP, N-293HP, Serial Number: 2843603, Year manufactured: 2004, Airworthiness Date: 12/08/2004, Certificate Issue Date: 04/13/2015
Registrant (Individual): Paul K Schempp, 877 2nd St, Verona, PA 15147 - Aircraft: CESSNA 182P (Category: Land, Seats: 4, Weight: Up to 12,499 Pounds, Speed: 120 mph), Engine: CONT MOTOR O-470 SERIES (230 HP) (Reciprocating)
N-Number: 4711K, N4711K, N-4711K, Serial Number: 18263710, Year manufactured: 1975, Airworthiness Date: 03/25/1975, Certificate Issue Date: 08/25/2007
Registrant (Corporation): Fhk Inc, C/O Mark Flynn / 441 Jefferson St, Verona, PA 15147 - Aircraft: MOONEY M20C (Category: Land, Seats: 4, Weight: Up to 12,499 Pounds, Speed: 127 mph), Engine: LYCOMING O&VO-360 SER (180 HP) (Reciprocating)
N-Number: 7415V, N7415V, N-7415V, Serial Number: 20-1149, Year manufactured: 1975, Certificate Issue Date: 12/17/2013
Registrant (Individual): James E Jr Winnier, 126 Jade Dr, Verona, PA 15147 - Aircraft: BEECH A36 (Category: Land, Seats: 6, Weight: Up to 12,499 Pounds, Speed: 138 mph), Engine: CONT MOTOR IO 520 SERIES (285 HP) (Reciprocating)
N-Number: 9192Q, N9192Q, N-9192Q, Serial Number: E-259, Year manufactured: 1971, Airworthiness Date: 01/04/1971, Certificate Issue Date: 07/24/1989
Registrant (Corporation): Monroe Aviation Inc, 6640 Quincy Dr, Verona, PA 15147
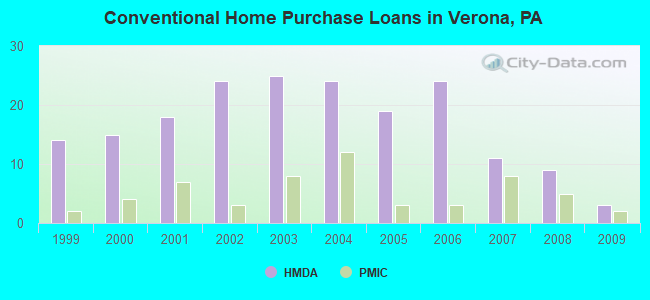
| Home Mortgage Disclosure Act Aggregated Statistics For Year 2009 (Based on 1 full tract) | ||||||||||||
| A) FHA, FSA/RHS & VA Home Purchase Loans | B) Conventional Home Purchase Loans | C) Refinancings | D) Home Improvement Loans | F) Non-occupant Loans on < 5 Family Dwellings (A B C & D) | G) Loans On Manufactured Home Dwelling (A B C & D) | |||||||
|---|---|---|---|---|---|---|---|---|---|---|---|---|
| Number | Average Value | Number | Average Value | Number | Average Value | Number | Average Value | Number | Average Value | Number | Average Value | |
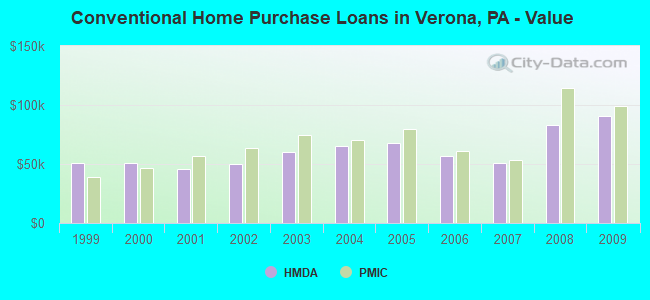
| LOANS ORIGINATED | 8 | $68,625 | 3 | $90,333 | 11 | $74,636 | 7 | $18,429 | 3 | $38,667 | 0 | $0 |
| APPLICATIONS APPROVED, NOT ACCEPTED | 0 | $0 | 0 | $0 | 2 | $69,500 | 1 | $5,000 | 0 | $0 | 1 | $80,000 |
| APPLICATIONS DENIED | 0 | $0 | 0 | $0 | 11 | $105,636 | 6 | $12,167 | 2 | $53,000 | 0 | $0 |
| APPLICATIONS WITHDRAWN | 3 | $55,333 | 2 | $36,000 | 8 | $100,375 | 0 | $0 | 1 | $59,000 | 0 | $0 |
| FILES CLOSED FOR INCOMPLETENESS | 0 | $0 | 0 | $0 | 1 | $94,000 | 0 | $0 | 0 | $0 | 0 | $0 |
Detailed HMDA statistics for the following Tracts: 5240.00
| Private Mortgage Insurance Companies Aggregated Statistics For Year 2009 (Based on 1 full tract) | ||
| A) Conventional Home Purchase Loans | ||
|---|---|---|
| Number | Average Value | |
| LOANS ORIGINATED | 2 | $99,500 |
| APPLICATIONS APPROVED, NOT ACCEPTED | 0 | $0 |
| APPLICATIONS DENIED | 0 | $0 |
| APPLICATIONS WITHDRAWN | 0 | $0 |
| FILES CLOSED FOR INCOMPLETENESS | 0 | $0 |
Detailed PMIC statistics for the following Tracts: 5240.00
2004 - 2018 National Fire Incident Reporting System (NFIRS) incidents
- Fire incident types reported to NFIRS in Verona, PA
- 14650.0%Structure Fires
- 6421.9%Other
- 4916.8%Outside Fires
- 3311.3%Mobile Property/Vehicle Fires
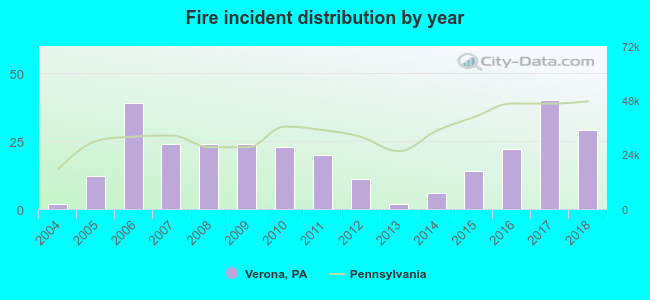 Based on the data from the years 2004 - 2018 the average number of fires per year is 19. The highest number of reported fires - 40 took place in 2017, and the least - 2 in 2004. The data has an increasing trend.
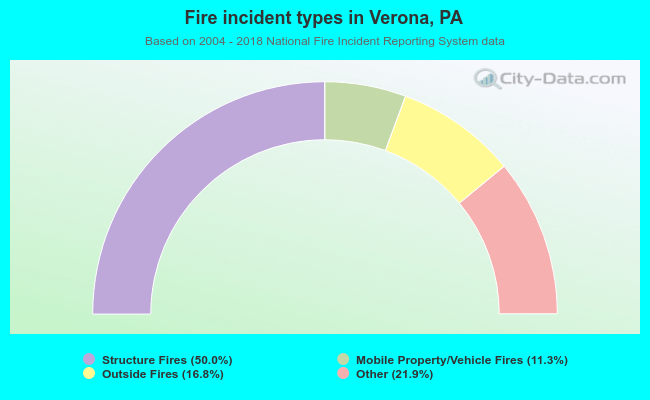 When looking into fire subcategories, the most incidents belonged to: Structure Fires (50.0%), and Other (21.9%).
| Most common first names in Verona, PA among deceased individuals | ||
| Name | Count | Lived (average) |
|---|---|---|
| Mary | 268 | 80.6 years |
| John | 251 | 75.2 years |
| William | 240 | 75.5 years |
| Joseph | 163 | 75.2 years |
| James | 140 | 71.7 years |
| Robert | 130 | 71.8 years |
| Charles | 112 | 74.4 years |
| Margaret | 111 | 81.3 years |
| Anna | 108 | 81.2 years |
| George | 108 | 74.9 years |
| Most common last names in Verona, PA among deceased individuals | ||
| Last name | Count | Lived (average) |
|---|---|---|
| Smith | 56 | 77.3 years |
| Davis | 35 | 77.0 years |
| Miller | 34 | 76.8 years |
| Thompson | 25 | 77.6 years |
| Young | 24 | 76.2 years |
| Williams | 22 | 80.9 years |
| Moore | 21 | 76.4 years |
| Brown | 21 | 77.4 years |
| Jackson | 18 | 69.0 years |
| Anderson | 17 | 79.6 years |
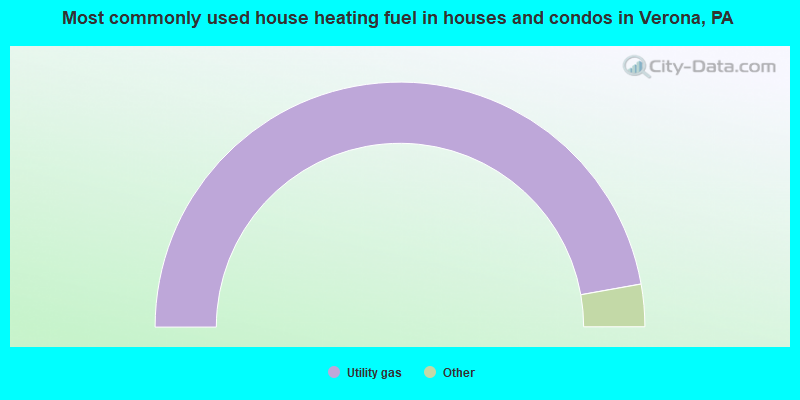
- 94.4%Utility gas
- 3.3%Fuel oil, kerosene, etc.
- 2.3%Electricity
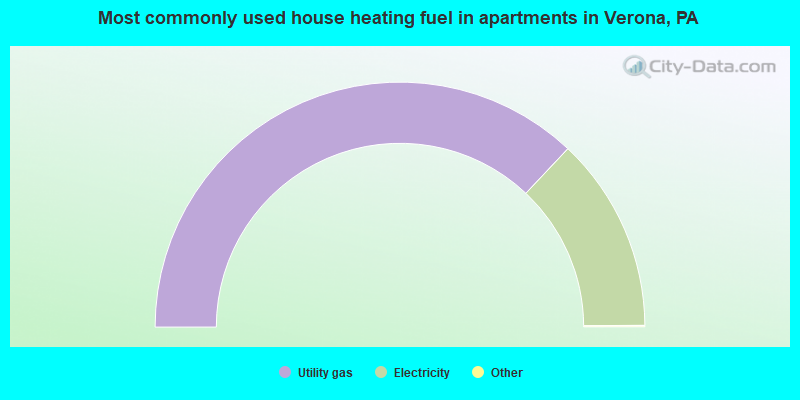
- 74.2%Utility gas
- 25.8%Electricity
Verona compared to Pennsylvania state average:
- Median household income below state average.
- Median house value below state average.
- Hispanic race population percentage significantly below state average.
- Foreign-born population percentage significantly below state average.
- Renting percentage above state average.
- Length of stay since moving in significantly above state average.

|
|
Total of 130 patent applications in 2008-2024.