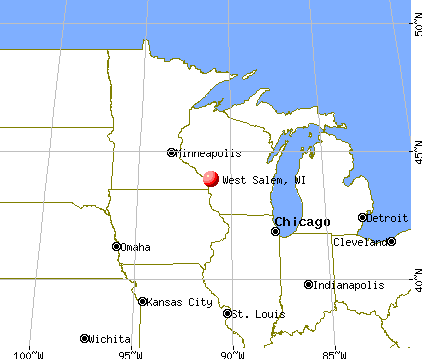
West Salem, Wisconsin
Submit your own pictures of this village and show them to the world
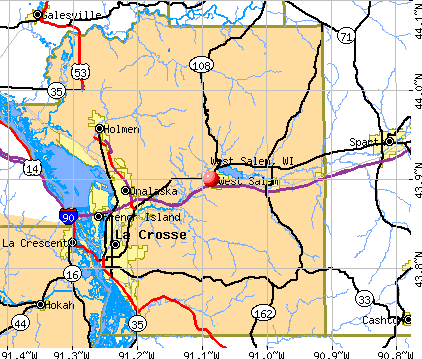
- OSM Map
- General Map
- Google Map
- MSN Map
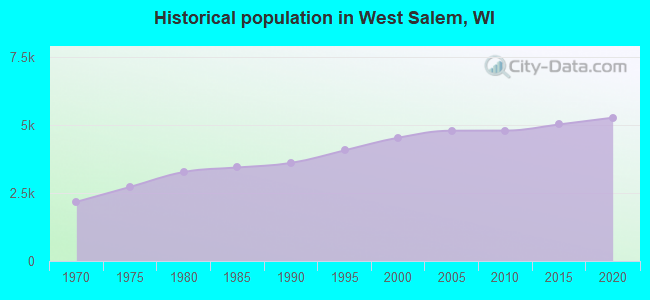
Population change since 2000: +16.5%
 |
| Males: 2,596 | |
| Females: 2,693 |
| Median resident age: | 45.1 years |
| Wisconsin median age: | 40.4 years |
Zip codes: 54669.
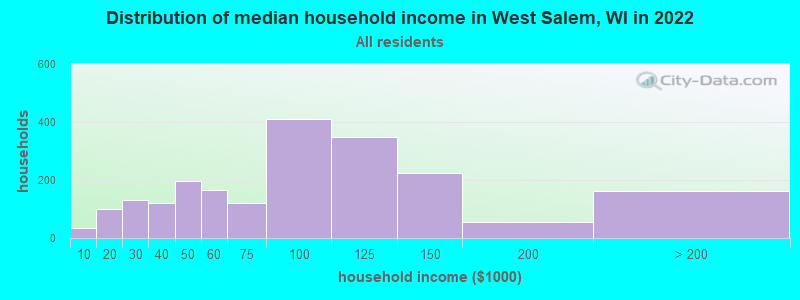
| West Salem: | $80,776 |
| WI: | $70,996 |
Estimated per capita income in 2022: $35,756 (it was $19,904 in 2000)
West Salem village income, earnings, and wages data
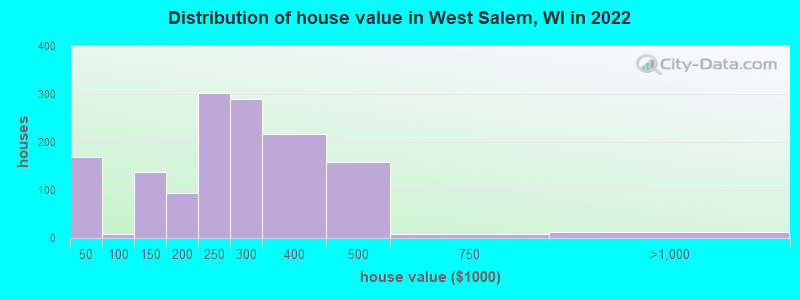
Estimated median house or condo value in 2022: $249,163 (it was $92,300 in 2000)
| West Salem: | $249,163 |
| WI: | $252,800 |
Mean prices in 2022: all housing units: $263,301; detached houses: $306,050; townhouses or other attached units: $329,157; mobile homes: $42,000
Median gross rent in 2022: $1,091.
(4.8% for White Non-Hispanic residents, 17.0% for Hispanic or Latino residents)
Detailed information about poverty and poor residents in West Salem, WI

Compare current foreclosures near West Salem, WI:
| Photo | Address | Area | Beds / Baths | Price | Details |
|---|---|---|---|---|---|

|
#1
Innsbruck Rd
West Salem, WI 54669
|
- sq. feet
|
- baths - beds |
show details | |

|
#2
Panther Pass
West Salem, WI 54669
|
- sq. feet
|
- baths - beds |
show details | |

|
#3
Loging Rd
West Salem, WI 54669
|
- sq. feet
|
- baths - beds |
show details | |

|
#4
Mill St N Apt 1
West Salem, WI 54669
|
- sq. feet
|
- baths - beds |
show details | |

|
#5
Daffodil St
West Salem, WI 54669
|
- sq. feet
|
- baths - beds |
show details | |

|
#6
W Montgomery St
Sparta, WI 54656
|
1,900 sq. feet
|
2 baths 3 beds |
$198,900
|
show details |

|
#7
Van Ness St N
West Salem, WI 54669
|
- sq. feet
|
- baths - beds |
show details | |

|
#8
S 2nd St
La Crescent, MN 55947
|
1,302 sq. feet
|
1 baths 2 beds |
show details | |

|
#9
Garfield Ave
Sparta, WI 54656
|
- sq. feet
|
2 baths 3 beds |
show details | |

|
#10
Regent Dr
La Crescent, MN 55947
|
1,358 sq. feet
|
2 baths 3 beds |
show details |
| Photo | Address | Area | Beds / Baths | Price | Details |
|---|---|---|---|---|---|

|
#11
Us Highway 53 Trlr 47
Holmen, WI 54636
|
- sq. feet
|
- baths - beds |
show details | |

|
#12
Willow Dr
La Crosse, WI 54601
|
- sq. feet
|
- baths - beds |
show details | |

|
#13
Harvest Cir
Holmen, WI 54636
|
- sq. feet
|
- baths - beds |
show details | |

|
#14
Ristow Ct Apt 4
La Crosse, WI 54601
|
- sq. feet
|
- baths - beds |
show details | |

|
#15
Harvest Cir
Holmen, WI 54636
|
- sq. feet
|
- baths - beds |
show details | |

|
#16
7th St S Apt 4
La Crosse, WI 54601
|
- sq. feet
|
- baths - beds |
show details | |

|
#17
County Highway Bc
Sparta, WI 54656
|
- sq. feet
|
- baths - beds |
show details | |

|
#18
7th St S Apt 3
La Crosse, WI 54601
|
- sq. feet
|
- baths - beds |
show details | |

|
#19
State St Apt 426
La Crosse, WI 54601
|
- sq. feet
|
- baths - beds |
show details | |

|
#20
Mormon Coulee Rd, Trlr 44
La Crosse, WI 54601
|
- sq. feet
|
- baths - beds |
show details |
| Photo | Address | Area | Beds / Baths | Price | Details |
|---|---|---|---|---|---|

|
#21
9th St S
La Crosse, WI 54601
|
- sq. feet
|
- baths - beds |
show details | |

|
#22
Riverplace Dr Apt 313
La Crosse, WI 54601
|
- sq. feet
|
- baths - beds |
show details | |

|
#23
Grant Rd
Galesville, WI 54630
|
- sq. feet
|
- baths - beds |
show details | |

|
#24
Lakeshore Dr Apt 5
La Crosse, WI 54603
|
- sq. feet
|
- baths - beds |
show details | |

|
#25
Skyline Blvd
La Crosse, WI 54601
|
- sq. feet
|
- baths - beds |
show details | |

|
#26
Market St
La Crosse, WI 54601
|
- sq. feet
|
- baths - beds |
show details | |

|
#27
Mormon Coulee Rd, Trlr 96
La Crosse, WI 54601
|
- sq. feet
|
- baths - beds |
show details | |

|
#28
East Ave S Apt 114
La Crosse, WI 54601
|
- sq. feet
|
- baths - beds |
show details | |

|
#29
Paulson Ln
Galesville, WI 54630
|
- sq. feet
|
- baths - beds |
show details | |

|
#30
Icecap Rd
Sparta, WI 54656
|
- sq. feet
|
- baths - beds |
show details |
| Photo | Address | Area | Beds / Baths | Price | Details |
|---|---|---|---|---|---|

|
#31
State Highway 162
Chaseburg, WI 54621
|
- sq. feet
|
- baths - beds |
show details | |

|
#32
Avon Rd, Trlr 114
Sparta, WI 54656
|
- sq. feet
|
- baths - beds |
show details | |

|
#33
Dewitt St
Sparta, WI 54656
|
- sq. feet
|
- baths - beds |
show details | |

|
#34
River Rd Lot 101
Sparta, WI 54656
|
- sq. feet
|
- baths - beds |
show details | |

|
#35
Icecap Rd
Sparta, WI 54656
|
- sq. feet
|
- baths - beds |
show details | |

|
#36
Icecap Rd
Sparta, WI 54656
|
- sq. feet
|
- baths - beds |
show details | |

|
#37
Vermeer St
Holmen, WI 54636
|
- sq. feet
|
- baths - beds |
show details | |

|
#38
Miller St Apt 210
La Crosse, WI 54601
|
- sq. feet
|
- baths - beds |
show details | |

|
#39
S 16th St
La Crescent, MN 55947
|
- sq. feet
|
- baths - beds |
show details | |

|
#40
E Hogg St # 704
Melrose, WI 54642
|
- sq. feet
|
- baths - beds |
show details |
| Photo | Address | Area | Beds / Baths | Price | Details |
|---|---|---|---|---|---|

|
#41
Riverwood Pl
Sparta, WI 54656
|
- sq. feet
|
- baths - beds |
show details | |

|
#42
Cedar Rd
La Crosse, WI 54601
|
- sq. feet
|
- baths - beds |
show details | |

|
#43
Eagle Ln
La Crosse, WI 54601
|
- sq. feet
|
- baths - beds |
show details | |

|
#44
Bice Ave
Holmen, WI 54636
|
- sq. feet
|
- baths - beds |
show details | |

|
#45
Jade Rd
Sparta, WI 54656
|
- sq. feet
|
- baths - beds |
show details | |

|
#46
Long Coulee Rd
Holmen, WI 54636
|
- sq. feet
|
- baths - beds |
show details | |

|
#47
4th Ave
Cashton, WI 54619
|
- sq. feet
|
- baths - beds |
show details | |

|
#48
La Crescent St Apt 35
La Crosse, WI 54603
|
- sq. feet
|
- baths - beds |
show details | |

|
#49
Meadow Pl
Onalaska, WI 54650
|
- sq. feet
|
- baths - beds |
show details | |

|
Check over 1 million property listings on Foreclosure.com!
|
browse all offers | |||


- 4,63888.2%White alone
- 1813.4%Asian alone
- 1783.4%Two or more races
- 1162.2%Hispanic
- 160.3%Other race alone
- 110.2%Black alone
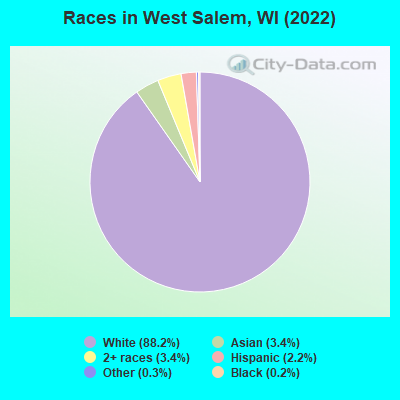
Races in West Salem detailed stats: ancestries, foreign born residents, place of birth
According to our research of Wisconsin and other state lists, there were 10 registered sex offenders living in West Salem, Wisconsin as of April 28, 2024.
The ratio of all residents to sex offenders in West Salem is 497 to 1.
The ratio of registered sex offenders to all residents in this city is lower than the state average.
Type |
2009 |
2010 |
2011 |
2012 |
2013 |
2014 |
2015 |
2016 |
2017 |
2018 |
2019 |
2020 |
2021 |
2022 |
|---|---|---|---|---|---|---|---|---|---|---|---|---|---|---|
| Murders (per 100,000) | 0 (0.0) | 0 (0.0) | 0 (0.0) | 0 (0.0) | 0 (0.0) | 0 (0.0) | 0 (0.0) | 0 (0.0) | 0 (0.0) | 0 (0.0) | 0 (0.0) | 0 (0.0) | 0 (0.0) | 0 (0.0) |
| Rapes (per 100,000) | 1 (20.7) | 0 (0.0) | 1 (20.7) | 1 (20.6) | 1 (20.4) | 3 (59.7) | 0 (0.0) | 0 (0.0) | 0 (0.0) | 1 (19.8) | 0 (0.0) | 2 (39.7) | 0 (0.0) | 2 (37.9) |
| Robberies (per 100,000) | 0 (0.0) | 0 (0.0) | 0 (0.0) | 0 (0.0) | 0 (0.0) | 1 (19.9) | 0 (0.0) | 0 (0.0) | 0 (0.0) | 0 (0.0) | 0 (0.0) | 0 (0.0) | 0 (0.0) | 0 (0.0) |
| Assaults (per 100,000) | 0 (0.0) | 0 (0.0) | 3 (62.2) | 3 (61.9) | 2 (40.7) | 2 (39.8) | 4 (79.1) | 5 (98.9) | 8 (160.2) | 4 (79.1) | 5 (98.3) | 8 (158.8) | 4 (79.5) | 5 (94.9) |
| Burglaries (per 100,000) | 12 (248.5) | 20 (416.8) | 27 (560.2) | 5 (103.1) | 3 (61.1) | 10 (199.1) | 4 (79.1) | 5 (98.9) | 4 (80.1) | 3 (59.3) | 3 (59.0) | 1 (19.9) | 2 (39.7) | 5 (94.9) |
| Thefts (per 100,000) | 86 (1,781) | 63 (1,313) | 54 (1,120) | 71 (1,464) | 65 (1,323) | 64 (1,274) | 32 (632.7) | 55 (1,088) | 24 (480.7) | 17 (336.3) | 32 (629.1) | 32 (635.3) | 47 (934.0) | 34 (645.0) |
| Auto thefts (per 100,000) | 2 (41.4) | 3 (62.5) | 4 (83.0) | 6 (123.7) | 3 (61.1) | 0 (0.0) | 1 (19.8) | 2 (39.6) | 1 (20.0) | 1 (19.8) | 4 (78.6) | 1 (19.9) | 4 (79.5) | 4 (75.9) |
| Arson (per 100,000) | 0 (0.0) | 1 (20.8) | 1 (20.7) | 1 (20.6) | 0 (0.0) | 0 (0.0) | 0 (0.0) | 0 (0.0) | 0 (0.0) | 0 (0.0) | 0 (0.0) | 0 (0.0) | 1 (19.9) | 0 (0.0) |
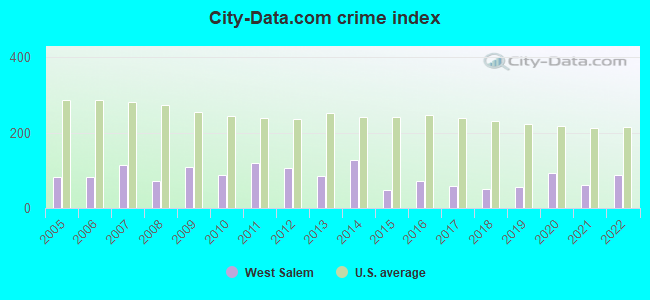
| City-Data.com crime index | 108.5 | 86.7 | 119.7 | 104.6 | 86.5 | 126.6 | 48.2 | 73.4 | 58.5 | 50.8 | 55.2 | 91.9 | 62.4 | 87.8 |
The City-Data.com crime index weighs serious crimes and violent crimes more heavily. Higher means more crime, U.S. average is 246.1. It adjusts for the number of visitors and daily workers commuting into cities.
Crime rate in West Salem detailed stats: murders, rapes, robberies, assaults, burglaries, thefts, arson
Full-time law enforcement employees in 2021, including police officers: 10 (9 officers - 9 male; 0 female).
| Officers per 1,000 residents here: | 1.79 |
| Wisconsin average: | 2.07 |
 Recent articles from our blog. Our writers, many of them Ph.D. graduates or candidates, create easy-to-read articles on a wide variety of topics.

 | housing location advice for work in Sparta: maybe West Salem or Onalaska? (3 replies) |
| Good towns/areas to live in between LaCrosse and Fort McCoy? (2 replies) |
| La Crosse or Eau Claire for our family (6 replies) |
| La Crosse, WI (11 replies) |
| Moving To Onalaska (6 replies) |
| Info on Lacrosse (1 reply) |
Latest news from West Salem, WI collected exclusively by city-data.com from local newspapers, TV, and radio stations
Ancestries: German (53.0%), Norwegian (12.1%), European (5.8%), American (4.7%), Irish (3.8%), English (2.3%).
Current Local Time: CST time zone
Incorporated in 1893
Elevation: 742 feet
Land area: 2.38 square miles.
Population density: 2,227 people per square mile (low).
91 residents are foreign born
| This village: | 1.7% |
| Wisconsin: | 5.0% |
Median real estate property taxes paid for housing units with mortgages in 2022: $3,445 (1.4%)
Median real estate property taxes paid for housing units with no mortgage in 2022: $3,166 (1.4%)
Nearest city with pop. 50,000+: La Crosse, WI  (9.4 miles , pop. 51,818).
Nearest city with pop. 200,000+: Madison, WI (102.3 miles , pop. 208,054).
Nearest city with pop. 1,000,000+: Chicago, IL (223.8 miles , pop. 2,896,016).
Nearest cities:
), ), ), ), ), Latitude: 43.90 N, Longitude: 91.09 W
Daytime population change due to commuting: +394 (+7.5%)
Workers who live and work in this village: 737 (28.1%)
Area code: 608

West Salem, Wisconsin accommodation & food services, waste management - Economy and Business Data
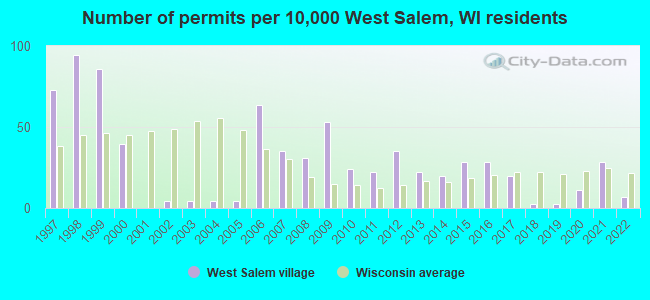
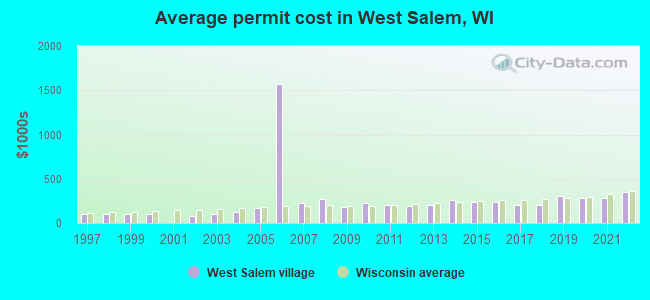
Single-family new house construction building permits:
- 2022: 3 buildings, average cost: $350,000
- 2021: 13 buildings, average cost: $285,700
- 2020: 5 buildings, average cost: $277,000
- 2019: 1 building, cost: $300,000
- 2018: 1 building, cost: $208,800
- 2017: 9 buildings, average cost: $208,800
- 2016: 13 buildings, average cost: $236,300
- 2015: 13 buildings, average cost: $238,400
- 2014: 9 buildings, average cost: $262,600
- 2013: 10 buildings, average cost: $197,800
- 2012: 16 buildings, average cost: $195,900
- 2011: 10 buildings, average cost: $206,200
- 2010: 11 buildings, average cost: $222,000
- 2009: 24 buildings, average cost: $179,300
- 2008: 14 buildings, average cost: $268,200
- 2007: 16 buildings, average cost: $228,700
- 2006: 29 buildings, average cost: $1,572,600
- 2005: 2 buildings, average cost: $167,500
- 2004: 2 buildings, average cost: $121,200
- 2003: 2 buildings, average cost: $97,500
- 2002: 2 buildings, average cost: $80,000
- 2000: 18 buildings, average cost: $99,600
- 1999: 39 buildings, average cost: $97,800
- 1998: 43 buildings, average cost: $104,700
- 1997: 33 buildings, average cost: $106,600
| Here: | 2.2% |
| Wisconsin: | 2.7% |
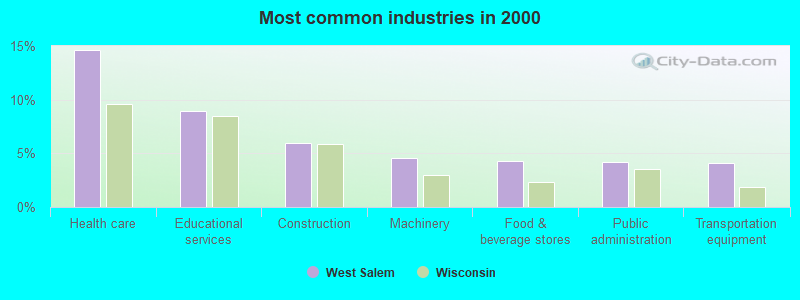
- Health care (14.7%)
- Educational services (8.9%)
- Construction (5.9%)
- Machinery (4.6%)
- Food & beverage stores (4.3%)
- Public administration (4.2%)
- Transportation equipment (4.1%)
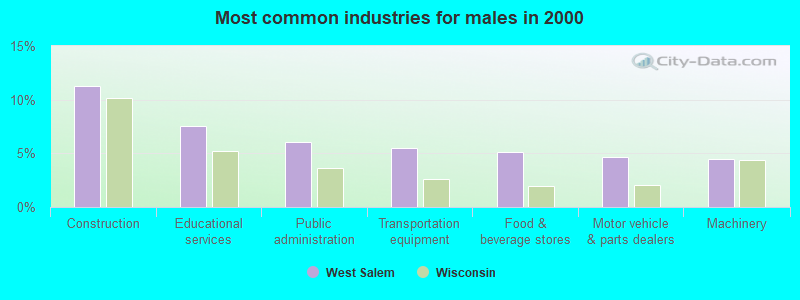
- Construction (11.3%)
- Educational services (7.6%)
- Public administration (6.1%)
- Transportation equipment (5.5%)
- Food & beverage stores (5.1%)
- Motor vehicle & parts dealers (4.6%)
- Machinery (4.4%)
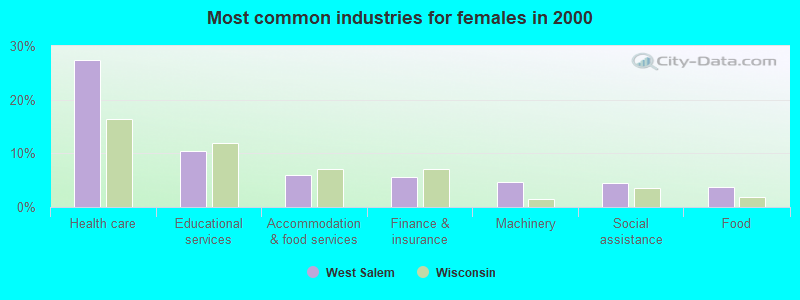
- Health care (27.4%)
- Educational services (10.4%)
- Accommodation & food services (6.0%)
- Finance & insurance (5.6%)
- Machinery (4.7%)
- Social assistance (4.5%)
- Food (3.8%)
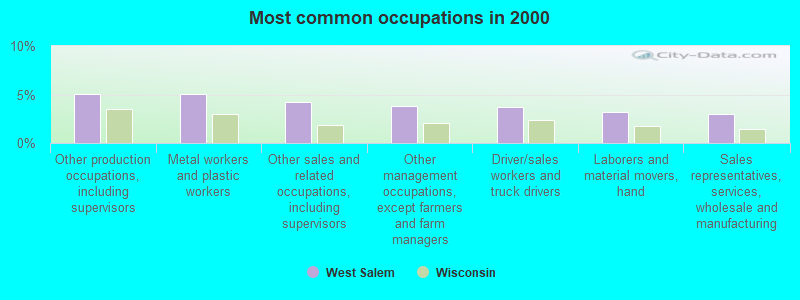
- Other production occupations, including supervisors (5.1%)
- Metal workers and plastic workers (5.0%)
- Other sales and related occupations, including supervisors (4.2%)
- Other management occupations, except farmers and farm managers (3.8%)
- Driver/sales workers and truck drivers (3.7%)
- Laborers and material movers, hand (3.2%)
- Sales representatives, services, wholesale and manufacturing (3.0%)
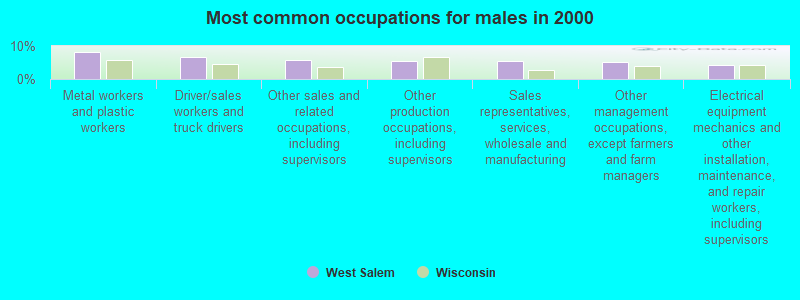
- Metal workers and plastic workers (8.2%)
- Driver/sales workers and truck drivers (6.8%)
- Other sales and related occupations, including supervisors (5.8%)
- Other production occupations, including supervisors (5.5%)
- Sales representatives, services, wholesale and manufacturing (5.4%)
- Other management occupations, except farmers and farm managers (5.1%)
- Electrical equipment mechanics and other installation, maintenance, and repair workers, including supervisors (4.2%)
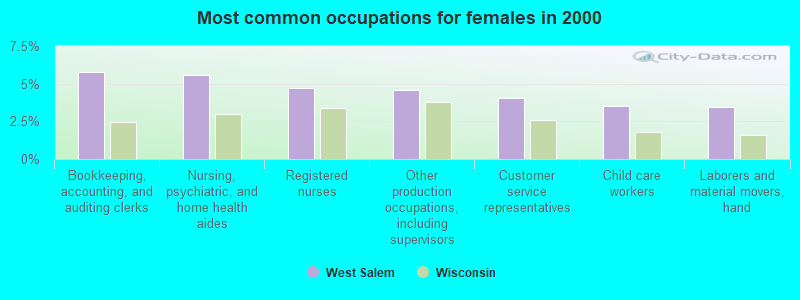
- Bookkeeping, accounting, and auditing clerks (5.8%)
- Nursing, psychiatric, and home health aides (5.6%)
- Registered nurses (4.7%)
- Other production occupations, including supervisors (4.6%)
- Customer service representatives (4.1%)
- Child care workers (3.5%)
- Laborers and material movers, hand (3.5%)
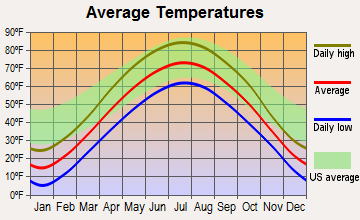
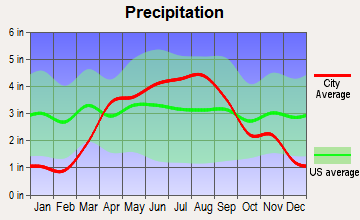
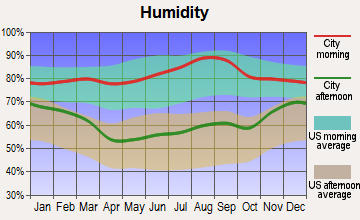
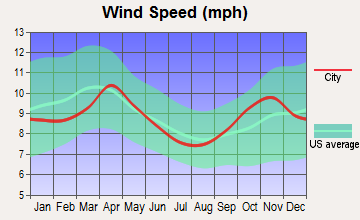
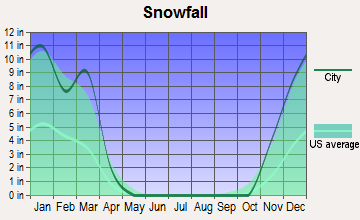
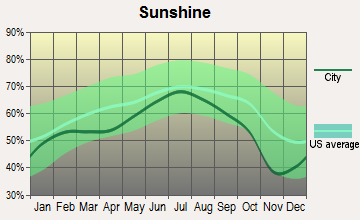
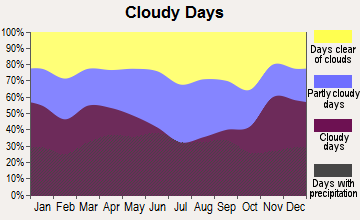
Average climate in West Salem, Wisconsin
Based on data reported by over 4,000 weather stations
|
|


(lower is better)
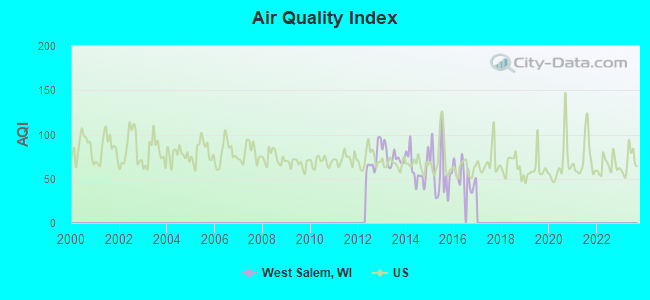
Air Quality Index (AQI) level in 2016 was 52.7. This is better than average.
| City: | 52.7 |
| U.S.: | 72.6 |
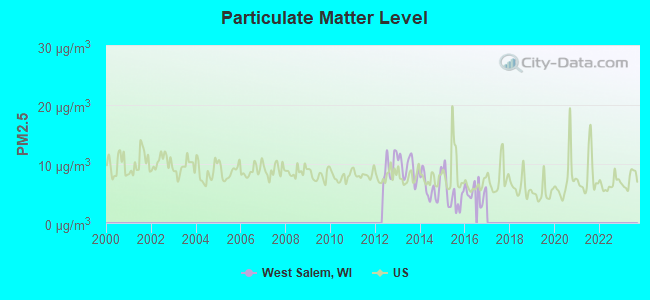
Particulate Matter (PM2.5) [µg/m3] level in 2016 was 5.24. This is significantly better than average. Closest monitor was 11.0 miles away from the city center.
| City: | 5.24 |
| U.S.: | 8.11 |
Tornado activity:
West Salem-area historical tornado activity is near Wisconsin state average. It is 15% greater than the overall U.S. average.
On 5/5/1965, a category F3 (max. wind speeds 158-206 mph) tornado 13.6 miles away from the West Salem village center injured 7 people and caused between $500,000 and $5,000,000 in damages.
On 6/5/1980, a category F3 tornado 17.2 miles away from the village center injured one person and caused between $500,000 and $5,000,000 in damages.
Earthquake activity:
West Salem-area historical earthquake activity is significantly above Wisconsin state average. It is 43% greater than the overall U.S. average.On 7/9/1975 at 14:54:15, a magnitude 4.6 (4.6 MB, Class: Light, Intensity: IV - V) earthquake occurred 272.2 miles away from the city center
On 6/28/2004 at 06:10:52, a magnitude 4.2 (4.2 MW, Depth: 6.2 mi) earthquake occurred 202.1 miles away from West Salem center
On 4/18/2008 at 09:36:59, a magnitude 5.4 (5.1 MB, 4.8 MS, 5.4 MW, 5.2 MW, Class: Moderate, Intensity: VI - VII) earthquake occurred 411.9 miles away from West Salem center
On 6/10/1987 at 23:48:54, a magnitude 5.1 (4.9 MB, 4.4 MS, 4.6 MS, 5.1 LG) earthquake occurred 388.5 miles away from West Salem center
On 4/18/2008 at 09:36:59, a magnitude 5.2 (5.2 MW, Depth: 8.9 mi) earthquake occurred 411.9 miles away from West Salem center
On 2/10/2010 at 09:59:35, a magnitude 3.8 (3.8 MW, Depth: 6.2 mi, Class: Light, Intensity: II - III) earthquake occurred 187.1 miles away from the city center
Magnitude types: regional Lg-wave magnitude (LG), body-wave magnitude (MB), surface-wave magnitude (MS), moment magnitude (MW)
Natural disasters:
The number of natural disasters in La Crosse County (17) is near the US average (15).Major Disasters (Presidential) Declared: 12
Emergencies Declared: 2
Causes of natural disasters: Floods: 14, Storms: 12, Tornadoes: 7, Winds: 4, Landslides: 2, Drought: 1, Heavy Rain: 1, Hurricane: 1, Mudslide: 1, Other: 1 (Note: some incidents may be assigned to more than one category).

Hospitals and medical centers in West Salem:
Other hospitals and medical centers near West Salem:
- GUNDERSEN LUTHERAN RENAL DIALYSIS - ONALASKA (Dialysis Facility, about 5 miles away; ONALASKA, WI)
- MAYO DIALYSIS - LA CROSSE (Dialysis Facility, about 6 miles away; ONALASKA, WI)
- ONALASKA CARE CTR (Nursing Home, about 7 miles away; ONALASKA, WI)
- LUTHERAN HOSPITAL-LA CROSSE HHA (Home Health Center, about 9 miles away; LA CROSSE, WI)
- GUNDERSEN LUTHERAN HOSPICE PROG 528 (Hospital, about 10 miles away; LA CROSSE, WI)
- FRANCISCAN SKEMP MC HHS (Home Health Center, about 10 miles away; LA CROSSE, WI)
- ST FRANCIS HOME (Nursing Home, about 11 miles away; LA CROSSE, WI)
Colleges/universities with over 2000 students nearest to West Salem:
- University of Wisconsin-La Crosse (about 10 miles; La Crosse, WI; Full-time enrollment: 9,837)
- Western Technical College (about 10 miles; La Crosse, WI; FT enrollment: 3,377)
- Viterbo University (about 11 miles; La Crosse, WI; FT enrollment: 2,848)
- Winona State University (about 30 miles; Winona, MN; FT enrollment: 8,397)
- Saint Mary's University of Minnesota (about 32 miles; Winona, MN; FT enrollment: 4,022)
- Luther College (about 55 miles; Decorah, IA; FT enrollment: 2,700)
- Northeast Iowa Community College-Calmar (about 64 miles; Calmar, IA; FT enrollment: 3,365)
Private high school in West Salem:
Public elementary/middle schools in West Salem:
- WEST SALEM ELEMENTARY (Students: 546, Location: 475 N MARK ST, Grades: PK-5)
- WEST SALEM MIDDLE (Students: 417, Location: 450 N MARK ST, Grades: 6-8)
Private elementary/middle school in West Salem:
User-submitted facts and corrections:
- Please add Presbyterian Church of West Salem to the list of churches. Address: 625 W. Franklin St. There has been a Presbyterian church in West Salem for 150 years.
Points of interest:
Notable locations in West Salem: West Salem Wastewater Treatment Facility (A), West Salem Volunteer Fire Department (B). Display/hide their locations on the map
Churches in West Salem include: Christ Lutheran Church (A), Our Saviours Lutheran Church (B), Saint Leo the Great Church (C), West Salem Baptist Church (D). Display/hide their locations on the map
Cemetery: Hamilton Cemetery (1). Display/hide its location on the map
Birthplace of: George G. Bingham - Judge.
Drinking water stations with addresses in West Salem and their reported violations in the past:
INNSBRUCK WATER TRUST (Population served: 85, Groundwater):Past monitoring violations:NICKS (Population served: 25, Groundwater):
- Lead Consumer Notice - In JAN-01-2013, Contaminant: Lead and Copper Rule. Follow-up actions: St Other (FEB-15-2013), St Compliance achieved (MAY-05-2014)
Past health violations:
- MCL, Monthly (TCR) - In SEP-2010, Contaminant: Coliform. Follow-up actions: St Public Notif received (SEP-08-2010), St Violation/Reminder Notice (SEP-08-2010), St Public Notif requested (SEP-08-2010), St Boil Water Order (SEP-08-2010), St Other (NOV-04-2010), St Compliance achieved (NOV-04-2010)
- MCL, Monthly (TCR) - In SEP-2008, Contaminant: Coliform. Follow-up actions: St Public Notif requested (SEP-12-2008), St Violation/Reminder Notice (SEP-12-2008), St Public Notif received (SEP-12-2008), St Boil Water Order (SEP-12-2008), St Other (SEP-15-2008), St Compliance achieved (SEP-18-2008), St Other (SEP-19-2008)
| This village: | 2.5 people |
| Wisconsin: | 2.4 people |
| This village: | 68.8% |
| Whole state: | 64.4% |
| This village: | 6.3% |
| Whole state: | 7.3% |
Likely homosexual households (counted as self-reported same-sex unmarried-partner households)
- Lesbian couples: 0.3% of all households
- Gay men: 0.1% of all households
83 people in nursing homes in 2000
Banks with branches in West Salem (2011 data):
- Union State Bank of West Salem: Union State Bank Of West Salem at 120 South Mill Street, branch established on 1903/08/25; Union Station Branch at Hwy 16 And Cty M, branch established on 2003/06/02. Info updated 2006/11/03: Bank assets: $60.4 mil, Deposits: $52.3 mil, local headquarters, positive income, 2 total offices
- River Bank: West Salem Branch at W 3995 Country Highway M, branch established on 2003/07/07. Info updated 2006/11/03: Bank assets: $421.9 mil, Deposits: $366.6 mil, headquarters in Stoddard, WI, positive income, Commercial Lending Specialization, 11 total offices, Holding Company: River Holding Company
- The First National Bank of Bangor: West Salem Branch at 975 West City Highway 16, branch established on 1995/10/24. Info updated 2006/11/03: Bank assets: $203.7 mil, Deposits: $160.8 mil, headquarters in Bangor, WI, positive income, Commercial Lending Specialization, 5 total offices, Holding Company: Bosshard Banco, Ltd.
- BMO Harris Bank National Association: Commerce Street Branch at 1400 Waterloo Avenue, branch established on 1994/08/01. Info updated 2011/07/14: Bank assets: $97,264.0 mil, Deposits: $75,624.6 mil, headquarters in Chicago, IL, positive income, 717 total offices, Holding Company: Bank Of Montreal
For population 15 years and over in West Salem:
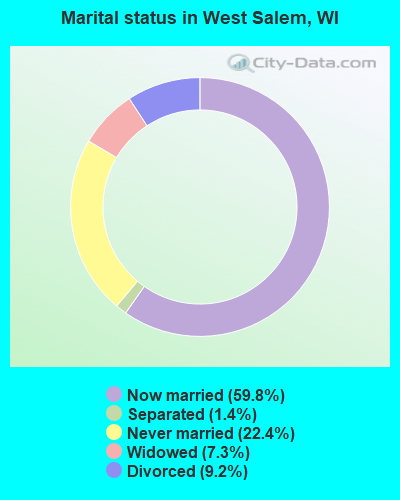
- Never married: 22.4%
- Now married: 59.8%
- Separated: 1.4%
- Widowed: 7.3%
- Divorced: 9.2%
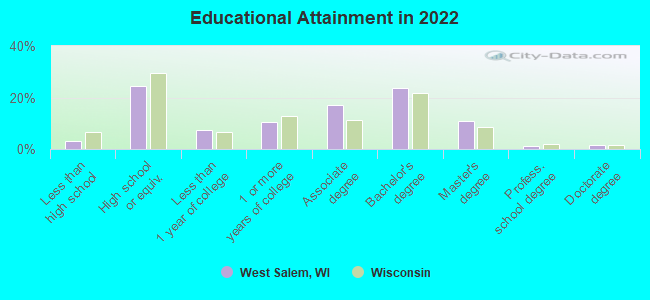
For population 25 years and over in West Salem:
- High school or higher: 97.0%
- Bachelor's degree or higher: 38.4%
- Graduate or professional degree: 14.2%
- Unemployed: 4.4%
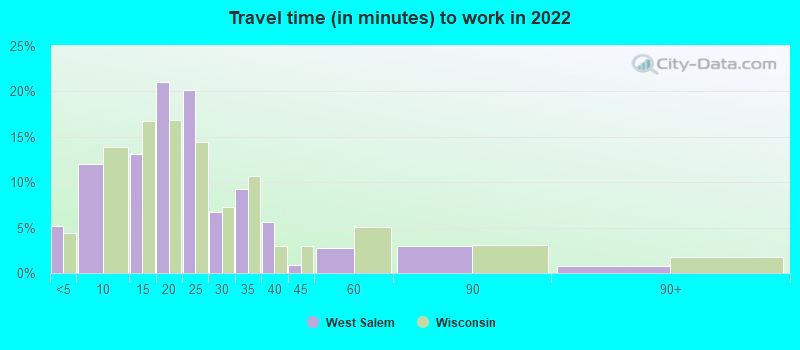
- Mean travel time to work (commute): 16.8 minutes
| Here: | 9.1 |
| Wisconsin average: | 10.4 |
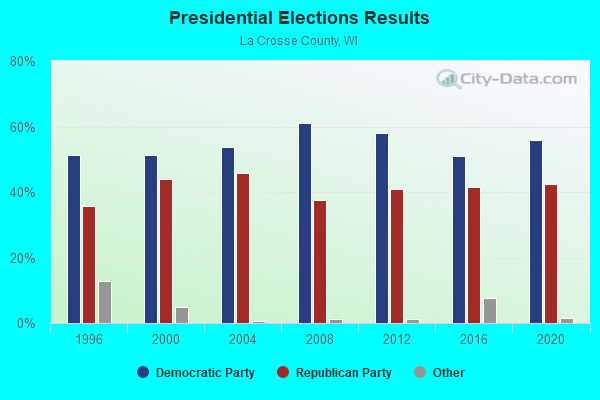
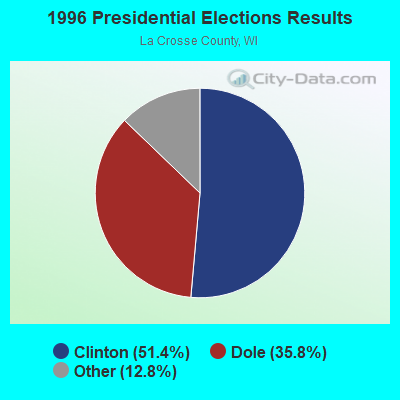
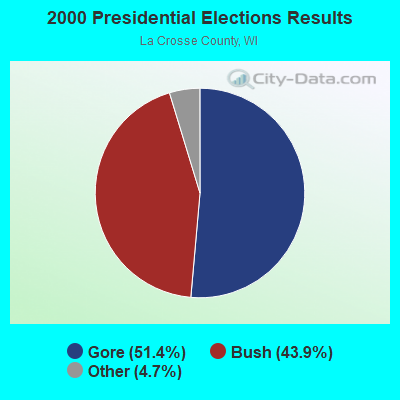
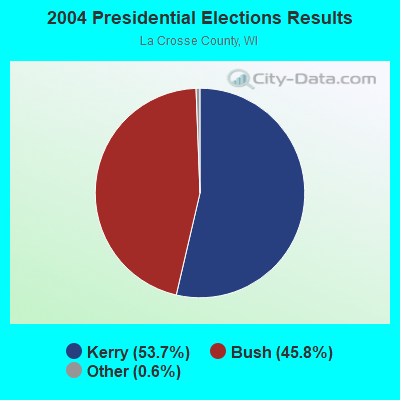
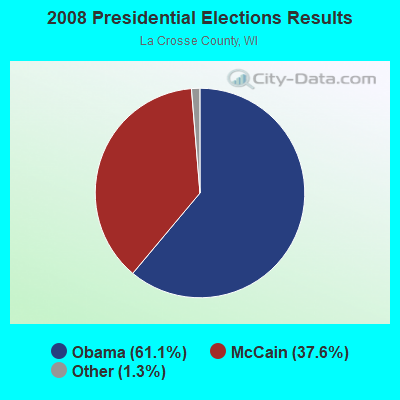
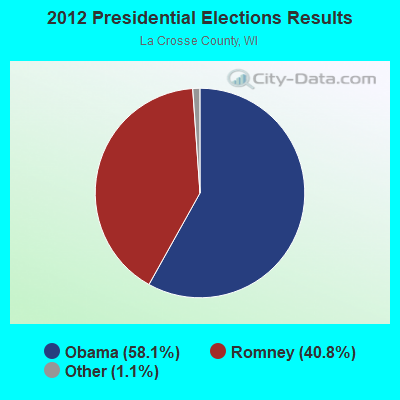
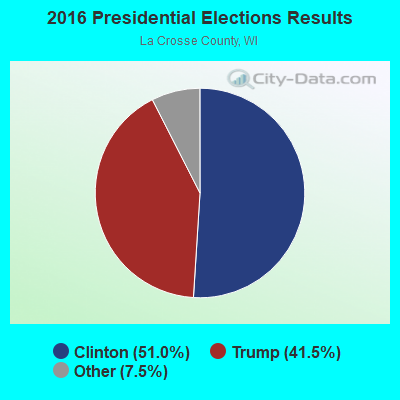
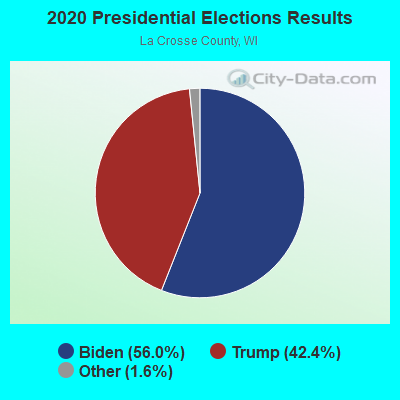
Graphs represent county-level data. Detailed 2008 Election Results
Religion statistics for West Salem, WI (based on La Crosse County data)
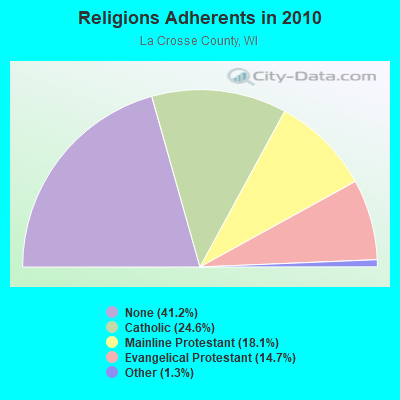
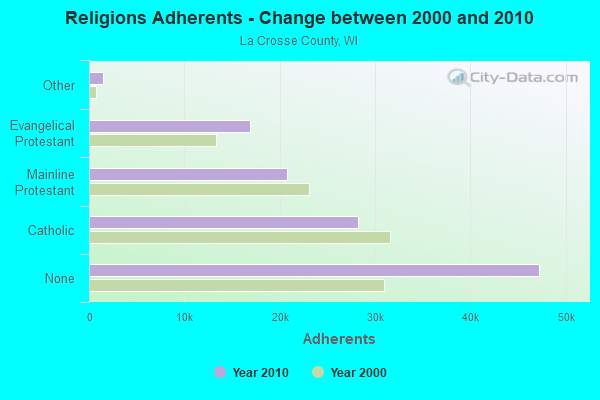
| Religion | Adherents | Congregations |
|---|---|---|
| Catholic | 28,200 | 12 |
| Mainline Protestant | 20,746 | 33 |
| Evangelical Protestant | 16,848 | 56 |
| Other | 1,498 | 9 |
| Orthodox | 100 | 1 |
| None | 47,246 | - |
Food Environment Statistics:
| La Crosse County: | 1.52 / 10,000 pop. |
| Wisconsin: | 1.86 / 10,000 pop. |
| Here: | 0.18 / 10,000 pop. |
| Wisconsin: | 0.11 / 10,000 pop. |
| This county: | 3.50 / 10,000 pop. |
| State: | 4.12 / 10,000 pop. |
| La Crosse County: | 7.53 / 10,000 pop. |
| Wisconsin: | 8.64 / 10,000 pop. |
| La Crosse County: | 6.9% |
| Wisconsin: | 7.6% |
| Here: | 26.1% |
| Wisconsin: | 27.5% |
| La Crosse County: | 12.4% |
| State: | 13.0% |
Health and Nutrition:
| West Salem: | 52.2% |
| State: | 49.5% |
| This city: | 51.5% |
| Wisconsin: | 46.6% |
| West Salem: | 28.7 |
| Wisconsin: | 28.7 |
| West Salem: | 18.5% |
| Wisconsin: | 21.4% |
| This city: | 7.9% |
| State: | 10.2% |
| West Salem: | 6.8 |
| State: | 6.8 |
| Here: | 35.5% |
| Wisconsin: | 34.0% |
| This city: | 59.7% |
| Wisconsin: | 56.3% |
| Here: | 80.1% |
| Wisconsin: | 78.5% |
More about Health and Nutrition of West Salem, WI Residents
| Local government employment and payroll (March 2022) | |||||
| Function | Full-time employees | Monthly full-time payroll | Average yearly full-time wage | Part-time employees | Monthly part-time payroll |
|---|---|---|---|---|---|
| Police Protection - Officers | 9 | $63,981 | $85,308 | 0 | $0 |
| Sewerage | 2 | $5,902 | $35,412 | 0 | $0 |
| Water Supply | 2 | $10,049 | $60,294 | 0 | $0 |
| Financial Administration | 2 | $13,800 | $82,800 | 1 | $1,220 |
| Streets and Highways | 2 | $4,632 | $27,792 | 0 | $0 |
| Parks and Recreation | 2 | $10,230 | $61,380 | 1 | $327 |
| Police - Other | 1 | $4,715 | $56,580 | 3 | $711 |
| Other and Unallocable | 0 | $0 | 1 | $174 | |
| Totals for Government | 20 | $113,310 | $67,986 | 6 | $2,433 |
West Salem government finances - Expenditure in 2017 (per resident):
- Construction - General Public Buildings: $24,000 ($4.54)
Regular Highways: $9,000 ($1.70)
Parks and Recreation: $7,000 ($1.32)
- Current Operations - Police Protection: $712,000 ($134.62)
Sewerage: $626,000 ($118.36)
Regular Highways: $354,000 ($66.93)
Parks and Recreation: $308,000 ($58.23)
General - Other: $290,000 ($54.83)
Water Utilities: $263,000 ($49.73)
Solid Waste Management: $174,000 ($32.90)
Local Fire Protection: $116,000 ($21.93)
Financial Administration: $110,000 ($20.80)
Central Staff Services: $68,000 ($12.86)
Libraries: $35,000 ($6.62)
General Public Buildings: $30,000 ($5.67)
Protective Inspection and Regulation - Other: $30,000 ($5.67)
Judicial and Legal Services: $27,000 ($5.10)
Miscellaneous Commercial Activities - Other: $3,000 ($0.57)
Natural Resources - Other: $3,000 ($0.57)
Health - Other: $1,000 ($0.19)
Parking Facilities: $1,000 ($0.19)
- General - Interest on Debt: $90,000 ($17.02)
- Other Capital Outlay - Police Protection: $45,000 ($8.51)
Regular Highways: $1,000 ($0.19)
West Salem government finances - Revenue in 2017 (per resident):
- Charges - Sewerage: $864,000 ($163.36)
Regular Highways: $169,000 ($31.95)
Parks and Recreation: $140,000 ($26.47)
Other: $19,000 ($3.59)
- Miscellaneous - Fines and Forfeits: $27,000 ($5.10)
Special Assessments: $8,000 ($1.51)
Donations From Private Sources: $5,000 ($0.95)
General Revenue - Other: $5,000 ($0.95)
Rents: $4,000 ($0.76)
Interest Earnings: $0 ($0.00)
- Revenue - Water Utilities: $500,000 ($94.54)
- State Intergovernmental - General Local Government Support: $401,000 ($75.82)
Highways: $134,000 ($25.34)
Education: $46,000 ($8.70)
Other: $42,000 ($7.94)
- Tax - Property: $1,340,000 ($253.36)
Occupation and Business License - Other: $79,000 ($14.94)
Other: $75,000 ($14.18)
Other License: $33,000 ($6.24)
Other Selective Sales: $26,000 ($4.92)
West Salem government finances - Debt in 2017 (per resident):
- Long Term Debt - Beginning Outstanding - Unspecified Public Purpose: $2,906,000 ($549.44)
Outstanding Unspecified Public Purpose: $2,352,000 ($444.70)
Retired Unspecified Public Purpose: $554,000 ($104.75)
| Businesses in West Salem, WI | ||||
| Name | Count | Name | Count | |
|---|---|---|---|---|
| Ace Hardware | 1 | FedEx | 1 | |
| AmericInn | 1 | Quiznos | 1 | |
| Chevrolet | 1 | UPS | 2 | |
| Curves | 1 | |||
Strongest AM radio stations in West Salem:
- WIZM (1410 AM; 5 kW; LA CROSSE, WI; Owner: FAMILY RADIO, INC.)
- WKTY (580 AM; 5 kW; LA CROSSE, WI; Owner: FAMILY RADIO, INC.)
- WKLJ (1290 AM; 5 kW; SPARTA, WI; Owner: SPARTA-TOMAH BROADCASTING CO., INC.)
- WLFN (1490 AM; 1 kW; LA CROSSE, WI; Owner: MISSISSIPPI VALLEY BROADCASTERS, LLC)
- WKBH (1570 AM; 1 kW; HOLMEN, WI)
- WSPT (1010 AM; 50 kW; STEVENS POINT, WI)
- WCTS (1030 AM; 50 kW; MAPLEWOOD, MN; Owner: CNTL. BAPT. THEO/AL SEMI MINNEAPOLIS)
- KAGE (1380 AM; 4 kW; WINONA, MN; Owner: KAGE, INC.)
- WSAU (550 AM; 20 kW; WAUSAU, WI; Owner: WRIG, INC.)
- WCCO (830 AM; 50 kW; MINNEAPOLIS, MN; Owner: INFINITY MEDIA CORPORATION)
- KFAN (1130 AM; 50 kW; MINNEAPOLIS, MN; Owner: AMFM RADIO LICENSES, L.L.C.)
- WTMJ (620 AM; 50 kW; MILWAUKEE, WI; Owner: JOURNAL BROADCAST CORPORATION)
- WNAM (1280 AM; 50 kW; NEENAH-MENASHA, WI; Owner: CUMULUS LICENSING CORP.)
Strongest FM radio stations in West Salem:
- WIZM-FM (93.3 FM; LA CROSSE, WI; Owner: FAMILY RADIO, INC.)
- K220EP (91.9 FM; LA CRESCENT, MN; Owner: FAITH SOUND, INC.)
- WKBH-FM (100.1 FM; WEST SALEM, WI; Owner: MISSISSIPPI VALLEY BROADCASTERS, LLC)
- WQCC (106.3 FM; LA CROSSE, WI; Owner: MISSISSIPPI VALLEY BROADCASTERS, LLC)
- WHLA (90.3 FM; LA CROSSE, WI; Owner: STATE OF WISCONSIN - EDUCATIONAL COMMUNICATIONS BOARD)
- WLSU (88.9 FM; LA CROSSE, WI; Owner: BD.OF REGENTS, UNIV.OF WISCONSIN SYSTEM)
- KQEG (102.7 FM; LA CRESCENT, MN; Owner: WHITE EAGLE BROADCASTING, INC.)
- KXLC (91.1 FM; LA CRESCENT, MN; Owner: MINNESOTA PUBLIC RADIO)
- WCOW-FM (97.1 FM; SPARTA, WI; Owner: SPARTA-TOMAH BROADCASTING CO., INC.)
- WLXR-FM (104.9 FM; LA CROSSE, WI; Owner: MISSISSIPPI VALLEY B/CASTERS, L.L.C.)
- K270AG (101.9 FM; LA CRESCENT, MN; Owner: S & S BROADCASTING)
- WFBZ (105.5 FM; TREMPEALEAU, WI; Owner: S & S BROADCASTING)
- K222AG (92.3 FM; LA CROSSE, WI; Owner: RAY A. KNUDSON)
- WVCX (98.9 FM; TOMAH, WI; Owner: VCY AMERICA, INC.)
- KHME (101.1 FM; WINONA, MN; Owner: KAGE, INC.)
- WAXX (104.5 FM; EAU CLAIRE, WI; Owner: MAVERICK MEDIA OF EAU CLAIRE LICENSE LLC)
- WRQT (95.7 FM; LA CROSSE, WI; Owner: FAMILY RADIO, INC.)
- KCLH (94.7 FM; CALEDONIA, MN; Owner: FAMILY RADIO, INC.)
- KQAL (89.5 FM; WINONA, MN; Owner: WINONA STATE UNIVERSITY)
- WXYM (96.1 FM; TOMAH, WI; Owner: MAGNUM RADIO, INC.)
TV broadcast stations around West Salem:
- WKBT (Channel 8; LA CROSSE, WI; Owner: QUEENB TELEVISION, LLC)
- WXOW-TV (Channel 19; LA CROSSE, WI; Owner: WXOW-WQOW TELEVISION, INC.)
- WDLS-LP (Channel 35; TOMAH, WI; Owner: MAGNUM RADIO, INC.)
- WHLA-TV (Channel 31; LA CROSSE, WI; Owner: WISCONSIN EDUCATIONAL COMMUNICATIONS BOARD)
- WLAX (Channel 25; LA CROSSE, WI; Owner: GRANT MEDIA, INC.)
- KQEG-CA (Channel 50; La CRESCENT, MN; Owner: WHITE EAGLE PARTNERSHIP)
- W44BF (Channel 44; LA CROSSE, WI; Owner: TV-45, INC.)
- WEAU-TV (Channel 13; EAU CLAIRE, WI; Owner: WEAU LICENSEE CORP.)
- K62EV (Channel 62; WINONA, MN; Owner: KTTC TELEVISION, INC.)
- W67CH (Channel 67; LA CROSSE, WI; Owner: KTTC TELEVISION, INC.)
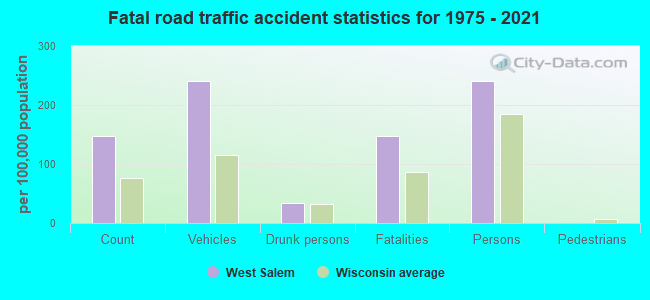
West Salem fatal accident list:
Jun 27, 2011 06:44 PM, Franklin St, Vera Ln, Lat: 43.897986, Lon: -91.094728, Vehicles: 1, Persons: 1, Fatalities: 1
Jan 16, 2006 01:49 PM, N Leonard St, W Hamlin St, Lat: 43.903930, Lon: -91.081150, Vehicles: 2, Persons: 2, Fatalities: 1
Sep 3, 1996 06:07 PM, 16, Vehicles: 2, Persons: 2, Fatalities: 1
Dec 17, 1984 12:30 AM, 16, Vehicles: 2, Persons: 2, Fatalities: 1
Jun 20, 1977 04:09 PM, Vehicles: 1, Persons: 1, Fatalities: 1, Drunk persons involved: 1
- National Bridge Inventory (NBI) Statistics
- 7Number of bridges
- 72ft / 21.6mTotal length
- $1,845,000Total costs
- 36,140Total average daily traffic
- 3,999Total average daily truck traffic
FCC Registered Antenna Towers:
51 (See the full list of FCC Registered Antenna Towers in West Salem)FCC Registered Broadcast Land Mobile Towers:
7- 902 E Garland St (Lat: 43.898583 Lon: -90.069028), Type: Building, Structure height: 6 m, Call Sign: WPKW458,
Assigned Frequencies: 453.900 MHz, Grant Date: 08/10/2012, Expiration Date: 08/13/2022, Cancellation Date: 10/15/2022, Certifier: Deb Scheitzach, Registrant: Brandon Communications Dba P&h Services, 1501 Pearl Street, Bangor, WI 54614, Phone: (320) 524-2283
- I90 & Hwy M 1 Mi Sw (Lat: 43.886083 Lon: -91.110694), Type: Bant, Structure height: 5 m, Overall height: 8 m, Call Sign: KRV238,
Assigned Frequencies: 151.460 MHz, 154.905 MHz, 155.475 MHz, 159.450 MHz, 155.460 MHz, Grant Date: 11/24/2021, Expiration Date: 02/12/2032, Registrant: Wisconsin State Patrol, 4822 Madison Yards Way - 9th Fl South, Madison, WI 53705, Phone: (608) 709-0095, Email:
- 600 Brickl Rd (Lat: 43.901083 Lon: -91.091806), Call Sign: KKY653, Licensee ID: L00091870,
Assigned Frequencies: 151.835 MHz, Grant Date: 10/05/2002, Expiration Date: 10/05/2012, Cancellation Date: 12/08/2012, Registrant: West Salem Plastics Co, 600 Brickl Rd, West Salem, WI 54669, Phone: (608) 786-0500
- .5 Mi W Jct Cth S & Cth M (Lat: 43.947750 Lon: -91.144861), Call Sign: KNDT766, Licensee ID: L00007608,
Assigned Frequencies: 154.463 MHz, Grant Date: 11/09/1998, Expiration Date: 11/07/2003, Cancellation Date: 11/05/2003, Registrant: Dairyland Power Cooperative, 3200 East Ave S, La Crosse, WI 54601, Phone: (608) 788-4000
- WEST SALEM HBD, Tomah Sub Mi 269.1 West Salem Hbd (Lat: 43.893583 Lon: -91.032500), Type: Mast, Structure height: 3 m, Call Sign: WNXX341,
Assigned Frequencies: 160.770 MHz, 161.370 MHz, 161.520 MHz, Grant Date: 01/11/2022, Expiration Date: 11/22/2031, Registrant: Canadian Pacific Railway, 5th Floor - 120 South 6th Street, Minneapolis, MN 55402, Phone: (403) 319-6007, Fax: (612) 851-5688, Email:
- WT, 1001 East Garland Street (Lat: 43.898667 Lon: -91.065611), Type: Tank, Structure height: 56 m, Call Sign: WQBC802,
Assigned Frequencies: 155.850 MHz, Grant Date: 08/13/2014, Expiration Date: 09/21/2024, Certifier: Dennis Abbott, Registrant: Brandon Communications, 800 Central Avenue N, Brandon, MN 56315, Phone: (320) 524-2283, Fax: (717) 334-6440
- 908 Garland Street East (Lat: 43.901000 Lon: -91.069083), Type: Bant, Structure height: 9 m, Overall height: 12 m, Call Sign: WQNI391,
Assigned Frequencies: 462.825 MHz, Grant Date: 02/14/2011, Expiration Date: 02/14/2021, Cancellation Date: 04/17/2021, Certifier: Pam Semb, Registrant: Visiplex, Inc., 100 N Fairway Drive, Suite 120, Vernon Hills, IL 60061, Phone: (847) 918-0250, Fax: (847) 918-0259, Email:
FCC Registered Microwave Towers:
9 (See the full list of FCC Registered Microwave Towers in this town)FCC Registered Amateur Radio Licenses:
16 (See the full list of FCC Registered Amateur Radio Licenses in West Salem)FAA Registered Aircraft Manufacturers and Dealers:
3- ULTRA SOURCE INC, W3908 Wolter Rd, West Salem, WI 54669
Certificate: 00-1592 (Corporation), Certificate Issue Date: 08/29/2000, Expiration Date: 08/28/2001 - REISTER RON A DBA, W3908 Wolter Rd, West Salem, WI 54669
Certificate: 03-1632 (Individual), Certificate Issue Date: 10/03/2003, Expiration Date: 10/02/2004 - UP CLOSE INC DBA, W3908 Wolter Rd, West Salem, WI 54669
Certificate: D001515 (Corporation), Certificate Issue Date: 05/09/2007, Expiration Date: 05/08/2008
FAA Registered Aircraft:
4- Aircraft: ARBC INC DBA LINDSTRAND 90A (Category: Land, Weight: Up to 12,499 Pounds), Engine: None
N-Number: 230LB, N230LB, N-230LB, Serial Number: 5393, Year manufactured: 2008, Airworthiness Date: 05/23/2008, Certificate Issue Date: 01/14/2020
Registrant (Co-Owned): Terry Dorshorst, W4518 Pioneer Ct, West Salem, WI 54669, Other Owners: Barbara Omit-Dorshorst - Aircraft: AEROSTAR INTERNATIONAL INC RX 8 (Category: Land, Weight: Up to 12,499 Pounds), Engine: None
N-Number: 4027S, N4027S, N-4027S, Serial Number: RX8-3287, Year manufactured: 1996, Airworthiness Date: 01/08/1997, Certificate Issue Date: 08/12/1999
Registrant (Corporation): Lofty Concepts Inc, W3763 Hidden River Rd, West Salem, WI 54669 - Aircraft: AEROSTAR INTERNATIONAL INC RX 8 (Category: Land, Weight: Up to 12,499 Pounds), Engine: None
N-Number: 920W, N920W, N-920W, Serial Number: RX8-3171, Year manufactured: 1993, Airworthiness Date: 06/25/1993, Certificate Issue Date: 07/05/2019
Registrant (Individual): Terry Dorshorst, W4518 Pioneer Ct, West Salem, WI 54669 - Aircraft: CAMERON BALLOONS US V-90 (Category: Land, Seats: 5, Weight: Up to 12,499 Pounds), Engine: None
N-Number: 3986B, N3986B, N-3986B, Serial Number: 5675, Year manufactured: 1991, Airworthiness Date: 02/18/1991, Certificate Issue Date: 01/13/2011
Registrant (Co-Owned): Terry E Dorshorst, W4518 Pioneer Ct, West Salem, WI 54669, Other Owners: Dorshorst Barb J Omit
Deregistered: Cancel Date: 05/01/2020
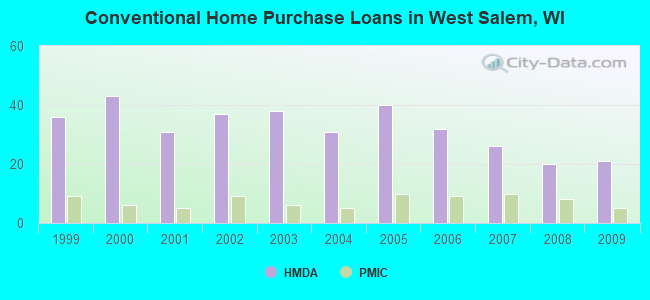
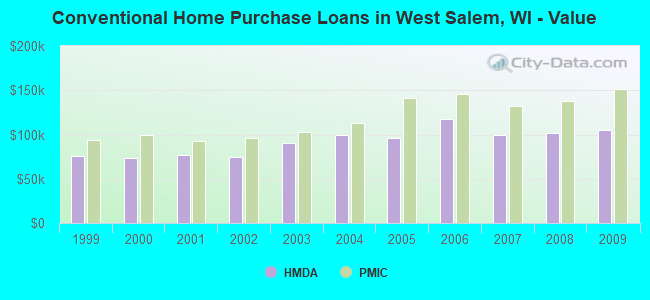
| Home Mortgage Disclosure Act Aggregated Statistics For Year 2009 (Based on 1 partial tract) | ||||||||||||
| A) FHA, FSA/RHS & VA Home Purchase Loans | B) Conventional Home Purchase Loans | C) Refinancings | D) Home Improvement Loans | F) Non-occupant Loans on < 5 Family Dwellings (A B C & D) | G) Loans On Manufactured Home Dwelling (A B C & D) | |||||||
|---|---|---|---|---|---|---|---|---|---|---|---|---|
| Number | Average Value | Number | Average Value | Number | Average Value | Number | Average Value | Number | Average Value | Number | Average Value | |
| LOANS ORIGINATED | 10 | $149,706 | 21 | $104,583 | 101 | $105,660 | 9 | $45,469 | 8 | $148,189 | 20 | $14,472 |
| APPLICATIONS APPROVED, NOT ACCEPTED | 0 | $0 | 0 | $0 | 4 | $100,635 | 1 | $29,820 | 1 | $38,560 | 0 | $0 |
| APPLICATIONS DENIED | 2 | $170,680 | 3 | $59,463 | 12 | $164,855 | 2 | $25,190 | 1 | $51,920 | 3 | $14,737 |
| APPLICATIONS WITHDRAWN | 1 | $195,360 | 3 | $152,860 | 21 | $146,543 | 1 | $12,850 | 3 | $149,603 | 1 | $52,440 |
| FILES CLOSED FOR INCOMPLETENESS | 0 | $0 | 1 | $25,700 | 3 | $106,933 | 0 | $0 | 0 | $0 | 0 | $0 |
Detailed HMDA statistics for the following Tracts: 0101.02
| Private Mortgage Insurance Companies Aggregated Statistics For Year 2009 (Based on 1 partial tract) | ||||
| A) Conventional Home Purchase Loans | B) Refinancings | |||
|---|---|---|---|---|
| Number | Average Value | Number | Average Value | |
| LOANS ORIGINATED | 5 | $151,762 | 5 | $134,078 |
| APPLICATIONS APPROVED, NOT ACCEPTED | 1 | $66,830 | 2 | $158,600 |
| APPLICATIONS DENIED | 0 | $0 | 1 | $252,940 |
| APPLICATIONS WITHDRAWN | 0 | $0 | 0 | $0 |
| FILES CLOSED FOR INCOMPLETENESS | 0 | $0 | 0 | $0 |
Detailed PMIC statistics for the following Tracts: 0101.02
2004 - 2018 National Fire Incident Reporting System (NFIRS) incidents
- Fire incident types reported to NFIRS in West Salem, WI
- 6037.0%Structure Fires
- 5534.0%Outside Fires
- 3320.4%Mobile Property/Vehicle Fires
- 148.6%Other
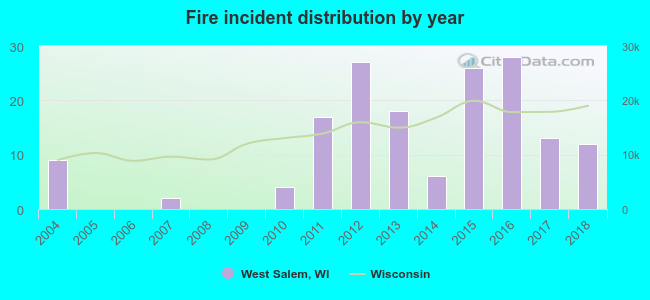 Based on the data from the years 2004 - 2018 the average number of fires per year is 11. The highest number of reported fires - 28 took place in 2016, and the least - 0 in 2005. The data has a rising trend.
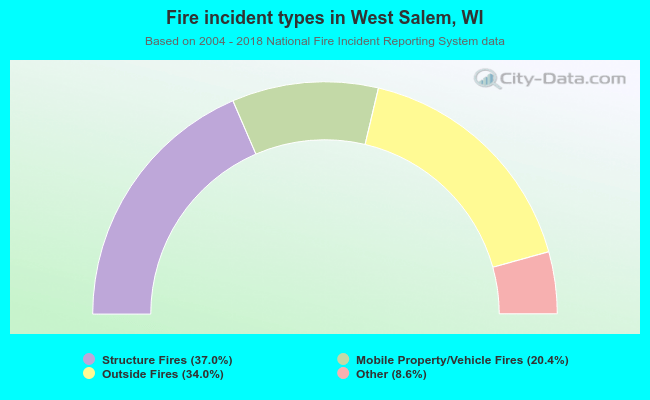 When looking into fire subcategories, the most incidents belonged to: Structure Fires (37.0%), and Outside Fires (34.0%).
| Most common first names in West Salem, WI among deceased individuals | ||
| Name | Count | Lived (average) |
|---|---|---|
| Robert | 34 | 69.9 years |
| John | 31 | 80.9 years |
| James | 27 | 73.0 years |
| Helen | 26 | 84.3 years |
| William | 26 | 74.7 years |
| George | 25 | 80.2 years |
| Dorothy | 24 | 82.0 years |
| Richard | 22 | 71.5 years |
| Fred | 19 | 84.4 years |
| Emma | 19 | 84.6 years |
| Most common last names in West Salem, WI among deceased individuals | ||
| Last name | Count | Lived (average) |
|---|---|---|
| Johnson | 44 | 81.4 years |
| Olson | 37 | 79.3 years |
| Miller | 26 | 78.8 years |
| Anderson | 22 | 81.8 years |
| Hemker | 16 | 81.6 years |
| Meyer | 15 | 74.5 years |
| Nelson | 14 | 81.2 years |
| Hanson | 13 | 81.4 years |
| Knudson | 12 | 78.9 years |
| Young | 12 | 80.2 years |
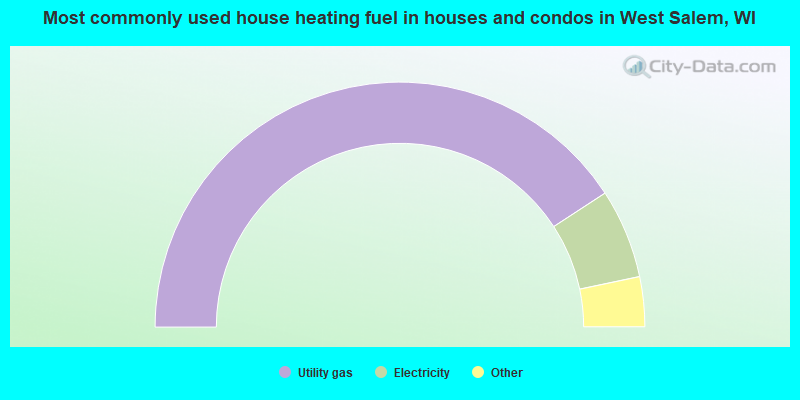
- 81.6%Utility gas
- 11.8%Electricity
- 3.7%Bottled, tank, or LP gas
- 2.8%Fuel oil, kerosene, etc.
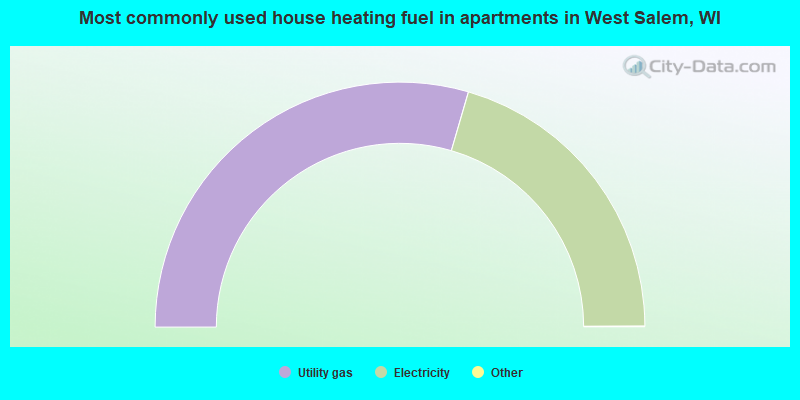
- 59.1%Utility gas
- 40.9%Electricity
West Salem compared to Wisconsin state average:
- Unemployed percentage significantly below state average.
- Black race population percentage significantly below state average.
- Hispanic race population percentage significantly below state average.
- Foreign-born population percentage significantly below state average.
- Institutionalized population percentage significantly above state average.
- Percentage of population with a bachelor's degree or higher above state average.

|
|
Total of 34 patent applications in 2008-2024.