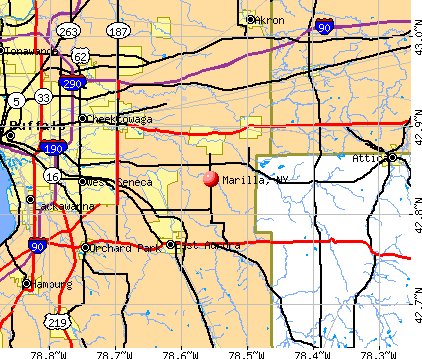
Marilla, New York
Submit your own pictures of this town and show them to the world
- OSM Map
- General Map
- Google Map
- MSN Map
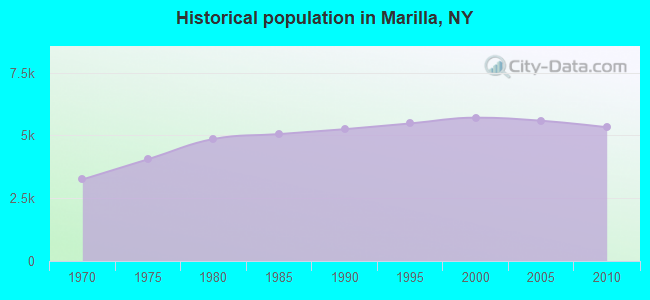
Population change since 2000: -6.7%
 |
| Males: 2,618 | |
| Females: 2,709 |
| Median resident age: | 45.3 years |
| New York median age: | 40.7 years |
Zip codes: 14052.
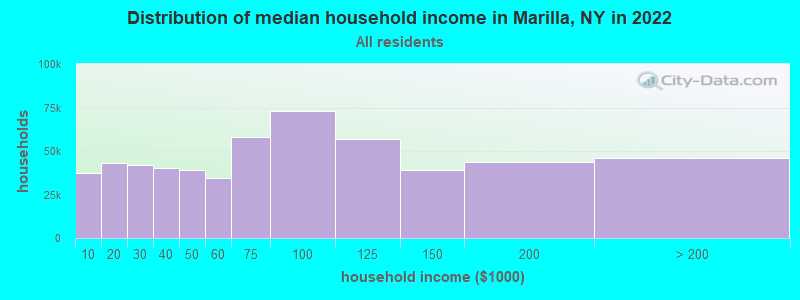
| Marilla: | $94,201 |
| NY: | $79,557 |
Estimated per capita income in 2022: $47,819 (it was $23,820 in 2000)
Marilla town income, earnings, and wages data
Estimated median house or condo value in 2022: $301,056 (it was $117,700 in 2000)
| Marilla: | $301,056 |
| NY: | $400,400 |
Mean prices in 2022: all housing units: $244,055; detached houses: $258,042; townhouses or other attached units: $217,708; in 2-unit structures: $199,670; in 3-to-4-unit structures: $213,644; in 5-or-more-unit structures: $334,912; mobile homes: $67,367; occupied boats, rvs, vans, etc.: $89,496
Detailed information about poverty and poor residents in Marilla, NY


- 5,22498.1%White alone
- 330.6%Hispanic
- 280.5%Two or more races
- 190.4%Asian alone
- 130.2%Black alone
- 90.2%American Indian alone
- 10.02%Other race alone
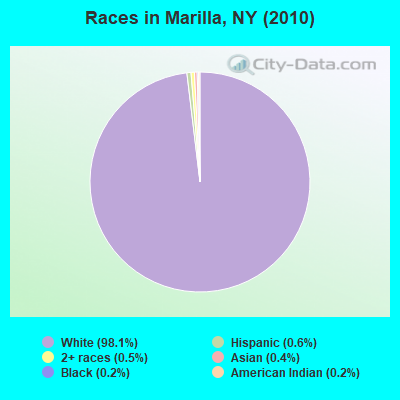
Races in Marilla detailed stats: ancestries, foreign born residents, place of birth
 Recent articles from our blog. Our writers, many of them Ph.D. graduates or candidates, create easy-to-read articles on a wide variety of topics.

 | Buffalo-Boom/Bust II (584 replies) |
| Some Erie County towns want to secede, join neighboring county in NYS (8 replies) |
| I guess the increase in home prices is real (32 replies) |
| Erie County property tax bill higher then what was expected (28 replies) |
| Poloncarz proposes High-Speed internet Access (4 replies) |
| Should I move back................ (22 replies) |
Latest news from Marilla, NY collected exclusively by city-data.com from local newspapers, TV, and radio stations
Ancestries: German (42.8%), Polish (23.9%), Irish (15.7%), Italian (15.4%), English (7.7%), United States (5.4%).
Current Local Time: EST time zone
Elevation: 840 feet
Land area: 27.6 square miles.
Population density: 193 people per square mile (very low).
117 residents are foreign born (1.5% Europe, 0.3% North America).
| This town: | 2.0% |
| New York: | 20.4% |
| Marilla town: | 2.3% ($2,665) |
| New York: | 1.9% ($2,847) |
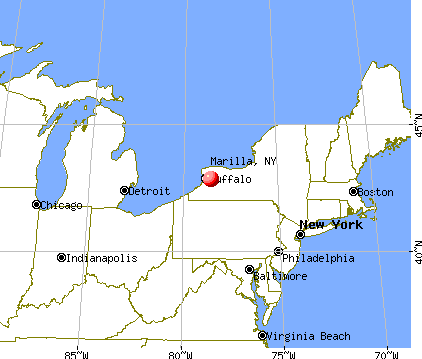
Nearest city with pop. 50,000+: Cheektowaga, NY  (12.7 miles , pop. 79,988).
Nearest city with pop. 200,000+: Buffalo, NY (16.7 miles , pop. 292,648).
Nearest city with pop. 1,000,000+: Philadelphia, PA (263.1 miles , pop. 1,517,550).
Nearest cities:
), ), ), ), )Latitude: 42.83 N, Longitude: 78.54 W

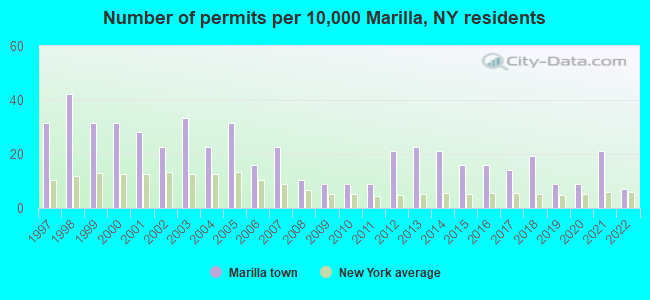
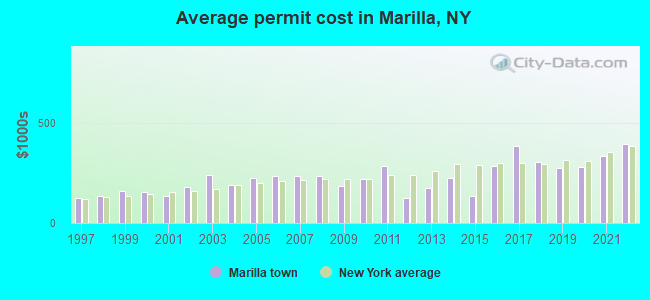
Single-family new house construction building permits:
- 2022: 4 buildings, average cost: $392,300
- 2021: 12 buildings, average cost: $334,700
- 2020: 5 buildings, average cost: $281,200
- 2019: 5 buildings, average cost: $275,100
- 2018: 11 buildings, average cost: $305,600
- 2017: 8 buildings, average cost: $384,600
- 2016: 9 buildings, average cost: $285,000
- 2015: 9 buildings, average cost: $136,400
- 2014: 12 buildings, average cost: $226,200
- 2013: 13 buildings, average cost: $175,600
- 2012: 12 buildings, average cost: $123,300
- 2011: 5 buildings, average cost: $284,200
- 2010: 5 buildings, average cost: $217,900
- 2009: 5 buildings, average cost: $184,700
- 2008: 6 buildings, average cost: $234,800
- 2007: 13 buildings, average cost: $232,400
- 2006: 9 buildings, average cost: $232,400
- 2005: 18 buildings, average cost: $225,400
- 2004: 13 buildings, average cost: $187,500
- 2003: 19 buildings, average cost: $238,500
- 2002: 13 buildings, average cost: $176,800
- 2001: 16 buildings, average cost: $137,100
- 2000: 18 buildings, average cost: $154,000
- 1999: 18 buildings, average cost: $160,100
- 1998: 24 buildings, average cost: $134,300
- 1997: 18 buildings, average cost: $125,700
| Here: | 4.4% |
| New York: | 4.4% |
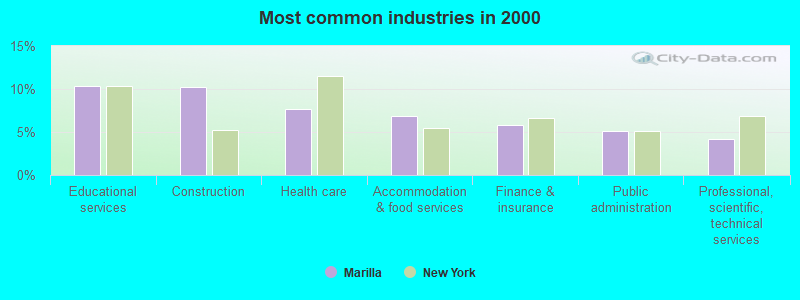
- Educational services (10.4%)
- Construction (10.2%)
- Health care (7.7%)
- Accommodation & food services (6.9%)
- Finance & insurance (5.8%)
- Public administration (5.2%)
- Professional, scientific, technical services (4.2%)
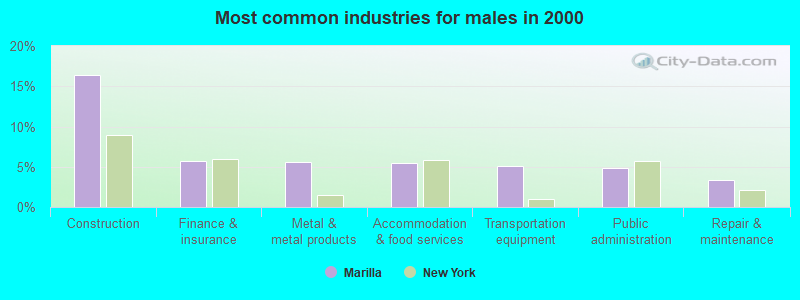
- Construction (16.4%)
- Finance & insurance (5.8%)
- Metal & metal products (5.6%)
- Accommodation & food services (5.4%)
- Transportation equipment (5.1%)
- Public administration (4.9%)
- Repair & maintenance (3.4%)
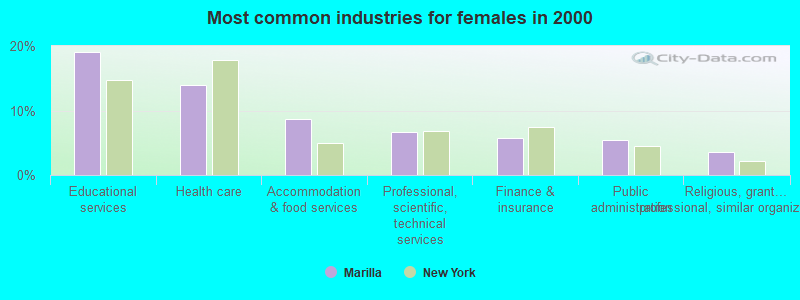
- Educational services (19.0%)
- Health care (13.9%)
- Accommodation & food services (8.7%)
- Professional, scientific, technical services (6.6%)
- Finance & insurance (5.8%)
- Public administration (5.5%)
- Religious, grantmaking, civic, professional, similar organizations (3.5%)
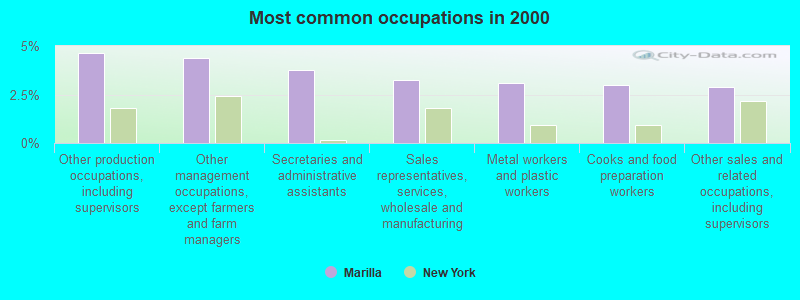
- Other production occupations, including supervisors (4.6%)
- Other management occupations, except farmers and farm managers (4.4%)
- Secretaries and administrative assistants (3.8%)
- Sales representatives, services, wholesale and manufacturing (3.3%)
- Metal workers and plastic workers (3.1%)
- Cooks and food preparation workers (3.0%)
- Other sales and related occupations, including supervisors (2.9%)
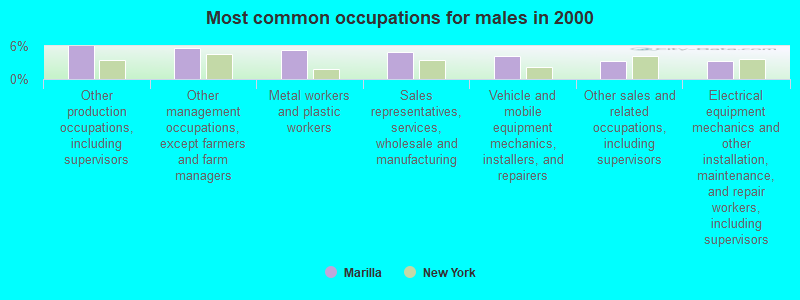
- Other production occupations, including supervisors (6.0%)
- Other management occupations, except farmers and farm managers (5.6%)
- Metal workers and plastic workers (5.2%)
- Sales representatives, services, wholesale and manufacturing (5.0%)
- Vehicle and mobile equipment mechanics, installers, and repairers (4.2%)
- Other sales and related occupations, including supervisors (3.2%)
- Electrical equipment mechanics and other installation, maintenance, and repair workers, including supervisors (3.2%)
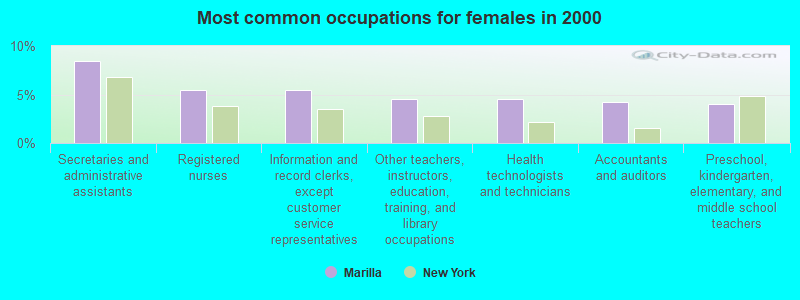
- Secretaries and administrative assistants (8.4%)
- Registered nurses (5.5%)
- Information and record clerks, except customer service representatives (5.5%)
- Other teachers, instructors, education, training, and library occupations (4.6%)
- Health technologists and technicians (4.6%)
- Accountants and auditors (4.2%)
- Preschool, kindergarten, elementary, and middle school teachers (4.0%)
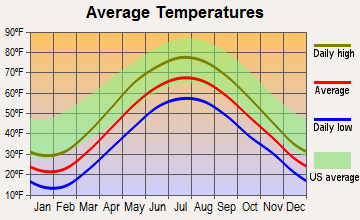
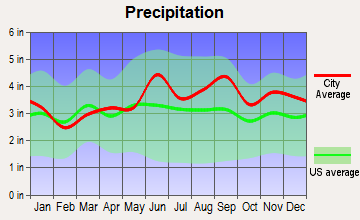
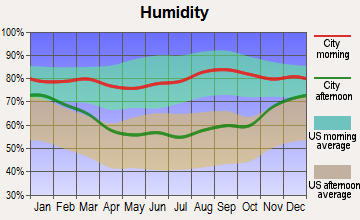
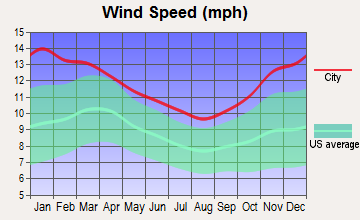
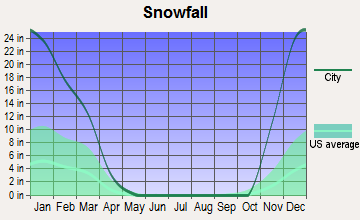
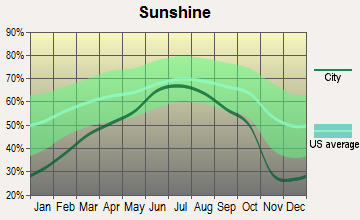
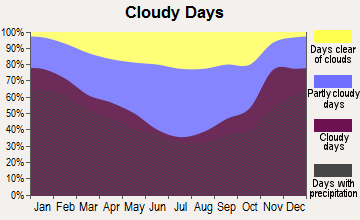
Average climate in Marilla, New York
Based on data reported by over 4,000 weather stations
(lower is better)
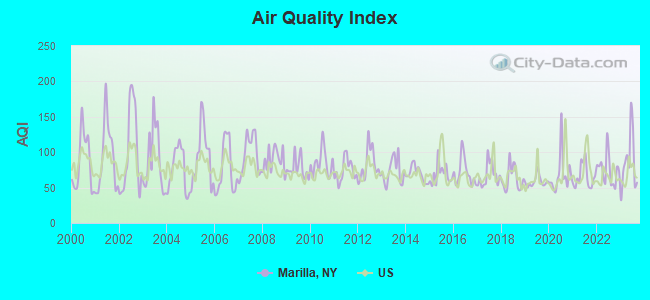
Air Quality Index (AQI) level in 2023 was 86.0. This is about average.
| City: | 86.0 |
| U.S.: | 72.6 |
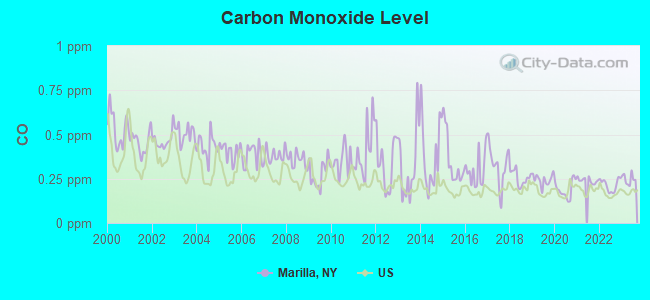
Carbon Monoxide (CO) [ppm] level in 2023 was 0.248. This is about average. Closest monitor was 14.2 miles away from the city center.
| City: | 0.248 |
| U.S.: | 0.251 |
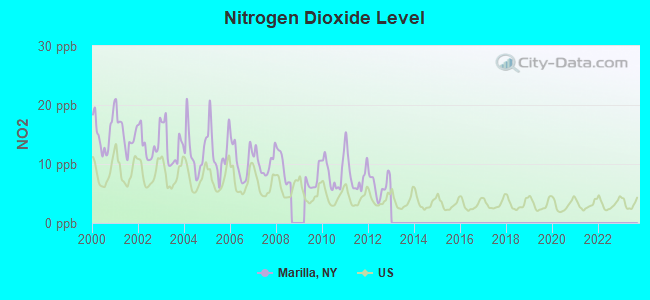
Nitrogen Dioxide (NO2) [ppb] level in 2012 was 6.43. This is worse than average. Closest monitor was 14.2 miles away from the city center.
| City: | 6.43 |
| U.S.: | 5.11 |
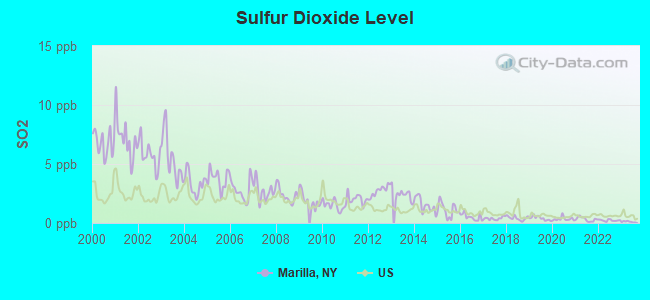
Sulfur Dioxide (SO2) [ppb] level in 2023 was 0.107. This is significantly better than average. Closest monitor was 12.1 miles away from the city center.
| City: | 0.107 |
| U.S.: | 1.515 |
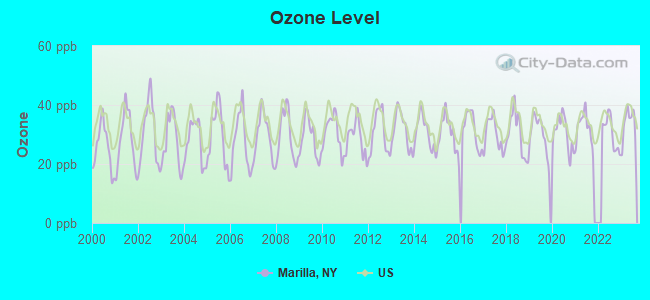
Ozone [ppb] level in 2023 was 33.8. This is about average. Closest monitor was 14.2 miles away from the city center.
| City: | 33.8 |
| U.S.: | 33.3 |
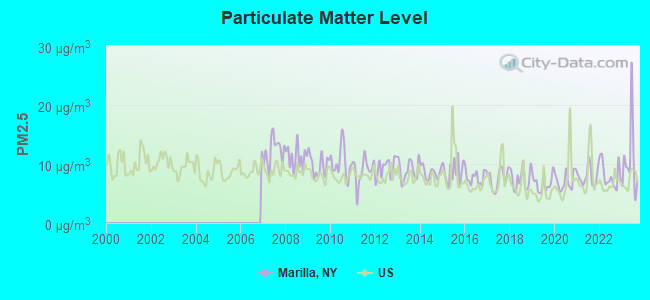
Particulate Matter (PM2.5) [µg/m3] level in 2023 was 10.6. This is worse than average. Closest monitor was 14.2 miles away from the city center.
| City: | 10.6 |
| U.S.: | 8.1 |
Tornado activity:
Marilla-area historical tornado activity is slightly below New York state average. It is 72% smaller than the overall U.S. average.
On 8/19/1970, a category F3 (max. wind speeds 158-206 mph) tornado 18.0 miles away from the Marilla town center injured 3 people and caused between $50,000 and $500,000 in damages.
On 7/24/1967, a category F3 tornado 28.9 miles away from the town center caused between $5000 and $50,000 in damages.
Earthquake activity:
Marilla-area historical earthquake activity is significantly above New York state average. It is 67% smaller than the overall U.S. average.On 9/25/1998 at 19:52:52, a magnitude 5.2 (4.8 MB, 4.3 MS, 5.2 LG, 4.5 MW, Depth: 3.1 mi, Class: Moderate, Intensity: VI - VII) earthquake occurred 132.7 miles away from Marilla center
On 1/31/1986 at 16:46:43, a magnitude 5.0 (5.0 MB) earthquake occurred 158.8 miles away from the city center
On 10/7/1983 at 10:18:46, a magnitude 5.3 (5.1 MB, 5.3 LG, 5.1 ML) earthquake occurred 224.8 miles away from the city center
On 8/23/2011 at 17:51:04, a magnitude 5.8 (5.8 MW, Depth: 3.7 mi) earthquake occurred 341.6 miles away from the city center
On 4/20/2002 at 10:50:47, a magnitude 5.3 (5.3 ML, Depth: 3.0 mi) earthquake occurred 268.7 miles away from the city center
On 4/20/2002 at 10:50:47, a magnitude 5.2 (5.2 MB, 4.2 MS, 5.2 MW, 5.0 MW) earthquake occurred 267.1 miles away from the city center
Magnitude types: regional Lg-wave magnitude (LG), body-wave magnitude (MB), local magnitude (ML), surface-wave magnitude (MS), moment magnitude (MW)
Natural disasters:
The number of natural disasters in Erie County (22) is greater than the US average (15).Major Disasters (Presidential) Declared: 11
Emergencies Declared: 10
Causes of natural disasters: Storms: 8, Floods: 7, Snowstorms: 6, Hurricanes: 2, Snows: 2, Winter Storms: 2, Blizzard: 1, Ice Storm: 1, Power Outage: 1, Wind: 1, Other: 2 (Note: some incidents may be assigned to more than one category).
Hospitals and medical centers near Marilla:
- ABSOLUT CTR FOR NURSING AND REHAB AURORA PARK L L C (Nursing Home, about 6 miles away; EAST AURORA, NY)
- GREENFIELD HEALTH AND REHABILITATION CENTER (Nursing Home, about 7 miles away; LANCASTER, NY)
- ERIE CO HOME INFIRMARY (Nursing Home, about 8 miles away; ALDEN, NY)
- ERIE COUNTY HOME (Nursing Home, about 8 miles away; ALDEN, NY)
- ELDERWOOD HEALTH CARE AT LINWOOD (Nursing Home, about 9 miles away; LANCASTER, NY)
- BROTHERS OF MERCY NURSING AND REHABILITATION CENTER (Nursing Home, about 11 miles away; CLARENCE, NY)
- PEOPLE, INC (Hospital, about 12 miles away; ORCHARD PARK, NY)
Amtrak stations near Marilla:
- 12 miles: BUFFALO-DEPEW (DEPEW, 55 DICK RD.) . Services: ticket office, partially wheelchair accessible, enclosed waiting area, public restrooms, public payphones, vending machines, free short-term parking, call for taxi service.
- 18 miles: BUFFALO-EXCHANGE STREET (BUFALO, EXCHANGE BTW ELLICOTT & WASHINGTON) . Services: ticket office, partially wheelchair accessible, enclosed waiting area, public restrooms, public payphones, vending machines, paid short-term parking, call for car rental service, call for taxi service, intercity bus service, public transit connection.
Colleges/universities with over 2000 students nearest to Marilla:
- Bryant & Stratton College-Online (about 12 miles; Orchard Park, NY; Full-time enrollment: 2,212)
- Daemen College (about 16 miles; Amherst, NY; FT enrollment: 2,365)
- Canisius College (about 18 miles; Buffalo, NY; FT enrollment: 4,376)
- Erie Community College (about 18 miles; Buffalo, NY; FT enrollment: 11,035)
- University at Buffalo (about 18 miles; Buffalo, NY; FT enrollment: 25,415)
- Medaille College (about 18 miles; Buffalo, NY; FT enrollment: 2,361)
- D'Youville College (about 19 miles; Buffalo, NY; FT enrollment: 2,398)
Public elementary/middle school in Marilla:
- MARILLA PRIMARY SCHOOL (Students: 200, Location: 11683 BULLIS RD, Grades: KG-4)
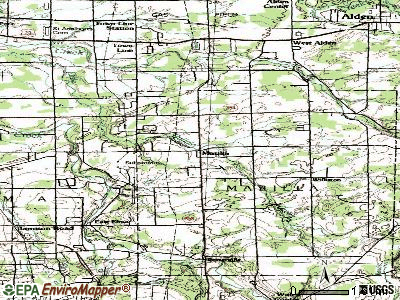
Points of interest:
Notable locations in Marilla: Depew-Lancaster Camp (A), Claymount Farms (B), G C Acres (C), Berner Farms (D), Marilla Fire Company (E). Display/hide their locations on the map
Churches in Marilla include: Saint Nicodemus Lutheran Church (A), First Baptist Church of Marilla (B), Williston United Methodist Church (C). Display/hide their locations on the map
Cemeteries: Marilla Cemetery (1), Maple Rest Cemetery (2), Maplewood Cemetery (3). Display/hide their locations on the map
| This town: | 2.6 people |
| New York: | 2.6 people |
| This town: | 75.2% |
| Whole state: | 63.5% |
| This town: | 4.8% |
| Whole state: | 6.8% |
Likely homosexual households (counted as self-reported same-sex unmarried-partner households)
- Lesbian couples: 0.1% of all households
- Gay men: 0.0% of all households
| This town: | 3.7% |
| Whole state: | 14.6% |
| This town: | 0.9% |
| Whole state: | 7.4% |
For population 15 years and over in Marilla:
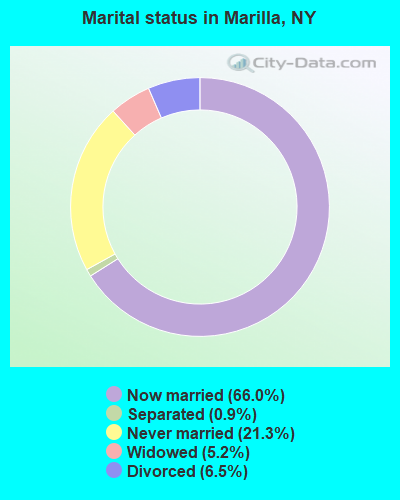
- Never married: 21.3%
- Now married: 66.0%
- Separated: 0.9%
- Widowed: 5.2%
- Divorced: 6.5%
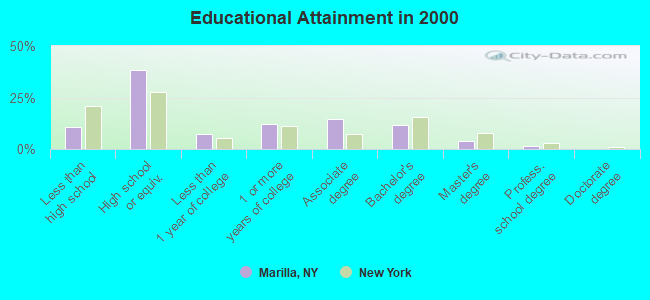
For population 25 years and over in Marilla:
- High school or higher: 89.3%
- Bachelor's degree or higher: 17.2%
- Graduate or professional degree: 5.3%
- Unemployed: 5.4%
- Mean travel time to work (commute): 27.3 minutes
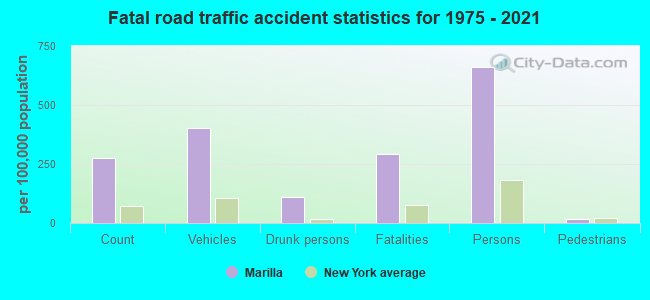
| Here: | 9.0 |
| New York average: | 14.2 |
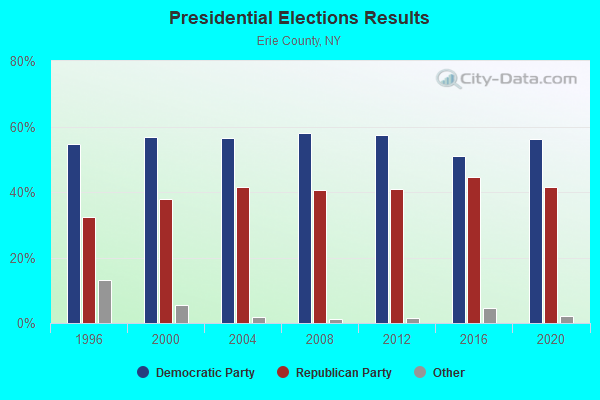
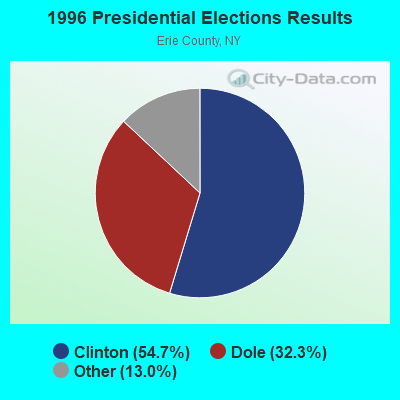
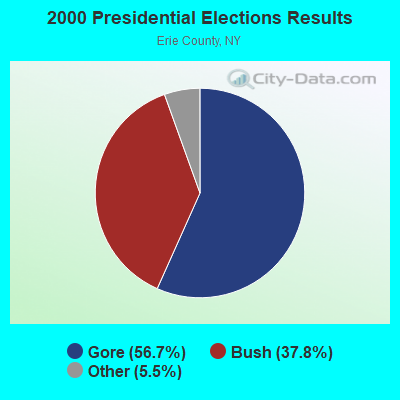
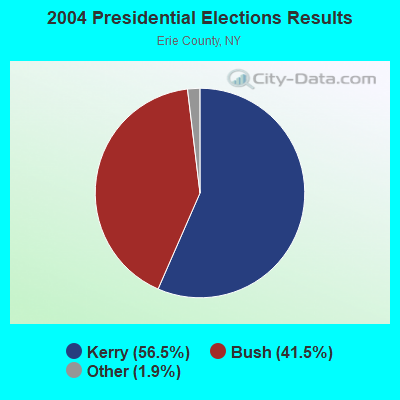
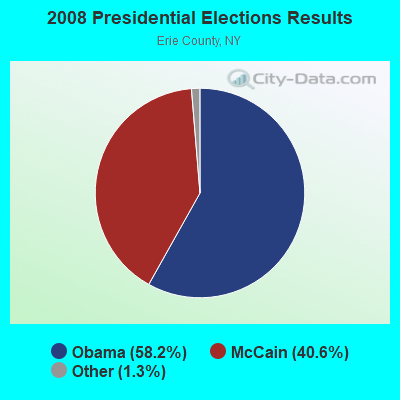
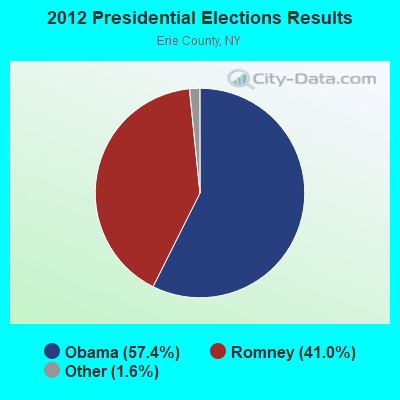
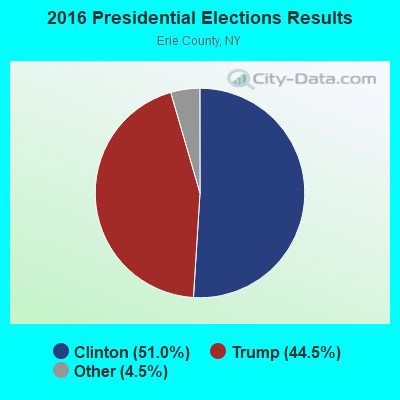

Graphs represent county-level data. Detailed 2008 Election Results
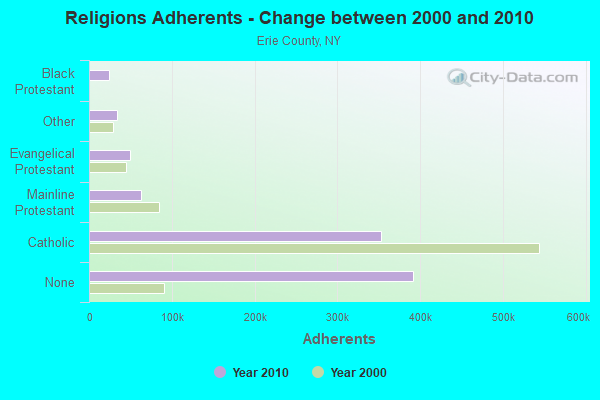
Religion statistics for Marilla, NY (based on Erie County data)
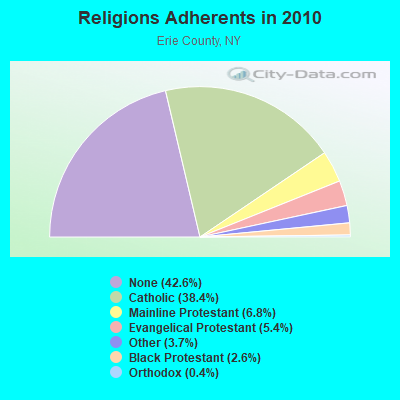
| Religion | Adherents | Congregations |
|---|---|---|
| Catholic | 352,894 | 111 |
| Mainline Protestant | 62,675 | 212 |
| Evangelical Protestant | 49,435 | 209 |
| Other | 34,076 | 79 |
| Black Protestant | 24,192 | 69 |
| Orthodox | 4,103 | 9 |
| None | 391,665 | - |
Food Environment Statistics:
| Here: | 2.59 / 10,000 pop. |
| New York: | 4.13 / 10,000 pop. |
| Erie County: | 0.05 / 10,000 pop. |
| New York: | 0.06 / 10,000 pop. |
| Erie County: | 1.37 / 10,000 pop. |
| New York: | 0.92 / 10,000 pop. |
| This county: | 2.50 / 10,000 pop. |
| State: | 1.68 / 10,000 pop. |
| Erie County: | 8.11 / 10,000 pop. |
| State: | 8.82 / 10,000 pop. |
| Here: | 9.8% |
| New York: | 8.2% |
| Erie County: | 26.9% |
| New York: | 23.8% |
| Erie County: | 13.4% |
| New York: | 15.6% |
2.96% of this county's 2021 resident taxpayers lived in other counties in 2020 ($58,957 average adjusted gross income)
| Here: | 2.96% |
| New York average: | 5.29% |
0.01% of residents moved from foreign countries ($164 average AGI)
Erie County: 0.01% New York average: 0.01%
Top counties from which taxpayers relocated into this county between 2020 and 2021:
| from Niagara County, NY | |
| from Queens County, NY | |
| from Monroe County, NY |
3.42% of this county's 2020 resident taxpayers moved to other counties in 2021 ($64,893 average adjusted gross income)
| Here: | 3.42% |
| New York average: | 6.93% |
0.01% of residents moved to foreign countries ($150 average AGI)
Erie County: 0.01% New York average: 0.02%
Top counties to which taxpayers relocated from this county between 2020 and 2021:
| to Niagara County, NY | |
| to Monroe County, NY | |
| to Cattaraugus County, NY |
Strongest AM radio stations in Marilla:
- WWKB (1520 AM; 50 kW; BUFFALO, NY; Owner: ENTERCOM BUFFALO LICENSE, LLC)
- WXRL (1300 AM; 5 kW; LANCASTER, NY; Owner: DOME BROADCASTING, INC.)
- WGR (550 AM; 5 kW; BUFFALO, NY; Owner: ENTERCOM BUFFALO LICENSE, LLC)
- WHAM (1180 AM; 50 kW; ROCHESTER, NY; Owner: CITICASTERS LICENSES, L.P.)
- WNED (970 AM; 5 kW; BUFFALO, NY)
- WHLD (1270 AM; 5 kW; NIAGARA FALLS, NY; Owner: CITADEL BROADCASTING COMPANY)
- WTOR (770 AM; daytime; 9 kW; YOUNGSTOWN, NY; Owner: BIRACH BROADCASTING CORPORATION)
- WBEN (930 AM; 5 kW; BUFFALO, NY; Owner: ENTERCOM BUFFALO LICENSE, LLC)
- WMNY (1120 AM; daytime; 1 kW; BUFFALO, NY; Owner: CITADEL BROADCASTING COMPANY)
- WCJW (1140 AM; daytime; 2 kW; WARSAW, NY; Owner: LLOYD LANE, INCORPORATED)
- WECK (1230 AM; 1 kW; CHEEKTOWAGA, NY; Owner: INFINITY RADIO OPERATIONS INC.)
- WJJL (1440 AM; 5 kW; NIAGARA FALLS, NY; Owner: M.J. PHILLIPS COMMUNICATIONS, INC.)
- WUFO (1080 AM; daytime; 1 kW; AMHERST, NY)
Strongest FM radio stations in Marilla:
- WTSS (102.5 FM; BUFFALO, NY; Owner: ENTERCOM BUFFALO LICENSE, LLC)
- WLOF (101.7 FM; ATTICA, NY; Owner: HOLY FAMILY COMMUNICATIONS, INC.)
- WGRF (96.9 FM; BUFFALO, NY; Owner: CITADEL BROADCASTING COMPANY)
- WBUF (92.9 FM; BUFFALO, NY; Owner: INFINITY RADIO OPERATIONS INC.)
- WNSA (107.7 FM; WETHERSFIELD TWNSHP, NY; Owner: ADELPHIA COMMUNICATIONS CORPORATION, DEBTOR-IN-POSSESSION)
- WNED-FM (94.5 FM; BUFFALO, NY; Owner: WESTERN NEW YORK PUBLIC B/C ASSOC.)
- WDCX (99.5 FM; BUFFALO, NY; Owner: KIMTRON, INC.)
- WFBF (89.9 FM; BUFFALO, NY; Owner: FAMILY STATIONS, INC.)
- WCOU (88.3 FM; WARSAW, NY; Owner: FAMILY LIFE MINISTRIES, INC.)
- WHTT-FM (104.1 FM; BUFFALO, NY; Owner: CITADEL BROADCASTING COMPANY)
- WBLK (93.7 FM; DEPEW, NY; Owner: INFINITY RADIO OPERATIONS INC.)
- WJYE (96.1 FM; BUFFALO, NY; Owner: INFINITY RADIO OPERATIONS INC.)
- WYRK (106.5 FM; BUFFALO, NY; Owner: INFINITY RADIO OPERATIONS INC.)
- WEDG (103.3 FM; BUFFALO, NY; Owner: CITADEL BROADCASTING COMPANY)
- W284AP (104.7 FM; BUFFALO, NY; Owner: FAMILY LIFE MINISTRIES, INC.)
- WBFO (88.7 FM; BUFFALO, NY; Owner: STATE UNIVERSITY OF NEW YORK)
- WKSE (98.5 FM; NIAGARA FALLS, NY; Owner: ENTERCOM BUFFALO LICENSE, LLC)
- W207BB (89.3 FM; BUFFALO, NY; Owner: PENSACOLA CHRISTIAN COLLEGE, INC)
TV broadcast stations around Marilla:
- WNYO-TV (Channel 49; BUFFALO, NY; Owner: NEW YORK TELEVISION, INC.)
- WGRZ-TV (Channel 2; BUFFALO, NY; Owner: MULTIMEDIA ENTERTAINMENT, INC.)
- WKBW-TV (Channel 7; BUFFALO, NY; Owner: WKBW-TV LICENSE, INC.)
- WIVB-TV (Channel 4; BUFFALO, NY; Owner: WIVB BROADCASTING, LLC)
- WNED-TV (Channel 17; BUFFALO, NY; Owner: WESTERN NY PUBLIC BROADCASTING ASSOC.)
- WUTV (Channel 29; BUFFALO, NY; Owner: WUTV LICENSEE, LLC)
- WNLO (Channel 23; BUFFALO, NY; Owner: WIVB BROADCASTING, LLC)
- WDTB-LP (Channel 39; HAMBURG, NY; Owner: WORD OF GOD FELLOWSHIP, INC.)
- WFHW-LP (Channel 58; BUFFALO, NY; Owner: CITIZENS TELEVISION SYSTEM, INC.)
- WPXJ-TV (Channel 51; BATAVIA, NY; Owner: PAXSON BUFFALO LICENSE, INC.)
- WBXZ-LP (Channel 56; BUFFALO, NY; Owner: RENARD COMMUNICATIONS CORP.)
- WNGS (Channel 67; SPRINGVILLE, NY; Owner: CAROLINE K. POWLEY D/B/A UNICORN/SPRINGVILLE)
- WBNF-CA (Channel 15; BUFFALO, NY; Owner: FAITH BROADCASTING NETWORK, INC.)
- National Bridge Inventory (NBI) Statistics
- 11Number of bridges
- 105ft / 32.2mTotal length
- $23,535,000Total costs
- 13,514Total average daily traffic
- 804Total average daily truck traffic
- 15,973Total future (year 2037) average daily traffic
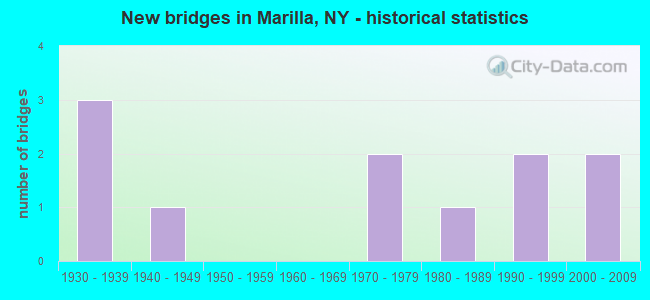
- New bridges - historical statistics
- 31930-1939
- 11940-1949
- 21970-1979
- 11980-1989
- 21990-1999
- 22000-2009
FCC Registered Antenna Towers:
21 (See the full list of FCC Registered Antenna Towers in Marilla)FCC Registered Broadcast Land Mobile Towers:
1- Lat: 42.840667 Lon: -78.551833, Call Sign: WPTR723,
Assigned Frequencies: 462.337 MHz, 467.337 MHz, 462.412 MHz, 467.412 MHz, Grant Date: 11/20/2021, Expiration Date: 11/30/2031, Certifier: Kenneth G Palmer, Registrant: Fm Communications Inc., 1914 Colvin Blvd., Tonawanda, NY 14150, Phone: (716) 832-2026, Fax: (716) 832-7930, Email:
FCC Registered Amateur Radio Licenses:
9 (See the full list of FCC Registered Amateur Radio Licenses in Marilla)| Most common first names in Marilla, NY among deceased individuals | ||
| Name | Count | Lived (average) |
|---|---|---|
| Robert | 11 | 72.7 years |
| Helen | 9 | 80.1 years |
| Joseph | 7 | 63.3 years |
| John | 7 | 81.0 years |
| William | 6 | 76.3 years |
| James | 5 | 57.4 years |
| Stanley | 5 | 76.2 years |
| Harold | 4 | 80.2 years |
| Alice | 4 | 88.0 years |
| Carl | 4 | 79.8 years |
| Most common last names in Marilla, NY among deceased individuals | ||
| Last name | Count | Lived (average) |
|---|---|---|
| Skorniak | 5 | 77.4 years |
| Finch | 3 | 79.0 years |
| Choate | 3 | 79.7 years |
| Cook | 3 | 71.3 years |
| Dabb | 3 | 81.3 years |
| Bauder | 3 | 80.7 years |
| Eldridge | 3 | 87.3 years |
| Holmes | 3 | 70.3 years |
| Militello | 3 | 86.0 years |
| Zielinski | 3 | 73.3 years |
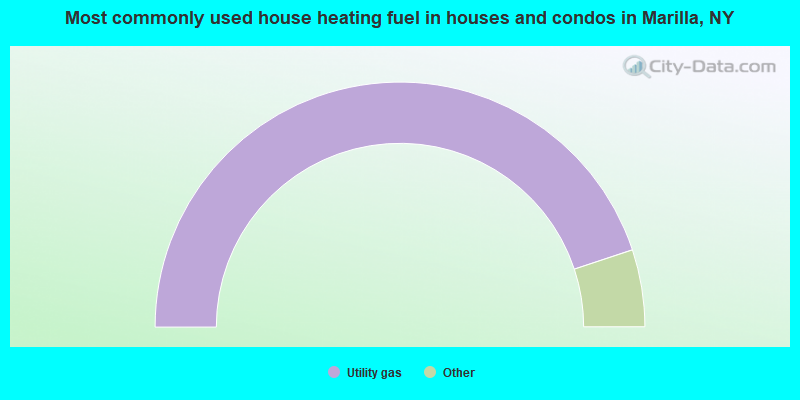
- 89.8%Utility gas
- 3.3%Bottled, tank, or LP gas
- 3.1%Wood
- 1.8%Electricity
- 1.7%Fuel oil, kerosene, etc.
- 0.4%Coal or coke
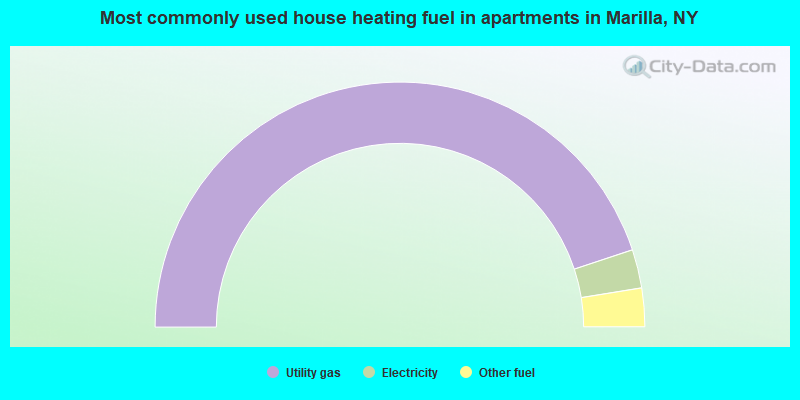
- 89.8%Utility gas
- 5.1%Electricity
- 5.1%Other fuel
Marilla compared to New York state average:
- Unemployed percentage below state average.
- Black race population percentage significantly below state average.
- Hispanic race population percentage significantly below state average.
- Median age above state average.
- Foreign-born population percentage significantly below state average.
- Renting percentage significantly below state average.
- Length of stay since moving in significantly above state average.
- Number of rooms per house significantly below state average.
- House age significantly below state average.
- Percentage of population with a bachelor's degree or higher below state average.
Marilla on our top lists:
- #3 on the list of "Top 101 cities with largest percentage of females in occupations: bus drivers (population 5,000+)"
- #6 on the list of "Top 101 cities with largest percentage of females in industries: pharmacies and drug stores (population 5,000+)"
- #7 on the list of "Top 101 cities with largest percentage of males in occupations: printing workers (population 5,000+)"
- #11 on the list of "Top 101 cities with largest percentage of females in occupations: accountants and auditors (population 5,000+)"
- #20 on the list of "Top 101 cities with largest percentage of males in industries: printing and related support activities (population 5,000+)"
- #24 on the list of "Top 101 cities with largest percentage of females in industries: book stores and news dealers (population 5,000+)"
- #24 on the list of "Top 101 cities with largest percentage of males in industries: farm supplies merchant wholesalers (population 5,000+)"
- #38 on the list of "Top 100 least racially diverse cities (pop. 5,000+)"
- #45 on the list of "Top 101 cities with largest percentage of females in industries: office supplies and stationery stores (population 5,000+)"
- #47 on the list of "Top 101 cities with the smallest percentage of likely homosexual households (counted as self-reported same-sex unmarried-partner households) (population 5,000+)"
- #47 on the list of "Top 101 cities with largest percentage of males in industries: motor vehicles, parts and supplies merchant wholesalers (population 5,000+)"
- #49 on the list of "Top 101 cities with largest percentage of females in occupations: assemblers and fabricators (population 5,000+)"
- #54 on the list of "Top 101 cities with largest percentage of males in occupations: drafters, engineering, and mapping technicians (population 5,000+)"
- #55 on the list of "Top 101 cities with largest percentage of males in industries: book stores and news dealers (population 5,000+)"
- #58 on the list of "Top 101 cities with largest percentage of females in industries: religious, grantmaking, civic, professional, and similar organizations (population 5,000+)"
- #60 on the list of "Top 101 cities with largest percentage of males in industries: rail transportation (population 5,000+)"
- #62 on the list of "Top 101 cities with largest percentage of males in occupations: business operations specialists (population 5,000+)"
- #72 on the list of "Top 101 cities with largest percentage of females in industries: drugs, sundries, and chemical and allied products merchant wholesalers (population 5,000+)"
- #84 on the list of "Top 101 cities with largest percentage of females in industries: plastics and rubber products (population 5,000+)"
- #85 on the list of "Top 101 cities with largest percentage of females in industries: wood products (population 5,000+)"
- #2 on the list of "Top 101 counties with the lowest percentage of residents relocating from other counties between 2010 and 2011"
- #7 on the list of "Top 101 counties with the lowest percentage of residents relocating to other counties in 2011"
- #8 on the list of "Top 101 counties with the most Catholic congregations"
- #16 on the list of "Top 101 counties with the highest Sulfur Oxides Annual air pollution readings in 2012 (µg/m3)"
- #17 on the list of "Top 101 counties with the most Mainline Protestant congregations"

|
Total of 10 patent applications in 2008-2024.