Sanibel, Florida Submit your own pictures of this city and show them to the world
OSM Map
General Map
Google Map
MSN Map
OSM Map
General Map
Google Map
MSN Map
OSM Map
General Map
Google Map
MSN Map
OSM Map
General Map
Google Map
MSN Map
Please wait while loading the map...
Population in 2022: 6,482 (70% urban, 30% rural). Population change since 2000: +6.9%Males: 3,088 Females: 3,394
March 2022 cost of living index in Sanibel: 97.9 (near average, U.S. average is 100) Percentage of residents living in poverty in 2022: 9.5%for White Non-Hispanic residents , 40.4% for Hispanic or Latino residents , 50.0% for American Indian residents , 100.0% for other race residents )
Profiles of local businesses
Business Search - 14 Million verified businesses
Data:
Median household income ($)
Median household income (% change since 2000)
Household income diversity
Ratio of average income to average house value (%)
Ratio of average income to average rent
Median household income ($) - White
Median household income ($) - Black or African American
Median household income ($) - Asian
Median household income ($) - Hispanic or Latino
Median household income ($) - American Indian and Alaska Native
Median household income ($) - Multirace
Median household income ($) - Other Race
Median household income for houses/condos with a mortgage ($)
Median household income for apartments without a mortgage ($)
Races - White alone (%)
Races - White alone (% change since 2000)
Races - Black alone (%)
Races - Black alone (% change since 2000)
Races - American Indian alone (%)
Races - American Indian alone (% change since 2000)
Races - Asian alone (%)
Races - Asian alone (% change since 2000)
Races - Hispanic (%)
Races - Hispanic (% change since 2000)
Races - Native Hawaiian and Other Pacific Islander alone (%)
Races - Native Hawaiian and Other Pacific Islander alone (% change since 2000)
Races - Two or more races (%)
Races - Two or more races (% change since 2000)
Races - Other race alone (%)
Races - Other race alone (% change since 2000)
Racial diversity
Unemployment (%)
Unemployment (% change since 2000)
Unemployment (%) - White
Unemployment (%) - Black or African American
Unemployment (%) - Asian
Unemployment (%) - Hispanic or Latino
Unemployment (%) - American Indian and Alaska Native
Unemployment (%) - Multirace
Unemployment (%) - Other Race
Population density (people per square mile)
Population - Males (%)
Population - Females (%)
Population - Males (%) - White
Population - Males (%) - Black or African American
Population - Males (%) - Asian
Population - Males (%) - Hispanic or Latino
Population - Males (%) - American Indian and Alaska Native
Population - Males (%) - Multirace
Population - Males (%) - Other Race
Population - Females (%) - White
Population - Females (%) - Black or African American
Population - Females (%) - Asian
Population - Females (%) - Hispanic or Latino
Population - Females (%) - American Indian and Alaska Native
Population - Females (%) - Multirace
Population - Females (%) - Other Race
Coronavirus confirmed cases (Apr 26, 2024)
Deaths caused by coronavirus (Apr 26, 2024)
Coronavirus confirmed cases (per 100k population) (Apr 26, 2024)
Deaths caused by coronavirus (per 100k population) (Apr 26, 2024)
Daily increase in number of cases (Apr 26, 2024)
Weekly increase in number of cases (Apr 26, 2024)
Cases doubled (in days) (Apr 26, 2024)
Hospitalized patients (Apr 18, 2022)
Negative test results (Apr 18, 2022)
Total test results (Apr 18, 2022)
COVID Vaccine doses distributed (per 100k population) (Sep 19, 2023)
COVID Vaccine doses administered (per 100k population) (Sep 19, 2023)
COVID Vaccine doses distributed (Sep 19, 2023)
COVID Vaccine doses administered (Sep 19, 2023)
Likely homosexual households (%)
Likely homosexual households (% change since 2000)
Likely homosexual households - Lesbian couples (%)
Likely homosexual households - Lesbian couples (% change since 2000)
Likely homosexual households - Gay men (%)
Likely homosexual households - Gay men (% change since 2000)
Cost of living index
Median gross rent ($)
Median contract rent ($)
Median monthly housing costs ($)
Median house or condo value ($)
Median house or condo value ($ change since 2000)
Mean house or condo value by units in structure - 1, detached ($)
Mean house or condo value by units in structure - 1, attached ($)
Mean house or condo value by units in structure - 2 ($)
Mean house or condo value by units in structure by units in structure - 3 or 4 ($)
Mean house or condo value by units in structure - 5 or more ($)
Mean house or condo value by units in structure - Boat, RV, van, etc. ($)
Mean house or condo value by units in structure - Mobile home ($)
Median house or condo value ($) - White
Median house or condo value ($) - Black or African American
Median house or condo value ($) - Asian
Median house or condo value ($) - Hispanic or Latino
Median house or condo value ($) - American Indian and Alaska Native
Median house or condo value ($) - Multirace
Median house or condo value ($) - Other Race
Median resident age
Resident age diversity
Median resident age - Males
Median resident age - Females
Median resident age - White
Median resident age - Black or African American
Median resident age - Asian
Median resident age - Hispanic or Latino
Median resident age - American Indian and Alaska Native
Median resident age - Multirace
Median resident age - Other Race
Median resident age - Males - White
Median resident age - Males - Black or African American
Median resident age - Males - Asian
Median resident age - Males - Hispanic or Latino
Median resident age - Males - American Indian and Alaska Native
Median resident age - Males - Multirace
Median resident age - Males - Other Race
Median resident age - Females - White
Median resident age - Females - Black or African American
Median resident age - Females - Asian
Median resident age - Females - Hispanic or Latino
Median resident age - Females - American Indian and Alaska Native
Median resident age - Females - Multirace
Median resident age - Females - Other Race
Commute - mean travel time to work (minutes)
Travel time to work - Less than 5 minutes (%)
Travel time to work - Less than 5 minutes (% change since 2000)
Travel time to work - 5 to 9 minutes (%)
Travel time to work - 5 to 9 minutes (% change since 2000)
Travel time to work - 10 to 19 minutes (%)
Travel time to work - 10 to 19 minutes (% change since 2000)
Travel time to work - 20 to 29 minutes (%)
Travel time to work - 20 to 29 minutes (% change since 2000)
Travel time to work - 30 to 39 minutes (%)
Travel time to work - 30 to 39 minutes (% change since 2000)
Travel time to work - 40 to 59 minutes (%)
Travel time to work - 40 to 59 minutes (% change since 2000)
Travel time to work - 60 to 89 minutes (%)
Travel time to work - 60 to 89 minutes (% change since 2000)
Travel time to work - 90 or more minutes (%)
Travel time to work - 90 or more minutes (% change since 2000)
Marital status - Never married (%)
Marital status - Now married (%)
Marital status - Separated (%)
Marital status - Widowed (%)
Marital status - Divorced (%)
Median family income ($)
Median family income (% change since 2000)
Median non-family income ($)
Median non-family income (% change since 2000)
Median per capita income ($)
Median per capita income (% change since 2000)
Median family income ($) - White
Median family income ($) - Black or African American
Median family income ($) - Asian
Median family income ($) - Hispanic or Latino
Median family income ($) - American Indian and Alaska Native
Median family income ($) - Multirace
Median family income ($) - Other Race
Median year house/condo built
Median year apartment built
Year house built - Built 2005 or later (%)
Year house built - Built 2000 to 2004 (%)
Year house built - Built 1990 to 1999 (%)
Year house built - Built 1980 to 1989 (%)
Year house built - Built 1970 to 1979 (%)
Year house built - Built 1960 to 1969 (%)
Year house built - Built 1950 to 1959 (%)
Year house built - Built 1940 to 1949 (%)
Year house built - Built 1939 or earlier (%)
Average household size
Household density (households per square mile)
Average household size - White
Average household size - Black or African American
Average household size - Asian
Average household size - Hispanic or Latino
Average household size - American Indian and Alaska Native
Average household size - Multirace
Average household size - Other Race
Occupied housing units (%)
Vacant housing units (%)
Owner occupied housing units (%)
Renter occupied housing units (%)
Vacancy status - For rent (%)
Vacancy status - For sale only (%)
Vacancy status - Rented or sold, not occupied (%)
Vacancy status - For seasonal, recreational, or occasional use (%)
Vacancy status - For migrant workers (%)
Vacancy status - Other vacant (%)
Residents with income below the poverty level (%)
Residents with income below 50% of the poverty level (%)
Children below poverty level (%)
Poor families by family type - Married-couple family (%)
Poor families by family type - Male, no wife present (%)
Poor families by family type - Female, no husband present (%)
Poverty status for native-born residents (%)
Poverty status for foreign-born residents (%)
Poverty among high school graduates not in families (%)
Poverty among people who did not graduate high school not in families (%)
Residents with income below the poverty level (%) - White
Residents with income below the poverty level (%) - Black or African American
Residents with income below the poverty level (%) - Asian
Residents with income below the poverty level (%) - Hispanic or Latino
Residents with income below the poverty level (%) - American Indian and Alaska Native
Residents with income below the poverty level (%) - Multirace
Residents with income below the poverty level (%) - Other Race
Air pollution - Air Quality Index (AQI)
Air pollution - CO
Air pollution - NO2
Air pollution - SO2
Air pollution - Ozone
Air pollution - PM10
Air pollution - PM25
Air pollution - Pb
Crime - Murders per 100,000 population
Crime - Rapes per 100,000 population
Crime - Robberies per 100,000 population
Crime - Assaults per 100,000 population
Crime - Burglaries per 100,000 population
Crime - Thefts per 100,000 population
Crime - Auto thefts per 100,000 population
Crime - Arson per 100,000 population
Crime - City-data.com crime index
Crime - Violent crime index
Crime - Property crime index
Crime - Murders per 100,000 population (5 year average)
Crime - Rapes per 100,000 population (5 year average)
Crime - Robberies per 100,000 population (5 year average)
Crime - Assaults per 100,000 population (5 year average)
Crime - Burglaries per 100,000 population (5 year average)
Crime - Thefts per 100,000 population (5 year average)
Crime - Auto thefts per 100,000 population (5 year average)
Crime - Arson per 100,000 population (5 year average)
Crime - City-data.com crime index (5 year average)
Crime - Violent crime index (5 year average)
Crime - Property crime index (5 year average)
1996 Presidential Elections Results (%) - Democratic Party (Clinton)
1996 Presidential Elections Results (%) - Republican Party (Dole)
1996 Presidential Elections Results (%) - Other
2000 Presidential Elections Results (%) - Democratic Party (Gore)
2000 Presidential Elections Results (%) - Republican Party (Bush)
2000 Presidential Elections Results (%) - Other
2004 Presidential Elections Results (%) - Democratic Party (Kerry)
2004 Presidential Elections Results (%) - Republican Party (Bush)
2004 Presidential Elections Results (%) - Other
2008 Presidential Elections Results (%) - Democratic Party (Obama)
2008 Presidential Elections Results (%) - Republican Party (McCain)
2008 Presidential Elections Results (%) - Other
2012 Presidential Elections Results (%) - Democratic Party (Obama)
2012 Presidential Elections Results (%) - Republican Party (Romney)
2012 Presidential Elections Results (%) - Other
2016 Presidential Elections Results (%) - Democratic Party (Clinton)
2016 Presidential Elections Results (%) - Republican Party (Trump)
2016 Presidential Elections Results (%) - Other
2020 Presidential Elections Results (%) - Democratic Party (Biden)
2020 Presidential Elections Results (%) - Republican Party (Trump)
2020 Presidential Elections Results (%) - Other
Ancestries Reported - Arab (%)
Ancestries Reported - Czech (%)
Ancestries Reported - Danish (%)
Ancestries Reported - Dutch (%)
Ancestries Reported - English (%)
Ancestries Reported - French (%)
Ancestries Reported - French Canadian (%)
Ancestries Reported - German (%)
Ancestries Reported - Greek (%)
Ancestries Reported - Hungarian (%)
Ancestries Reported - Irish (%)
Ancestries Reported - Italian (%)
Ancestries Reported - Lithuanian (%)
Ancestries Reported - Norwegian (%)
Ancestries Reported - Polish (%)
Ancestries Reported - Portuguese (%)
Ancestries Reported - Russian (%)
Ancestries Reported - Scotch-Irish (%)
Ancestries Reported - Scottish (%)
Ancestries Reported - Slovak (%)
Ancestries Reported - Subsaharan African (%)
Ancestries Reported - Swedish (%)
Ancestries Reported - Swiss (%)
Ancestries Reported - Ukrainian (%)
Ancestries Reported - United States (%)
Ancestries Reported - Welsh (%)
Ancestries Reported - West Indian (%)
Ancestries Reported - Other (%)
Educational Attainment - No schooling completed (%)
Educational Attainment - Less than high school (%)
Educational Attainment - High school or equivalent (%)
Educational Attainment - Less than 1 year of college (%)
Educational Attainment - 1 or more years of college (%)
Educational Attainment - Associate degree (%)
Educational Attainment - Bachelor's degree (%)
Educational Attainment - Master's degree (%)
Educational Attainment - Professional school degree (%)
Educational Attainment - Doctorate degree (%)
School Enrollment - Nursery, preschool (%)
School Enrollment - Kindergarten (%)
School Enrollment - Grade 1 to 4 (%)
School Enrollment - Grade 5 to 8 (%)
School Enrollment - Grade 9 to 12 (%)
School Enrollment - College undergrad (%)
School Enrollment - Graduate or professional (%)
School Enrollment - Not enrolled in school (%)
School enrollment - Public schools (%)
School enrollment - Private schools (%)
School enrollment - Not enrolled (%)
Median number of rooms in houses and condos
Median number of rooms in apartments
Housing units lacking complete plumbing facilities (%)
Housing units lacking complete kitchen facilities (%)
Density of houses
Urban houses (%)
Rural houses (%)
Households with people 60 years and over (%)
Households with people 65 years and over (%)
Households with people 75 years and over (%)
Households with one or more nonrelatives (%)
Households with no nonrelatives (%)
Population in households (%)
Family households (%)
Nonfamily households (%)
Population in families (%)
Family households with own children (%)
Median number of bedrooms in owner occupied houses
Mean number of bedrooms in owner occupied houses
Median number of bedrooms in renter occupied houses
Mean number of bedrooms in renter occupied houses
Median number of vehichles in owner occupied houses
Mean number of vehichles in owner occupied houses
Median number of vehichles in renter occupied houses
Mean number of vehichles in renter occupied houses
Mortgage status - with mortgage (%)
Mortgage status - with second mortgage (%)
Mortgage status - with home equity loan (%)
Mortgage status - with both second mortgage and home equity loan (%)
Mortgage status - without a mortgage (%)
Average family size
Average family size - White
Average family size - Black or African American
Average family size - Asian
Average family size - Hispanic or Latino
Average family size - American Indian and Alaska Native
Average family size - Multirace
Average family size - Other Race
Geographical mobility - Same house 1 year ago (%)
Geographical mobility - Moved within same county (%)
Geographical mobility - Moved from different county within same state (%)
Geographical mobility - Moved from different state (%)
Geographical mobility - Moved from abroad (%)
Place of birth - Born in state of residence (%)
Place of birth - Born in other state (%)
Place of birth - Native, outside of US (%)
Place of birth - Foreign born (%)
Housing units in structures - 1, detached (%)
Housing units in structures - 1, attached (%)
Housing units in structures - 2 (%)
Housing units in structures - 3 or 4 (%)
Housing units in structures - 5 to 9 (%)
Housing units in structures - 10 to 19 (%)
Housing units in structures - 20 to 49 (%)
Housing units in structures - 50 or more (%)
Housing units in structures - Mobile home (%)
Housing units in structures - Boat, RV, van, etc. (%)
House/condo owner moved in on average (years ago)
Renter moved in on average (years ago)
Year householder moved into unit - Moved in 1999 to March 2000 (%)
Year householder moved into unit - Moved in 1995 to 1998 (%)
Year householder moved into unit - Moved in 1990 to 1994 (%)
Year householder moved into unit - Moved in 1980 to 1989 (%)
Year householder moved into unit - Moved in 1970 to 1979 (%)
Year householder moved into unit - Moved in 1969 or earlier (%)
Means of transportation to work - Drove car alone (%)
Means of transportation to work - Carpooled (%)
Means of transportation to work - Public transportation (%)
Means of transportation to work - Bus or trolley bus (%)
Means of transportation to work - Streetcar or trolley car (%)
Means of transportation to work - Subway or elevated (%)
Means of transportation to work - Railroad (%)
Means of transportation to work - Ferryboat (%)
Means of transportation to work - Taxicab (%)
Means of transportation to work - Motorcycle (%)
Means of transportation to work - Bicycle (%)
Means of transportation to work - Walked (%)
Means of transportation to work - Other means (%)
Working at home (%)
Industry diversity
Most Common Industries - Agriculture, forestry, fishing and hunting, and mining (%)
Most Common Industries - Agriculture, forestry, fishing and hunting (%)
Most Common Industries - Mining, quarrying, and oil and gas extraction (%)
Most Common Industries - Construction (%)
Most Common Industries - Manufacturing (%)
Most Common Industries - Wholesale trade (%)
Most Common Industries - Retail trade (%)
Most Common Industries - Transportation and warehousing, and utilities (%)
Most Common Industries - Transportation and warehousing (%)
Most Common Industries - Utilities (%)
Most Common Industries - Information (%)
Most Common Industries - Finance and insurance, and real estate and rental and leasing (%)
Most Common Industries - Finance and insurance (%)
Most Common Industries - Real estate and rental and leasing (%)
Most Common Industries - Professional, scientific, and management, and administrative and waste management services (%)
Most Common Industries - Professional, scientific, and technical services (%)
Most Common Industries - Management of companies and enterprises (%)
Most Common Industries - Administrative and support and waste management services (%)
Most Common Industries - Educational services, and health care and social assistance (%)
Most Common Industries - Educational services (%)
Most Common Industries - Health care and social assistance (%)
Most Common Industries - Arts, entertainment, and recreation, and accommodation and food services (%)
Most Common Industries - Arts, entertainment, and recreation (%)
Most Common Industries - Accommodation and food services (%)
Most Common Industries - Other services, except public administration (%)
Most Common Industries - Public administration (%)
Occupation diversity
Most Common Occupations - Management, business, science, and arts occupations (%)
Most Common Occupations - Management, business, and financial occupations (%)
Most Common Occupations - Management occupations (%)
Most Common Occupations - Business and financial operations occupations (%)
Most Common Occupations - Computer, engineering, and science occupations (%)
Most Common Occupations - Computer and mathematical occupations (%)
Most Common Occupations - Architecture and engineering occupations (%)
Most Common Occupations - Life, physical, and social science occupations (%)
Most Common Occupations - Education, legal, community service, arts, and media occupations (%)
Most Common Occupations - Community and social service occupations (%)
Most Common Occupations - Legal occupations (%)
Most Common Occupations - Education, training, and library occupations (%)
Most Common Occupations - Arts, design, entertainment, sports, and media occupations (%)
Most Common Occupations - Healthcare practitioners and technical occupations (%)
Most Common Occupations - Health diagnosing and treating practitioners and other technical occupations (%)
Most Common Occupations - Health technologists and technicians (%)
Most Common Occupations - Service occupations (%)
Most Common Occupations - Healthcare support occupations (%)
Most Common Occupations - Protective service occupations (%)
Most Common Occupations - Fire fighting and prevention, and other protective service workers including supervisors (%)
Most Common Occupations - Law enforcement workers including supervisors (%)
Most Common Occupations - Food preparation and serving related occupations (%)
Most Common Occupations - Building and grounds cleaning and maintenance occupations (%)
Most Common Occupations - Personal care and service occupations (%)
Most Common Occupations - Sales and office occupations (%)
Most Common Occupations - Sales and related occupations (%)
Most Common Occupations - Office and administrative support occupations (%)
Most Common Occupations - Natural resources, construction, and maintenance occupations (%)
Most Common Occupations - Farming, fishing, and forestry occupations (%)
Most Common Occupations - Construction and extraction occupations (%)
Most Common Occupations - Installation, maintenance, and repair occupations (%)
Most Common Occupations - Production, transportation, and material moving occupations (%)
Most Common Occupations - Production occupations (%)
Most Common Occupations - Transportation occupations (%)
Most Common Occupations - Material moving occupations (%)
People in Group quarters - Institutionalized population (%)
People in Group quarters - Correctional institutions (%)
People in Group quarters - Federal prisons and detention centers (%)
People in Group quarters - Halfway houses (%)
People in Group quarters - Local jails and other confinement facilities (including police lockups) (%)
People in Group quarters - Military disciplinary barracks (%)
People in Group quarters - State prisons (%)
People in Group quarters - Other types of correctional institutions (%)
People in Group quarters - Nursing homes (%)
People in Group quarters - Hospitals/wards, hospices, and schools for the handicapped (%)
People in Group quarters - Hospitals/wards and hospices for chronically ill (%)
People in Group quarters - Hospices or homes for chronically ill (%)
People in Group quarters - Military hospitals or wards for chronically ill (%)
People in Group quarters - Other hospitals or wards for chronically ill (%)
People in Group quarters - Hospitals or wards for drug/alcohol abuse (%)
People in Group quarters - Mental (Psychiatric) hospitals or wards (%)
People in Group quarters - Schools, hospitals, or wards for the mentally retarded (%)
People in Group quarters - Schools, hospitals, or wards for the physically handicapped (%)
People in Group quarters - Institutions for the deaf (%)
People in Group quarters - Institutions for the blind (%)
People in Group quarters - Orthopedic wards and institutions for the physically handicapped (%)
People in Group quarters - Wards in general hospitals for patients who have no usual home elsewhere (%)
People in Group quarters - Wards in military hospitals for patients who have no usual home elsewhere (%)
People in Group quarters - Juvenile institutions (%)
People in Group quarters - Long-term care (%)
People in Group quarters - Homes for abused, dependent, and neglected children (%)
People in Group quarters - Residential treatment centers for emotionally disturbed children (%)
People in Group quarters - Training schools for juvenile delinquents (%)
People in Group quarters - Short-term care, detention or diagnostic centers for delinquent children (%)
People in Group quarters - Type of juvenile institution unknown (%)
People in Group quarters - Noninstitutionalized population (%)
People in Group quarters - College dormitories (includes college quarters off campus) (%)
People in Group quarters - Military quarters (%)
People in Group quarters - On base (%)
People in Group quarters - Barracks, unaccompanied personnel housing (UPH), (Enlisted/Officer), ;and similar group living quarters for military personnel (%)
People in Group quarters - Transient quarters for temporary residents (%)
People in Group quarters - Military ships (%)
People in Group quarters - Group homes (%)
People in Group quarters - Homes or halfway houses for drug/alcohol abuse (%)
People in Group quarters - Homes for the mentally ill (%)
People in Group quarters - Homes for the mentally retarded (%)
People in Group quarters - Homes for the physically handicapped (%)
People in Group quarters - Other group homes (%)
People in Group quarters - Religious group quarters (%)
People in Group quarters - Dormitories (%)
People in Group quarters - Agriculture workers' dormitories on farms (%)
People in Group quarters - Job Corps and vocational training facilities (%)
People in Group quarters - Other workers' dormitories (%)
People in Group quarters - Crews of maritime vessels (%)
People in Group quarters - Other nonhousehold living situations (%)
People in Group quarters - Other noninstitutional group quarters (%)
Residents speaking English at home (%)
Residents speaking English at home - Born in the United States (%)
Residents speaking English at home - Native, born elsewhere (%)
Residents speaking English at home - Foreign born (%)
Residents speaking Spanish at home (%)
Residents speaking Spanish at home - Born in the United States (%)
Residents speaking Spanish at home - Native, born elsewhere (%)
Residents speaking Spanish at home - Foreign born (%)
Residents speaking other language at home (%)
Residents speaking other language at home - Born in the United States (%)
Residents speaking other language at home - Native, born elsewhere (%)
Residents speaking other language at home - Foreign born (%)
Class of Workers - Employee of private company (%)
Class of Workers - Self-employed in own incorporated business (%)
Class of Workers - Private not-for-profit wage and salary workers (%)
Class of Workers - Local government workers (%)
Class of Workers - State government workers (%)
Class of Workers - Federal government workers (%)
Class of Workers - Self-employed workers in own not incorporated business and Unpaid family workers (%)
House heating fuel used in houses and condos - Utility gas (%)
House heating fuel used in houses and condos - Bottled, tank, or LP gas (%)
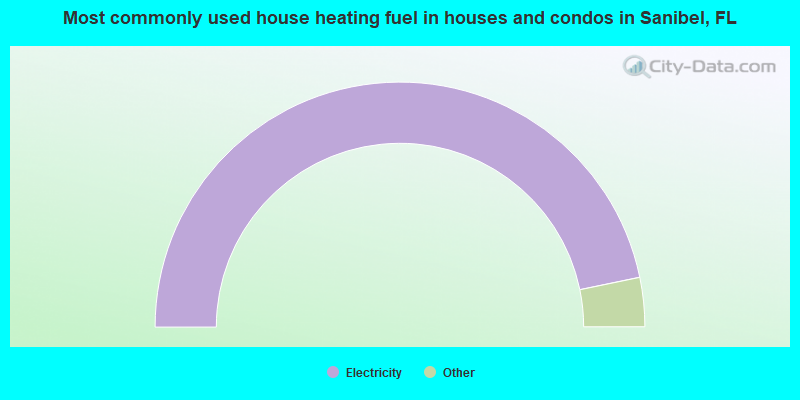
House heating fuel used in houses and condos - Electricity (%)
House heating fuel used in houses and condos - Fuel oil, kerosene, etc. (%)
House heating fuel used in houses and condos - Coal or coke (%)
House heating fuel used in houses and condos - Wood (%)
House heating fuel used in houses and condos - Solar energy (%)
House heating fuel used in houses and condos - Other fuel (%)
House heating fuel used in houses and condos - No fuel used (%)
House heating fuel used in apartments - Utility gas (%)
House heating fuel used in apartments - Bottled, tank, or LP gas (%)
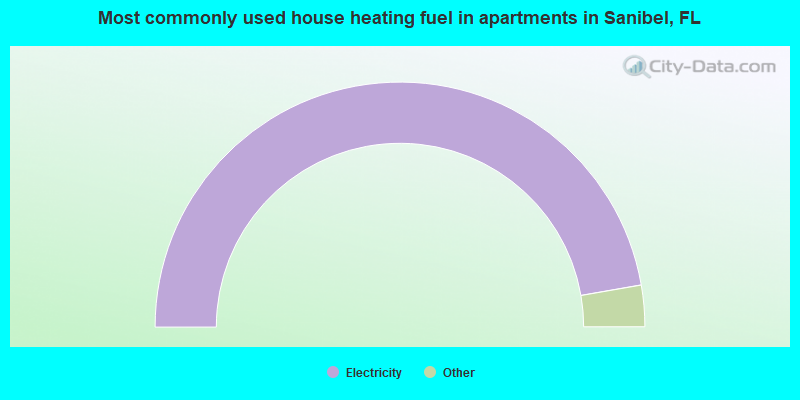
House heating fuel used in apartments - Electricity (%)
House heating fuel used in apartments - Fuel oil, kerosene, etc. (%)
House heating fuel used in apartments - Coal or coke (%)
House heating fuel used in apartments - Wood (%)
House heating fuel used in apartments - Solar energy (%)
House heating fuel used in apartments - Other fuel (%)
House heating fuel used in apartments - No fuel used (%)
Armed forces status - In Armed Forces (%)
Armed forces status - Civilian (%)
Armed forces status - Civilian - Veteran (%)
Armed forces status - Civilian - Nonveteran (%)
Fatal accidents locations in years 2005-2021
Fatal accidents locations in 2005
Fatal accidents locations in 2006
Fatal accidents locations in 2007
Fatal accidents locations in 2008
Fatal accidents locations in 2009
Fatal accidents locations in 2010
Fatal accidents locations in 2011
Fatal accidents locations in 2012
Fatal accidents locations in 2013
Fatal accidents locations in 2014
Fatal accidents locations in 2015
Fatal accidents locations in 2016
Fatal accidents locations in 2017
Fatal accidents locations in 2018
Fatal accidents locations in 2019
Fatal accidents locations in 2020
Fatal accidents locations in 2021
Alcohol use - People drinking some alcohol every month (%)
Alcohol use - People not drinking at all (%)
Alcohol use - Average days/month drinking alcohol
Alcohol use - Average drinks/week
Alcohol use - Average days/year people drink much
Audiometry - Average condition of hearing (%)
Audiometry - People that can hear a whisper from across a quiet room (%)
Audiometry - People that can hear normal voice from across a quiet room (%)
Audiometry - Ears ringing, roaring, buzzing (%)
Audiometry - Had a job exposure to loud noise (%)
Audiometry - Had off-work exposure to loud noise (%)
Blood Pressure & Cholesterol - Has high blood pressure (%)
Blood Pressure & Cholesterol - Checking blood pressure at home (%)
Blood Pressure & Cholesterol - Frequently checking blood cholesterol (%)
Blood Pressure & Cholesterol - Has high cholesterol level (%)
Consumer Behavior - Money monthly spent on food at supermarket/grocery store
Consumer Behavior - Money monthly spent on food at other stores
Consumer Behavior - Money monthly spent on eating out
Consumer Behavior - Money monthly spent on carryout/delivered foods
Consumer Behavior - Income spent on food at supermarket/grocery store (%)
Consumer Behavior - Income spent on food at other stores (%)
Consumer Behavior - Income spent on eating out (%)
Consumer Behavior - Income spent on carryout/delivered foods (%)
Current Health Status - General health condition (%)
Current Health Status - Blood donors (%)
Current Health Status - Has blood ever tested for HIV virus (%)
Current Health Status - Left-handed people (%)
Dermatology - People using sunscreen (%)
Diabetes - Diabetics (%)
Diabetes - Had a blood test for high blood sugar (%)
Diabetes - People taking insulin (%)
Diet Behavior & Nutrition - Diet health (%)
Diet Behavior & Nutrition - Milk product consumption (# of products/month)
Diet Behavior & Nutrition - Meals not home prepared (#/week)
Diet Behavior & Nutrition - Meals from fast food or pizza place (#/week)
Diet Behavior & Nutrition - Ready-to-eat foods (#/month)
Diet Behavior & Nutrition - Frozen meals/pizza (#/month)
Drug Use - People that ever used marijuana or hashish (%)
Drug Use - Ever used hard drugs (%)
Drug Use - Ever used any form of cocaine (%)
Drug Use - Ever used heroin (%)
Drug Use - Ever used methamphetamine (%)
Health Insurance - People covered by health insurance (%)
Kidney Conditions-Urology - Avg. # of times urinating at night
Medical Conditions - People with asthma (%)
Medical Conditions - People with anemia (%)
Medical Conditions - People with psoriasis (%)
Medical Conditions - People with overweight (%)
Medical Conditions - Elderly people having difficulties in thinking or remembering (%)
Medical Conditions - People who ever received blood transfusion (%)
Medical Conditions - People having trouble seeing even with glass/contacts (%)
Medical Conditions - People with arthritis (%)
Medical Conditions - People with gout (%)
Medical Conditions - People with congestive heart failure (%)
Medical Conditions - People with coronary heart disease (%)
Medical Conditions - People with angina pectoris (%)
Medical Conditions - People who ever had heart attack (%)
Medical Conditions - People who ever had stroke (%)
Medical Conditions - People with emphysema (%)
Medical Conditions - People with thyroid problem (%)
Medical Conditions - People with chronic bronchitis (%)
Medical Conditions - People with any liver condition (%)
Medical Conditions - People who ever had cancer or malignancy (%)
Mental Health - People who have little interest in doing things (%)
Mental Health - People feeling down, depressed, or hopeless (%)
Mental Health - People who have trouble sleeping or sleeping too much (%)
Mental Health - People feeling tired or having little energy (%)
Mental Health - People with poor appetite or overeating (%)
Mental Health - People feeling bad about themself (%)
Mental Health - People who have trouble concentrating on things (%)
Mental Health - People moving or speaking slowly or too fast (%)
Mental Health - People having thoughts they would be better off dead (%)
Oral Health - Average years since last visit a dentist
Oral Health - People embarrassed because of mouth (%)
Oral Health - People with gum disease (%)
Oral Health - General health of teeth and gums (%)
Oral Health - Average days a week using dental floss/device
Oral Health - Average days a week using mouthwash for dental problem
Oral Health - Average number of teeth
Pesticide Use - Households using pesticides to control insects (%)
Pesticide Use - Households using pesticides to kill weeds (%)
Physical Activity - People doing vigorous-intensity work activities (%)
Physical Activity - People doing moderate-intensity work activities (%)
Physical Activity - People walking or bicycling (%)
Physical Activity - People doing vigorous-intensity recreational activities (%)
Physical Activity - People doing moderate-intensity recreational activities (%)
Physical Activity - Average hours a day doing sedentary activities
Physical Activity - Average hours a day watching TV or videos
Physical Activity - Average hours a day using computer
Physical Functioning - People having limitations keeping them from working (%)
Physical Functioning - People limited in amount of work they can do (%)
Physical Functioning - People that need special equipment to walk (%)
Physical Functioning - People experiencing confusion/memory problems (%)
Physical Functioning - People requiring special healthcare equipment (%)
Prescription Medications - Average number of prescription medicines taking
Preventive Aspirin Use - Adults 40+ taking low-dose aspirin (%)
Reproductive Health - Vaginal deliveries (%)
Reproductive Health - Cesarean deliveries (%)
Reproductive Health - Deliveries resulted in a live birth (%)
Reproductive Health - Pregnancies resulted in a delivery (%)
Reproductive Health - Women breastfeeding newborns (%)
Reproductive Health - Women that had a hysterectomy (%)
Reproductive Health - Women that had both ovaries removed (%)
Reproductive Health - Women that have ever taken birth control pills (%)
Reproductive Health - Women taking birth control pills (%)
Reproductive Health - Women that have ever used Depo-Provera or injectables (%)
Reproductive Health - Women that have ever used female hormones (%)
Sexual Behavior - People 18+ that ever had sex (vaginal, anal, or oral) (%)
Sexual Behavior - Males 18+ that ever had vaginal sex with a woman (%)
Sexual Behavior - Males 18+ that ever performed oral sex on a woman (%)
Sexual Behavior - Males 18+ that ever had anal sex with a woman (%)
Sexual Behavior - Males 18+ that ever had any sex with a man (%)
Sexual Behavior - Females 18+ that ever had vaginal sex with a man (%)
Sexual Behavior - Females 18+ that ever performed oral sex on a man (%)
Sexual Behavior - Females 18+ that ever had anal sex with a man (%)
Sexual Behavior - Females 18+ that ever had any kind of sex with a woman (%)
Sexual Behavior - Average age people first had sex
Sexual Behavior - Average number of female sex partners in lifetime (males 18+)
Sexual Behavior - Average number of female vaginal sex partners in lifetime (males 18+)
Sexual Behavior - Average age people first performed oral sex on a woman (18+)
Sexual Behavior - Average number of woman performed oral sex on in lifetime (18+)
Sexual Behavior - Average number of male sex partners in lifetime (males 18+)
Sexual Behavior - Average number of male anal sex partners in lifetime (males 18+)
Sexual Behavior - Average age people first performed oral sex on a man (18+)
Sexual Behavior - Average number of male oral sex partners in lifetime (18+)
Sexual Behavior - People using protection when performing oral sex (%)
Sexual Behavior - Average number of times people have vaginal or anal sex a year
Sexual Behavior - People having sex without condom (%)
Sexual Behavior - Average number of male sex partners in lifetime (females 18+)
Sexual Behavior - Average number of male vaginal sex partners in lifetime (females 18+)
Sexual Behavior - Average number of female sex partners in lifetime (females 18+)
Sexual Behavior - Circumcised males 18+ (%)
Sleep Disorders - Average hours sleeping at night
Sleep Disorders - People that has trouble sleeping (%)
Smoking-Cigarette Use - People smoking cigarettes (%)
Taste & Smell - People 40+ having problems with smell (%)
Taste & Smell - People 40+ having problems with taste (%)
Taste & Smell - People 40+ that ever had wisdom teeth removed (%)
Taste & Smell - People 40+ that ever had tonsils teeth removed (%)
Taste & Smell - People 40+ that ever had a loss of consciousness because of a head injury (%)
Taste & Smell - People 40+ that ever had a broken nose or other serious injury to face or skull (%)
Taste & Smell - People 40+ that ever had two or more sinus infections (%)
Weight - Average height (inches)
Weight - Average weight (pounds)
Weight - Average BMI
Weight - People that are obese (%)
Weight - People that ever were obese (%)
Weight - People trying to lose weight (%)
According to our research of Florida and other state lists, there was 1 registered sex offender living in Sanibel, Florida as of April 25, 2024 . The ratio of all residents to sex offenders in Sanibel is 7,471 to 1.The ratio of registered sex offenders to all residents in this city is much lower than the state average.
Officers per 1,000 residents here:
3.32Florida average:
2.33
Latest news from Sanibel, FL collected exclusively by city-data.com from local newspapers, TV, and radio stations
Ancestries: American (27.8%), Irish (12.7%), English (11.7%), German (9.8%), Italian (5.7%), European (4.1%).
Current Local Time:
Land area: 17.2 square miles.
Population density: 377 people per square mile (very low).
350 residents are foreign born (2.9% Europe , 0.8% Asia , 0.8% North America , 0.6% Latin America ).
This city:
5.1%Florida:
21.1%
Median real estate property taxes paid for housing units with mortgages in 2022: $6,937 (0.8%)Median real estate property taxes paid for housing units with no mortgage in 2022: $10,016 (0.8%)
Nearest city with pop. 50,000+: Cape Coral, FL
Nearest city with pop. 200,000+: St. Petersburg, FL
Nearest city with pop. 1,000,000+: Houston, TX
Nearest cities:
Latitude: 26.44 N, Longitude: 82.08 W
Daytime population change due to commuting: +3,307 (+48.4%)Workers who live and work in this city: 1,650 (79.0%)
Area code commonly used in this area: 239
Property values in Sanibel, FL
Sanibel tourist attractions:
Single-family new house construction building permits:
2022: 20 buildings , average cost: $1,224,4002021: 12 buildings , average cost: $1,183,4002020: 18 buildings , average cost: $1,007,7002019: 17 buildings , average cost: $673,2002018: 23 buildings , average cost: $826,0002017: 27 buildings , average cost: $824,1002016: 29 buildings , average cost: $727,2002015: 30 buildings , average cost: $768,1002014: 21 buildings , average cost: $623,2002013: 18 buildings , average cost: $704,3002012: 22 buildings , average cost: $653,7002011: 16 buildings , average cost: $677,7002010: 16 buildings , average cost: $685,1002009: 13 buildings , average cost: $542,4002008: 13 buildings , average cost: $924,4002007: 13 buildings , average cost: $843,1002006: 16 buildings , average cost: $746,8002005: 23 buildings , average cost: $974,0002004: 49 buildings , average cost: $491,2002003: 40 buildings , average cost: $482,7002002: 47 buildings , average cost: $583,3002001: 107 buildings , average cost: $384,6002000: 105 buildings , average cost: $362,1001999: 74 buildings , average cost: $319,2001998: 70 buildings , average cost: $337,0001997: 48 buildings , average cost: $309,700Unemployment in December 2023: Population change in the 1990s: +544 (+9.9%).
Most common industries in Sanibel, FL (%)
Both Males Females
Accommodation & food services (18.5%)
Real estate & rental & leasing (10.0%)
Professional, scientific, technical services (9.5%)
Construction (7.4%)
Public administration (4.1%)
Health care (3.7%)
Finance & insurance (3.5%)
Accommodation & food services (18.8%)
Construction (11.7%)
Professional, scientific, technical services (11.2%)
Real estate & rental & leasing (6.5%)
Public administration (6.4%)
Finance & insurance (5.4%)
Food & beverage stores (2.7%)
Accommodation & food services (18.0%)
Real estate & rental & leasing (14.5%)
Professional, scientific, technical services (7.4%)
Educational services (6.6%)
Health care (6.0%)
Other direct selling establishments (4.8%)
Used merchandise, gift, novelty, souvenir, other miscellaneous stores (4.6%)
Most common occupations in Sanibel, FL (%)
Both Males Females
Other management occupations, except farmers and farm managers (14.1%)
Other sales and related occupations, including supervisors (11.9%)
Top executives (6.1%)
Retail sales workers, except cashiers (3.4%)
Sales representatives, services, wholesale and manufacturing (3.2%)
Building and grounds cleaning and maintenance occupations (3.2%)
Waiters and waitresses (3.1%)
Other management occupations, except farmers and farm managers (16.8%)
Other sales and related occupations, including supervisors (8.8%)
Top executives (6.6%)
Other financial specialists (3.9%)
Sales representatives, services, wholesale and manufacturing (3.4%)
Driver/sales workers and truck drivers (3.2%)
Lawyers (3.1%)
Other sales and related occupations, including supervisors (15.8%)
Other management occupations, except farmers and farm managers (10.6%)
Retail sales workers, except cashiers (6.9%)
Top executives (5.5%)
Art and design workers (5.1%)
Secretaries and administrative assistants (4.4%)
Preschool, kindergarten, elementary, and middle school teachers (4.3%)
Tornado activity:
Sanibel-area historical tornado activity is below Florida state average. It is 40% smaller than the overall U.S. average.
On 10/31/1960, a category F2 (max. wind speeds 113-157 mph) tornado 2.0 miles away from the Sanibel city center killed one person and caused between $500 and $5000 in damages.
On 6/18/1972, a category F2 tornado 2.5 miles away from the city center caused between $5000 and $50,000 in damages.
Earthquake activity:
Sanibel-area historical earthquake activity is above Florida state average. It is 93% smaller than the overall U.S. average. On 9/10/2006 at 14:56:08, a magnitude 5.9 (5.9 MB, 5.5 MS, 5.8 MW, Class: Moderate, Intensity: VI - VII) earthquake occurred 282.3 miles away from the city center On 3/31/1992 at 14:59:39, a magnitude 3.8 (3.8 MB, Depth: 3.1 mi, Class: Light, Intensity: II - III) earthquake occurred 228.4 miles away from the city center On 4/18/1997 at 14:57:35, a magnitude 3.9 (3.9 MB, Depth: 20.5 mi) earthquake occurred 281.4 miles away from Sanibel center On 10/24/1997 at 08:35:17, a magnitude 4.9 (4.8 MB, 4.2 MS, 4.9 LG, Depth: 6.2 mi, Class: Light, Intensity: IV - V) earthquake occurred 451.5 miles away from the city center On 5/6/2018 at 16:47:09, a magnitude 4.6 (4.6 MB, Depth: 6.2 mi) earthquake occurred 417.9 miles away from the city center On 6/23/2016 at 17:20:29, a magnitude 3.8 (3.8 ML) earthquake occurred 293.6 miles away from Sanibel center Magnitude types: regional Lg-wave magnitude (LG), body-wave magnitude (MB), local magnitude (ML), surface-wave magnitude (MS), moment magnitude (MW) Natural disasters: The number of natural disasters in Lee County (23) is greater than the US average (15).Major Disasters (Presidential) Declared: 13Emergencies Declared: 5Hurricanes: 11, Tropical Storms: 6, Fires: 5, Freeze: 1, Other: 1 (Note: some incidents may be assigned to more than one category). Hospitals and medical centers near Sanibel: SHELL POINT NURSING PAVILION (Nursing Home, about 8 miles away; FORT MYERS, FL)
BMA - SOUTH FT MYERS (Dialysis Facility, about 12 miles away; FORT MYERS, FL)
LODGE AT CYPRESS COVE, THE (Nursing Home, about 12 miles away; FORT MYERS, FL)
HEALTHPARK CARE CENTER, INC (Nursing Home, about 12 miles away; FORT MYERS, FL)
FORT MYERS SOUTH DIALYSIS (Dialysis Facility, about 13 miles away; FORT MYERS, FL)
INNOVATIVE SENIOR CARE HOME HEALTH OF TAMPA LLC (Home Health Center, about 14 miles away; FORT MYERS, FL)
CAPE CORAL SOUTH DIALYSIS (Dialysis Facility, about 14 miles away; CAPE CORAL, FL)
Colleges/universities with over 2000 students nearest to Sanibel:
Edison State College (about 15 miles; Fort Myers, FL ; Full-time enrollment: 10,649)
Florida Gulf Coast University (about 20 miles; Fort Myers, FL ; FT enrollment: 11,165)
Hodges University (about 24 miles; Naples, FL ; FT enrollment: 2,132)
State College of Florida-Manatee-Sarasota (about 76 miles; Bradenton, FL ; FT enrollment: 8,012)
Eckerd College (about 97 miles; Saint Petersburg, FL ; FT enrollment: 2,437)
University of South Florida-St Petersburg (about 98 miles; St. Petersburg, FL ; FT enrollment: 4,459)
Hillsborough Community College (about 106 miles; Tampa, FL ; FT enrollment: 19,838)
Public elementary/middle school in Sanibel:
See full list of schools located in Sanibel Library in Sanibel: SANIBEL PUBLIC LIBRARY Operating income: $2,369,812; Location: 770 DUNLOP ROAD; 97,254 books ; 5,230 audio materials ; 5,316 video materials ; 22 local licensed databases ; 62 state licensed databases ; 267 print serial subscriptions ; 2 electronic serial subscriptions )
Notable locations in Sanibel: (A) , Baileys Center (B) , Sanibel Fire and Rescue District Station 1 (C) , Sanibel Fire and Rescue District Station 2 (D) , Lee County Emergency Medical Services (E) , Sanibel Police Department (F) . Display/hide their locations on the map
Shopping Centers: (1) , Tahitian Garden Shopping Center (2) . Display/hide their locations on the map
Churches in Sanibel include: (A) , Sanibel Community Church (B) , First Baptist Church Sanibel (C) , Sanibel Congregational United Church of Christ (D) . Display/hide their locations on the map
Cemetery: (1) . Display/hide its location on the map
Lakes: (A) , Old Blind Pass (B) , Clam Bayou (C) , Ladyfinger Lake (D) , Dinken Bayou (E) , Sanibel Bayou (F) . Display/hide their locations on the map
Beach: (A) . Display/hide its location on the map
Tourist attractions: (1) , Conservation Center (Nature Centers; 3333 Sanibel Captiva Road) (2) , Clinic for the Rehabilitation of Wildlife (Recreation Areas; 3883 Sanibel Captiva Road) (3) , Cottages to Castles of Sanibel and Captiva Islands (2427 Periwinkle Way) (4) , Adventures in Paradise (Tours & Charters; 14341 Port Comfort Road) (5) . Display/hide their approximate locations on the map
Hotels: (1) , Anchor Inn of Sanibel Island (1245 Periwinkle Way) (2) , Captiva Island Inn Bed & Breakfast (11509 Andy Rosse Lane) (3) , Blue Dolphin Beach Cottages (4227 West Gulf Drive) (4) , Beach Road Inn (764 Beach Road) (5) , A Team (1539 Periwinkle Way) (6) , Colony Resort (419 East Gulf Drive) (7) . Display/hide their approximate locations on the map
Lee County has a predicted average indoor radon screening level less than 2 pCi/L (pico curies per liter) - Low Potential Average household size: This city:
1.9 peopleFlorida:
2.5 people
Percentage of family households: This city:
67.7%Whole state:
65.2%
Percentage of households with unmarried partners: This city:
3.6%Whole state:
7.3%
Likely homosexual households (counted as self-reported same-sex unmarried-partner households)
Lesbian couples: 0.5% of all households Gay men: 0.4% of all households
5 people in college/university student housing in 2010
Banks with branches in Sanibel (2011 data):
Sanibel Captiva Community Bank: at 2475 Library Way, branch established on 2003/01/21; Periwinkle Branch at 1037 Periwinkle Way, branch established on 2004/11/08. Info updated 2006/11/03: Bank assets: $224.8 mil, Deposits: $178.1 mil, local headquarters , positive income , Commercial Lending Specialization, 3 total offices
Wells Fargo Bank, National Association: Sanibel Island Branch at 2407 Palm Ridge Road, branch established on 1934/09/01. Info updated 2011/04/05: Bank assets: $1,161,490.0 mil, Deposits: $905,653.0 mil, headquarters in Sioux Falls, SD, positive income , 6395 total offices , Holding Company: Wells Fargo & Company
Bank of America, National Association: Sanibel Main Branch at 2450 Periwinkle Way, branch established on 1988/02/04. Info updated 2009/11/18: Bank assets: $1,451,969.3 mil, Deposits: $1,077,176.8 mil, headquarters in Charlotte, NC, positive income , 5782 total offices , Holding Company: Bank Of America Corporation
For population 15 years and over in Sanibel:
Never married: 7.3%Now married: 75.9%Separated: 0.8%Widowed: 9.5%Divorced: 6.5% For population 25 years and over in Sanibel:
High school or higher: 99.4%Bachelor's degree or higher: 59.2%Graduate or professional degree: 28.1%Unemployed: 2.5%Mean travel time to work (commute): 12.0 minutes
Education Gini index (Inequality in education) Here:
9.1Florida average:
12.2
Religion statistics for Sanibel, FL (based on Lee County data)
Religion Adherents Congregations Catholic 100,300 20 Evangelical Protestant 88,687 288 Mainline Protestant 28,605 62 Other 12,684 45 Black Protestant 1,919 11 Orthodox 970 4 None 385,589 -
Source: Clifford Grammich, Kirk Hadaway, Richard Houseal, Dale E.Jones, Alexei Krindatch, Richie Stanley and Richard H.Taylor. 2012. 2010 U.S.Religion Census: Religious Congregations & Membership Study. Association of Statisticians of American Religious Bodies. Jones, Dale E., et al. 2002. Congregations and Membership in the United States 2000. Nashville, TN: Glenmary Research Center. Graphs represent county-level data
Food Environment Statistics: Number of grocery stores : 115Lee County :
1.96 / 10,000 pop.Florida :
2.04 / 10,000 pop.
Number of supercenters and club stores : 11This county :
0.19 / 10,000 pop.State :
0.11 / 10,000 pop.
Number of convenience stores (no gas) : 50Lee County :
0.85 / 10,000 pop.Florida :
1.28 / 10,000 pop.
Number of convenience stores (with gas) : 167Here :
2.84 / 10,000 pop.Florida :
3.04 / 10,000 pop.
Number of full-service restaurants : 508Here :
8.64 / 10,000 pop.Florida :
7.45 / 10,000 pop.
Adult diabetes rate : This county :
10.1%State :
9.2%
Adult obesity rate : This county :
24.9%Florida :
23.7%
Low-income preschool obesity rate : This county :
15.4%Florida :
14.0%
Health and Nutrition: Healthy diet rate : Sanibel:
61.5%Florida:
51.4%
Average overall health of teeth and gums : People feeling badly about themselves : Average hours sleeping at night : General health condition : Average condition of hearing : More about Health and Nutrition of Sanibel, FL Residents
Local government employment and payroll (March 2022)
Function
Full-time employees
Monthly full-time payroll
Average yearly full-time wage
Part-time employees
Monthly part-time payroll
Streets and Highways
31 $282,644 $109,411 0 $0 Police Protection - Officers
26 $220,214 $101,637 0 $0 Other Government Administration
18 $106,107 $70,738 0 $0 Financial Administration
15 $106,822 $85,458 0 $0 Sewerage
14 $90,434 $77,515 1 $2,936 Police - Other
13 $61,228 $56,518 14 $24,150 Parks and Recreation
10 $46,817 $56,180 13 $23,712 Natural Resources
5 $31,142 $74,741 0 $0 Other and Unallocable
5 $23,360 $56,064 0 $0
Totals for Government
137 $968,768 $84,856 28 $50,798
Sanibel government finances - Expenditure in 2017 (per resident):
Construction - Regular Highways: $164,000 ($25.30)
Current Operations - Sewerage: $6,537,000 ($1008.49)
Regular Highways: $4,405,000 ($679.57)Parking Facilities: $4,131,000 ($637.30)Police Protection: $4,067,000 ($627.43)Parks and Recreation: $3,452,000 ($532.55)Central Staff Services: $3,217,000 ($496.30)Housing and Community Development: $1,827,000 ($281.86)General - Other: $1,092,000 ($168.47)Financial Administration: $995,000 ($153.50)Protective Inspection and Regulation - Other: $765,000 ($118.02)Judicial and Legal Services: $555,000 ($85.62)Natural Resources - Other: $505,000 ($77.91)Solid Waste Management: $52,000 ($8.02)Health - Other: $25,000 ($3.86)General - Interest on Debt: $884,000 ($136.38)
Other Capital Outlay - Police Protection: $84,000 ($12.96)
Parks and Recreation: $37,000 ($5.71)Central Staff Services: $20,000 ($3.09)Financial Administration: $2,000 ($0.31)
Sanibel government finances - Revenue in 2017 (per resident):
Charges - Sewerage: $6,609,000 ($1019.59)
Parking Facilities: $2,817,000 ($434.59)Other: $2,167,000 ($334.31)Parks and Recreation: $714,000 ($110.15)Housing and Community Development: $637,000 ($98.27)Solid Waste Management: $220,000 ($33.94)Natural Resources - Other: $3,000 ($0.46)Federal Intergovernmental - Other: $20,000 ($3.09)
General Local Government Support: $11,000 ($1.70)Local Intergovernmental - Highways: $3,355,000 ($517.59)
Other: $865,000 ($133.45)General Local Government Support: $27,000 ($4.17)Miscellaneous - Interest Earnings: $431,000 ($66.49)
Special Assessments: $264,000 ($40.73)Fines and Forfeits: $244,000 ($37.64)General Revenue - Other: $226,000 ($34.87)Rents: $140,000 ($21.60)Sale of Property: $78,000 ($12.03)Donations From Private Sources: $30,000 ($4.63)State Intergovernmental - General Local Government Support: $750,000 ($115.71)
Highways: $6,000 ($0.93)Tax - Property: $10,046,000 ($1549.83)
Motor Fuels Sales: $1,754,000 ($270.60)Occupation and Business License - Other: $1,238,000 ($190.99)Other License: $975,000 ($150.42)Public Utilities Sales: $538,000 ($83.00)Other Selective Sales: $170,000 ($26.23)
Sanibel government finances - Debt in 2017 (per resident):
Long Term Debt - Beginning Outstanding - Unspecified Public Purpose: $26,813,000 ($4136.53)
Outstanding Unspecified Public Purpose: $23,490,000 ($3623.88)Retired Unspecified Public Purpose: $7,904,000 ($1219.38)Issue, Unspecified Public Purpose: $6,515,000 ($1005.09)
Sanibel government finances - Cash and Securities in 2017 (per resident):
Bond Funds - Cash and Securities: $2,379,000 ($367.02)
Other Funds - Cash and Securities: $9,573,000 ($1476.86)
Sinking Funds - Cash and Securities: $292,000 ($45.05)
10.20% of this county's 2021 resident taxpayers lived in other counties in 2020 ($122,429 average adjusted gross income )
Here:
10.20%Florida average:
8.80%
0.02% of residents moved from foreign countries ($105 average AGI )Lee County:
0.02%Florida average:
0.05%
Top counties from which taxpayers relocated into this county between 2020 and 2021:
6.43% of this county's 2020 resident taxpayers moved to other counties in 2021 ($74,267 average adjusted gross income )
Here:
6.43%Florida average:
7.45%
0.02% of residents moved to foreign countries ($109 average AGI )Lee County:
0.02%Florida average:
0.04%
Top counties to which taxpayers relocated from this county between 2020 and 2021:
Businesses in Sanibel, FL
Name Count Name Count
7-Eleven 2 FedEx 5 Ace Hardware 1 Holiday Inn 1 CVS 1 MasterBrand Cabinets 1 Chico's 1 True Value 1 Dairy Queen 1 UPS 5 Dunkin Donuts 1
Strongest AM radio stations in Sanibel:
WPTK (1200 AM; 10 kW; PINE ISLAND CENTER, FL; Owner: FORT MYERS BROADCASTING COMPANY)
WWCN (770 AM; 10 kW; NORTH FORT MYERS, FL; Owner: WJPT LICENSE LIMITED PARTNERSHIP)
WMYR (1410 AM; 5 kW; FORT MYERS, FL; Owner: KATHLEEN HECKSHER)
WJNA (640 AM; 38 kW; ROYAL PALM BEACH, FL; Owner: SOUTH FLORIDA RADIO, INC.)
WWFE (670 AM; 50 kW; MIAMI, FL; Owner: FENIX BROADCASTING CORP.)
WAQI (710 AM; 50 kW; MIAMI, FL; Owner: LICENSE CORPORATION #1)
WNOG (1270 AM; 5 kW; NAPLES, FL; Owner: MERIDIAN BROADCASTING, INC.)
WMGG (820 AM; 50 kW; LARGO, FL; Owner: MEGA COMMUNICATIONS OF ST. PETERSBURG LICENSEE)
WFLF (540 AM; 50 kW; PINE HILLS, FL; Owner: CLEAR CHANNEL BROADCASTING LICENSES, INC.)
WQYK (1010 AM; 50 kW; SEFFNER, FL; Owner: INFINITY BROADCASTING CORPORATION OF TAMPA)
WVCG (1080 AM; 50 kW; CORAL GABLES, FL; Owner: RADIO ONE LICENSES, LLC)
WVOI (1480 AM; 10 kW; MARCO ISLAND, FL; Owner: ALL FINANCIAL NETWORK, INC.)
WCRM (1350 AM; 2 kW; FORT MYERS, FL; Owner: MANNA CHRISTIAN MISSIONS, INC.)
Strongest FM radio stations in Sanibel:
WRXK-FM (96.1 FM; BONITA SPRINGS, FL; Owner: WRXK LICENSE LIMITED PARTNERSHIP)
WXKB (103.9 FM; CAPE CORAL, FL; Owner: WXKB LICENSE LIMITED PARTNERSHIP)
WTLQ-FM (97.7 FM; PUNTA RASSA, FL; Owner: FORT MYERS BROADCASTING COMPANY)
WWGR (101.9 FM; FORT MYERS, FL; Owner: RENDA BROADCASTING CORP. OF NEVADA)
WINK-FM (96.9 FM; FORT MYERS, FL; Owner: FORT MYERS BROADCASTING COMPANY)
WARO (94.5 FM; NAPLES, FL; Owner: MERIDIAN BROADCASTING, INC.)
WJGO (102.9 FM; TICE, FL; Owner: RENDA BROADCASTING CORPORATION OF NEVADA)
WNRW (98.5 FM; SAN CARLOS PARK, FL; Owner: BEL MEADE BROADCASTING COMPANY, INC.)
WSOR (90.9 FM; NAPLES, FL; Owner: THE MOODY BIBLE INSTITUTE OF CHICAGO)
WBTT (105.5 FM; NAPLES PARK, FL; Owner: CLEAR CHANNEL BROADCASTING LICENSES, INC.)
WDRR (107.1 FM; LEHIGH ACRES, FL; Owner: CLEAR CHANNEL BROADCASTING LICENSES, INC.)
WJBX (99.3 FM; FORT MYERS BEACH, FL; Owner: WJBX LICENSE LIMITED PARTNERSHIP)
WJPT (106.3 FM; FORT MYERS, FL; Owner: WJPT LICENSE LIMITED PARTNERSHIP)
WOLZ (95.3 FM; FORT MYERS, FL; Owner: CLEAR CHANNEL BROADCASTING LICENSES, INC.)
WCKT (100.1 FM; PORT CHARLOTTE, FL; Owner: CLEAR CHANNEL BROADCASTING LICENSES, INC.)
WAVV (101.1 FM; MARCO, FL; Owner: ALPINE BROADCASTING CORP., INC.)
WIKX (92.9 FM; CHARLOTTE HARBOR, FL; Owner: CITICASTERS LICENSES, L.P.)
WJYO (91.5 FM; FORT MYERS, FL; Owner: TOCCOA FALLS COLLEGE)
WGCU-FM (90.1 FM; FT. MYERS, FL; Owner: BOARD OF TRUSTEES, FLORIDA GULF COAST UNIVERSITY)
WAYJ (88.7 FM; FORT MYERS, FL; Owner: WAY-FM MEDIA GROUP. INC.)
TV broadcast stations around Sanibel:
WINK-TV (Channel 11; FORT MYERS, FL; Owner: FORT MYERS BROADCASTING COMPANY)
WZVN-TV (Channel 26; NAPLES, FL; Owner: MONTCLAIR COMMUNICATIONS, INC.)
WTIG-LP (Channel 2; NAPLES, FL; Owner: TIGER EYE BROADCASTING CORPORATION)
WTVK (Channel 46; NAPLES, FL; Owner: ACME TELEVISION LICENSES OF FLORIDA, LLC)
WFTX (Channel 36; CAPE CORAL, FL; Owner: EMMIS TELEVISION LICENSE CORPORATION)
WRXY-TV (Channel 49; TICE, FL; Owner: WEST COAST CHRISTIAN TELEVISION, INC)
WBBH-TV (Channel 20; FORT MYERS, FL; Owner: WATERMAN BROADCASTING CORP. OF FLORIDA)
W22CL (Channel 22; FORT MYERS, FL; Owner: ARKANSAS MEDIA, LLC)
WDPX-LP (Channel 18; FORT MYERS, FL; Owner: TIGER EYE BROADCASTING CORP.)
WGCU (Channel 30; FT. MYERS, FL; Owner: BOARD OF TRUSTEES, FLORIDA GULF COAST UNIVERSITY)
WVEA-TV (Channel 62; VENICE, FL; Owner: ENTRAVISION HOLDINGS, LLC)
WLZE-LP (Channel 65; FORT MYERS, FL; Owner: TIGER EYE BROADCASTING CORPORATION)
WTPH-LP (Channel 14; FORT MYERS, FL; Owner: TRI-MEDIA GROUP, INC.)
WEVU-CA (Channel 4; FORT MYERS, FL; Owner: CALOOSA TELEVISION CORPORATION)
W56DW (Channel 56; NAPLES, FL; Owner: TRINITY BROADCASTING NETWORK)
W38CO (Channel 38; FORT MYERS, FL; Owner: TRINITY BROADCASTING NETWORK)
Home Mortgage Disclosure Act Aggregated Statistics For Year 2009(Based on 2 full tracts) A) FHA, FSA/RHS & VA B) Conventional C) Refinancings D) Home Improvement Loans F) Non-occupant Loans on G) Loans On Manufactured Number Average Value Number Average Value Number Average Value Number Average Value Number Average Value Number Average Value
LOANS ORIGINATED 0 $0 114 $417,596 217 $347,419 9 $257,222 185 $382,551 1 $20,000 APPLICATIONS APPROVED, NOT ACCEPTED 0 $0 9 $381,000 36 $369,167 0 $0 23 $330,478 0 $0 APPLICATIONS DENIED 0 $0 17 $453,941 117 $351,615 0 $0 77 $334,377 0 $0 APPLICATIONS WITHDRAWN 1 $344,000 13 $525,077 48 $368,688 2 $278,500 30 $347,833 0 $0 FILES CLOSED FOR INCOMPLETENESS 0 $0 0 $0 12 $511,333 1 $100,000 6 $377,333 0 $0
Aggregated Statistics For Year 2008(Based on 2 full tracts) A) FHA, FSA/RHS & VA B) Conventional C) Refinancings D) Home Improvement Loans E) Loans on Dwellings For 5+ Families F) Non-occupant Loans on Number Average Value Number Average Value Number Average Value Number Average Value Number Average Value Number Average Value
LOANS ORIGINATED 1 $362,000 139 $488,835 123 $463,098 8 $128,125 2 $507,500 168 $474,393 APPLICATIONS APPROVED, NOT ACCEPTED 0 $0 14 $479,286 19 $308,579 5 $221,000 0 $0 19 $329,211 APPLICATIONS DENIED 0 $0 27 $408,519 53 $634,415 4 $405,000 0 $0 38 $382,842 APPLICATIONS WITHDRAWN 0 $0 6 $252,333 25 $541,120 0 $0 0 $0 15 $424,800 FILES CLOSED FOR INCOMPLETENESS 0 $0 1 $223,000 7 $267,571 1 $417,000 0 $0 6 $283,500
Aggregated Statistics For Year 2007(Based on 2 full tracts) B) Conventional C) Refinancings D) Home Improvement Loans E) Loans on Dwellings For 5+ Families F) Non-occupant Loans on Number Average Value Number Average Value Number Average Value Number Average Value Number Average Value
LOANS ORIGINATED 170 $582,524 179 $492,430 12 $375,750 1 $152,000 232 $518,022 APPLICATIONS APPROVED, NOT ACCEPTED 15 $524,933 42 $510,190 4 $1,127,500 0 $0 39 $447,410 APPLICATIONS DENIED 30 $643,767 78 $753,321 5 $867,600 0 $0 57 $664,667 APPLICATIONS WITHDRAWN 12 $713,083 23 $459,391 2 $225,000 0 $0 22 $619,227 FILES CLOSED FOR INCOMPLETENESS 3 $618,667 13 $841,923 0 $0 0 $0 7 $657,286
Aggregated Statistics For Year 2006(Based on 2 full tracts) B) Conventional C) Refinancings D) Home Improvement Loans E) Loans on Dwellings For 5+ Families F) Non-occupant Loans on G) Loans On Manufactured Number Average Value Number Average Value Number Average Value Number Average Value Number Average Value Number Average Value
LOANS ORIGINATED 242 $559,004 218 $540,794 15 $325,467 2 $96,000 275 $516,938 0 $0 APPLICATIONS APPROVED, NOT ACCEPTED 17 $521,706 31 $455,387 1 $600,000 0 $0 24 $475,333 1 $44,000 APPLICATIONS DENIED 45 $542,556 59 $639,186 5 $164,000 0 $0 47 $487,426 1 $150,000 APPLICATIONS WITHDRAWN 19 $534,105 46 $537,739 0 $0 0 $0 30 $595,900 0 $0 FILES CLOSED FOR INCOMPLETENESS 4 $686,000 9 $365,889 0 $0 0 $0 6 $383,667 0 $0
Aggregated Statistics For Year 2005(Based on 2 full tracts) B) Conventional C) Refinancings D) Home Improvement Loans E) Loans on Dwellings For 5+ Families F) Non-occupant Loans on Number Average Value Number Average Value Number Average Value Number Average Value Number Average Value
LOANS ORIGINATED 397 $557,393 217 $424,138 21 $214,810 1 $365,000 432 $486,803 APPLICATIONS APPROVED, NOT ACCEPTED 28 $533,321 29 $361,931 2 $86,000 0 $0 34 $423,618 APPLICATIONS DENIED 48 $491,292 68 $500,529 8 $249,875 0 $0 57 $399,737 APPLICATIONS WITHDRAWN 37 $543,703 37 $319,946 0 $0 0 $0 37 $444,378 FILES CLOSED FOR INCOMPLETENESS 5 $713,400 32 $386,625 0 $0 0 $0 9 $420,222
Aggregated Statistics For Year 2004(Based on 2 full tracts) B) Conventional C) Refinancings D) Home Improvement Loans E) Loans on Dwellings For 5+ Families F) Non-occupant Loans on G) Loans On Manufactured Number Average Value Number Average Value Number Average Value Number Average Value Number Average Value Number Average Value
LOANS ORIGINATED 335 $462,069 261 $372,701 22 $237,864 2 $55,000 394 $430,079 0 $0 APPLICATIONS APPROVED, NOT ACCEPTED 26 $512,385 31 $369,903 3 $51,000 0 $0 31 $497,516 0 $0 APPLICATIONS DENIED 45 $501,644 50 $446,600 7 $406,571 0 $0 48 $379,750 1 $93,000 APPLICATIONS WITHDRAWN 22 $522,000 51 $452,549 3 $303,333 0 $0 35 $416,629 0 $0 FILES CLOSED FOR INCOMPLETENESS 3 $305,000 20 $411,850 0 $0 0 $0 5 $335,600 0 $0
Aggregated Statistics For Year 2003(Based on 2 full tracts) B) Conventional C) Refinancings D) Home Improvement Loans F) Non-occupant Loans on Number Average Value Number Average Value Number Average Value Number Average Value
LOANS ORIGINATED 324 $407,410 812 $313,037 19 $139,737 687 $344,061 APPLICATIONS APPROVED, NOT ACCEPTED 16 $442,750 71 $297,606 2 $200,000 47 $352,383 APPLICATIONS DENIED 22 $493,591 84 $345,905 11 $116,818 57 $355,860 APPLICATIONS WITHDRAWN 23 $519,391 65 $334,769 1 $49,000 38 $335,053 FILES CLOSED FOR INCOMPLETENESS 6 $648,667 18 $420,167 0 $0 6 $195,000
Aggregated Statistics For Year 2002(Based on 2 full tracts) B) Conventional C) Refinancings D) Home Improvement Loans F) Non-occupant Loans on Number Average Value Number Average Value Number Average Value Number Average Value
LOANS ORIGINATED 344 $381,253 599 $307,165 18 $134,611 577 $332,303 APPLICATIONS APPROVED, NOT ACCEPTED 21 $467,571 69 $383,043 3 $65,000 37 $354,459 APPLICATIONS DENIED 22 $393,136 64 $371,750 12 $157,917 36 $373,250 APPLICATIONS WITHDRAWN 26 $547,577 69 $374,725 1 $30,000 39 $344,359 FILES CLOSED FOR INCOMPLETENESS 2 $292,000 22 $446,318 1 $30,000 10 $455,200
Aggregated Statistics For Year 2001(Based on 2 full tracts) B) Conventional C) Refinancings D) Home Improvement Loans F) Non-occupant Loans on Number Average Value Number Average Value Number Average Value Number Average Value
LOANS ORIGINATED 311 $365,920 394 $289,563 35 $136,171 407 $325,197 APPLICATIONS APPROVED, NOT ACCEPTED 33 $383,515 32 $254,688 7 $86,286 36 $347,306 APPLICATIONS DENIED 40 $429,475 70 $375,071 10 $123,900 46 $377,609 APPLICATIONS WITHDRAWN 18 $520,667 36 $282,194 0 $0 18 $564,611 FILES CLOSED FOR INCOMPLETENESS 8 $334,375 13 $229,154 1 $30,000 7 $363,857
Aggregated Statistics For Year 2000(Based on 2 full tracts) A) FHA, FSA/RHS & VA B) Conventional C) Refinancings D) Home Improvement Loans F) Non-occupant Loans on Number Average Value Number Average Value Number Average Value Number Average Value Number Average Value
LOANS ORIGINATED 1 $141,000 375 $348,637 93 $311,247 14 $50,000 312 $338,196 APPLICATIONS APPROVED, NOT ACCEPTED 0 $0 29 $405,931 13 $215,769 6 $81,167 30 $342,067 APPLICATIONS DENIED 0 $0 46 $317,870 35 $390,343 3 $51,333 40 $307,550 APPLICATIONS WITHDRAWN 0 $0 20 $400,200 29 $228,586 0 $0 18 $317,611 FILES CLOSED FOR INCOMPLETENESS 0 $0 4 $563,000 10 $225,900 0 $0 4 $563,000
Aggregated Statistics For Year 1999(Based on 2 full tracts) A) FHA, FSA/RHS & VA B) Conventional C) Refinancings D) Home Improvement Loans F) Non-occupant Loans on Number Average Value Number Average Value Number Average Value Number Average Value Number Average Value
LOANS ORIGINATED 0 $0 413 $303,804 188 $220,394 7 $37,090 370 $287,333 APPLICATIONS APPROVED, NOT ACCEPTED 0 $0 33 $344,645 36 $239,831 2 $30,555 27 $310,478 APPLICATIONS DENIED 0 $0 37 $283,309 59 $249,159 2 $254,610 30 $255,492 APPLICATIONS WITHDRAWN 1 $94,970 26 $420,118 27 $184,669 1 $93,640 23 $340,362 FILES CLOSED FOR INCOMPLETENESS 0 $0 5 $163,104 12 $130,375 1 $70,990 5 $144,364
Detailed HMDA statistics for the following Tracts:
0802.01
, 0802.02
Private Mortgage Insurance Companies Aggregated Statistics For Year 2009(Based on 1 full tract) B) Refinancings C) Non-occupant Loans on Number Average Value Number Average Value
LOANS ORIGINATED 0 $0 0 $0 APPLICATIONS APPROVED, NOT ACCEPTED 0 $0 0 $0 APPLICATIONS DENIED 1 $379,000 1 $379,000 APPLICATIONS WITHDRAWN 0 $0 0 $0 FILES CLOSED FOR INCOMPLETENESS 0 $0 0 $0
Aggregated Statistics For Year 2008(Based on 2 full tracts) A) Conventional B) Refinancings C) Non-occupant Loans on Number Average Value Number Average Value Number Average Value
LOANS ORIGINATED 5 $379,000 0 $0 4 $393,750 APPLICATIONS APPROVED, NOT ACCEPTED 1 $542,000 1 $758,000 2 $650,000 APPLICATIONS DENIED 1 $206,000 0 $0 1 $206,000 APPLICATIONS WITHDRAWN 0 $0 0 $0 0 $0 FILES CLOSED FOR INCOMPLETENESS 0 $0 0 $0 0 $0
Aggregated Statistics For Year 2007(Based on 2 full tracts) A) Conventional B) Refinancings C) Non-occupant Loans on Number Average Value Number Average Value Number Average Value
LOANS ORIGINATED 3 $442,333 1 $521,000 3 $406,000 APPLICATIONS APPROVED, NOT ACCEPTED 0 $0 0 $0 0 $0 APPLICATIONS DENIED 0 $0 0 $0 0 $0 APPLICATIONS WITHDRAWN 1 $598,000 0 $0 1 $598,000 FILES CLOSED FOR INCOMPLETENESS 0 $0 0 $0 0 $0
Aggregated Statistics For Year 2006(Based on 2 full tracts) A) Conventional B) Refinancings C) Non-occupant Loans on Number Average Value Number Average Value Number Average Value
LOANS ORIGINATED 1 $343,000 1 $425,000 2 $384,000 APPLICATIONS APPROVED, NOT ACCEPTED 2 $517,500 0 $0 1 $653,000 APPLICATIONS DENIED 0 $0 1 $800,000 1 $800,000 APPLICATIONS WITHDRAWN 0 $0 1 $800,000 1 $800,000 FILES CLOSED FOR INCOMPLETENESS 0 $0 0 $0 0 $0
Aggregated Statistics For Year 2005(Based on 2 full tracts) A) Conventional C) Non-occupant Loans on Number Average Value Number Average Value
LOANS ORIGINATED 6 $398,167 5 $397,000 APPLICATIONS APPROVED, NOT ACCEPTED 1 $268,000 1 $268,000 APPLICATIONS DENIED 1 $279,000 1 $279,000 APPLICATIONS WITHDRAWN 2 $426,500 2 $426,500 FILES CLOSED FOR INCOMPLETENESS 0 $0 0 $0
Aggregated Statistics For Year 2004(Based on 2 full tracts) A) Conventional C) Non-occupant Loans on Number Average Value Number Average Value
LOANS ORIGINATED 4 $356,000 2 $303,000 APPLICATIONS APPROVED, NOT ACCEPTED 0 $0 0 $0 APPLICATIONS DENIED 1 $351,000 1 $351,000 APPLICATIONS WITHDRAWN 0 $0 0 $0 FILES CLOSED FOR INCOMPLETENESS 0 $0 0 $0
Aggregated Statistics For Year 2003(Based on 2 full tracts) A) Conventional B) Refinancings C) Non-occupant Loans on Number Average Value Number Average Value Number Average Value
LOANS ORIGINATED 11 $333,091 2 $338,500 7 $329,286 APPLICATIONS APPROVED, NOT ACCEPTED 0 $0 2 $271,500 1 $130,000 APPLICATIONS DENIED 0 $0 0 $0 0 $0 APPLICATIONS WITHDRAWN 1 $400,000 0 $0 0 $0 FILES CLOSED FOR INCOMPLETENESS 1 $495,000 0 $0 0 $0
Aggregated Statistics For Year 2002(Based on 2 full tracts) A) Conventional B) Refinancings C) Non-occupant Loans on Number Average Value Number Average Value Number Average Value
LOANS ORIGINATED 10 $330,000 5 $500,000 6 $324,667 APPLICATIONS APPROVED, NOT ACCEPTED 1 $404,000 2 $297,000 3 $332,667 APPLICATIONS DENIED 0 $0 0 $0 0 $0 APPLICATIONS WITHDRAWN 1 $332,000 1 $166,000 1 $166,000 FILES CLOSED FOR INCOMPLETENESS 0 $0 0 $0 0 $0
Aggregated Statistics For Year 2001(Based on 2 full tracts) A) Conventional B) Refinancings C) Non-occupant Loans on Number Average Value Number Average Value Number Average Value
LOANS ORIGINATED 9 $234,556 1 $315,000 5 $243,800 APPLICATIONS APPROVED, NOT ACCEPTED 3 $259,333 1 $247,000 2 $247,500 APPLICATIONS DENIED 0 $0 1 $198,000 0 $0 APPLICATIONS WITHDRAWN 1 $409,000 0 $0 1 $409,000 FILES CLOSED FOR INCOMPLETENESS 1 $220,000 0 $0 1 $220,000
Aggregated Statistics For Year 2000(Based on 2 full tracts) A) Conventional B) Refinancings C) Non-occupant Loans on Number Average Value Number Average Value Number Average Value
LOANS ORIGINATED 17 $260,412 3 $212,667 12 $254,750 APPLICATIONS APPROVED, NOT ACCEPTED 2 $360,500 0 $0 1 $261,000 APPLICATIONS DENIED 0 $0 0 $0 0 $0 APPLICATIONS WITHDRAWN 0 $0 0 $0 0 $0 FILES CLOSED FOR INCOMPLETENESS 1 $202,000 0 $0 1 $202,000
Aggregated Statistics For Year 1999(Based on 2 full tracts) A) Conventional B) Refinancings C) Non-occupant Loans on Number Average Value Number Average Value Number Average Value
LOANS ORIGINATED 18 $227,522 2 $192,210 8 $246,208 APPLICATIONS APPROVED, NOT ACCEPTED 5 $201,378 2 $172,445 2 $257,090 APPLICATIONS DENIED 0 $0 0 $0 0 $0 APPLICATIONS WITHDRAWN 1 $376,050 1 $128,140 1 $376,050 FILES CLOSED FOR INCOMPLETENESS 2 $181,785 0 $0 1 $133,340
Detailed PMIC statistics for the following Tracts:
0802.01
, 0802.02 Fire-safe hotels and motels in Sanibel, Florida:
Gulf Breeze Cottages, 1081 Shell Basket Ln, Sanibel, Florida 33957 Phone: (239) 472-1626, Fax: (239) 472-4664
Villa Capri Motel, 1245 Periwinkle Way, Sanibel, Florida 33957
Shalimar Resort, 2823 W Gulf Dr, Sanibel, Florida 33957 Phone: (239) 472-1353, Fax: (239) 472-6430
Kona Kai Motel, 1539 Periwinkle Way, Sanibel, Florida 33957
Sanibel Inn, 937 Gulf Dr, Sanibel, Florida 33957 Phone: (239) 472-3181, Fax: (239) 472-5234
Song Of The Sea, 863 E Gulf Dr, Sanibel, Florida 33957 Phone: (239) 472-2220, Fax: (239) 472-8569
All 6 fire-safe hotels and motels in Sanibel, Florida
Most common first names in Sanibel, FL among deceased individuals Name Count Lived (average)
William 56 76.5 years John 56 76.5 years Robert 52 76.9 years Mary 37 83.3 years Charles 31 78.2 years James 29 75.1 years Helen 25 83.4 years George 24 76.1 years Edward 23 75.0 years Thomas 22 75.6 years
Most common last names in Sanibel, FL among deceased individuals Last name Count Lived (average)
Smith 13 77.2 years Jones 11 84.5 years Miller 10 80.9 years Murphy 8 79.0 years Johnson 6 79.5 years Hunter 6 78.2 years Irwin 6 81.7 years Brown 6 76.0 years Simmons 6 80.5 years White 6 74.8 years
Sanibel compared to Florida state average:
Median household income above state average. Median house value significantly above state average. Unemployed percentage significantly below state average. Black race population percentage significantly below state average. Hispanic race population percentage significantly below state average. Median age significantly above state average. Foreign-born population percentage significantly below state average. Renting percentage significantly below state average. Length of stay since moving in significantly above state average. Number of college students below state average. Percentage of population with a bachelor's degree or higher significantly above state average.
#3 on the list of "Top 101 cities with largest percentage of females in industries: real estate and rental and leasing (population 5,000+)"
#12 on the list of "Top 101 cities with the most people born in other U.S. states (population 5,000+)"
#15 on the list of "Top 101 cities with the most users submitting photos to our site per 10,000 residents (population 5,000+)"
#15 on the list of "Top 101 cities with largest percentage of males in industries: real estate and rental and leasing (population 5,000+)"
#22 on the list of "Top 101 cities with the highest percentage of workers working at home, population 5,000+"
#29 on the list of "Top 101 cities with largest percentage of males in occupations: management occupations (population 5,000+)"
#36 on the list of "Top 101 cities with largest percentage of females in occupations: management occupations (population 5,000+)"
#42 on the list of "Top 101 cities with largest percentage of females in occupations: fire fighting and prevention workers including supervisors (population 5,000+)"
#78 on the list of "Top 101 cities with largest percentage of males in industries: health care and social assistance (population 5,000+)"
#98 on the list of "Top 100 cities with oldest residents"
#22 (33957) on the list of "Top 101 zip codes with the smallest percentage of returns reporting salary or wage in 2012 (pop 5,000+)"
#24 (33957) on the list of "Top 101 zip codes with the largest percentage of taxpayers reporting net capital gain/loss in 2012 (pop 5,000+)"
#28 (33957) on the list of "Top 101 zip codes with the largest percentage of taxpayers reporting taxable interest in 2012 (pop 5,000+)"
#39 (33957) on the list of "Top 101 zip codes with the largest percentage of taxpayers using charity contributions deductions in 2012 (pop 5,000+)"
#91 (33957) on the list of "Top 101 zip codes with the highest 2012 average Adjusted Gross Income (AGI) for individuals (pop 5,000+)"
#13 on the list of "Top 101 counties with the largest decrease in the number of deaths per 1000 residents 2000-2006 to 2007-2013 (pop. 50,000+)"
#34 on the list of "Top 101 counties with the largest number of people moving in compared to moving out (pop. 50,000+)"
#37 on the list of "Top 101 counties with the largest number of people without health insurance coverage in 2000 (pop. 50,000+)"
#43 on the list of "Top 101 counties with the highest ground withdrawal of fresh water for public supply"
#60 on the list of "Top 101 counties with the largest increase in the number of infant deaths per 1000 residents 2000-2006 to 2007-2013 (pop. 50,000+)"
Top Patent Applicants
Barry Douglas Wixey (5)
Robert E. Tucker (5)
Myk Willis (4)
George Lee Southard (3)
Jorge O. Galante (2)
John M. Chenciner (2)
Barry Wixey (2)
Robert J. Gyurik (1)
Pedro Antonio Rodriquez (1)
George L. Southard (1)
Total of 35 patent applications in 2008-2024.


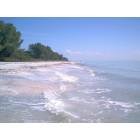

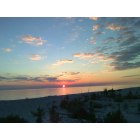
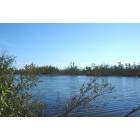
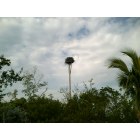
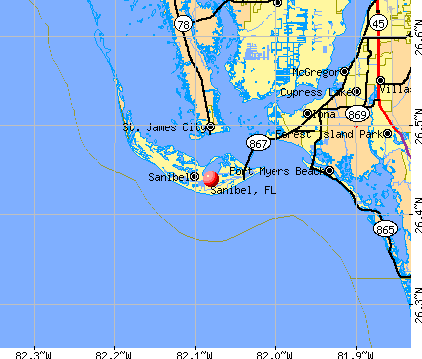


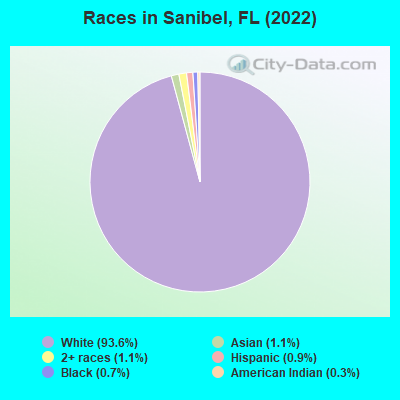
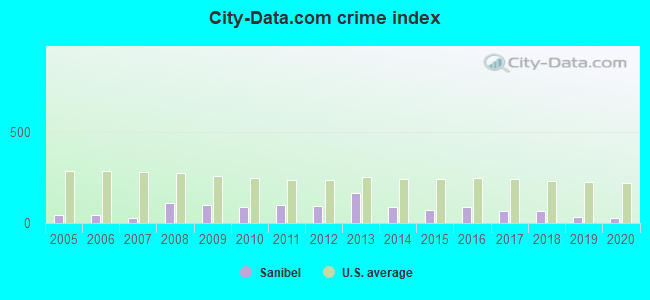
 Recent articles from our blog. Our writers, many of them Ph.D. graduates or candidates, create easy-to-read articles on a wide variety of topics.

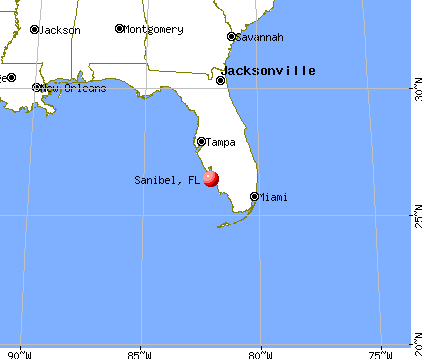
 (15.1 miles
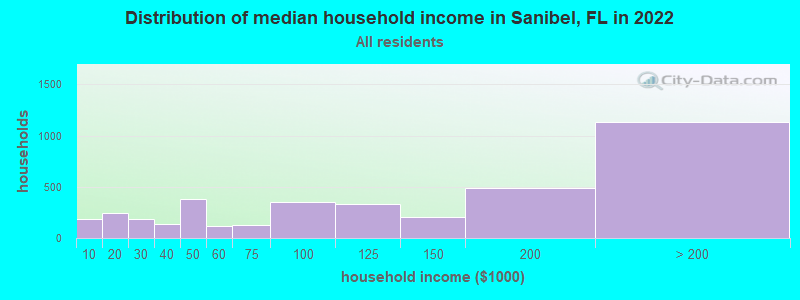
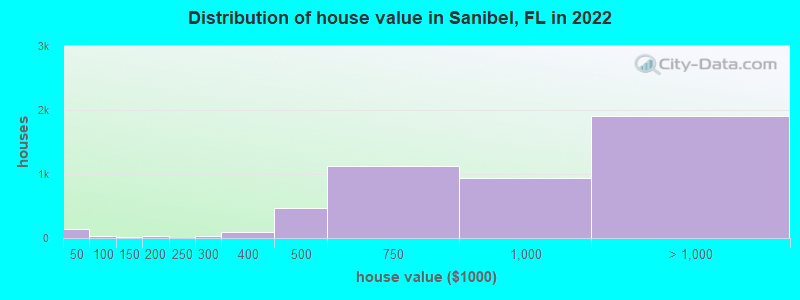

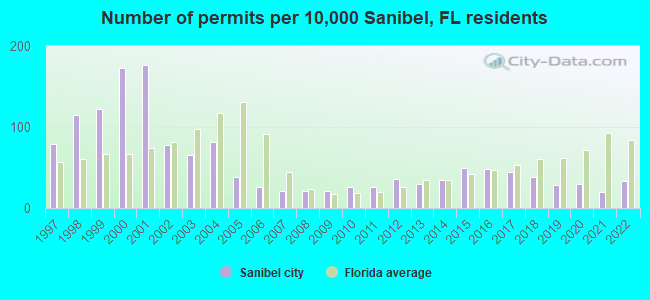
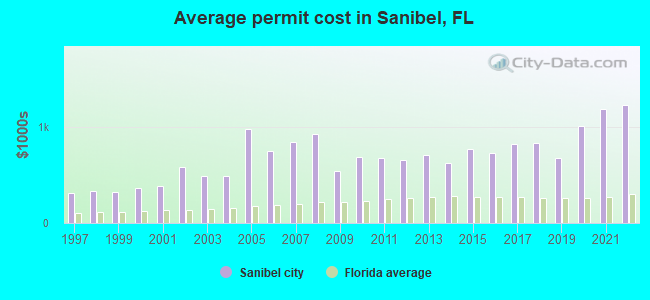
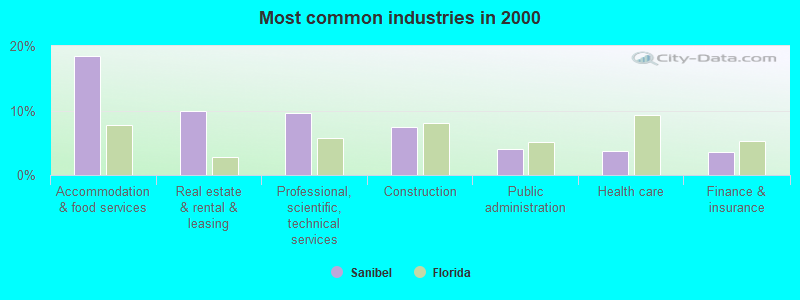
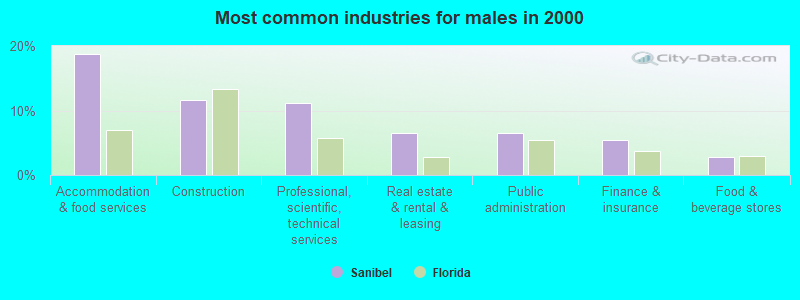
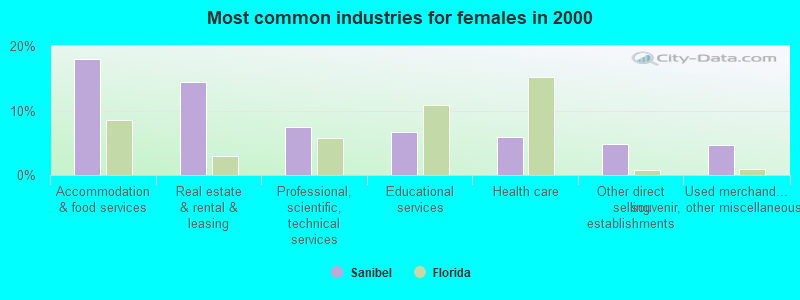
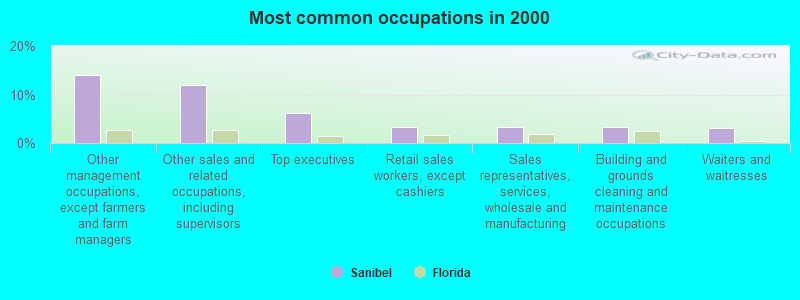
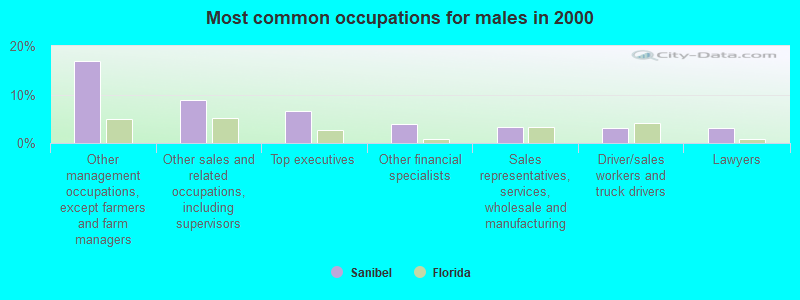
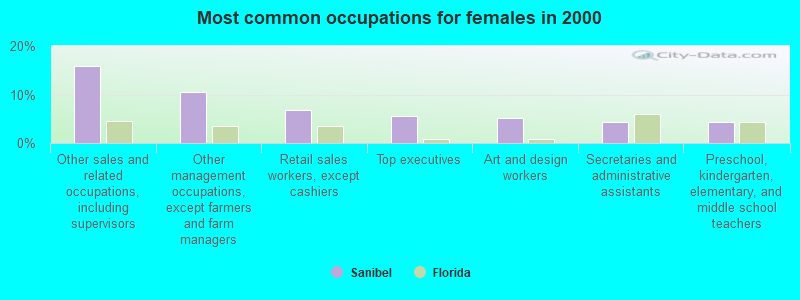
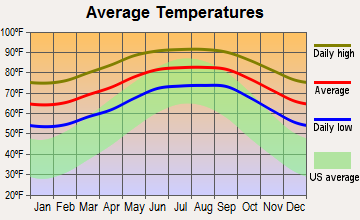
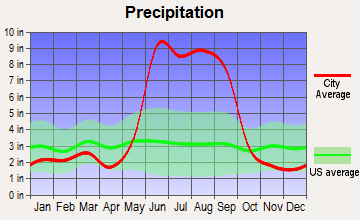
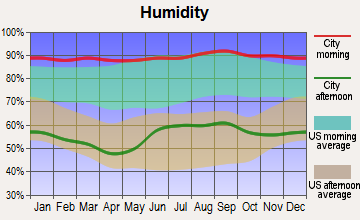
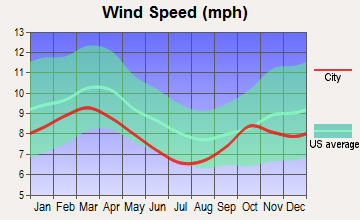
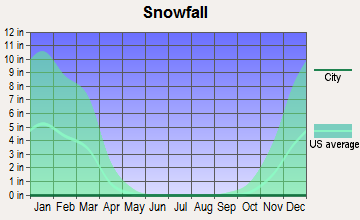
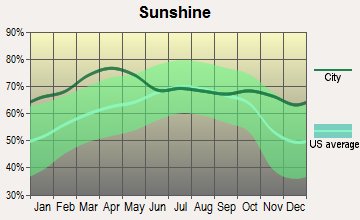
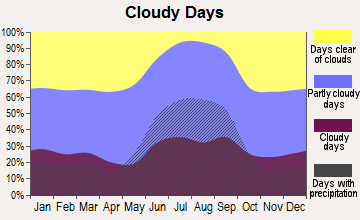
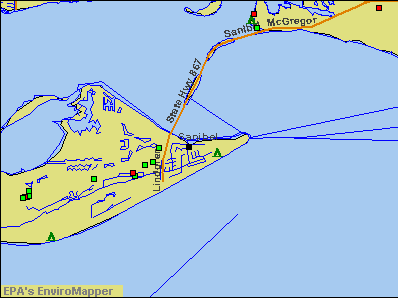

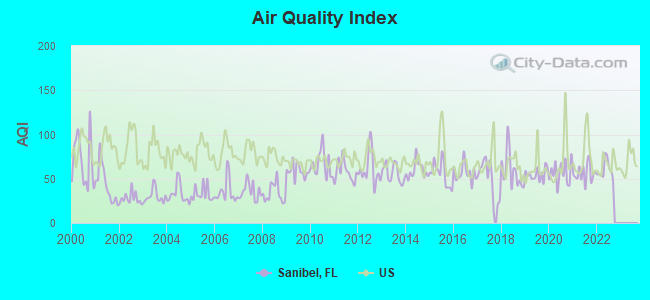
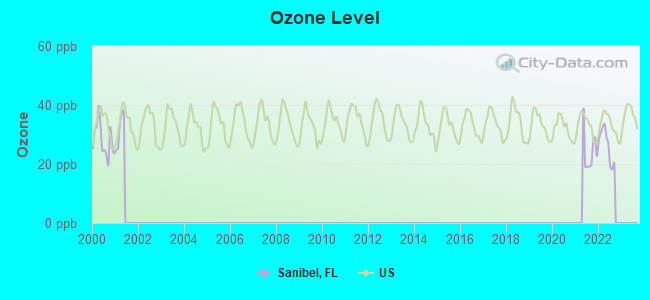
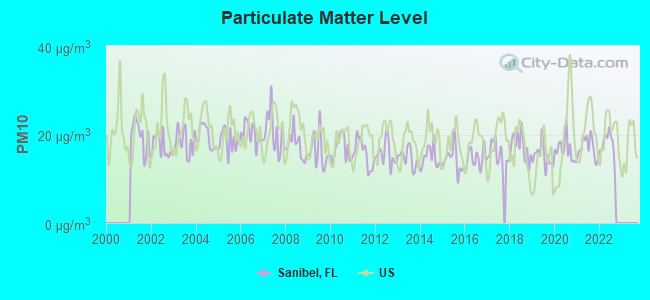
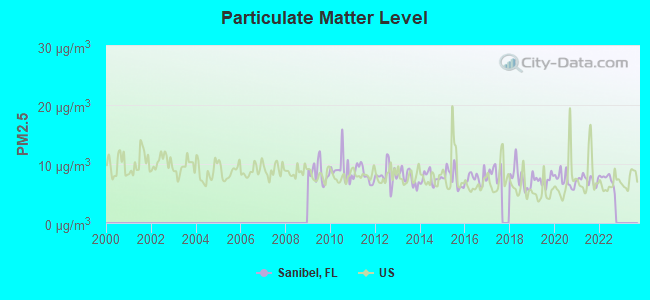
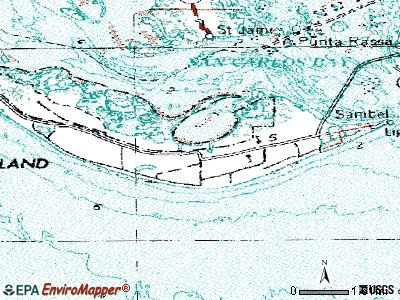
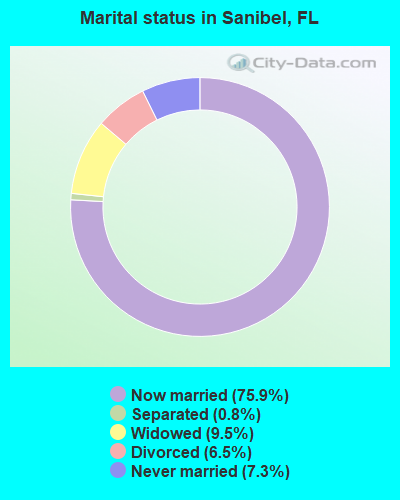
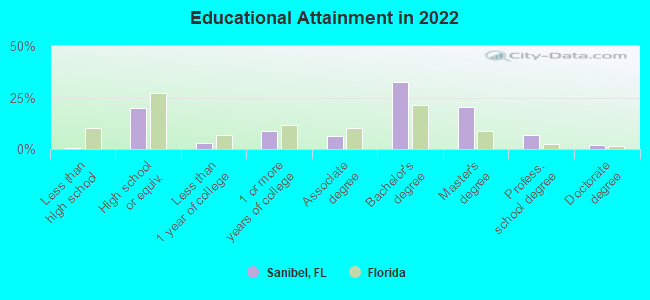
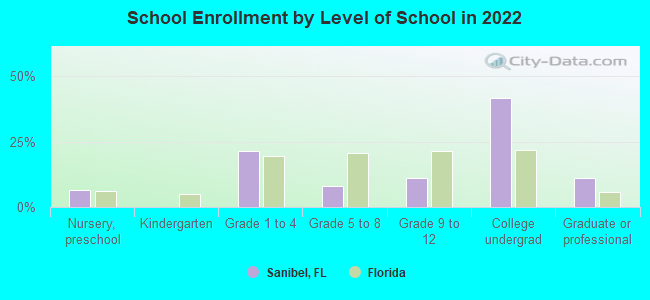
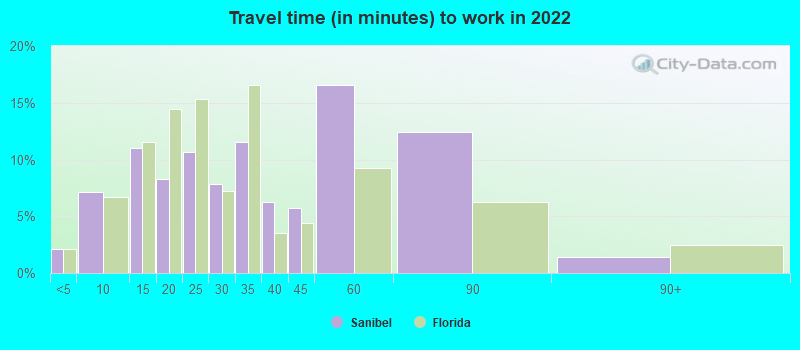
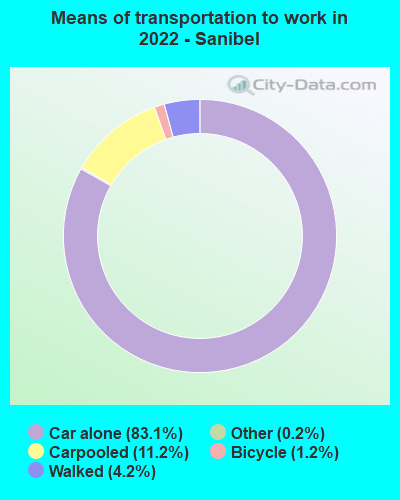
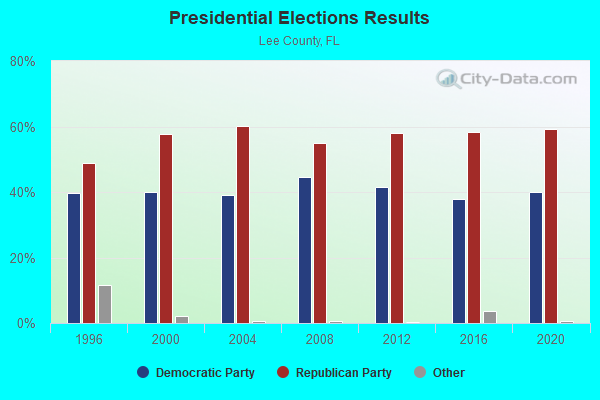
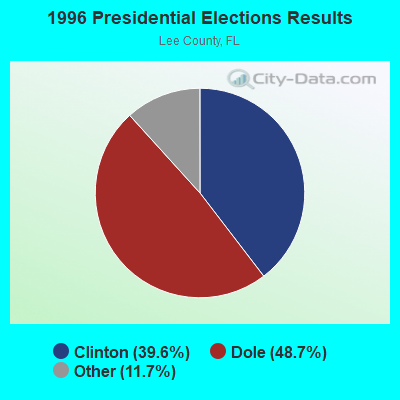
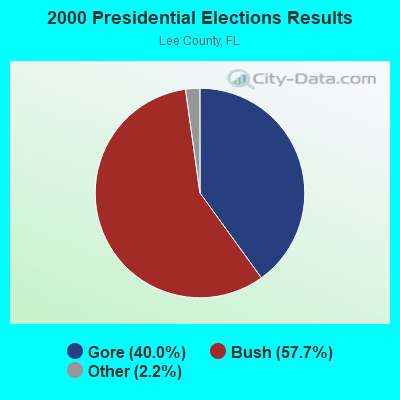
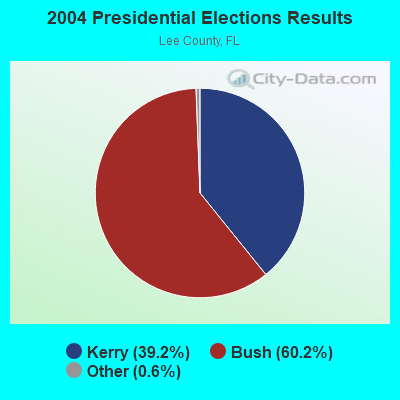
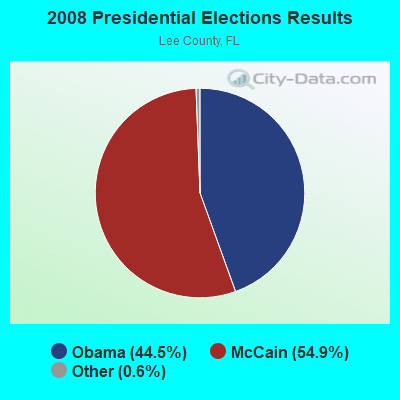
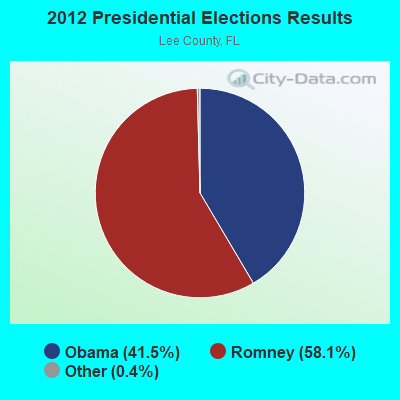

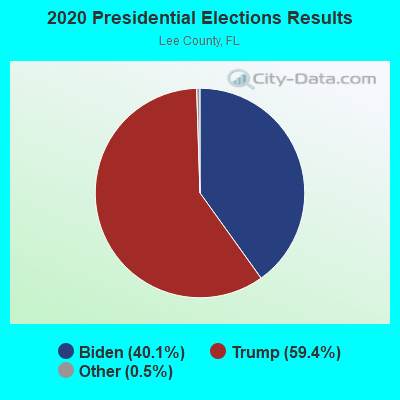
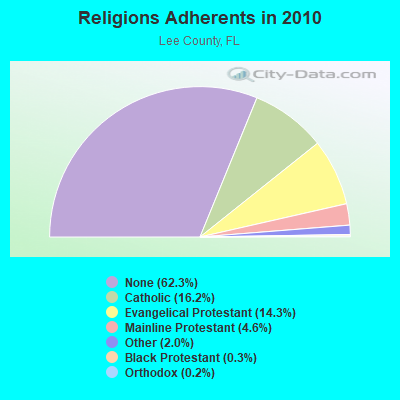

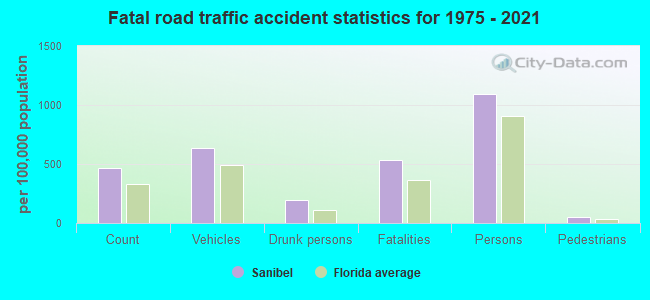
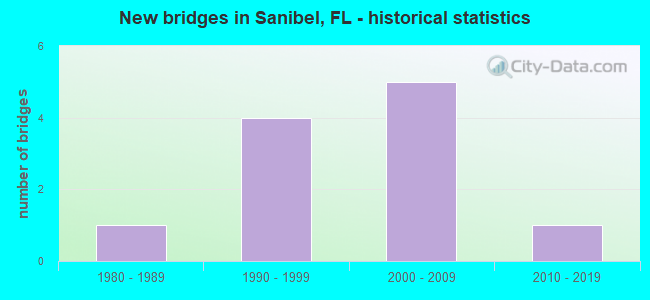
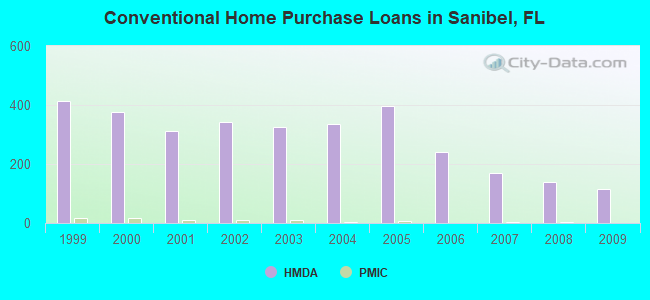
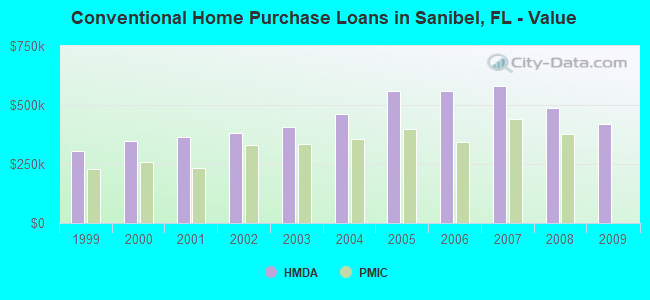
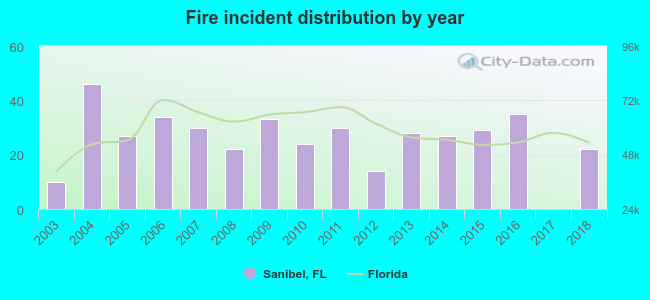 Based on the data from the years 2003 - 2018 the average number of fire incidents per year is 26. The highest number of fire incidents - 46 took place in 2004, and the least - 0 in 2017. The data has a growing trend.
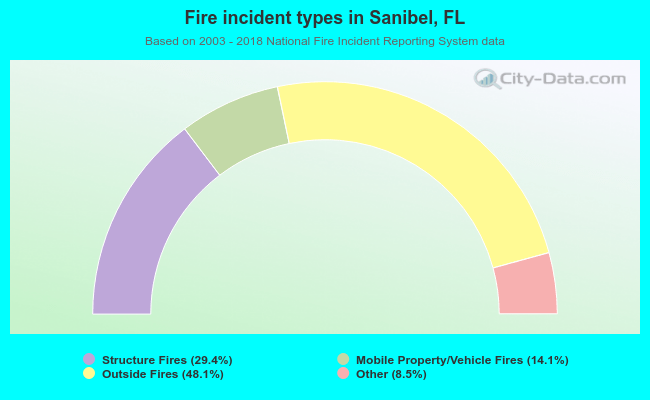 When looking into fire subcategories, the most reports belonged to: Outside Fires (48.1%), and Structure Fires (29.4%).