Please register to participate in our discussions with 2 million other members - it's free and quick! Some forums can only be seen by registered members. After you create your account, you'll be able to customize options and access all our 15,000 new posts/day with fewer ads.
My preferences change almost daily; today I'd say my ideal December and January are both around 23°C (20/26°C & 19/27°C respectively) while my ideal July and August are about 29°C (25/33°C & 26/32°C respectively) - both of which are cooler than your ideal I presume
What's your ideal coldest month & hottest month stats?
You are clearly more a hardcore heat lover than I am; I would not enjoy >35°C temps on a daily basis,
though once in a while that would be great - I recall savouring a 30/37°C day in Delhi (are you sweating just reading that?) - after a week, I got REALLY tired of it though and wished it got down to the lower 30°C's in the afternoon (instead, sadly, just before I left, the weather switched to a tepid rainy 27°C max)
As a general rule, my deep comfort zone is 27-32°C; what's yours?
Yes, after spending a lot longer in Canada than I'd intended,
I now prefer to have as little cooling as possible.
Deep comfort?
26-36 C. Sometimes even 39 C... or hotter?
I seem to acclimate to higher levels of heat quickly.
And the updated temperature scale (this is my version, based on Dhdh's data, and with the preferences expressed since then added onto):
And Cambium, I'm proud to have another -10er here . Welcome to the club.
I am a little surprised that so many people would go for the hot summers/mild winters and cold winters/mild summers combination. I expected more people to cluster towards the middle of the chard. Great job by Patricius!
This is the first edition of the rainfall v. sunshine chart:
The rainy end of the scale is rather rainy, at about 100 inches per year, so it's no surprise most people fall on the dry end of the scale . Perhaps that should be recalibrated .
The sunshine scale seems about right, and for now I'll leave the scales the way they are, with most of the respondents being warmth-loving people so far.
Just saw the Rain/Sun options.
Add me for
Rain: +6
Sun: -4
Quick suggestions.
How about doing the same using Winter/Summer again. ie: Winter, Sunny or Cloudy. Rain or Snow. Summer: Sun or Clouds, Rain or Snow.
Also maybe use a percentage for the Sun part. ie: 1=10% 2=20%, 10-100% sunshine, ect. I wasnt sure what the sun numbers mean so I assumed the smaller number meant less sun.
I am a little surprised that so many people would go for the hot summers/mild winters and cold winters/mild summers combination. I expected more people to cluster towards the middle of the chard. Great job by Patricius!
Thanks. It's not surprising to me that cold lovers would want cooler summers, and heat lovers would want warm winters and hot summers. Although hardly a statistical study, it is a blemish against the hypothesis that most people cluster around the middle in something resembling a bell curve; instead it seems that there are several distinct clusters across a wide range. It certainly disproves that notion among people that frequent this forum, and although it is uncertain whether this applies to the general public or not, it also conforms to my anecdotal encounters. The typical Cfa climate is right in the middle of the road climate-wise, and so the "silent moderates hypothesis" would predict that that would be the most popular climate - however I've seen that type get the least recommendations overall, both on this forum and in real life.
I've completed an addition to my climate preference chart. Below is the chart as envisioned by Dhdh but with lines that indicate a constant degree of seasonality. For example, the line marked "5" includes the points that mark a 5 degree Celsius difference between summer and winter. The gray portion indicates points on the chart that have a hottest month colder than the coldest month, and are thus logically impossible, as pointed out earlier.
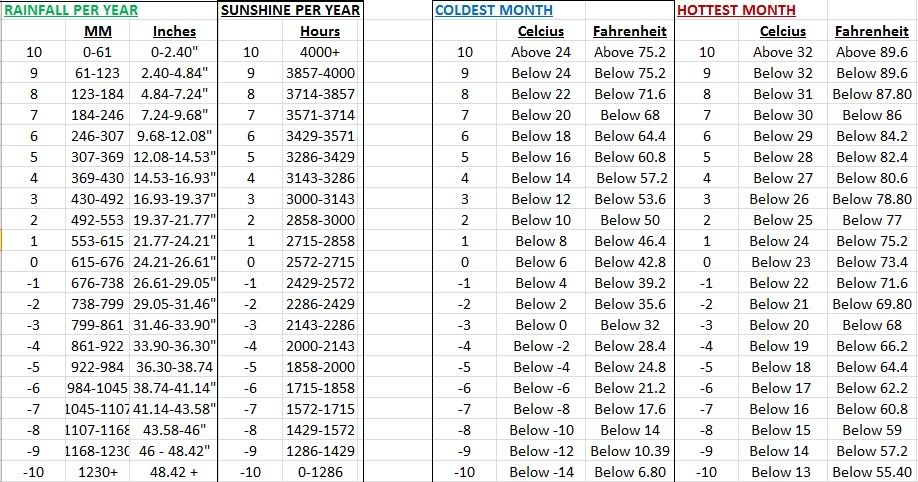
To Cambium, those are interesting ideas and perhaps we can include more charts with different axes in the future. As for the sunshine scale, the numbers are annual sunshine hours. 4000 hours equals 91% of possible sun, 1286 equals 29% of possible sun, and 2572 represents 59% of possible sun. The amount of possible sunshine anywhere during a full year is 4383 hours, so you could figure it out yourself. Or I could just make another version of the chart .
To Cambium, those are interesting ideas and perhaps we can include more charts with different axes in the future. As for the sunshine scale, the numbers are annual sunshine hours. 4000 hours equals 91% of possible sun, 1286 equals 29% of possible sun, and 2572 represents 59% of possible sun. The amount of possible sunshine anywhere during a full year is 4383 hours, so you could figure it out yourself. Or I could just make another version of the chart .
Ahh, they are hours. Got it. Please change my answer to -5. (5-5.50 hrs a day). Thanks! Awesome stuff.
Another suggestion: Write down the location where the person is from. So for me you would put CTUSA. Something like that. I bet you a lot of Warm fans arent from extremely warm climates and vise versa for Cold fans.
I've completed an addition to my climate preference chart. Below is the chart as envisioned by Dhdh but with lines that indicate a constant degree of seasonality. For example, the line marked "5" includes the points that mark a 5 degree Celsius difference between summer and winter. The gray portion indicates points on the chart that have a hottest month colder than the coldest month, and are thus logically impossible, as pointed out earlier.
.
Wow, once again, that is some pretty terrific work. I hadn't thought about including seasonality. Good job
To Cambium, those are interesting ideas and perhaps we can include more charts with different axes in the future. .
I've converted the MM Rainfall and Celcius temperature and put everything into Excel.
Now people in US can easily see their options.
If you want the Excel File PM me your email address and I'll send it, this way you can easily change, add or even add names into the cells. :-)
Please register to post and access all features of our very popular forum. It is free and quick. Over $68,000 in prizes has already been given out to active posters on our forum. Additional giveaways are planned.
Detailed information about all U.S. cities, counties, and zip codes on our site: City-data.com.

 Please register to participate in our discussions with 2 million other members - it's free and quick! Some forums can only be seen by registered members. After you create your account, you'll be able to customize options and access all our 15,000 new posts/day with fewer ads.


 (are you sweating just reading that?) - after a week, I got REALLY tired of it though and wished it got down to the lower 30°C's in the afternoon (instead, sadly, just before I left, the weather switched to a tepid rainy 27°C max)
 . Welcome to the club.
 .
.