Percentage of residents living in poverty in 2022: 8.6%
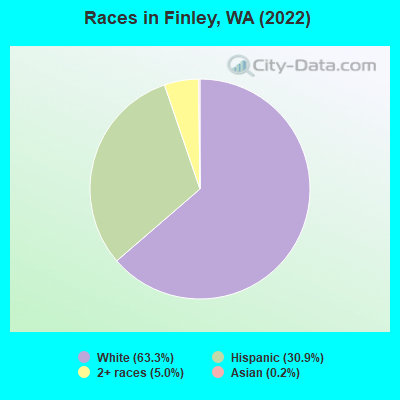
(5.6% for White Non-Hispanic residents, 16.0% for Hispanic or Latino residents, 49.5% for other race residents)
Latest news from Finley, WA collected exclusively by city-data.com from local newspapers, TV, and radio stations
Ancestries: German (11.3%), American (9.9%), English (4.8%), Irish (4.0%), Swedish (3.8%), Norwegian (1.3%).
Current Local Time: PST time zone
Elevation: 352 feet
Land area: 11.5 square miles.
Population density: 522 people per square mile (low).
770 residents are foreign born (12.5% Latin America).
This place:
12.8%
Washington:
14.9%
Median real estate property taxes paid for housing units with mortgages in 2022: $3,165 (0.8%) Median real estate property taxes paid for housing units with no mortgage in 2022: $2,845 (1.0%)
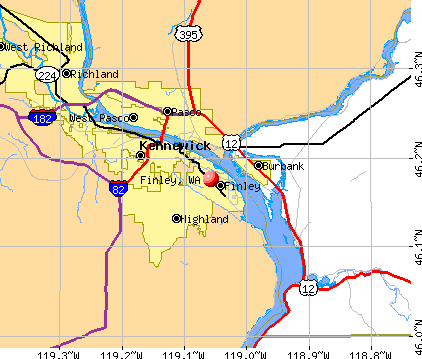
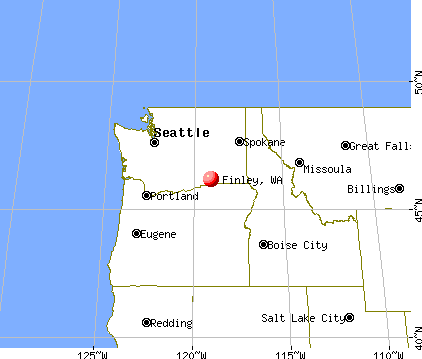
Nearest city with pop. 50,000+: Kennewick, WA (5.2 miles , pop. 54,693).
Nearest city with pop. 200,000+: East Seattle, WA (177.5 miles , pop. 480,100).
Nearest city with pop. 1,000,000+: Los Angeles, CA (837.0 miles , pop. 3,694,820).
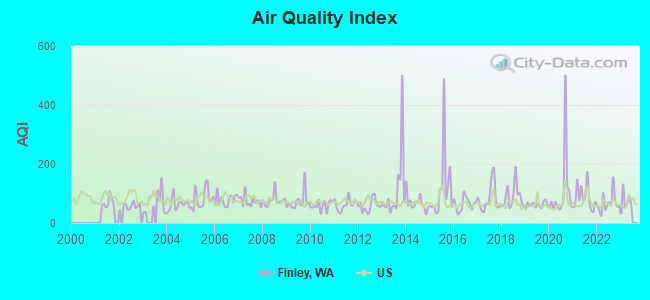
Air Quality Index (AQI) level in 2022 was 66.8. This is about average.
City:
66.8
U.S.:
72.6
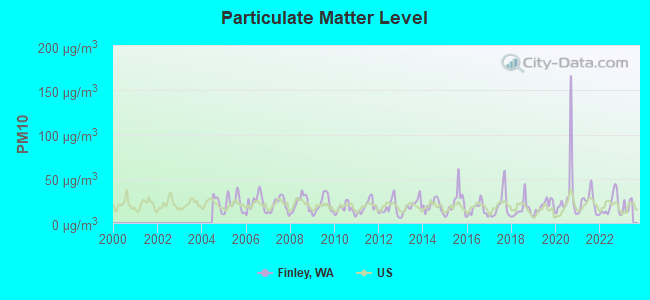
Particulate Matter (PM10) [µg/m3] level in 2022 was 20.0. This is about average.Closest monitor was 2.9 miles away from the city center.
City:
20.0
U.S.:
19.2
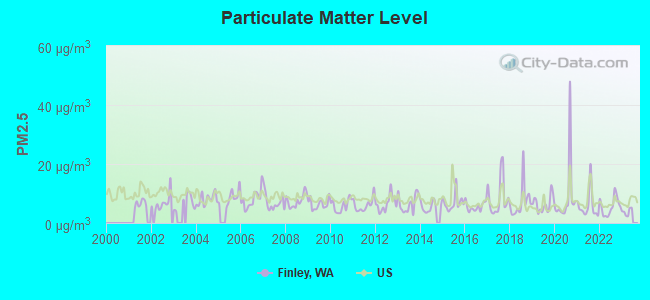
Particulate Matter (PM2.5) [µg/m3] level in 2022 was 5.61. This is significantly better than average.Closest monitor was 7.6 miles away from the city center.
City:
5.61
U.S.:
8.11
Earthquake activity:
Finley-area historical earthquake activity is significantly above Washington state average. It is 1300% greater than the overall U.S. average.
On 4/13/1949 at 19:55:42, a magnitude 7.0 (7.0 UK, Class: Major, Intensity: VIII - XII) earthquake occurred 179.4 miles away from Finley center, causing $80,000,000 total damage On 2/28/2001 at 18:54:32, a magnitude 6.8 (6.5 MB, 6.6 MS, 6.8 MW, Class: Strong, Intensity: VII - IX) earthquake occurred 178.8 miles away from the city center, causing $2,000,000,000 total damage and $305,000,000 insured losses On 10/28/1983 at 14:06:06, a magnitude 7.3 (6.2 MB, 7.3 MS, 7.0 MW) earthquake occurred 294.6 miles away from Finley center, causing 2 deaths (2 shaking deaths) and 3 injuries, causing $15,000,000 total damage On 2/28/2001 at 18:54:32, a magnitude 6.8 (6.8 MD, Depth: 32.2 mi) earthquake occurred 186.7 miles away from Finley center On 4/29/1965 at 15:28:43, a magnitude 6.6 (6.6 UK) earthquake occurred 174.1 miles away from Finley center, causing $28,000,000 total damage On 10/3/1915 at 06:52:48, a magnitude 7.6 (7.6 UK) earthquake occurred 400.3 miles away from the city center Magnitude types: body-wave magnitude (MB), duration magnitude (MD), surface-wave magnitude (MS), moment magnitude (MW)
Natural disasters:
The number of natural disasters in Benton County (16) is near the US average (15). Major Disasters (Presidential) Declared: 11 Emergencies Declared: 2
Causes of natural disasters: Floods: 9, Storms: 5, Mudslides: 3, Winter Storms: 3, Fires: 2, Landslides: 2, Drought: 1, Earthquake: 1, Heavy Rain: 1, Hurricane: 1, Snow: 1, Volcanic Eruption: 1, Other: 1 (Note: some incidents may be assigned to more than one category).
Hospitals and medical centers near Finley:
KENNEWICK GENERAL HOSPITAL Acute Care Hospitals (about 4 miles away; KENNEWICK, WA)
KENNEWICK GENERAL HOSP HH (Home Health Center, about 4 miles away; KENNEWICK, WA)
CANYON LAKES RESTORATIVE AND REHABILITATION CENTER (Nursing Home, about 5 miles away; KENNEWICK, WA)
TRI-CITIES CHAPLAINCY HOSPICE (Hospital, about 6 miles away; KENNEWICK, WA)
AVALON HEALTH AND REHABILITATION CENTER - PASCO (Nursing Home, about 6 miles away; PASCO, WA)
VISTAVUE CARE CENTER (Nursing Home, about 7 miles away; KENNEWICK, WA)
FMC COLUMBIA BASIN (Dialysis Facility, about 9 miles away; KENNEWICK, WA)
Amtrak stations near Finley:
5 miles: PASCO (CLARK & TACOMA STS.) . Services: ticket office, partially wheelchair accessible, enclosed waiting area, public payphones, vending machines, free short-term parking, free long-term parking, call for taxi service, intercity bus service, public transit connection.
13 miles: RICHLAND (DENNY'S REST., G. WASH. WAY AT WILLIAMS) - Bus Station . Services: public restrooms, public payphones, full-service food facilities.
16 miles: WEST RICHLAND (GENIE TOURS BUS STOP, 4083 W. VAN GIESEN) - Bus Station
Operable nuclear power plant near Finley:
13 miles: WNP 2 in Richland, WA.
Colleges/universities with over 2000 students nearest to Finley:
Columbia Basin College (about 7 miles; Pasco, WA; Full-time enrollment: 5,111)
Walla Walla Community College (about 38 miles; Walla Walla, WA; FT enrollment: 4,263)
Eastern Oregon University (about 76 miles; La Grande, OR; FT enrollment: 3,127)
Yakima Valley Community College (about 76 miles; Yakima, WA; FT enrollment: 3,632)
Central Washington University (about 91 miles; Ellensburg, WA; FT enrollment: 10,960)
Washington State University (about 99 miles; Pullman, WA; FT enrollment: 25,055)
Lewis-Clark State College (about 99 miles; Lewiston, ID; FT enrollment: 3,199)
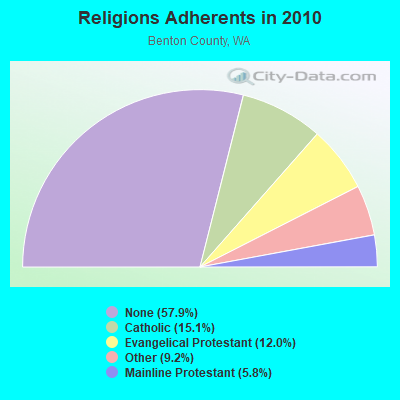
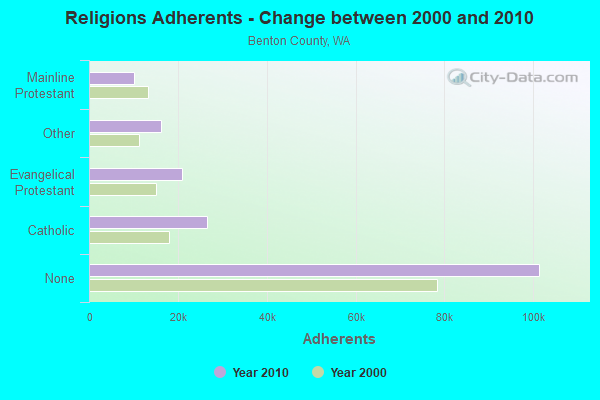
Religion statistics for Finley, WA (based on Benton County data)
Religion
Adherents
Congregations
Catholic
26,500
5
Evangelical Protestant
20,943
86
Other
16,145
43
Mainline Protestant
10,217
28
None
101,372
-
Source: Clifford Grammich, Kirk Hadaway, Richard Houseal, Dale E.Jones, Alexei Krindatch, Richie Stanley and Richard H.Taylor. 2012. 2010 U.S.Religion Census: Religious Congregations & Membership Study. Association of Statisticians of American Religious Bodies. Jones, Dale E., et al. 2002. Congregations and Membership in the United States 2000. Nashville, TN: Glenmary Research Center. Graphs represent county-level data
JOE BUTTE, 5.7 Mi Sw Of (Lat: 46.103444 Lon: -119.128889), Type: Tower, Structure height: 27.4 m, Call Sign: WQCT643, Assigned Frequencies: 932.356 MHz, 941.356 MHz, Grant Date: 04/23/2015, Expiration Date: 05/23/2025, Certifier: Brad G Zielie, Registrant: Prokarma, 222 So 15th St., Suite 505n, Omaha, NE 68102, Phone: (402) 522-5068, Fax: (402) 346-6676, Email:
HEDGES, Approx. 0.7 Mi Ese Of The Intersetion Of S Finley Rd And E Chochran Rd (Lat: 46.158583 Lon: -119.019556), Type: Gtower, Structure height: 30.5 m, Overall height: 35.1 m, Call Sign: WQPT732, Assigned Frequencies: 11485.0 MHz, Grant Date: 07/12/2022, Expiration Date: 08/14/2032, Certifier: Steven T Campbell, Registrant: Wilkinson Barker Knauer, LLP, 1800 M Street Nw, Suite 800n, Washington, DC 20036, Phone: (202) 383-3420, Fax: (202) 783-5851, Email:
BENTON PUD, S. Piert Rd (Lat: 46.157000 Lon: -119.011944), Type: Ltower, Structure height: 6.1 m, Overall height: 9.1 m, Call Sign: WRAC759, Licensee ID: L01485668, Assigned Frequencies: 928.162 MHz, 952.162 MHz, 952.162 MHz, 928.162 MHz, 928.162 MHz, 952.162 MHz, Grant Date: 10/11/2017, Expiration Date: 10/11/2027, Certifier: Bryant Reimann, Registrant: Northwest Pipeline Gp, 295 Chipeta Way, Salt Lake City, UT 84108, Phone: (801) 584-6068, Email:
Home Mortgage Disclosure Act Aggregated Statistics For Year 2009 (Based on 1 partial tract)
A) FHA, FSA/RHS & VA Home Purchase Loans
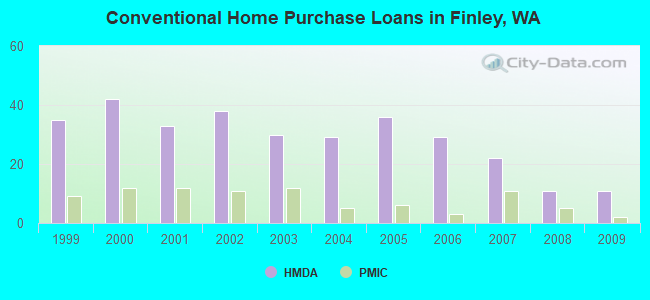
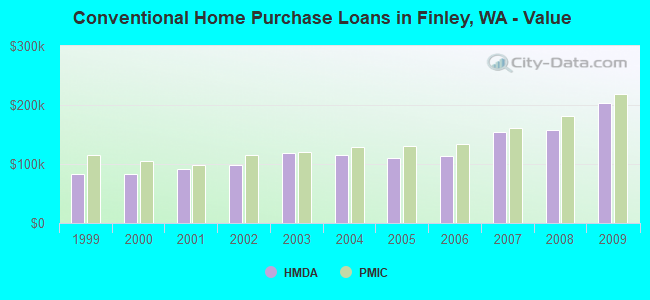
B) Conventional Home Purchase Loans
C) Refinancings
D) Home Improvement Loans
F) Non-occupant Loans on < 5 Family Dwellings (A B C & D)
G) Loans On Manufactured Home Dwelling (A B C & D)
Number
Average Value
Number
Average Value
Number
Average Value
Number
Average Value
Number
Average Value
Number
Average Value
LOANS ORIGINATED
20
$147,588
11
$204,220
67
$170,806
5
$80,424
1
$105,960
35
$132,962
APPLICATIONS APPROVED, NOT ACCEPTED
1
$279,310
0
$0
6
$185,933
2
$111,395
0
$0
1
$127,160
APPLICATIONS DENIED
3
$182,943
2
$151,880
28
$134,453
5
$42,928
1
$107,590
8
$116,966
APPLICATIONS WITHDRAWN
5
$218,664
1
$145,630
27
$155,694
4
$135,442
1
$80,970
9
$133,858
FILES CLOSED FOR INCOMPLETENESS
0
$0
0
$0
5
$101,724
1
$59,770
0
$0
1
$63,580
Aggregated Statistics For Year 2008 (Based on 1 partial tract)
A) FHA, FSA/RHS & VA Home Purchase Loans
B) Conventional Home Purchase Loans
C) Refinancings
D) Home Improvement Loans
F) Non-occupant Loans on < 5 Family Dwellings (A B C & D)
G) Loans On Manufactured Home Dwelling (A B C & D)
Number
Average Value
Number
Average Value
Number
Average Value
Number
Average Value
Number
Average Value
Number
Average Value
LOANS ORIGINATED
18
$142,854
11
$156,795
42
$144,557
8
$48,499
2
$127,425
35
$123,259
APPLICATIONS APPROVED, NOT ACCEPTED
2
$133,135
3
$85,493
11
$127,155
1
$10,870
2
$70,915
10
$118,842
APPLICATIONS DENIED
5
$141,284
7
$155,257
50
$142,719
15
$88,647
1
$148,890
34
$107,130
APPLICATIONS WITHDRAWN
3
$119,187
2
$93,735
17
$142,722
2
$39,395
1
$129,330
9
$90,264
FILES CLOSED FOR INCOMPLETENESS
1
$39,120
0
$0
4
$115,608
2
$18,205
0
$0
1
$53,250
Aggregated Statistics For Year 2007 (Based on 1 partial tract)
A) FHA, FSA/RHS & VA Home Purchase Loans
B) Conventional Home Purchase Loans
C) Refinancings
D) Home Improvement Loans
F) Non-occupant Loans on < 5 Family Dwellings (A B C & D)
G) Loans On Manufactured Home Dwelling (A B C & D)
Number
Average Value
Number
Average Value
Number
Average Value
Number
Average Value
Number
Average Value
Number
Average Value
LOANS ORIGINATED
11
$119,548
22
$153,782
40
$110,786
11
$45,300
1
$233,660
27
$118,340
APPLICATIONS APPROVED, NOT ACCEPTED
2
$154,870
4
$97,405
11
$107,544
1
$29,340
1
$69,560
5
$88,030
APPLICATIONS DENIED
3
$132,590
10
$167,204
65
$126,512
23
$56,112
2
$77,980
36
$97,586
APPLICATIONS WITHDRAWN
1
$59,770
5
$184,864
22
$145,582
5
$57,600
1
$289,090
8
$135,714
FILES CLOSED FOR INCOMPLETENESS
1
$81,510
1
$110,310
4
$104,740
0
$0
1
$69,560
2
$127,970
Aggregated Statistics For Year 2006 (Based on 1 partial tract)
A) FHA, FSA/RHS & VA Home Purchase Loans
B) Conventional Home Purchase Loans
C) Refinancings
D) Home Improvement Loans
F) Non-occupant Loans on < 5 Family Dwellings (A B C & D)
G) Loans On Manufactured Home Dwelling (A B C & D)
Number
Average Value
Number
Average Value
Number
Average Value
Number
Average Value
Number
Average Value
Number
Average Value
LOANS ORIGINATED
12
$119,322
29
$114,039
45
$118,980
14
$37,766
3
$164,830
36
$106,657
APPLICATIONS APPROVED, NOT ACCEPTED
1
$66,840
8
$113,910
9
$96,786
3
$34,053
2
$56,515
5
$112,376
APPLICATIONS DENIED
3
$99,260
10
$98,681
66
$108,771
26
$54,340
2
$71,455
43
$86,160
APPLICATIONS WITHDRAWN
1
$109,770
7
$106,196
23
$126,943
6
$58,325
1
$13,580
8
$83,548
FILES CLOSED FOR INCOMPLETENESS
0
$0
1
$145,630
7
$99,131
1
$141,830
0
$0
3
$80,603
Aggregated Statistics For Year 2005 (Based on 1 partial tract)
A) FHA, FSA/RHS & VA Home Purchase Loans
B) Conventional Home Purchase Loans
C) Refinancings
D) Home Improvement Loans
E) Loans on Dwellings For 5+ Families
F) Non-occupant Loans on < 5 Family Dwellings (A B C & D)
G) Loans On Manufactured Home Dwelling (A B C & D)
Number
Average Value
Number
Average Value
Number
Average Value
Number
Average Value
Number
Average Value
Number
Average Value
Number
Average Value
LOANS ORIGINATED
12
$135,216
36
$110,386
49
$116,066
16
$64,393
0
$0
5
$97,812
30
$103,644
APPLICATIONS APPROVED, NOT ACCEPTED
0
$0
7
$120,713
10
$123,352
2
$33,420
0
$0
1
$136,940
8
$82,461
APPLICATIONS DENIED
1
$80,420
9
$81,872
66
$118,346
15
$37,459
0
$0
2
$77,705
33
$87,504
APPLICATIONS WITHDRAWN
2
$100,530
8
$131,502
36
$127,835
5
$58,796
0
$0
2
$83,410
10
$89,824
FILES CLOSED FOR INCOMPLETENESS
0
$0
2
$86,130
6
$104,242
0
$0
1
$550,460
0
$0
2
$113,025
Aggregated Statistics For Year 2004 (Based on 1 partial tract)
A) FHA, FSA/RHS & VA Home Purchase Loans
B) Conventional Home Purchase Loans
C) Refinancings
D) Home Improvement Loans
F) Non-occupant Loans on < 5 Family Dwellings (A B C & D)
G) Loans On Manufactured Home Dwelling (A B C & D)
Number
Average Value
Number
Average Value
Number
Average Value
Number
Average Value
Number
Average Value
Number
Average Value
LOANS ORIGINATED
10
$146,012
29
$116,100
62
$116,033
9
$46,672
2
$84,770
35
$115,961
APPLICATIONS APPROVED, NOT ACCEPTED
0
$0
5
$159,976
17
$103,981
1
$7,060
1
$167,370
2
$107,595
APPLICATIONS DENIED
2
$132,045
17
$98,099
68
$100,865
12
$58,506
1
$52,710
33
$87,471
APPLICATIONS WITHDRAWN
1
$27,170
6
$119,277
40
$110,392
3
$31,880
1
$39,120
12
$68,016
FILES CLOSED FOR INCOMPLETENESS
0
$0
1
$57,600
4
$81,510
0
$0
0
$0
1
$58,690
Aggregated Statistics For Year 2003 (Based on 1 partial tract)
A) FHA, FSA/RHS & VA Home Purchase Loans
B) Conventional Home Purchase Loans
C) Refinancings
D) Home Improvement Loans
E) Loans on Dwellings For 5+ Families
F) Non-occupant Loans on < 5 Family Dwellings (A B C & D)
Number
Average Value
Number
Average Value
Number
Average Value
Number
Average Value
Number
Average Value
Number
Average Value
LOANS ORIGINATED
7
$108,603
30
$118,823
121
$106,897
12
$37,902
1
$1,037,890
5
$81,944
APPLICATIONS APPROVED, NOT ACCEPTED
1
$85,860
3
$149,980
15
$135,923
1
$16,300
0
$0
1
$144,000
APPLICATIONS DENIED
2
$122,265
5
$85,096
62
$105,945
6
$46,823
0
$0
1
$19,020
APPLICATIONS WITHDRAWN
1
$127,160
4
$143,458
37
$113,703
0
$0
0
$0
1
$72,270
FILES CLOSED FOR INCOMPLETENESS
0
$0
1
$95,090
5
$148,348
1
$10,870
0
$0
0
$0
Aggregated Statistics For Year 2002 (Based on 1 partial tract)
A) FHA, FSA/RHS & VA Home Purchase Loans
B) Conventional Home Purchase Loans
C) Refinancings
D) Home Improvement Loans
F) Non-occupant Loans on < 5 Family Dwellings (A B C & D)
Number
Average Value
Number
Average Value
Number
Average Value
Number
Average Value
Number
Average Value
LOANS ORIGINATED
8
$107,865
38
$97,655
86
$104,225
9
$33,992
3
$88,393
APPLICATIONS APPROVED, NOT ACCEPTED
1
$103,790
3
$54,703
14
$80,889
1
$58,690
1
$48,360
APPLICATIONS DENIED
2
$79,335
8
$68,400
39
$106,367
4
$30,838
1
$27,710
APPLICATIONS WITHDRAWN
1
$116,290
5
$92,704
24
$110,944
0
$0
0
$0
FILES CLOSED FOR INCOMPLETENESS
0
$0
1
$24,450
3
$72,817
0
$0
1
$47,820
Aggregated Statistics For Year 2001 (Based on 1 partial tract)
A) FHA, FSA/RHS & VA Home Purchase Loans
B) Conventional Home Purchase Loans
C) Refinancings
D) Home Improvement Loans
E) Loans on Dwellings For 5+ Families
F) Non-occupant Loans on < 5 Family Dwellings (A B C & D)
Number
Average Value
Number
Average Value
Number
Average Value
Number
Average Value
Number
Average Value
Number
Average Value
LOANS ORIGINATED
6
$117,283
33
$91,011
63
$95,768
4
$41,842
1
$96,730
1
$96,730
APPLICATIONS APPROVED, NOT ACCEPTED
2
$109,765
4
$130,688
11
$83,980
1
$48,360
0
$0
0
$0
APPLICATIONS DENIED
1
$68,470
15
$64,483
42
$96,014
7
$27,326
0
$0
3
$59,773
APPLICATIONS WITHDRAWN
0
$0
3
$96,000
25
$125,004
1
$16,300
0
$0
1
$89,120
FILES CLOSED FOR INCOMPLETENESS
0
$0
2
$73,900
9
$88,212
1
$1,630
0
$0
1
$53,250
Aggregated Statistics For Year 2000 (Based on 1 partial tract)
A) FHA, FSA/RHS & VA Home Purchase Loans
B) Conventional Home Purchase Loans
C) Refinancings
D) Home Improvement Loans
F) Non-occupant Loans on < 5 Family Dwellings (A B C & D)
Number
Average Value
Number
Average Value
Number
Average Value
Number
Average Value
Number
Average Value
LOANS ORIGINATED
7
$96,880
42
$82,558
31
$76,374
14
$19,174
3
$29,523
APPLICATIONS APPROVED, NOT ACCEPTED
1
$22,280
9
$64,362
9
$85,072
3
$12,680
2
$27,985
APPLICATIONS DENIED
3
$117,557
22
$60,194
33
$77,822
12
$35,457
1
$38,580
APPLICATIONS WITHDRAWN
1
$34,780
4
$98,628
10
$71,348
1
$5,430
1
$64,120
FILES CLOSED FOR INCOMPLETENESS
0
$0
1
$27,710
9
$79,699
1
$19,020
0
$0
Aggregated Statistics For Year 1999 (Based on 1 partial tract)
A) FHA, FSA/RHS & VA Home Purchase Loans
B) Conventional Home Purchase Loans
C) Refinancings
D) Home Improvement Loans
F) Non-occupant Loans on < 5 Family Dwellings (A B C & D)
Detailed PMIC statistics for the following Tracts:0115.01
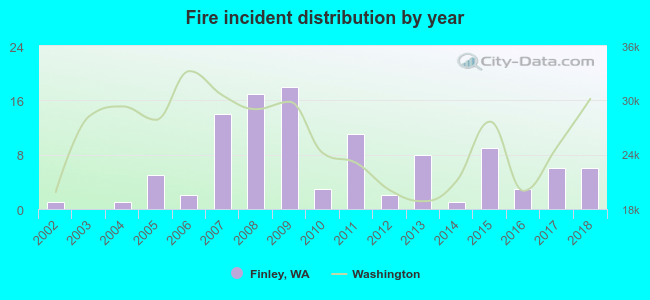
2002 - 2018 National Fire Incident Reporting System (NFIRS) incidents
According to the data from the years 2002 - 2018 the average number of fire incidents per year is 6. The highest number of reported fire incidents - 18 took place in 2009, and the least - 0 in 2003. The data has a rising trend.
When looking into fire subcategories, the most reports belonged to: Outside Fires (74.8%), and Structure Fires (15.0%).
Fire incident types reported to NFIRS in Finley, WA
#11 on the list of "Top 101 cities with largest percentage of females in occupations: architecture and engineering occupations (population 5,000+)"
#20 on the list of "Top 101 cities with the smallest percentage of likely homosexual households (counted as self-reported same-sex unmarried-partner households) (population 5,000+)"
#41 on the list of "Top 101 cities with the largest percentage of mobile homes (2,000+ housing units)"
#69 on the list of "Top 101 cities with largest percentage of males in occupations: fire fighting and prevention workers including supervisors (population 5,000+)"
#84 on the list of "Top 101 cities with the most cars per house, population 5,000+"
#19 on the list of "Top 101 counties with the largest number of people moving in compared to moving out (pop. 50,000+)"
#29 on the list of "Top 101 counties with the highest average weight of females"
#35 on the list of "Top 101 counties with the highest percentage of residents that keep firearms around their homes"
#56 on the list of "Top 101 counties with the largest increase in the number of births per 1000 residents 2000-2006 to 2007-2013 (pop 50,000+)"
#67 on the list of "Top 101 counties with the lowest percentage of residents that drank alcohol in the past 30 days"


 Recent articles from our blog. Our writers, many of them Ph.D. graduates or candidates, create easy-to-read articles on a wide variety of topics.

 (5.2 miles


 According to the data from the years 2002 - 2018 the average number of fire incidents per year is 6. The highest number of reported fire incidents - 18 took place in 2009, and the least - 0 in 2003. The data has a rising trend.
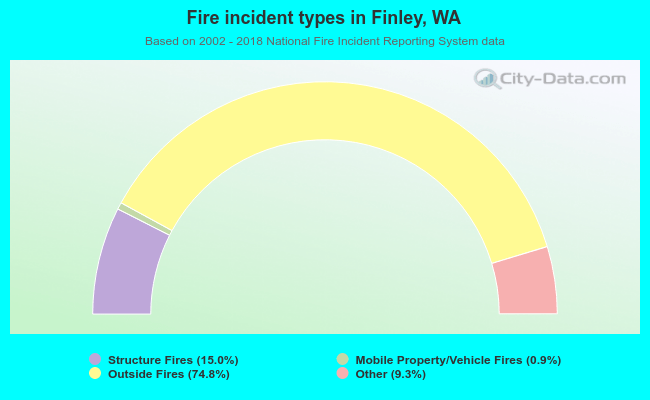 When looking into fire subcategories, the most reports belonged to: Outside Fires (74.8%), and Structure Fires (15.0%).