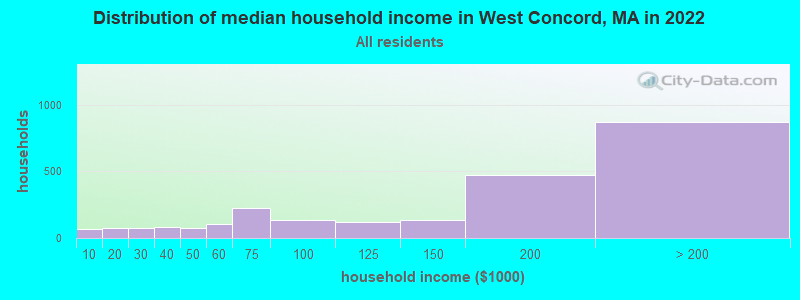
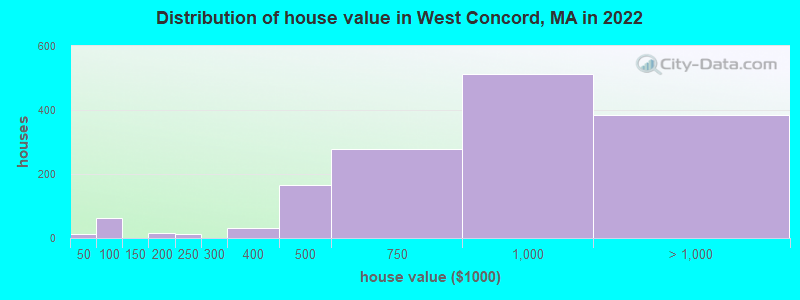
Estimated median house or condo value in 2022: $856,030 (it was $351,600 in 2000)
West Concord:
$856,030
MA:
$534,700
Mean prices in 2022:all housing units: $952,308; detached houses: over $1,000,000; townhouses or other attached units: $935,940; in 2-unit structures: $882,843; in 3-to-4-unit structures: $593,032; in 5-or-more-unit structures: $493,566
Median gross rent in 2022: $2,440.
March 2022 cost of living index in West Concord: 137.5 (high, U.S. average is 100)
Percentage of residents living in poverty in 2022: 4.2%
(3.1% for White Non-Hispanic residents, 12.1% for Black residents, 7.4% for Hispanic or Latino residents, 8.3% for other race residents, 16.5% for two or more races residents)
Ancestries: Irish (9.7%), English (7.6%), Haitian (6.3%), European (5.4%), German (5.3%), Italian (4.5%).
Current Local Time: EST time zone
Elevation: 131 feet
Land area: 3.41 square miles.
Population density: 1,768 people per square mile (low).
999 residents are foreign born (5.8% Europe, 3.4% Asia, 3.4% Latin America, 1.7% Africa).
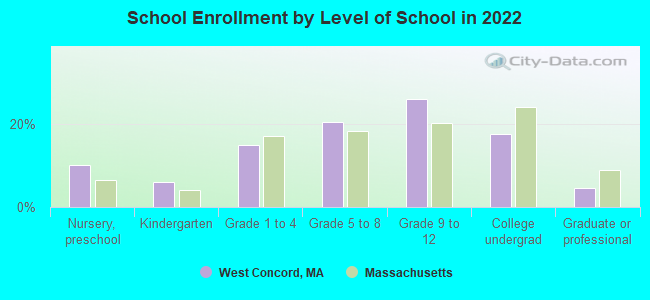
This place:
15.5%
Massachusetts:
17.6%
Median real estate property taxes paid for housing units with mortgages in 2022: $9,730 (1.1%) Median real estate property taxes paid for housing units with no mortgage in 2022: $8,396 (1.2%)
Nearest city with pop. 50,000+: Waltham, MA (9.9 miles , pop. 59,226).
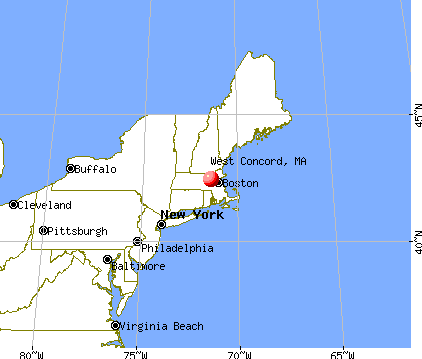
Nearest city with pop. 200,000+: Boston, MA (18.4 miles , pop. 589,141).
Nearest city with pop. 1,000,000+: Bronx, NY (169.4 miles , pop. 1,332,650).
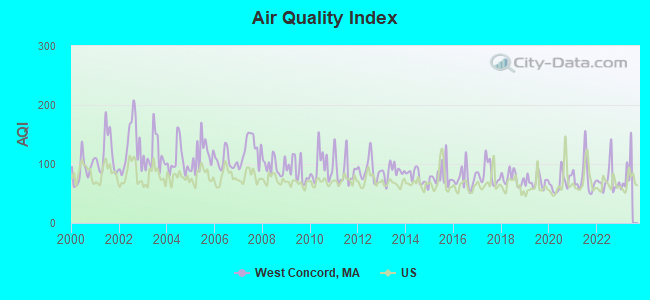
Air Quality Index (AQI) level in 2022 was 73.1. This is about average.
City:
73.1
U.S.:
72.6
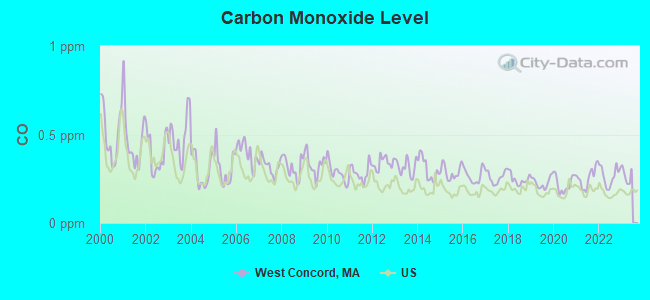
Carbon Monoxide (CO) [ppm] level in 2022 was 0.266. This is about average.Closest monitor was 10.1 miles away from the city center.
City:
0.266
U.S.:
0.251
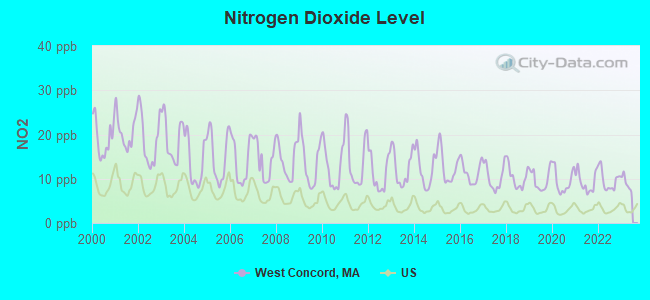
Nitrogen Dioxide (NO2) [ppb] level in 2022 was 9.60. This is significantly worse than average.Closest monitor was 4.6 miles away from the city center.
City:
9.60
U.S.:
5.11
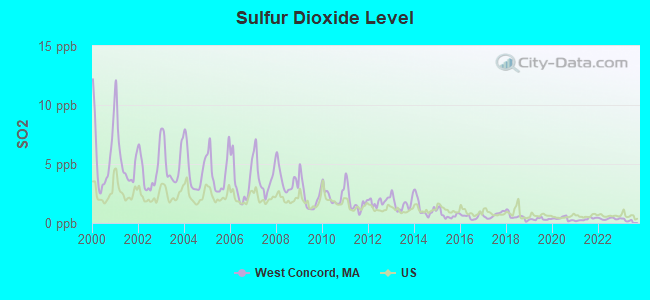
Sulfur Dioxide (SO2) [ppb] level in 2022 was 0.363. This is significantly better than average.Closest monitor was 4.6 miles away from the city center.
City:
0.363
U.S.:
1.515
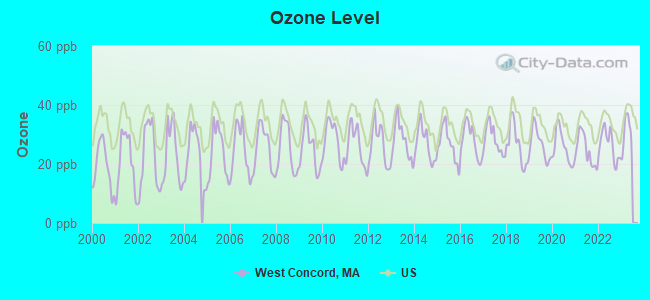
Ozone [ppb] level in 2022 was 26.5. This is better than average.Closest monitor was 7.5 miles away from the city center.
City:
26.5
U.S.:
33.3
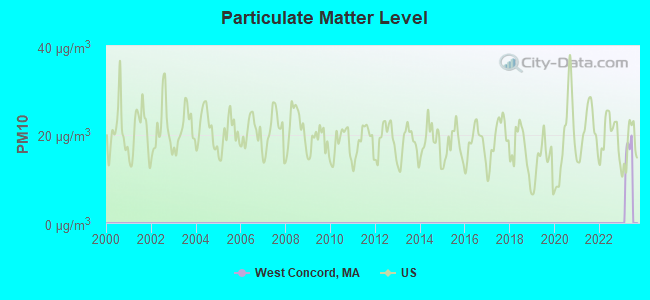
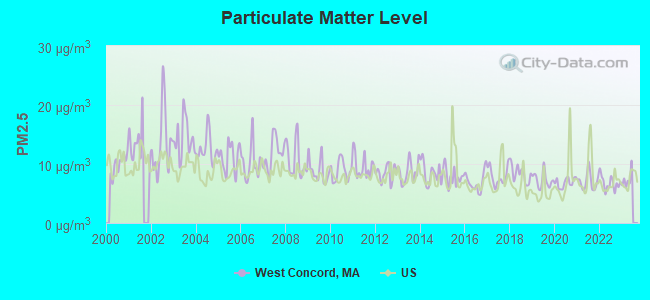
Particulate Matter (PM2.5) [µg/m3] level in 2022 was 6.76. This is about average.Closest monitor was 5.1 miles away from the city center.
City:
6.76
U.S.:
8.11
Tornado activity:
West Concord-area historical tornado activity is slightly above Massachusetts state average. It is 31% smaller than the overall U.S. average.
On 6/9/1953, a category F4 (max. wind speeds 207-260 mph) tornado 12.3 miles away from the West Concord place center killed 90 peopleand injured 1228 peopleand causedbetween $50,000,000 and $500,000,000 in damages.
On 10/3/1970, a category F3 (max. wind speeds 158-206 mph) tornado 10.0 miles away from the place center killed one personand causedbetween $50,000 and $500,000 in damages.
Earthquake activity:
West Concord-area historical earthquake activity is significantly above Massachusetts state average. It is 72% smaller than the overall U.S. average.
On 10/7/1983 at 10:18:46, a magnitude 5.3 (5.1 MB, 5.3 LG, 5.1 ML, Class: Moderate, Intensity: VI - VII) earthquake occurred 180.9 miles away from West Concord center On 4/20/2002 at 10:50:47, a magnitude 5.3 (5.3 ML, Depth: 3.0 mi) earthquake occurred 183.1 miles away from West Concord center On 1/19/1982 at 00:14:42, a magnitude 4.7 (4.5 MB, 4.7 MD, 4.5 LG, Class: Light, Intensity: IV - V) earthquake occurred 73.0 miles away from West Concord center On 4/20/2002 at 10:50:47, a magnitude 5.2 (5.2 MB, 4.2 MS, 5.2 MW, 5.0 MW) earthquake occurred 182.4 miles away from the city center On 10/16/2012 at 23:12:25, a magnitude 4.7 (4.7 ML, Depth: 10.0 mi) earthquake occurred 87.5 miles away from the city center On 8/22/1992 at 12:20:32, a magnitude 4.8 (4.8 MB, 3.8 MS, 4.7 LG, Depth: 6.2 mi) earthquake occurred 238.4 miles away from West Concord center Magnitude types: regional Lg-wave magnitude (LG), body-wave magnitude (MB), duration magnitude (MD), local magnitude (ML), surface-wave magnitude (MS), moment magnitude (MW)
Natural disasters:
The number of natural disasters in Middlesex County (31) is a lot greater than the US average (15). Major Disasters (Presidential) Declared: 17 Emergencies Declared: 14
Causes of natural disasters: Floods: 12, Storms: 9, Hurricanes: 6, Snowstorms: 6, Winter Storms: 5, Blizzards: 2, Snows: 2, Explosion: 1, Heavy Rain: 1, Snowfall: 1, Water Main Break: 1, Wind: 1 (Note: some incidents may be assigned to more than one category).
Hospitals and medical centers in West Concord:
HOSPICE PROGRAM - EMERSON HOSPITAL (OLD ROAD TO NINE ACRE CORNER)
EMERSON REHABILITATION AND TRANSITIONAL CARE UNIT (OLD ROAD TO NINE ACRE CORNER)
KINDRED NURSING AND REHABILITATION-WALDEN (785 MAIN STREET)
Amtrak stations near West Concord:
13 miles: FRAMINGHAM (443 WAVERLY ST.) . Services: public payphones, snack bar, paid short-term parking, taxi stand, public transit connection.
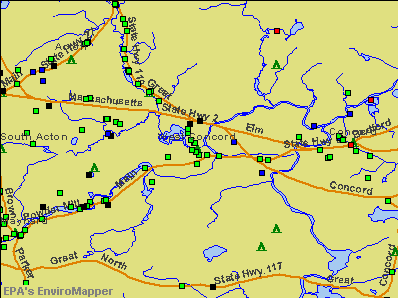
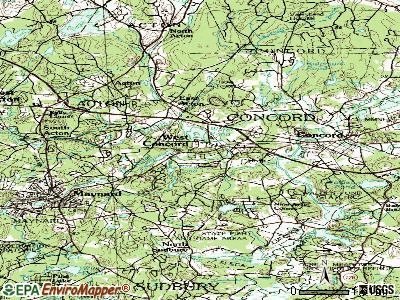
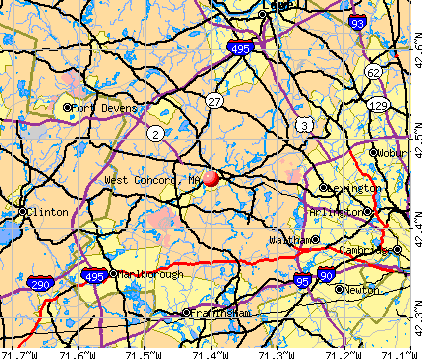
Notable locations in West Concord: West Concord Station (A), Concord Country Club (B), Concord Fire Department Station 2 (C), Massachusetts Correctional Institute at Concord Library (D). Display/hide their locations on the map
Middlesex County has a predicted average indoor radon screening level greater than 4 pCi/L (pico curies per liter) - Highest Potential
Average household size:
This place:
2.3 people
Massachusetts:
2.5 people
Percentage of family households:
This place:
62.7%
Whole state:
63.0%
Percentage of households with unmarried partners:
This place:
3.6%
Whole state:
7.0%
Likely homosexual households (counted as self-reported same-sex unmarried-partner households)
Lesbian couples: 0.6% of all households
Gay men: 0.3% of all households
1,122 people in state prisons in 2010
14 people in group homes intended for adults in 2010
1,048 people in state prisons in 2000
17 people in homes for the mentally ill in 2000
Banks with branches in West Concord (2011 data):
Middlesex Savings Bank: West Concord Branch at 1208 Main Street, branch established on 1970/12/01. Info updated 2009/07/16: Bank assets: $4,034.8 mil, Deposits: $3,490.0 mil, headquarters in Natick, MA, positive income, Mortgage Lending Specialization, 33 total offices, Holding Company: Middlesex Bancorp Mhc
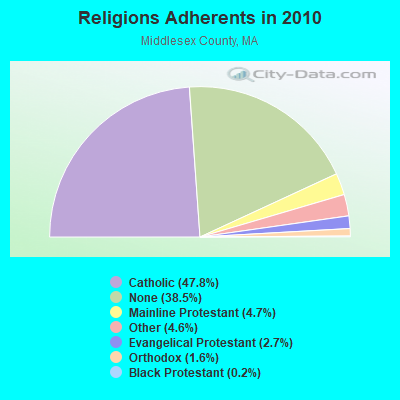
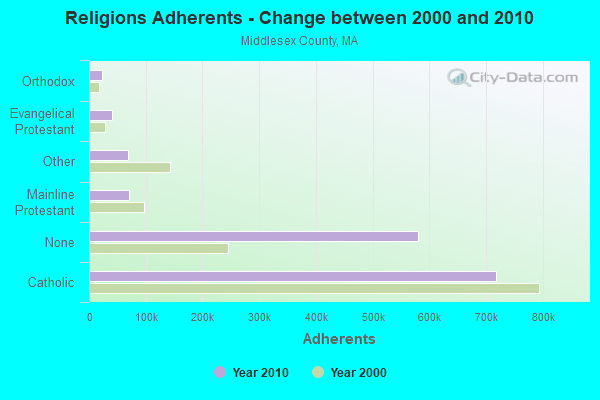
Religion statistics for West Concord, MA (based on Middlesex County data)
Religion
Adherents
Congregations
Catholic
718,209
107
Mainline Protestant
70,053
269
Other
68,480
199
Evangelical Protestant
41,270
304
Orthodox
23,641
28
Black Protestant
2,276
8
None
579,156
-
Source: Clifford Grammich, Kirk Hadaway, Richard Houseal, Dale E.Jones, Alexei Krindatch, Richie Stanley and Richard H.Taylor. 2012. 2010 U.S.Religion Census: Religious Congregations & Membership Study. Association of Statisticians of American Religious Bodies. Jones, Dale E., et al. 2002. Congregations and Membership in the United States 2000. Nashville, TN: Glenmary Research Center. Graphs represent county-level data
State Police Barracks Elm St Rt 2 (Lat: 42.469250 Lon: -71.392278), Call Sign: KCB928, Licensee ID: L00003516, Assigned Frequencies: 44.7400 MHz, Grant Date: 12/11/2015, Expiration Date: 02/26/2026, Registrant: Massachusetts Commonwealth Of, Department Of State Police, 470 Worcester Rd, Framingham, MA 01702, Phone: (508) 820-2222, Fax: (774) 462-3768, Email:
Lat: 42.455806 Lon: -71.387139, Call Sign: WQOV542, Assigned Frequencies: 462.262 MHz, 467.262 MHz, Grant Date: 02/09/2012, Expiration Date: 02/09/2022, Cancellation Date: 04/16/2022, Certifier: Peter Rappoccio, Registrant: Cara Enterprises Inc, Las Vegas, NV 89140-0124, Phone: (702) 838-9728, Fax: (702) 363-4607, Email:
Lat: 42.455806 Lon: -71.387139, Call Sign: WSBN973, Assigned Frequencies: 462.262 MHz, 467.262 MHz, Grant Date: 03/05/2024, Expiration Date: 03/05/2034, Certifier: Peter Rappoccio, Registrant: Cara Enterprises Inc, Las Vegas, NV 89140-0124, Phone: (702) 838-9728, Fax: (702) 363-4607, Email:
FCC Registered Microwave Towers:
1
MIDDLESEX, Lat: 42.479472 Lon: -71.396500, Type: Building, Structure height: 11 m, Overall height: 13 m, Call Sign: WQVK773, Licensee ID: L01184639, Assigned Frequencies: 3650.00 MHz, Grant Date: 03/13/2015, Expiration Date: 03/13/2025, Certifier: Thomas Wierimaa, Registrant: Onvoy Spectrum, LLC
FCC Registered Amateur Radio Licenses:
1
Call Sign: KB1DTA, Previous Call Sign: KB3DHX, Grant Date: 03/08/1999, Expiration Date: 06/10/2006, Cancellation Date: 06/11/2008, Registrant: Michael E Gallagher, West Concord, MA 01742
Home Mortgage Disclosure Act Aggregated Statistics For Year 2009 (Based on 1 partial tract)
A) FHA, FSA/RHS & VA Home Purchase Loans
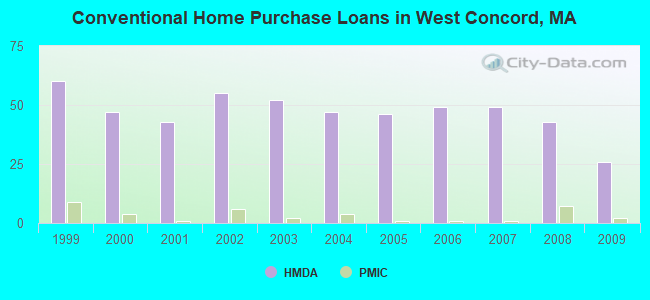
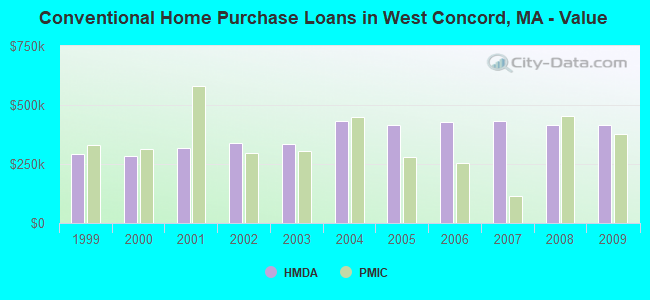
B) Conventional Home Purchase Loans
C) Refinancings
D) Home Improvement Loans
F) Non-occupant Loans on < 5 Family Dwellings (A B C & D)
Number
Average Value
Number
Average Value
Number
Average Value
Number
Average Value
Number
Average Value
LOANS ORIGINATED
4
$463,370
26
$413,322
170
$340,065
5
$424,262
3
$220,493
APPLICATIONS APPROVED, NOT ACCEPTED
0
$0
4
$503,102
7
$411,733
0
$0
0
$0
APPLICATIONS DENIED
0
$0
1
$448,100
18
$383,638
0
$0
1
$250,170
APPLICATIONS WITHDRAWN
0
$0
4
$626,350
24
$380,899
0
$0
1
$520,950
FILES CLOSED FOR INCOMPLETENESS
0
$0
1
$674,730
7
$430,759
0
$0
0
$0
Aggregated Statistics For Year 2008 (Based on 1 partial tract)
A) FHA, FSA/RHS & VA Home Purchase Loans
B) Conventional Home Purchase Loans
C) Refinancings
D) Home Improvement Loans
E) Loans on Dwellings For 5+ Families
F) Non-occupant Loans on < 5 Family Dwellings (A B C & D)
Number
Average Value
Number
Average Value
Number
Average Value
Number
Average Value
Number
Average Value
Number
Average Value
LOANS ORIGINATED
1
$322,280
43
$415,710
49
$382,736
4
$502,920
1
$882,960
9
$381,227
APPLICATIONS APPROVED, NOT ACCEPTED
0
$0
4
$370,842
3
$615,620
1
$5,150
0
$0
1
$288,430
APPLICATIONS DENIED
0
$0
7
$292,849
10
$356,716
1
$312,720
0
$0
1
$213,380
APPLICATIONS WITHDRAWN
0
$0
4
$254,035
7
$326,800
1
$300,940
0
$0
0
$0
FILES CLOSED FOR INCOMPLETENESS
0
$0
1
$566,570
1
$1,275,880
1
$412,050
0
$0
1
$294,320
Aggregated Statistics For Year 2007 (Based on 1 partial tract)
B) Conventional Home Purchase Loans
C) Refinancings
D) Home Improvement Loans
E) Loans on Dwellings For 5+ Families
F) Non-occupant Loans on < 5 Family Dwellings (A B C & D)
Number
Average Value
Number
Average Value
Number
Average Value
Number
Average Value
Number
Average Value
LOANS ORIGINATED
49
$430,173
40
$421,025
13
$144,160
0
$0
6
$464,412
APPLICATIONS APPROVED, NOT ACCEPTED
6
$352,448
6
$381,512
3
$241,343
1
$579,810
1
$303,890
APPLICATIONS DENIED
4
$514,140
17
$427,110
4
$387,030
0
$0
3
$414,010
APPLICATIONS WITHDRAWN
3
$279,360
6
$287,698
1
$220,740
0
$0
0
$0
FILES CLOSED FOR INCOMPLETENESS
1
$63,280
2
$277,765
0
$0
0
$0
1
$303,890
Aggregated Statistics For Year 2006 (Based on 1 partial tract)
B) Conventional Home Purchase Loans
C) Refinancings
D) Home Improvement Loans
E) Loans on Dwellings For 5+ Families
F) Non-occupant Loans on < 5 Family Dwellings (A B C & D)
Number
Average Value
Number
Average Value
Number
Average Value
Number
Average Value
Number
Average Value
LOANS ORIGINATED
49
$428,581
54
$366,824
11
$161,341
0
$0
10
$375,773
APPLICATIONS APPROVED, NOT ACCEPTED
1
$465,760
7
$409,420
3
$290,640
1
$103,010
0
$0
APPLICATIONS DENIED
4
$236,928
13
$390,144
4
$318,232
0
$0
1
$25,750
APPLICATIONS WITHDRAWN
11
$370,107
7
$522,629
1
$14,720
0
$0
1
$342,880
FILES CLOSED FOR INCOMPLETENESS
0
$0
5
$311,684
1
$155,990
0
$0
1
$242,810
Aggregated Statistics For Year 2005 (Based on 1 partial tract)
B) Conventional Home Purchase Loans
C) Refinancings
D) Home Improvement Loans
E) Loans on Dwellings For 5+ Families
F) Non-occupant Loans on < 5 Family Dwellings (A B C & D)
Number
Average Value
Number
Average Value
Number
Average Value
Number
Average Value
Number
Average Value
LOANS ORIGINATED
46
$415,983
65
$340,189
8
$198,206
1
$6,254,300
6
$278,990
APPLICATIONS APPROVED, NOT ACCEPTED
7
$595,473
11
$337,264
1
$29,430
0
$0
1
$294,320
APPLICATIONS DENIED
5
$427,794
13
$535,153
3
$107,427
0
$0
1
$167,760
APPLICATIONS WITHDRAWN
5
$450,310
11
$324,956
1
$55,190
0
$0
1
$206,020
FILES CLOSED FOR INCOMPLETENESS
1
$726,970
2
$404,690
1
$161,880
0
$0
1
$291,380
Aggregated Statistics For Year 2004 (Based on 1 partial tract)
B) Conventional Home Purchase Loans
C) Refinancings
D) Home Improvement Loans
E) Loans on Dwellings For 5+ Families
F) Non-occupant Loans on < 5 Family Dwellings (A B C & D)
Number
Average Value
Number
Average Value
Number
Average Value
Number
Average Value
Number
Average Value
LOANS ORIGINATED
47
$432,196
112
$367,657
13
$235,343
1
$440,740
6
$368,758
APPLICATIONS APPROVED, NOT ACCEPTED
9
$501,161
5
$412,636
1
$36,790
0
$0
0
$0
APPLICATIONS DENIED
3
$408,370
6
$325,347
3
$222,947
0
$0
0
$0
APPLICATIONS WITHDRAWN
4
$301,862
21
$376,695
1
$161,880
0
$0
2
$512,855
FILES CLOSED FOR INCOMPLETENESS
0
$0
5
$379,232
0
$0
0
$0
0
$0
Aggregated Statistics For Year 2003 (Based on 1 partial tract)
B) Conventional Home Purchase Loans
C) Refinancings
D) Home Improvement Loans
E) Loans on Dwellings For 5+ Families
F) Non-occupant Loans on < 5 Family Dwellings (A B C & D)
Number
Average Value
Number
Average Value
Number
Average Value
Number
Average Value
Number
Average Value
LOANS ORIGINATED
52
$336,247
328
$293,629
3
$89,523
1
$662,220
7
$193,936
APPLICATIONS APPROVED, NOT ACCEPTED
9
$380,000
24
$298,827
1
$95,650
0
$0
1
$80,200
APPLICATIONS DENIED
5
$492,986
28
$322,018
2
$117,730
0
$0
1
$208,970
APPLICATIONS WITHDRAWN
8
$370,200
11
$332,448
1
$22,070
0
$0
0
$0
FILES CLOSED FOR INCOMPLETENESS
1
$331,850
5
$305,504
0
$0
0
$0
0
$0
Aggregated Statistics For Year 2002 (Based on 1 partial tract)
B) Conventional Home Purchase Loans
C) Refinancings
D) Home Improvement Loans
F) Non-occupant Loans on < 5 Family Dwellings (A B C & D)
Number
Average Value
Number
Average Value
Number
Average Value
Number
Average Value
LOANS ORIGINATED
55
$338,267
230
$419,752
9
$69,002
5
$238,694
APPLICATIONS APPROVED, NOT ACCEPTED
10
$328,461
18
$250,458
3
$96,390
0
$0
APPLICATIONS DENIED
1
$531,980
16
$300,896
1
$386,300
0
$0
APPLICATIONS WITHDRAWN
7
$287,487
25
$304,916
1
$61,810
0
$0
FILES CLOSED FOR INCOMPLETENESS
4
$267,830
7
$332,687
0
$0
0
$0
Aggregated Statistics For Year 2001 (Based on 1 partial tract)
B) Conventional Home Purchase Loans
C) Refinancings
D) Home Improvement Loans
F) Non-occupant Loans on < 5 Family Dwellings (A B C & D)
Number
Average Value
Number
Average Value
Number
Average Value
Number
Average Value
LOANS ORIGINATED
43
$318,687
146
$298,760
13
$97,012
4
$212,830
APPLICATIONS APPROVED, NOT ACCEPTED
3
$167,273
13
$249,549
2
$125,085
0
$0
APPLICATIONS DENIED
4
$306,460
11
$189,569
5
$123,908
1
$4,410
APPLICATIONS WITHDRAWN
1
$498,140
10
$202,345
1
$183,950
0
$0
FILES CLOSED FOR INCOMPLETENESS
1
$367,900
8
$368,636
0
$0
0
$0
Aggregated Statistics For Year 2000 (Based on 1 partial tract)
B) Conventional Home Purchase Loans
C) Refinancings
D) Home Improvement Loans
F) Non-occupant Loans on < 5 Family Dwellings (A B C & D)
Number
Average Value
Number
Average Value
Number
Average Value
Number
Average Value
LOANS ORIGINATED
47
$282,203
33
$274,208
10
$49,446
5
$130,826
APPLICATIONS APPROVED, NOT ACCEPTED
4
$310,322
3
$208,967
3
$81,183
1
$44,150
APPLICATIONS DENIED
2
$342,515
6
$260,105
2
$74,315
0
$0
APPLICATIONS WITHDRAWN
1
$403,220
6
$334,788
2
$42,675
1
$1,361,230
FILES CLOSED FOR INCOMPLETENESS
1
$147,160
1
$222,950
0
$0
0
$0
Aggregated Statistics For Year 1999 (Based on 1 partial tract)
B) Conventional Home Purchase Loans
C) Refinancings
D) Home Improvement Loans
F) Non-occupant Loans on < 5 Family Dwellings (A B C & D)
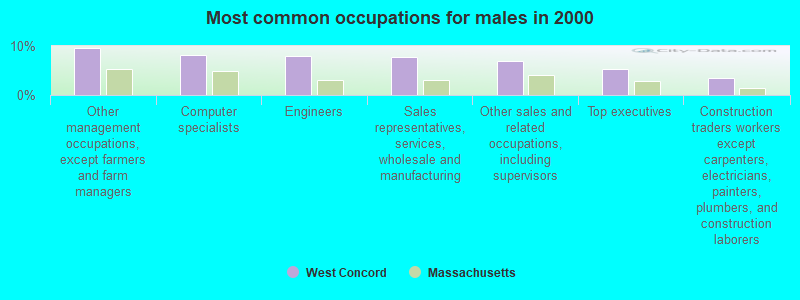
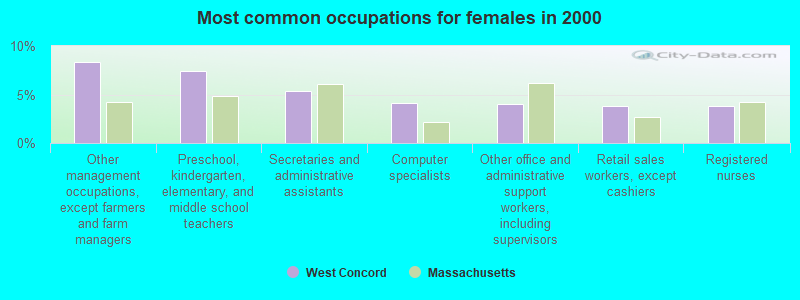
#36 on the list of "Top 101 cities with largest percentage of males in occupations: life, physical, and social science occupations (population 5,000+)"
#42 on the list of "Top 101 cities with largest percentage of females in occupations: life, physical, and social science occupations (population 5,000+)"
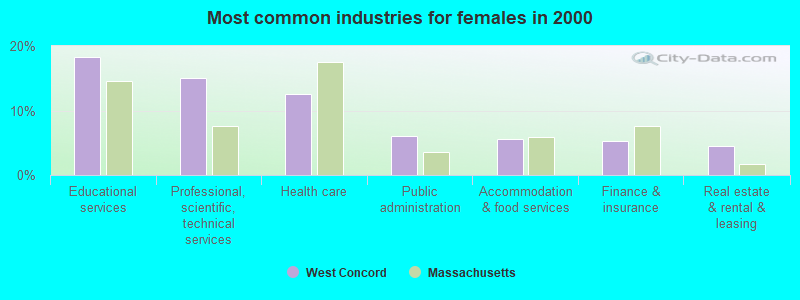
#56 on the list of "Top 101 cities with largest percentage of females in occupations: education, training, and library occupations (population 5,000+)"
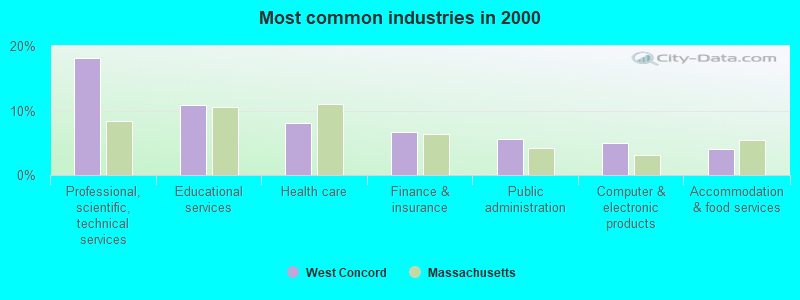
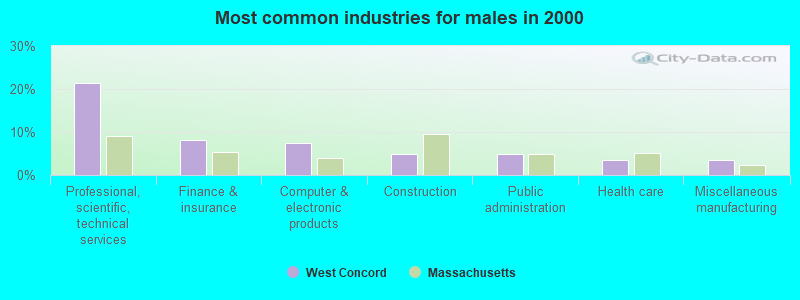
#62 on the list of "Top 101 cities with largest percentage of males in industries: professional, scientific, and technical services (population 5,000+)"
#62 on the list of "Top 101 cities with the most residents born in Other Northern Africa (population 500+)"
#89 on the list of "Top 101 cities with the most residents born in Greece (population 500+)"
#100 on the list of "Top 101 cities with the largest positive percentage difference between never married males and females (15+ years) (with at least 1,000 males never married)"
#91 (01742) on the list of "Top 101 zip codes with the highest 2012 average net capital gain/loss (pop 5,000+)"
#93 (01742) on the list of "Top 101 zip codes with the largest percentage of taxpayers reporting net capital gain/loss in 2012 (pop 5,000+)"
#4 on the list of "Top 101 counties with the most Orthodox adherents"
#7 on the list of "Top 101 counties with the most Catholic adherents"
#7 on the list of "Top 101 counties with the most Mainline Protestant congregations"
#7 on the list of "Top 101 counties with the most Orthodox congregations"
#8 on the list of "Top 101 counties with the lowest percentage of residents that keep firearms around their homes"


 Recent articles from our blog. Our writers, many of them Ph.D. graduates or candidates, create easy-to-read articles on a wide variety of topics.


 (9.9 miles