Monterey, California

Monterey: Monterey Bay - Fisherman Wharf Sunset
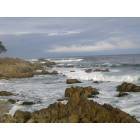
Monterey: Monterey Bay
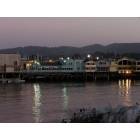
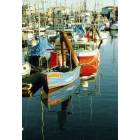
Monterey: Evening at Fishermans Wharf

Monterey: Sea Lion on Buoy
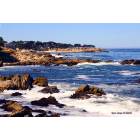
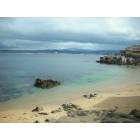
Monterey: Monterey Coastal Trail Vista (Pacific Grove)

Monterey: sunset on the Monterey Peninsula
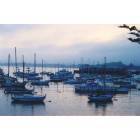
Monterey: harbor at sunrise
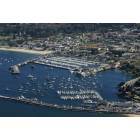
Monterey: An aerial view of Old Fisherman's Wharf on Monterey Harbor
Monterey: Monterey Bay - Reflection
Monterey: Monterey_Feb_07
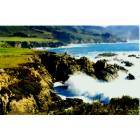
Monterey: big sur
- see
55
more - add
your
Submit your own pictures of this city and show them to the world
- OSM Map
- General Map
- Google Map
- MSN Map
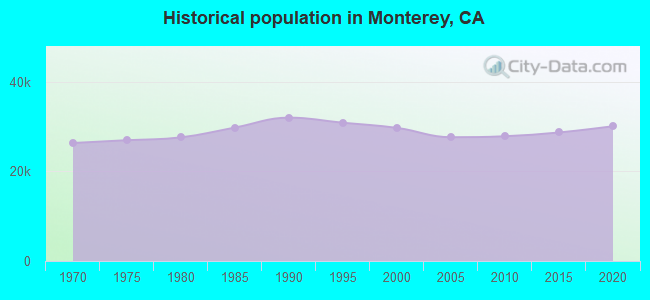
Population change since 2000: -0.3%
 |
| Males: 14,905 | |
| Females: 14,666 |
| Median resident age: | 37.5 years |
| California median age: | 37.9 years |
Zip codes: 93943.
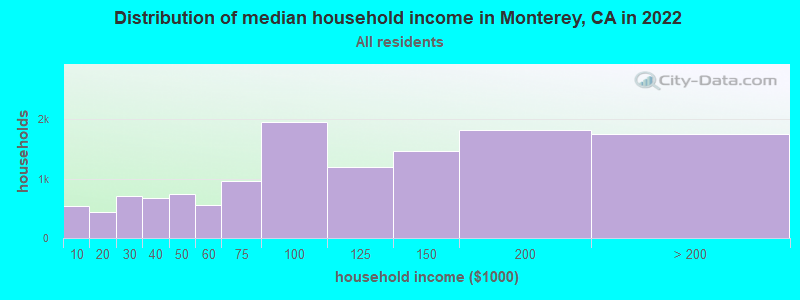
| Monterey: | $99,937 |
| CA: | $91,551 |
Estimated per capita income in 2022: $56,223 (it was $27,133 in 2000)
Monterey city income, earnings, and wages data
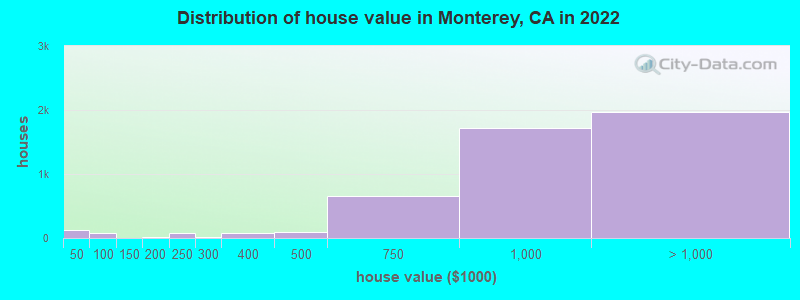
Estimated median house or condo value in 2022: $995,737 (it was $392,200 in 2000)
| Monterey: | $995,737 |
| CA: | $715,900 |
Mean prices in 2022: all housing units: over $1,000,000; detached houses: over $1,000,000; townhouses or other attached units: $664,388; in 2-unit structures: $702,483; in 3-to-4-unit structures: over $1,000,000; in 5-or-more-unit structures: $378,007
Median gross rent in 2022: $2,237.
(7.1% for White Non-Hispanic residents, 10.1% for Black residents, 22.6% for Hispanic or Latino residents, 53.7% for American Indian residents, 34.4% for other race residents, 7.0% for two or more races residents)
Detailed information about poverty and poor residents in Monterey, CA


Compare current foreclosures in Monterey, CA:
| Photo | Address | Area | Beds / Baths | Price | Details |
|---|---|---|---|---|---|

|
#1
Belavida Rd
Monterey, CA 93940
|
5,790 sq. feet
|
5 baths 5 beds |
show details | |

|
#2
Work Ave
Monterey, CA 93940
|
2,048 sq. feet
|
3 baths 4 beds |
show details | |

|
#3
Logan Ln
Monterey, CA 93940
|
1,439 sq. feet
|
2 baths 3 beds |
show details | |

|
#4
Laguna Grande Ct
Monterey, CA 93940
|
1,286 sq. feet
|
2 baths 3 beds |
show details | |

|
#5
Castro Rd
Monterey, CA 93940
|
2,604 sq. feet
|
2 baths 1 beds |
show details | |

|
#6
Cypress St
Monterey, CA 93940
|
1,013 sq. feet
|
2 baths 3 beds |
show details | |

|
#7
Beach Way
Monterey, CA 93940
|
2,080 sq. feet
|
3 baths 3 beds |
show details | |

|
#8
Via Verde
Monterey, CA 93940
|
1,302 sq. feet
|
1 baths 3 beds |
show details | |

|
#9
Lily St
Monterey, CA 93940
|
1,386 sq. feet
|
1 baths 2 beds |
show details | |

|
#10
1st St
Monterey, CA 93940
|
1,016 sq. feet
|
3 baths 3 beds |
show details |
| Photo | Address | Area | Beds / Baths | Price | Details |
|---|---|---|---|---|---|

|
#11
Forest Ridge Rd Unit 6
Monterey, CA 93940
|
- sq. feet
|
2 baths 2 beds |
show details | |

|
#12
Casanova Ave
Monterey, CA 93940
|
- sq. feet
|
1 baths 2 beds |
show details | |

|
#13
Pheasant Ridge Rd
Monterey, CA 93940
|
- sq. feet
|
2 baths 2 beds |
show details | |

|
#14
Rosita Rd
Monterey, CA 93940
|
- sq. feet
|
1 baths 3 beds |
show details | |

|
#15
Madison St
Monterey, CA 93940
|
- sq. feet
|
- baths - beds |
show details | |

|
#16
Casanova Ave Apt 13
Monterey, CA 93940
|
- sq. feet
|
- baths - beds |
show details | |

|
#17
Upper Ragsdale Dr Ste B280
Monterey, CA 93940
|
- sq. feet
|
- baths - beds |
show details | |

|
#18
Monroe St
Monterey, CA 93940
|
- sq. feet
|
- baths - beds |
show details | |

|
#19
Montecito Ave Apt P
Monterey, CA 93940
|
- sq. feet
|
- baths - beds |
show details | |

|
#20
Washington St, Ste B Pmb 311
Monterey, CA 93940
|
- sq. feet
|
- baths - beds |
show details |
| Photo | Address | Area | Beds / Baths | Price | Details |
|---|---|---|---|---|---|

|
#21
Dela Vina Ave Apt 103
Monterey, CA 93940
|
- sq. feet
|
- baths - beds |
show details | |

|
#22
Johnson St
Monterey, CA 93940
|
- sq. feet
|
- baths - beds |
show details | |

|
#23
Skyline Dr
Monterey, CA 93940
|
- sq. feet
|
- baths - beds |
show details | |

|
#24
Glenwood Cir
Monterey, CA 93940
|
6,790 sq. feet
|
- baths - beds |
show details | |

|
#25
Portola Dr
Monterey, CA 93940
|
- sq. feet
|
- baths - beds |
show details | |

|
#26
Archer St
Monterey, CA 93940
|
- sq. feet
|
- baths - beds |
show details | |

|
#27
Camino Aguajito Apt 301
Monterey, CA 93940
|
- sq. feet
|
- baths - beds |
show details | |

|
#28
Withers Ave Apt 12
Monterey, CA 93940
|
- sq. feet
|
- baths - beds |
show details | |

|
#29
Hawthorne St Apt 6
Monterey, CA 93940
|
- sq. feet
|
- baths - beds |
show details | |

|
#30
Ricketts Rd Apt A
Monterey, CA 93940
|
- sq. feet
|
- baths - beds |
show details |
| Photo | Address | Area | Beds / Baths | Price | Details |
|---|---|---|---|---|---|

|
#31
Yerba Buena Ct
Monterey, CA 93940
|
- sq. feet
|
- baths - beds |
show details | |

|
#32
Josselyn Canyon Rd Apt B1
Monterey, CA 93940
|
- sq. feet
|
- baths - beds |
show details | |

|
#33
Tanglewood
Monterey, CA 93940
|
- sq. feet
|
- baths - beds |
show details | |

|
Check over 1 million property listings on Foreclosure.com!
|
browse all offers | |||


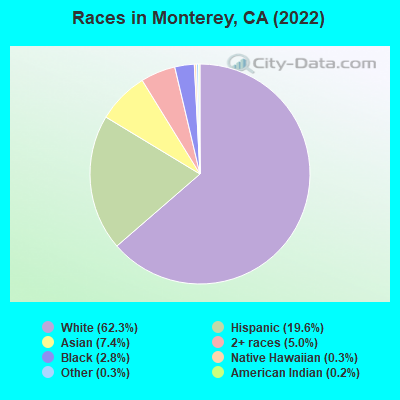
- 18,48962.3%White alone
- 5,81419.6%Hispanic
- 2,2017.4%Asian alone
- 1,4955.0%Two or more races
- 8212.8%Black alone
- 1000.3%Native Hawaiian and Other
Pacific Islander alone - 870.3%Other race alone
- 670.2%American Indian alone
According to our research of California and other state lists, there were 41 registered sex offenders living in Monterey, California as of April 25, 2024.
The ratio of all residents to sex offenders in Monterey is 703 to 1.
The ratio of registered sex offenders to all residents in this city is near the state average.
Type |
2009 |
2010 |
2011 |
2012 |
2013 |
2014 |
2015 |
2016 |
2017 |
2018 |
2019 |
2020 |
2022 |
|---|---|---|---|---|---|---|---|---|---|---|---|---|---|
| Murders (per 100,000) | 1 (3.6) | 1 (3.6) | 2 (7.1) | 1 (3.5) | 1 (3.4) | 0 (0.0) | 3 (10.5) | 1 (3.5) | 0 (0.0) | 0 (0.0) | 0 (0.0) | 0 (0.0) | 1 (3.4) |
| Rapes (per 100,000) | 15 (54.4) | 7 (25.2) | 6 (21.3) | 10 (35.1) | 10 (34.1) | 19 (66.6) | 13 (45.6) | 15 (52.6) | 17 (59.5) | 18 (62.6) | 11 (38.8) | 15 (53.2) | 12 (40.4) |
| Robberies (per 100,000) | 49 (177.8) | 33 (118.7) | 40 (142.2) | 27 (94.7) | 38 (129.5) | 31 (108.7) | 42 (147.4) | 29 (101.7) | 58 (202.9) | 35 (121.8) | 23 (81.2) | 22 (78.0) | 19 (64.0) |
| Assaults (per 100,000) | 123 (446.4) | 113 (406.3) | 140 (497.6) | 115 (403.4) | 71 (242.0) | 65 (228.0) | 78 (273.8) | 55 (192.9) | 50 (174.9) | 59 (205.3) | 44 (155.3) | 59 (209.2) | 79 (265.9) |
| Burglaries (per 100,000) | 187 (678.7) | 211 (758.7) | 229 (813.9) | 274 (961.1) | 220 (749.9) | 166 (582.2) | 167 (586.2) | 199 (698.1) | 162 (566.8) | 204 (709.7) | 127 (448.2) | 130 (460.8) | 84 (282.7) |
| Thefts (per 100,000) | 766 (2,780) | 913 (3,283) | 920 (3,270) | 704 (2,469) | 835 (2,846) | 790 (2,771) | 755 (2,650) | 816 (2,863) | 964 (3,373) | 859 (2,988) | 774 (2,731) | 706 (2,503) | 537 (1,808) |
| Auto thefts (per 100,000) | 46 (166.9) | 59 (212.2) | 41 (145.7) | 38 (133.3) | 53 (180.7) | 66 (231.5) | 76 (266.8) | 68 (238.5) | 80 (279.9) | 80 (278.3) | 74 (261.1) | 67 (237.5) | 52 (175.0) |
| Arson (per 100,000) | 6 (21.8) | 5 (18.0) | 8 (28.4) | 8 (28.1) | 2 (6.8) | 9 (31.6) | 5 (17.5) | 3 (10.5) | 5 (17.5) | 3 (10.4) | 4 (14.1) | 4 (14.2) | 6 (20.2) |
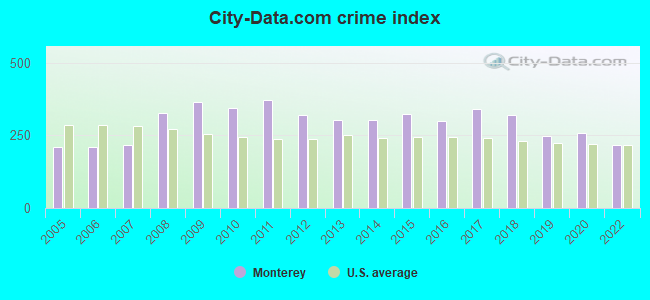
| City-Data.com crime index | 365.5 | 345.6 | 372.9 | 320.9 | 302.1 | 301.6 | 324.9 | 300.7 | 340.4 | 319.2 | 248.0 | 259.1 | 217.5 |
The City-Data.com crime index weighs serious crimes and violent crimes more heavily. Higher means more crime, U.S. average is 246.1. It adjusts for the number of visitors and daily workers commuting into cities.
Crime rate in Monterey detailed stats: murders, rapes, robberies, assaults, burglaries, thefts, arson
Full-time law enforcement employees in 2021, including police officers: 65 (48 officers - 42 male; 6 female).
| Officers per 1,000 residents here: | 1.68 |
| California average: | 2.30 |
 Recent articles from our blog. Our writers, many of them Ph.D. graduates or candidates, create easy-to-read articles on a wide variety of topics.

 | The Monterey area may get a huge desalination plant. (10 replies) |
| Any Monterey tennis enthusiasts out there? (4 replies) |
| Living in Monterey: COL, Crime, Elitism & Racial relations (27 replies) |
| Hello Monterey from MtnSurfer!! (18 replies) |
| Moving to Monterey Area (3 replies) |
| Very sad drowning for the Monterey Community (2 replies) |
Latest news from Monterey, CA collected exclusively by city-data.com from local newspapers, TV, and radio stations
Ancestries: Italian (9.3%), English (7.3%), Irish (7.0%), German (6.5%), European (4.7%), American (4.6%).
Current Local Time: PST time zone
Elevation: 60 feet
Land area: 8.44 square miles.
Population density: 3,505 people per square mile (average).
4,864 residents are foreign born (6.5% Asia, 5.1% Latin America, 3.8% Europe).
| This city: | 16.4% |
| California: | 26.5% |
Median real estate property taxes paid for housing units with mortgages in 2022: $5,845 (0.6%)
Median real estate property taxes paid for housing units with no mortgage in 2022: $3,672 (0.4%)
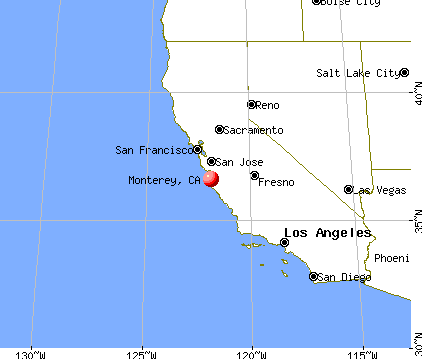
Nearest city with pop. 50,000+: Salinas, CA  (14.9 miles , pop. 151,060).
Nearest city with pop. 200,000+: San Jose, CA (48.7 miles , pop. 894,943).
Nearest city with pop. 1,000,000+: Los Angeles, CA (263.7 miles , pop. 3,694,820).
Nearest cities:
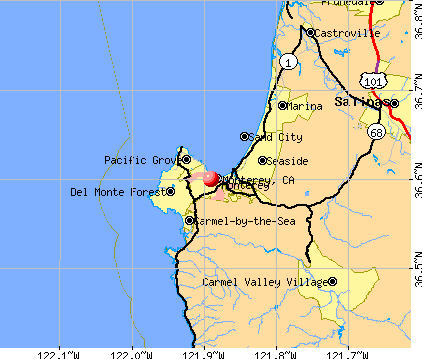
), ), Latitude: 36.60 N, Longitude: 121.89 W
Daytime population change due to commuting: +14,412 (+48.6%)
Workers who live and work in this city: 11,174 (65.9%)
Area code: 831
Property values in Monterey, CA
Detailed articles:
- Monterey: Introduction
- Monterey Basic Facts
- Monterey: Communications
- Monterey: Convention Facilities
- Monterey: Economy
- Monterey: Education and Research
- Monterey: Geography and Climate
- Monterey: Health Care
- Monterey: History
- Monterey: Municipal Government
- Monterey: Population Profile
- Monterey: Recreation
- Monterey: Transportation
Monterey tourist attractions:
- Monterey Bay Aquarium - Monterey, California - aquarium celebrating the animals of Monterey Bay
- Clarion Hotel
- Cannery Row IMAX Theatre
- Cannery Row Heritage Rail Car
- California Views Historical Archives
- 17-Mile Drive Monterey Peninsula
- A Taste of Monterey
- Monterey History and Maritime Museum
- Andrew Molera State Park
- Monterey Plaza Hotel & Spa
- Colton Hall Museum Monterey
- Cooper-Molera Adobe
- Doc Rickett's Pacific Biological Laboratories
- Don Dahvee Park, Monterey
- Garrapata State Park
- Garrapata Beach
- Larkin House
- La Mirada, Monterey
- Lake San Antonio, Monterey
- Lovers Point Park
- Lovers Point
- InterContinental The Clement Monterey
- Marine Museum of Monterey
- Portola Hotel & Spa at Monterey Bay
- Hyatt Regency Monterey Hotel and Spa
- Mission Basilica
- Monarch Grove Sanctuary
- Golden State Theatre
- Monterey Bay National Marine Sanctuary
- Monterey Bay
- Monterey County Vintners and Growers Association
- Monterey Mirror Maze and Lazer Challenge
- Monterey Museum of Art
- Monterey Peninsula Recreational Trail
- Monterey State Historic Park
- Monterey- Carmel Spanish History Tour
- Bella on the Bay
- Monterey Bay Inn
- Monterey Marriott
- Spindrift Inn
- Jacks Peak County Park
- Point Pinos Lighthouse
- Point Montara
- Presidio Museum
- Perry House
- Partington Point
- Pebble Beach Equestrian Center
- Pebble Beach Golf Course
- Old Fisherman's Wharf
- Pacific Grove Museum of Natural History
- Pacific Grove Ocean View Boulevard
- Pacific House Museum
- Holiday Inn Express Monterey
- Comfort Inn Monterey by the Sea
- Stanton Center
- Steinbeck's Spirit of Monterey Wax Museum
- Stevenson House
- Dennis the Menace Park
- Monterey County Youth Museum
- Ventana Vineyards
- Waterfront
- Hilton Garden Inn Monterey
- Hotel Pacific
- Splash Zone
- Spyglass Hill Golf Course
- Best Western Victorian Inn
- Casa Munras, A Larkspur Collection Hotel
- Hotel Abrego
Monterey, California accommodation & food services, waste management - Economy and Business Data
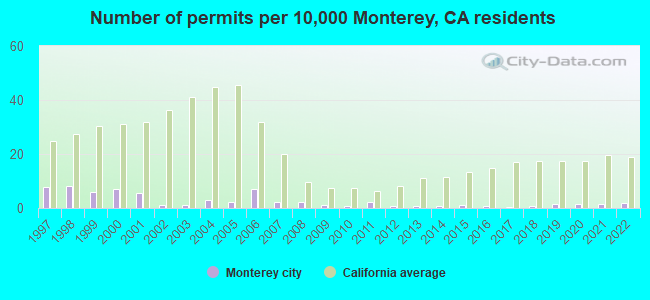
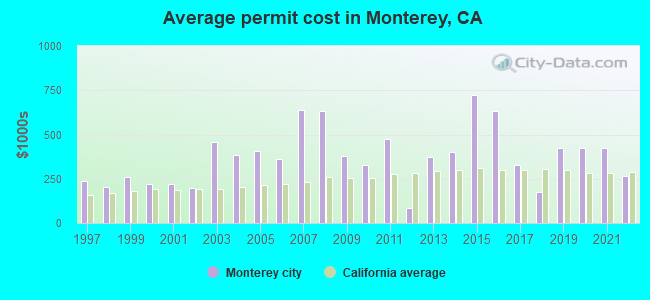
Single-family new house construction building permits:
- 2022: 6 buildings, average cost: $264,700
- 2021: 4 buildings, average cost: $425,000
- 2020: 4 buildings, average cost: $425,000
- 2019: 4 buildings, average cost: $425,000
- 2018: 2 buildings, average cost: $175,300
- 2017: 1 building, cost: $325,000
- 2016: 2 buildings, average cost: $632,900
- 2015: 3 buildings, average cost: $721,500
- 2014: 2 buildings, average cost: $399,500
- 2013: 2 buildings, average cost: $375,400
- 2012: 2 buildings, average cost: $87,200
- 2011: 7 buildings, average cost: $476,000
- 2010: 2 buildings, average cost: $328,300
- 2009: 3 buildings, average cost: $379,500
- 2008: 7 buildings, average cost: $631,400
- 2007: 7 buildings, average cost: $639,700
- 2006: 21 buildings, average cost: $360,200
- 2005: 7 buildings, average cost: $404,700
- 2004: 9 buildings, average cost: $383,600
- 2003: 3 buildings, average cost: $458,800
- 2002: 3 buildings, average cost: $199,500
- 2001: 16 buildings, average cost: $221,000
- 2000: 21 buildings, average cost: $218,300
- 1999: 18 buildings, average cost: $258,200
- 1998: 24 buildings, average cost: $205,200
- 1997: 23 buildings, average cost: $239,200
| Here: | 2.9% |
| California: | 5.1% |
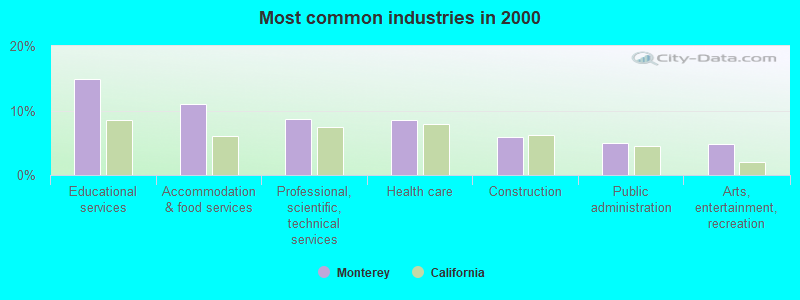
- Educational services (14.9%)
- Accommodation & food services (11.0%)
- Professional, scientific, technical services (8.6%)
- Health care (8.5%)
- Construction (6.0%)
- Public administration (4.9%)
- Arts, entertainment, recreation (4.7%)
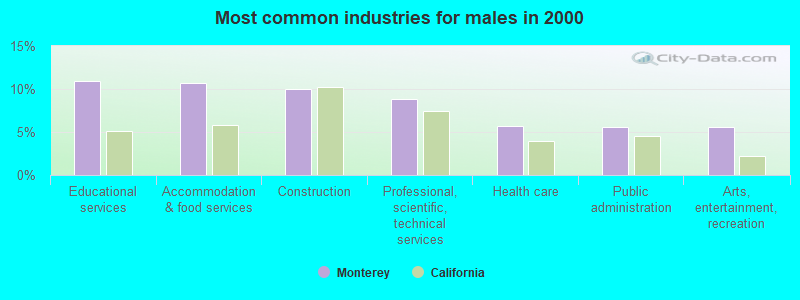
- Educational services (10.9%)
- Accommodation & food services (10.6%)
- Construction (10.0%)
- Professional, scientific, technical services (8.8%)
- Health care (5.7%)
- Public administration (5.6%)
- Arts, entertainment, recreation (5.6%)
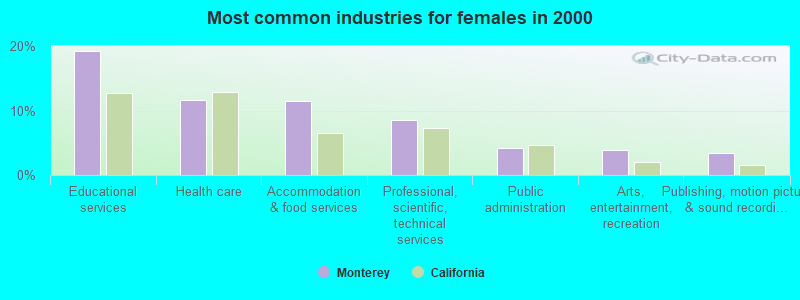
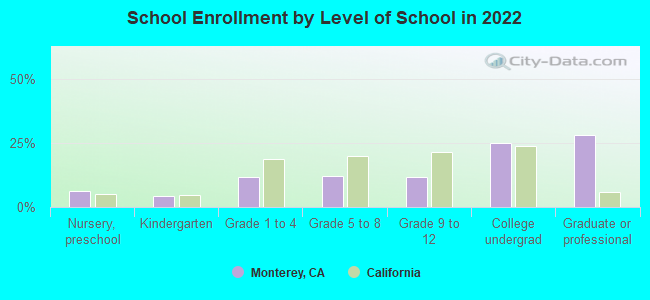
- Educational services (19.3%)
- Health care (11.6%)
- Accommodation & food services (11.4%)
- Professional, scientific, technical services (8.5%)
- Public administration (4.2%)
- Arts, entertainment, recreation (3.8%)
- Publishing, motion picture & sound recording industries (3.4%)
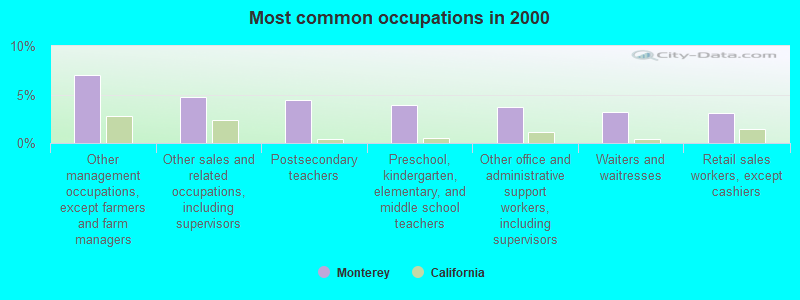
- Other management occupations, except farmers and farm managers (7.0%)
- Other sales and related occupations, including supervisors (4.7%)
- Postsecondary teachers (4.5%)
- Preschool, kindergarten, elementary, and middle school teachers (4.0%)
- Other office and administrative support workers, including supervisors (3.8%)
- Waiters and waitresses (3.2%)
- Retail sales workers, except cashiers (3.1%)
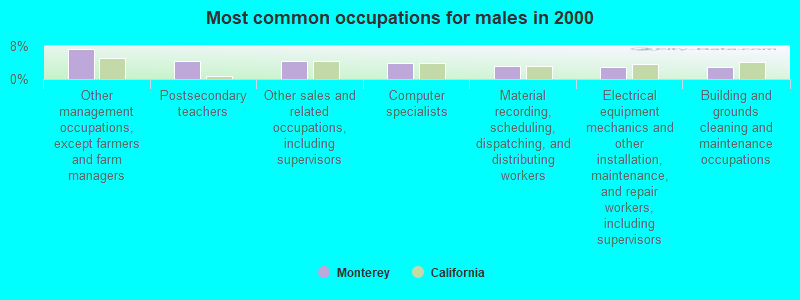
- Other management occupations, except farmers and farm managers (7.3%)
- Postsecondary teachers (4.4%)
- Other sales and related occupations, including supervisors (4.3%)
- Computer specialists (3.9%)
- Material recording, scheduling, dispatching, and distributing workers (3.2%)
- Electrical equipment mechanics and other installation, maintenance, and repair workers, including supervisors (2.9%)
- Building and grounds cleaning and maintenance occupations (2.8%)
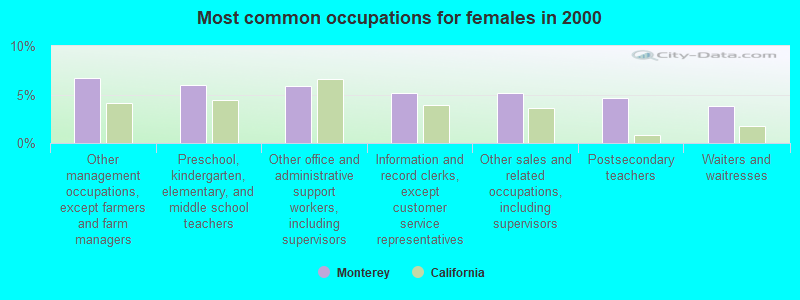
- Other management occupations, except farmers and farm managers (6.7%)
- Preschool, kindergarten, elementary, and middle school teachers (6.0%)
- Other office and administrative support workers, including supervisors (5.9%)
- Information and record clerks, except customer service representatives (5.2%)
- Other sales and related occupations, including supervisors (5.2%)
- Postsecondary teachers (4.6%)
- Waiters and waitresses (3.9%)
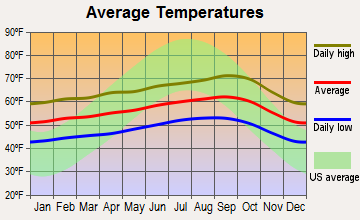
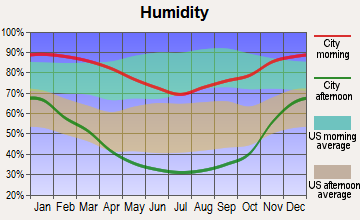
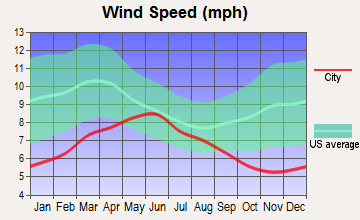
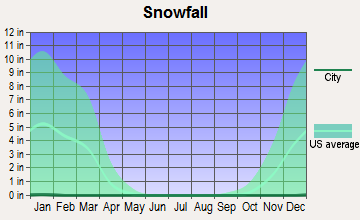
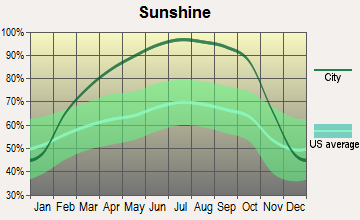
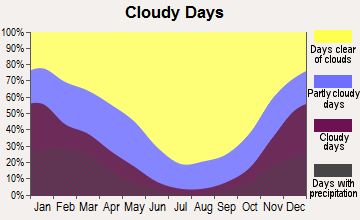
Average climate in Monterey, California
Based on data reported by over 4,000 weather stations

|
|

(lower is better)
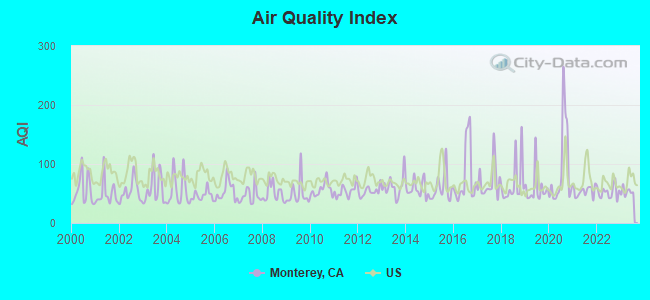
Air Quality Index (AQI) level in 2023 was 53.0. This is better than average.
| City: | 53.0 |
| U.S.: | 72.6 |
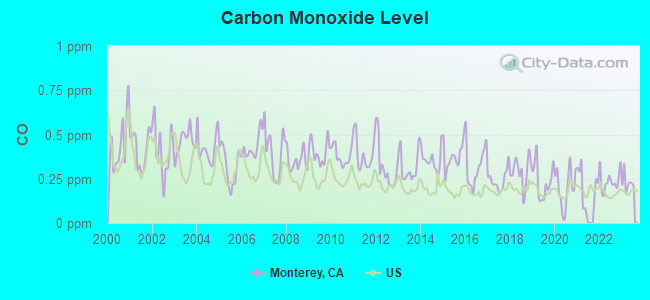
Carbon Monoxide (CO) [ppm] level in 2023 was 0.228. This is about average. Closest monitor was 0.7 miles away from the city center.
| City: | 0.228 |
| U.S.: | 0.251 |
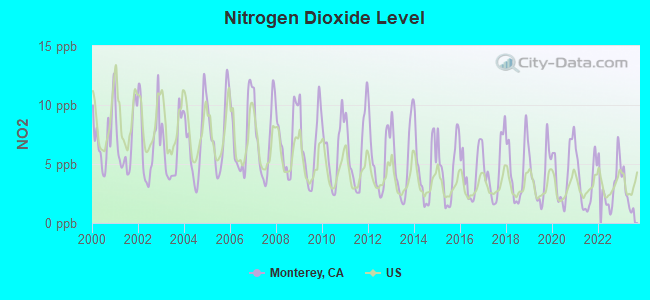
Nitrogen Dioxide (NO2) [ppb] level in 2023 was 2.40. This is significantly better than average. Closest monitor was 0.7 miles away from the city center.
| City: | 2.40 |
| U.S.: | 5.11 |
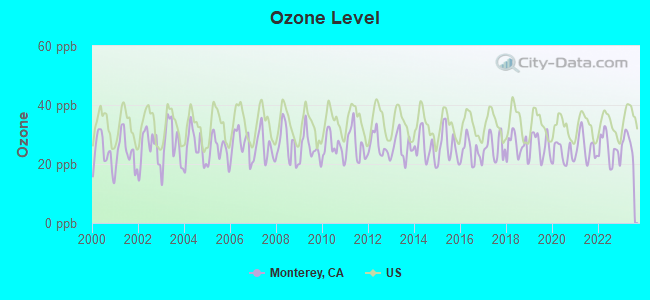
Ozone [ppb] level in 2023 was 27.2. This is better than average. Closest monitor was 0.7 miles away from the city center.
| City: | 27.2 |
| U.S.: | 33.3 |
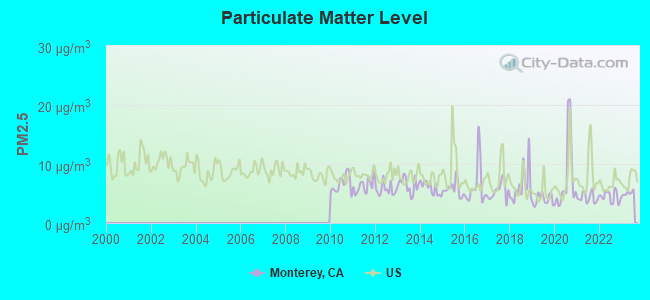
Particulate Matter (PM2.5) [µg/m3] level in 2023 was 5.05. This is significantly better than average. Closest monitor was 12.0 miles away from the city center.
| City: | 5.05 |
| U.S.: | 8.11 |
Earthquake activity:
Monterey-area historical earthquake activity is significantly above California state average. It is 7320% greater than the overall U.S. average.On 4/18/1906 at 13:12:21, a magnitude 7.9 (7.9 UK, Class: Major, Intensity: VIII - XII) earthquake occurred 114.5 miles away from Monterey center, causing $524,000,000 total damage
On 11/4/1927 at 13:51:53, a magnitude 7.5 (7.5 UK) earthquake occurred 126.1 miles away from Monterey center
On 10/18/1989 at 00:04:15, a magnitude 7.1 (6.5 MB, 7.1 MS, 6.9 MW, 7.0 ML) earthquake occurred 35.9 miles away from the city center, causing 62 deaths (62 shaking deaths) and 3757 injuries, causing $1,305,032,704 total damage
On 7/21/1952 at 11:52:14, a magnitude 7.7 (7.7 UK) earthquake occurred 196.3 miles away from the city center, causing $50,000,000 total damage
On 5/2/1983 at 23:42:37, a magnitude 6.7 (6.2 MB, 6.5 MS, 6.5 MW, 6.7 ML, Class: Strong, Intensity: VII - IX) earthquake occurred 92.2 miles away from the city center, causing $31,000,000 total damage
On 12/22/2003 at 19:15:56, a magnitude 6.6 (6.1 MB, 6.4 MS, 6.6 MW, 6.4 MW) earthquake occurred 81.8 miles away from Monterey center, causing 2 deaths (2 shaking deaths) and 40 injuries, causing $200,000,000 total damage
Magnitude types: body-wave magnitude (MB), local magnitude (ML), surface-wave magnitude (MS), moment magnitude (MW)
Natural disasters:
The number of natural disasters in Monterey County (23) is greater than the US average (15).Major Disasters (Presidential) Declared: 14
Emergencies Declared: 3
Causes of natural disasters: Floods: 12, Winter Storms: 7, Storms: 6, Fires: 4, Landslides: 4, Mudslides: 4, Freezes: 2, Drought: 1, Earthquake: 1, Hurricane: 1, Tornado: 1, Tsunami Wave: 1, Other: 1 (Note: some incidents may be assigned to more than one category).

Main business address for: Language Line, Inc. (COMMUNICATION SERVICES, NEC), Language Line Holdings, Inc. (COMMUNICATION SERVICES, NEC), CENTURY ALUMINUM CO (PRIMARY PRODUCTION OF ALUMINUM), EXCELLIGENCE LEARNING CORP (RETAIL-CATALOG & MAIL-ORDER HOUSES).
Hospitals in Monterey:
- COMMUNITY HOSPITAL OF THE MONTEREY PENINSULA (Voluntary non-profit - Private, provides emergency services, 23625 W R HOLMAN HIGHWAY)
- COMMUNITY HOSPITAL RECOVERY CENTER (provides emergency services, 576 HARTNELL ST)
- HEARTLAND HOME HEALTH CARE AND HOSPICE (2511 GARDEN RD SUITE B 200)
- MONTEREY PENINSULA SURGERY CENTER RYAN RANCH (2 UPPER RAGSDALE DRIVE, BLDG B, SUITE B160)
Nursing Homes in Monterey:
- CARMEL HILLS CARE CENTER (23795 W. R. HOLMAN HIGHWAY)
- CYPRESS RIDGE CARE CENTER (1501 SKYLINE DRIVE)
- WESTLAND HOUSE (100 BARNET SEGAL LANE)
- WINDSOR MONTEREY CARE CENTER (1575 SKYLINE DRIVE)
Dialysis Facilities in Monterey:
Home Health Centers in Monterey:
- ADOBE HOME HEALTH CARE (10 RAGSDALE DRIVE, SUITE 100)
- CENTRAL COAST VNA AND HOSPICE, INC (5 LOWER RAGSDALE DRIVE)
- CHOICE HOME HEALTH CARE (80 GARDEN COURT, SUITE 105)
- COMMUNITY HOSPITAL HOME HEALTH SERVICES (555 ABREGO STREET, SUITE 100)
- GOOD LIFE HOME CARE (135 W FRANKLIN STREET, SUITE 10)
- MAXIM HEALTHCARE SERVICES, INC (700 CASS STREET, SUITES 122 & 124)
- OLSTEN HEALTHCARE (965 PACIFIC ST)
Airports located in Monterey:
- Monterey Regional Airport (MRY) (Runways: 2, Commercial Ops: 1,464, Air Taxi Ops: 12,499, Itinerant Ops: 26,499, Local Ops: 11,759, Military Ops: 2,916)
Colleges/Universities in Monterey:
- Naval Postgraduate School (Full-time enrollment: 4,951; Location: 1 University Circle; Public; Website: www.nps.edu; Offers Doctor's degree)
- Monterey Peninsula College (Full-time enrollment: 4,588; Location: 980 Fremont St; Public; Website: www.mpc.edu)
- Monterey Institute of International Studies (Full-time enrollment: 940; Location: 460 Pierce Street; Private, not-for-profit; Website: www.miis.edu; Offers Master's degree)
Other colleges/universities with over 2000 students near Monterey:
- California State University-Monterey Bay (about 7 miles; Seaside, CA; Full-time enrollment: 5,125)
- Hartnell College (about 14 miles; Salinas, CA; FT enrollment: 5,506)
- Cabrillo College (about 27 miles; Aptos, CA; FT enrollment: 7,729)
- University of California-Santa Cruz (about 30 miles; Santa Cruz, CA; FT enrollment: 17,751)
- Gavilan College (about 32 miles; Gilroy, CA; FT enrollment: 3,327)
- West Valley College (about 47 miles; Saratoga, CA; FT enrollment: 6,128)
- Evergreen Valley College (about 50 miles; San Jose, CA; FT enrollment: 5,539)
Public high school in Monterey:
- MONTEREY HIGH (Students: 1,033, Location: 101 HERRMANN DR., Grades: 9-12)
Private high schools in Monterey:
Public elementary/middle schools in Monterey:
- WALTER COLTON (Students: 645, Location: 100 TODA VISTA DR., Grades: 6-8)
- FOOTHILL ELEMENTARY (Students: 330, Location: 1700 VIA CASOLI, Grades: KG-5)
- LA MESA ELEMENTARY (Students: 283, Location: 1 LA MESA WAY, Grades: KG-5)
- BAY VIEW ACADEMY (Students: 210, Location: 222 CASA VERDE AVE., Grades: KG-8, Charter school)
- MONTE VISTA (Location: 251 SOLEDAD DR., Grades: KG-5)
Private elementary/middle school in Monterey:
User-submitted facts and corrections:
- Monterey College of Law new address: 100 Col. Durham Street, Seaside, CA 93955, 831-582-4000, www.montereylaw.edu
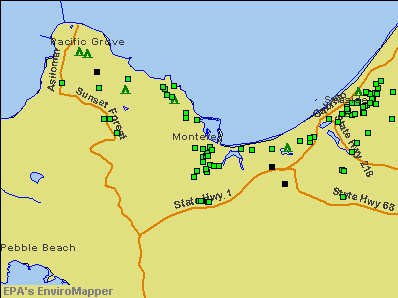
Points of interest:
Notable locations in Monterey: California Division of Forestry (A), Vizcaino-Serra Landing (B), Retreat (C), Municipal Wharf Number 2 (D), Monterey Marina (E), Fishermans Wharf (F), Coast Guard Pier (G), United States Navy Golf Course (H), Stokes Adobe (I), Monterey Youth Center (J), Monterey Public Library (K), Monterey County Courthouse and Government Center (L), Mayo Hayes O'Donnell Library (M), El Castillo (N), Cooper-Molera Adobe (O), Casa Serrano (P), Capitular Hall (Q), Barnet J Segal Building Library (R), Alvarado Adobe (S), Pacific House (T). Display/hide their locations on the map
Shopping Center: Del Monte Shopping Center (1). Display/hide its location on the map
Main business address in Monterey include: Language Line, Inc. (A), Language Line Holdings, Inc. (B), CENTURY ALUMINUM CO (C), EXCELLIGENCE LEARNING CORP (D). Display/hide their locations on the map
Churches in Monterey include: Royal Presidio Chapel (A), Living Hope Nazarene Church (B), Monterey Assembly of God Church (C), Bethlehem Lutheran Church of Monterey (D), Church of Christ (E), The Church of Jesus Christ of Latter Day Saints (F), Enchanted Angels Church (G), First Baptist Church (H), First Church of Christ Scientist (I). Display/hide their locations on the map
Cemeteries: Saint Johns Cemetery (1), San Carlos Cemetery (2), El Encinal Cemetery (3). Display/hide their locations on the map
Lakes: El Estero (A), Del Monte Lake (B). Display/hide their locations on the map
Parks in Monterey include: Monterey State Beach (1), Monterey County Fairgrounds (2), Cannery Row Park Plaza (3), Custom House Plaza (4), Friendly Plaza (5), Portola Plaza (6), Dennis the Menace Playground (7), Fishermans Shoreline Park (8), Serra Monument (9). Display/hide their locations on the map
Beaches: Aeneas Beach (A), Del Monte Beach (B), Macabee Beach (C), San Carlos Beach (D). Display/hide their locations on the map
Tourist attractions: Monterey Bay Whale Watch (Tourism Consultants; 84 Fishermans Wharf) (1), Chris' Fishing Trips (48 Fishermans Wharf) (2), American International Transportatn Srvce Incrprtd (2434 Del Monte Avenue) (3), AG Venture Tours (Po Box 2634) (4). Display/hide their approximate locations on the map
Hotels: Best Western Park Crest Motel (1100 Munras Avenue) (1), B V & Raman Patel (1386 Munras Avenue) (2), Best Western De Anza Inn (2141 Fremont Street) (3), Best Western Beach Resort Mont (2600 Sand Dunes Drive) (4), Bay Park Hotel (1425 Munras Avenue) (5), Bayside Inn (2055 Fremont Street) (6), Best Western Monterey Inn (825 Abrego Street) (7), Best Western Ramona Inn (2332 Fremont Street) (8), Best Value Surf Inn (1200 Munras Avenue) (9). Display/hide their approximate locations on the map
Birthplace of: Molly Ivins - Journalist, Joey Bradford - Bicycle motocross rider, J. R. Celski - Short-track speed skater, Lance Krall - Television actor, Al Espinosa - Professional golfer, Joel Courtney - Film actor, Allison Scagliotti - Child actor, Benjamin C. S. Boyle - Composer, Bobby Clampett - Professional golfer, Georg Brandl Egloff - Composer.
Drinking water stations with addresses in Monterey and their reported violations in the past:
CAL AM WATER COMPANY - MONTEREY (Population served: 94,700, Groundwater under infl of surface water):Past monitoring violations:CAL AM WATER COMPANY - TORO (Population served: 1,112, Groundwater):
- Monitoring, Turbidity (Enhanced SWTR) - In APR-2012, Contaminant: IESWTR. Follow-up actions: St AO (w/o penalty) issued (JUN-12-2012), St Compliance achieved (AUG-10-2012)
- Monitoring and Reporting (DBP) - Between APR-2005 and JUN-2005, Contaminant: Chlorine. Follow-up actions: St Compliance achieved (SEP-29-2005)
- One routine major monitoring violation
Past health violations:CAL AM WATER COMPANY - BISHOP (Population served: 735, Groundwater):Past monitoring violations:
- MCL, Average - Between APR-2010 and JUN-2010, Contaminant: Arsenic. Follow-up actions: St BCA signed (MAY-13-2009), St Compliance achieved (SEP-30-2010)
- MCL, Average - Between JAN-2010 and MAR-2010, Contaminant: Arsenic. Follow-up actions: St BCA signed (MAY-13-2009), St Compliance achieved (SEP-30-2010)
- MCL, Average - Between OCT-2009 and DEC-2009, Contaminant: Arsenic. Follow-up actions: St BCA signed (MAY-13-2009), St Compliance achieved (SEP-30-2010)
- MCL, Average - Between JUL-2009 and SEP-2009, Contaminant: Arsenic. Follow-up actions: St BCA signed (MAY-13-2009), St Compliance achieved (SEP-30-2010)
- MCL, Average - Between APR-2009 and JUN-2009, Contaminant: Arsenic. Follow-up actions: St BCA signed (MAY-13-2009), St Compliance achieved (SEP-30-2010)
- MCL, Average - Between JAN-2009 and MAR-2009, Contaminant: Arsenic. Follow-up actions: St BCA signed (MAY-13-2009), St Compliance achieved (SEP-30-2010)
- Monitoring and Reporting (DBP) - Between JAN-2005 and DEC-2005, Contaminant: Total Haloacetic Acids (HAA5). Follow-up actions: St Compliance achieved (APR-03-2006)
- Monitoring and Reporting (DBP) - Between JAN-2005 and DEC-2005, Contaminant: TTHM. Follow-up actions: St Compliance achieved (APR-03-2006)
- One minor monitoring violation
Past health violations:CSP-J.P. BURNS PARK (Population served: 300, Groundwater):
- MCL, Monthly (TCR) - In JUN-2008, Contaminant: Coliform. Follow-up actions: St AO (w/o penalty) issued (AUG-26-2008), St Compliance achieved (AUG-26-2008)
Past monitoring violations:CSP HENRY W. COE STATE PARK (Population served: 270, Groundwater):
- One regular monitoring violation
Past health violations:CSP-ANDREW MOLERA STATE RESERVE (Population served: 200, Groundwater):
- Treatment Technique (SWTR and GWR) - In JUL-2007. Follow-up actions: St AO (w/o penalty) issued (AUG-14-2007)
Past monitoring violations:CSP-LIMEKILN (Population served: 200, Groundwater):
- Monitoring, Repeat Major (TCR) - In FEB-2014, Contaminant: Coliform (TCR). Follow-up actions: St AO (w/o penalty) issued (APR-04-2014)
- One minor monitoring violation
- One regular monitoring violation
Past monitoring violations:CSP-FREMONT PEAK (Population served: 150, Groundwater):
- 2 routine major monitoring violations
- One minor monitoring violation
- One regular monitoring violation
Past monitoring violations:
- 3 routine major monitoring violations
Drinking water stations with addresses in Monterey that have no violations reported:
- CAL AM WATER COMPANY - CHUALAR (Population served: 1,440, Primary Water Source Type: Groundwater)
- CAL AM WATER COMPANY - HIDDEN HILLS (Population served: 1,155, Primary Water Source Type: Groundwater)
- CAL AM WATER COMPANY - AMBLER PARK (Population served: 1,024, Primary Water Source Type: Groundwater)
| This city: | 2.1 people |
| California: | 2.9 people |
| This city: | 48.9% |
| Whole state: | 68.7% |
| This city: | 6.6% |
| Whole state: | 7.2% |
Likely homosexual households (counted as self-reported same-sex unmarried-partner households)
- Lesbian couples: 0.3% of all households
- Gay men: 0.6% of all households
People in group quarters in Monterey in 2010:
- 2,079 people in military barracks and dormitories (nondisciplinary)
- 293 people in nursing facilities/skilled-nursing facilities
- 55 people in other noninstitutional facilities
- 44 people in workers' group living quarters and job corps centers
- 18 people in residential treatment centers for adults
- 14 people in group homes intended for adults
People in group quarters in Monterey in 2000:
- 2,325 people in military barracks, etc.
- 290 people in nursing homes
- 150 people in military transient quarters for temporary residents
- 37 people in other noninstitutional group quarters
- 16 people in religious group quarters
- 12 people in homes for the mentally ill
- 10 people in hospitals/wards and hospices for chronically ill
- 10 people in hospices or homes for chronically ill
- 2 people in military ships
Banks with most branches in Monterey (2011 data):
- 1st Capital Bank: at 5 Harris Court, Building N, Suite #3, branch established on 2007/04/16; Tyler Street Branch at 470 Tyler Street, 1st Floor, branch established on 2007/04/16. Info updated 2008/04/22: Bank assets: $288.3 mil, Deposits: $255.6 mil, local headquarters, positive income, Commercial Lending Specialization, 4 total offices
- Rabobank, National Association: Monterey Branch at 561 Lighthouse Avenue, branch established on 1997/03/03; Alvarado Branch at 439 Alvarado Street, branch established on 2003/01/20. Info updated 2011/01/27: Bank assets: $11,745.0 mil, Deposits: $8,446.0 mil, headquarters in Roseville, CA, positive income, Agricultural Specialization, 124 total offices, Holding Company: Cooperatieve Centrale Raiffeisen-Boerenleenbank B.A., "rabobank Nederland
- Wells Fargo Bank, National Association: Monterey Branch at 399 Alvarado St, branch established on 1930/10/27. Info updated 2011/04/05: Bank assets: $1,161,490.0 mil, Deposits: $905,653.0 mil, headquarters in Sioux Falls, SD, positive income, 6395 total offices, Holding Company: Wells Fargo & Company
- Pacific Valley Bank: Monterey Branch at 498 Alvarado Street, branch established on 2007/05/07. Info updated 2009/09/30: Bank assets: $178.2 mil, Deposits: $156.0 mil, headquarters in Salinas, CA, positive income, Commercial Lending Specialization, 4 total offices
- Bank of the West: Monterey - Del Monte at 1050 Del Monte Circle, branch established on 2010/01/16. Info updated 2009/11/16: Bank assets: $62,408.3 mil, Deposits: $43,995.2 mil, headquarters in San Francisco, CA, positive income, 647 total offices, Holding Company: Bnp Paribas
- JPMorgan Chase Bank, National Association: 291 Alvarado Branch at 291 Alvarado Street, branch established on 1999/10/03. Info updated 2011/11/10: Bank assets: $1,811,678.0 mil, Deposits: $1,190,738.0 mil, headquarters in Columbus, OH, positive income, International Specialization, 5577 total offices, Holding Company: Jpmorgan Chase & Co.
- Monterey County Bank: at 601 Munras Avenue, branch established on 1977/05/05. Info updated 2011/01/31: Bank assets: $249.3 mil, Deposits: $203.7 mil, local headquarters, negative income in the last year, Commercial Lending Specialization, 5 total offices, Holding Company: Northern California Bancorp, Inc.
- Union Bank, National Association: Monterey Bay Bank Branch at 1400 Munras Avenue, branch established on 1934/11/01. Info updated 2011/09/01: Bank assets: $88,967.5 mil, Deposits: $65,286.4 mil, headquarters in San Francisco, CA, positive income, Commercial Lending Specialization, 403 total offices, Holding Company: Mitsubishi Ufj Financial Group, Inc.
- Comerica Bank: Monterey Branch at 35 Bonifacio Plaza, branch established on 1987/06/30. Info updated 2011/07/29: Bank assets: $60,970.5 mil, Deposits: $48,300.9 mil, headquarters in Dallas, TX, positive income, Commercial Lending Specialization, 497 total offices, Holding Company: Comerica Incorporated
- 2 other banks with 2 local branches
For population 15 years and over in Monterey:
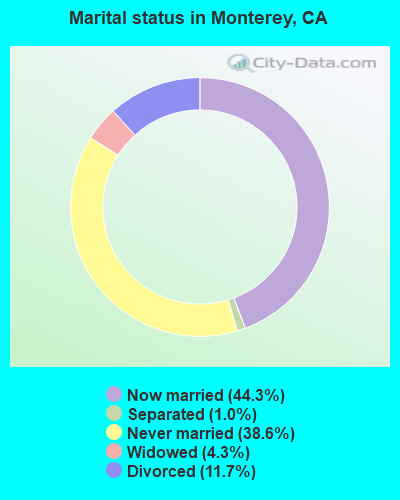
- Never married: 38.6%
- Now married: 44.3%
- Separated: 1.0%
- Widowed: 4.3%
- Divorced: 11.7%
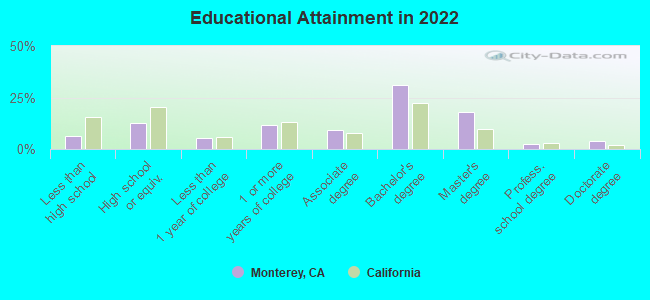
For population 25 years and over in Monterey:
- High school or higher: 93.9%
- Bachelor's degree or higher: 54.0%
- Graduate or professional degree: 24.6%
- Unemployed: 3.8%
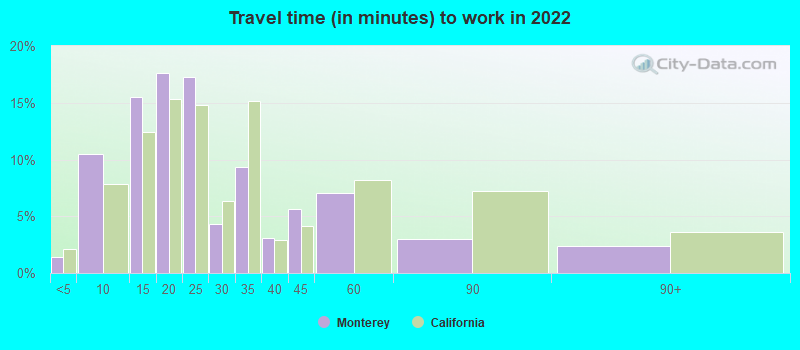
- Mean travel time to work (commute): 14.7 minutes
| Here: | 11.1 |
| California average: | 15.5 |
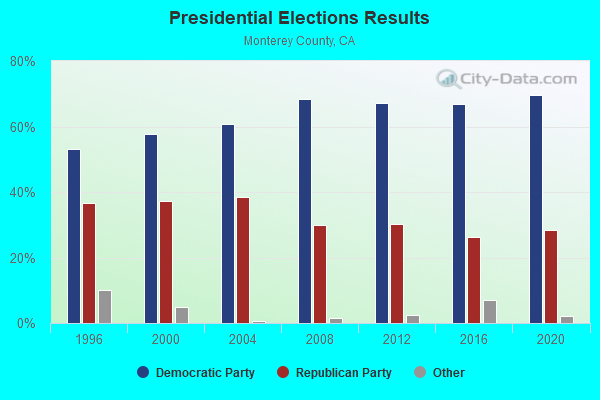
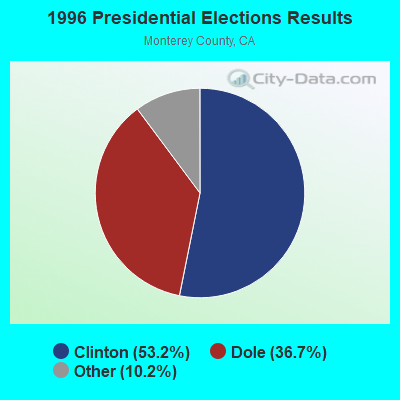
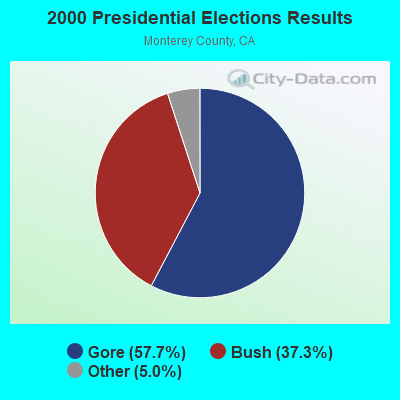
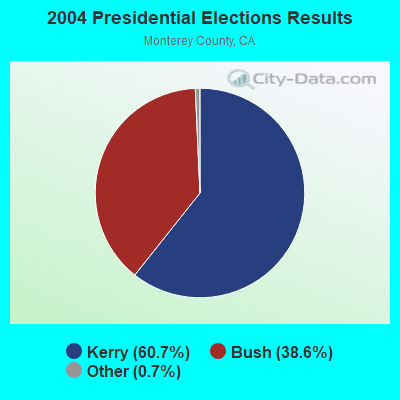
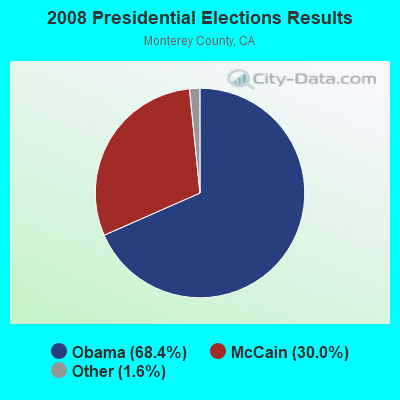
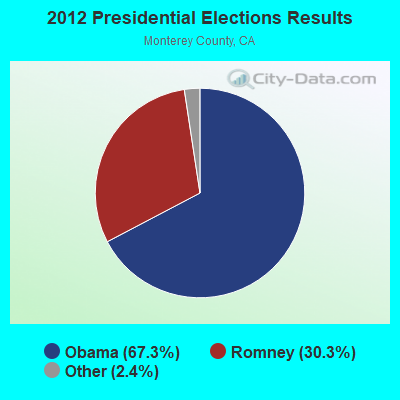
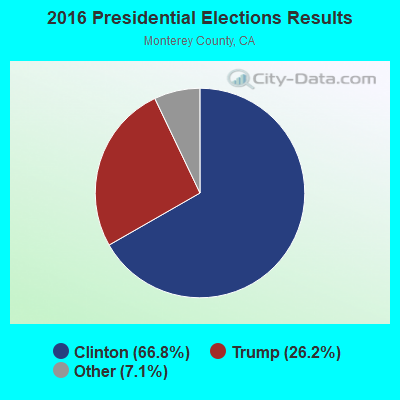
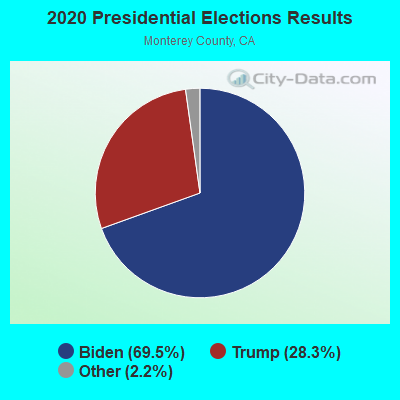
Graphs represent county-level data. Detailed 2008 Election Results
Religion statistics for Monterey, CA (based on Monterey County data)
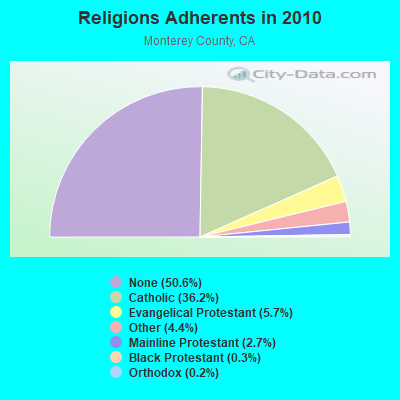
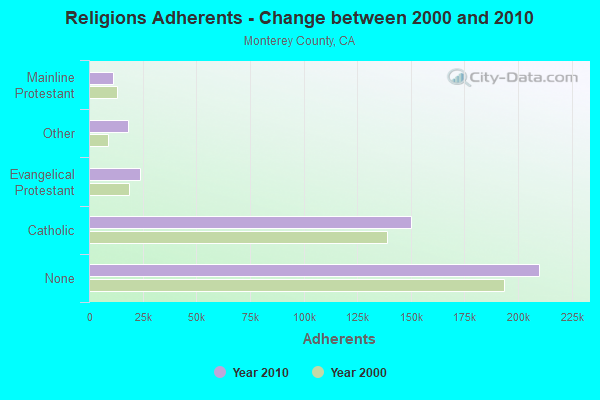
| Religion | Adherents | Congregations |
|---|---|---|
| Catholic | 150,050 | 26 |
| Evangelical Protestant | 23,624 | 154 |
| Other | 18,309 | 48 |
| Mainline Protestant | 11,244 | 48 |
| Black Protestant | 1,199 | 8 |
| Orthodox | 640 | 3 |
| None | 209,991 | - |
Food Environment Statistics:
| Here: | 2.82 / 10,000 pop. |
| State: | 2.14 / 10,000 pop. |
| Monterey County: | 0.05 / 10,000 pop. |
| State: | 0.04 / 10,000 pop. |
| This county: | 0.91 / 10,000 pop. |
| State: | 0.62 / 10,000 pop. |
| Monterey County: | 2.00 / 10,000 pop. |
| California: | 1.49 / 10,000 pop. |
| Monterey County: | 9.24 / 10,000 pop. |
| State: | 7.42 / 10,000 pop. |
| Monterey County: | 7.5% |
| California: | 7.3% |
| Here: | 21.8% |
| California: | 21.3% |
| Monterey County: | 18.4% |
| California: | 17.9% |
Health and Nutrition:
| Monterey: | 51.1% |
| California: | 49.4% |
| Monterey: | 49.2% |
| California: | 48.0% |
| Monterey: | 27.8 |
| State: | 28.1 |
| Monterey: | 19.4% |
| California: | 20.2% |
| Monterey: | 10.4% |
| California: | 11.2% |
| This city: | 6.9 |
| California: | 6.8 |
| Monterey: | 30.8% |
| California: | 31.5% |
| Monterey: | 58.1% |
| California: | 56.4% |
| Monterey: | 80.3% |
| California: | 80.9% |
More about Health and Nutrition of Monterey, CA Residents
| Local government employment and payroll (March 2022) | |||||
| Function | Full-time employees | Monthly full-time payroll | Average yearly full-time wage | Part-time employees | Monthly part-time payroll |
|---|---|---|---|---|---|
| Other and Unallocable | 95 | $614,890 | $77,670 | 18 | $14,549 |
| Firefighters | 79 | $947,044 | $143,855 | 0 | $0 |
| Police Protection - Officers | 41 | $474,801 | $138,966 | 2 | $3,402 |
| Parks and Recreation | 38 | $291,007 | $91,897 | 127 | $128,994 |
| Financial Administration | 25 | $214,839 | $103,123 | 1 | $1,717 |
| Police - Other | 21 | $112,427 | $64,244 | 1 | $3,089 |
| Other Government Administration | 17 | $126,821 | $89,521 | 4 | $10,738 |
| Streets and Highways | 11 | $65,488 | $71,441 | 1 | $687 |
| Water Transport and Terminals | 9 | $64,247 | $85,663 | 5 | $14,508 |
| Local Libraries | 7 | $57,213 | $98,079 | 13 | $25,909 |
| Solid Waste Management | 7 | $54,239 | $92,981 | 0 | $0 |
| Housing and Community Development (Local) | 5 | $32,664 | $78,394 | 1 | $1,842 |
| Fire - Other | 5 | $57,562 | $138,149 | 1 | $3,653 |
| Sewerage | 3 | $18,916 | $75,664 | 0 | $0 |
| Judicial and Legal | 3 | $41,295 | $165,180 | 0 | $0 |
| Natural Resources | 1 | $7,991 | $95,892 | 0 | $0 |
| Totals for Government | 367 | $3,181,444 | $104,025 | 174 | $209,089 |
Monterey government finances - Expenditure in 2017 (per resident):
- Construction - Regular Highways: $5,539,000 ($187.31)
Housing and Community Development: $3,652,000 ($123.50)
Local Fire Protection: $151,000 ($5.11)
Police Protection: $120,000 ($4.06)
- Current Operations - General - Other: $25,915,000 ($876.37)
Local Fire Protection: $19,365,000 ($654.86)
Police Protection: $14,437,000 ($488.21)
Regular Highways: $13,810,000 ($467.01)
Parks and Recreation: $12,293,000 ($415.71)
Central Staff Services: $10,562,000 ($357.17)
Parking Facilities: $6,289,000 ($212.67)
Housing and Community Development: $4,250,000 ($143.72)
Libraries: $3,076,000 ($104.02)
Sewerage: $2,414,000 ($81.63)
Financial Administration: $2,176,000 ($73.59)
Protective Inspection and Regulation - Other: $1,471,000 ($49.74)
Sea and Inland Port Facilities: $1,424,000 ($48.16)
Miscellaneous Commercial Activities - Other: $174,000 ($5.88)
Solid Waste Management: $10,000 ($0.34)
- General - Interest on Debt: $7,060,000 ($238.75)
- Intergovernmental to Local - Other - Police Protection: $1,033,000 ($34.93)
- Other Capital Outlay - Parks and Recreation: $849,000 ($28.71)
Regular Highways: $8,000 ($0.27)
- Total Salaries and Wages: $2,976,000 ($100.64)
Monterey government finances - Revenue in 2017 (per resident):
- Charges - Other: $39,508,000 ($1336.04)
Parking Facilities: $9,299,000 ($314.46)
Parks and Recreation: $5,848,000 ($197.76)
Sewerage: $3,615,000 ($122.25)
Housing and Community Development: $596,000 ($20.15)
Sea and Inland Port Facilities: $522,000 ($17.65)
Miscellaneous Commercial Activities: $229,000 ($7.74)
- Federal Intergovernmental - Housing and Community Development: $997,000 ($33.72)
Other: $728,000 ($24.62)
- Local Intergovernmental - Other: $51,000 ($1.72)
- Miscellaneous - Rents: $4,643,000 ($157.01)
Donations From Private Sources: $1,915,000 ($64.76)
Interest Earnings: $1,403,000 ($47.45)
General Revenue - Other: $356,000 ($12.04)
Fines and Forfeits: $208,000 ($7.03)
- State Intergovernmental - Other: $4,647,000 ($157.15)
Highways: $520,000 ($17.58)
General Local Government Support: $35,000 ($1.18)
- Tax - Other Selective Sales: $23,186,000 ($784.08)
General Sales and Gross Receipts: $17,834,000 ($603.09)
Property: $13,369,000 ($452.10)
Public Utilities Sales: $4,972,000 ($168.14)
Other: $4,332,000 ($146.49)
Occupation and Business License - Other: $3,479,000 ($117.65)
Other License: $1,048,000 ($35.44)
Documentary and Stock Transfer: $179,000 ($6.05)
Monterey government finances - Debt in 2017 (per resident):
- Long Term Debt - Outstanding Unspecified Public Purpose: $97,503,000 ($3297.25)
Beginning Outstanding - Unspecified Public Purpose: $96,353,000 ($3258.36)
Issue, Unspecified Public Purpose: $3,802,000 ($128.57)
Retired Unspecified Public Purpose: $2,652,000 ($89.68)
Monterey government finances - Cash and Securities in 2017 (per resident):
- Bond Funds - Cash and Securities: $16,263,000 ($549.96)
- Other Funds - Cash and Securities: $85,842,000 ($2902.91)
- Sinking Funds - Cash and Securities: $13,417,000 ($453.72)
4.96% of this county's 2021 resident taxpayers lived in other counties in 2020 ($91,945 average adjusted gross income)
| Here: | 4.96% |
| California average: | 5.19% |
0.08% of residents moved from foreign countries ($1,276 average AGI)
Monterey County: 0.08% California average: 0.03%
Top counties from which taxpayers relocated into this county between 2020 and 2021:
| from Santa Cruz County, CA | |
| from Santa Clara County, CA | |
| from Los Angeles County, CA |
6.17% of this county's 2020 resident taxpayers moved to other counties in 2021 ($76,219 average adjusted gross income)
| Here: | 6.17% |
| California average: | 6.14% |
0.08% of residents moved to foreign countries ($1,055 average AGI)
Monterey County: 0.08% California average: 0.02%
Top counties to which taxpayers relocated from this county between 2020 and 2021:
| to Santa Cruz County, CA | |
| to Santa Clara County, CA | |
| to Los Angeles County, CA |
| Businesses in Monterey, CA | ||||
| Name | Count | Name | Count | |
|---|---|---|---|---|
| 7-Eleven | 2 | La Quinta | 1 | |
| AT&T | 1 | Lane Furniture | 1 | |
| Ann Taylor | 1 | LensCrafters | 1 | |
| Apple Store | 1 | Long John Silver's | 1 | |
| Banana Republic | 1 | Macy's | 2 | |
| Baskin-Robbins | 1 | Marriott | 1 | |
| Bath & Body Works | 1 | MasterBrand Cabinets | 3 | |
| Best Western | 6 | McDonald's | 1 | |
| Blockbuster | 1 | Men's Wearhouse | 1 | |
| Budget Car Rental | 1 | Motel 6 | 1 | |
| CVS | 2 | Motherhood Maternity | 1 | |
| Carl\s Jr. | 1 | New Balance | 5 | |
| Chico's | 1 | Nike | 8 | |
| Chipotle | 1 | Pac Sun | 1 | |
| Circle K | 1 | Papa John's Pizza | 1 | |
| Clarion | 1 | Penske | 1 | |
| Cold Stone Creamery | 1 | Plato's Closet | 1 | |
| Comfort Inn | 3 | Pottery Barn | 1 | |
| Days Inn | 2 | Quality | 2 | |
| Decora Cabinetry | 1 | Quiznos | 1 | |
| Dennys | 2 | RadioShack | 1 | |
| Econo Lodge | 1 | Ramada | 2 | |
| FedEx | 13 | Rite Aid | 1 | |
| Foot Locker | 1 | Rodeway Inn | 1 | |
| Forever 21 | 1 | SAS Shoes | 1 | |
| GNC | 1 | Soma Intimates | 1 | |
| GameStop | 1 | Starbucks | 2 | |
| Gap | 1 | Subway | 6 | |
| Gymboree | 1 | Super 8 | 2 | |
| H&R Block | 2 | T-Mobile | 1 | |
| Hilton | 1 | Taco Bell | 1 | |
| Holiday Inn | 2 | Toys"R"Us | 1 | |
| Hollister Co. | 1 | Trader Joe's | 1 | |
| Hot Topic | 1 | Travelodge | 2 | |
| Howard Johnson | 1 | U-Haul | 1 | |
| Hyatt | 1 | UPS | 10 | |
| Jack In The Box | 1 | Vans | 3 | |
| Jamba Juice | 1 | Verizon Wireless | 2 | |
| Johnny Rockets | 1 | Victoria's Secret | 1 | |
| Jones New York | 4 | Walgreens | 1 | |
| KFC | 1 | Whole Foods Market | 1 | |
| Knights Inn | 1 | YMCA | 1 | |
| Kroger | 2 | |||
Strongest AM radio stations in Monterey:
- KNRY (1240 AM; 1 kW; MONTEREY, CA; Owner: PEOPLE'S RADIO, INC.)
- KRML (1410 AM; 2 kW; CARMEL, CA; Owner: WISDOM BROADCASTING CO, INC.)
- KYAA (1200 AM; 25 kW; SOQUEL, CA; Owner: PEOPLE'S RADIO, INC.)
- KSRK (540 AM; 10 kW; CARMEL VALLEY, CA; Owner: PEOPLE'S RADIO, INC.)
- KDBV (980 AM; 10 kW; SALINAS, CA; Owner: WOLFHOUSE RADIO GROUP, INC.)
- KIDD (630 AM; 1 kW; MONTEREY, CA; Owner: BUCKLEY COMMUNICATIONS, INC.)
- KION (1460 AM; 10 kW; SALINAS, CA)
- KLOK (1170 AM; 50 kW; SAN JOSE, CA; Owner: ENTRAVISION HOLDINGS, LLC)
- KKMC (880 AM; 10 kW; GONZALES, CA; Owner: MONTEREY COUNTY BROADCASTERS, INC.)
- KNBR (680 AM; 50 kW; SAN FRANCISCO, CA; Owner: KNBR LICO, INC.)
- KSCO (1080 AM; 10 kW; SANTA CRUZ, CA)
- KGO (810 AM; 50 kW; SAN FRANCISCO, CA; Owner: KGO-AM RADIO, INC.)
- KTOM (1380 AM; 5 kW; SALINAS, CA; Owner: CLEAR CHANNEL BROADCASTING LICENSES, INC.)
Strongest FM radio stations in Monterey:
- KMBY-FM (103.9 FM; SEASIDE, CA; Owner: MAPLETON COMMUNICATIONS, LLC)
- KSPB (91.9 FM; PEBBLE BEACH, CA; Owner: ROBERT LOUIS STEVENSON SCHOOL)
- KUSP (88.9 FM; SANTA CRUZ, CA; Owner: PATAPHYSICAL B/CING. FOUNDATION,INC.)
- K260AA (99.9 FM; CARMEL VALLEY, CA; Owner: ENTRAVISION HOLDINGS, LLC)
- KWAV (96.9 FM; MONTEREY, CA; Owner: BUCKLEY BROADCASTING OF MONTEREY)
- KTOM-FM (100.7 FM; SALINAS, CA; Owner: CLEAR CHANNEL BROADCASTING LICENSES, INC.)
- K291AE (106.1 FM; SEASIDE, CA; Owner: MAPELTON COMMUNICATIONS, LLC)
- KBOQ (95.5 FM; CARMEL, CA; Owner: J & M BROADCASTING, INC.)
- KMJO (92.7 FM; MARINA, CA; Owner: CLEAR CHANNEL BROADCASTING LICENSES, INC.)
- KSES-FM (107.1 FM; SEASIDE, CA; Owner: ENTRAVISION HOLDINGS, LLC)
- KAZU (90.3 FM; PACIFIC GROVE, CA; Owner: FOUNDATION OF CALIFORNIA STATE UNIVERSITY, MONTEREY BAY)
- KCDU (101.7 FM; CARMEL, CA; Owner: MAPLETON COMMUNICATIONS, L.L.C.)
- KDON-FM (102.5 FM; SALINAS, CA; Owner: CLEAR CHANNEL BROADCASTING LICENSES, INC.)
- K202DU (88.3 FM; SAN JUAN BAUTISTA, CA; Owner: CALVARY CHAPEL OF TWIN FALLS, INC.)
- KOCN (105.1 FM; PACIFIC GROVE, CA; Owner: CLEAR CHANNEL BROADCASTING LICENSES, INC.)
- KBTU (93.5 FM; HOLLISTER, CA; Owner: MAPLETON COMMUNICATIONS, L.L.C.)
- KLVM (89.7 FM; PRUNEDALE, CA; Owner: PRUNEDALE EDUCATIONAL ASSOCIATION)
- K265DG (100.9 FM; HOLLISTER, CA; Owner: CLEAR CHANNEL BROADCASTING LICENSES, INC.)
- K206BQ (89.1 FM; HOLLISTER, CA; Owner: PATAPHYSICAL BROADCASTING FOUNDATION, INC.)
- KSQL (99.1 FM; SANTA CRUZ, CA; Owner: TMS LICENSE CALIFORNIA, INC)
TV broadcast stations around Monterey:
- K53DT (Channel 53; MONTEREY, CA; Owner: TRINITY BROADCASTING NETWORK)
- KSBW (Channel 8; SALINAS, CA; Owner: HEARST-ARGYLE STATIONS, INC.)
- KION-TV (Channel 46; MONTEREY, CA; Owner: ACKERLEY MEDIA GROUP, INC.)
- KCBA (Channel 35; SALINAS, CA; Owner: SEAL ROCK BROADCASTERS, L.L.C.)
- National Bridge Inventory (NBI) Statistics
- 54Number of bridges
- 581ft / 177mTotal length
- 1,011,392Total average daily traffic
- 33,470Total average daily truck traffic
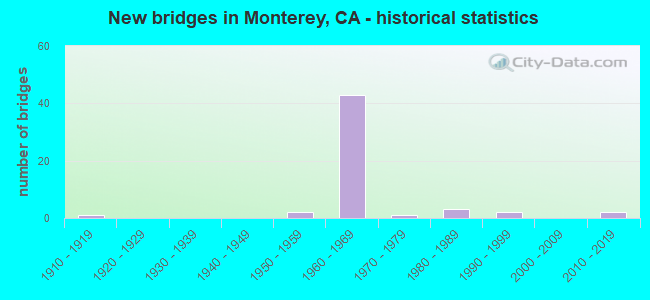
- New bridges - historical statistics
- 11910-1919
- 21950-1959
- 431960-1969
- 11970-1979
- 31980-1989
- 21990-1999
- 22010-2019
FCC Registered Antenna Towers: 233 (See the full list of FCC Registered Antenna Towers)
FCC Registered Private Land Mobile Towers: 3 (See the full list of FCC Registered Private Land Mobile Towers in Monterey, CA)
FCC Registered Broadcast Land Mobile Towers: 60 (See the full list of FCC Registered Broadcast Land Mobile Towers)
FCC Registered Microwave Towers: 65 (See the full list of FCC Registered Microwave Towers in this town)
FCC Registered Paging Towers: 9 (See the full list of FCC Registered Paging Towers)
FCC Registered Maritime Coast & Aviation Ground Towers: 23 (See the full list of FCC Registered Maritime Coast & Aviation Ground Towers)
FCC Registered Amateur Radio Licenses: 519 (See the full list of FCC Registered Amateur Radio Licenses in Monterey)
FAA Registered Aircraft Manufacturers and Dealers: 3 (See the full list of FAA Registered Manufacturers and Dealers in Monterey)
FAA Registered Aircraft: 80 (See the full list of FAA Registered Aircraft)
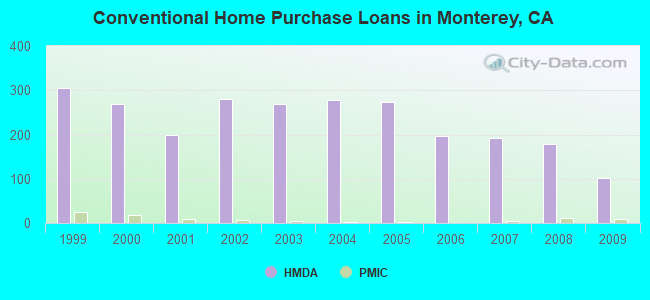
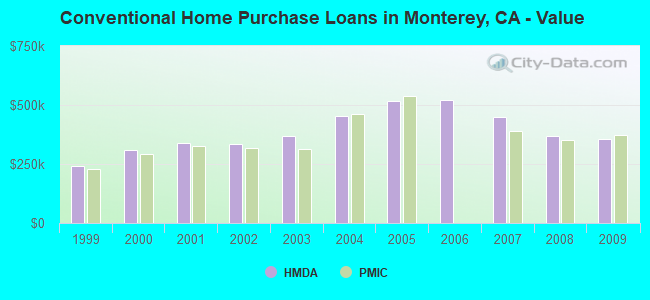
| Home Mortgage Disclosure Act Aggregated Statistics For Year 2009 (Based on 4 full and 2 partial tracts) | ||||||||||||
| A) FHA, FSA/RHS & VA Home Purchase Loans | B) Conventional Home Purchase Loans | C) Refinancings | D) Home Improvement Loans | E) Loans on Dwellings For 5+ Families | F) Non-occupant Loans on < 5 Family Dwellings (A B C & D) | |||||||
|---|---|---|---|---|---|---|---|---|---|---|---|---|
| Number | Average Value | Number | Average Value | Number | Average Value | Number | Average Value | Number | Average Value | Number | Average Value | |
| LOANS ORIGINATED | 18 | $425,339 | 102 | $354,375 | 451 | $335,228 | 36 | $328,046 | 3 | $996,133 | 101 | $330,035 |
| APPLICATIONS APPROVED, NOT ACCEPTED | 2 | $400,500 | 9 | $396,191 | 47 | $357,367 | 2 | $347,640 | 0 | $0 | 12 | $299,773 |
| APPLICATIONS DENIED | 5 | $398,262 | 22 | $362,149 | 150 | $403,291 | 11 | $55,805 | 1 | $562,000 | 33 | $301,110 |
| APPLICATIONS WITHDRAWN | 6 | $416,578 | 16 | $491,522 | 87 | $393,382 | 5 | $291,428 | 0 | $0 | 21 | $307,990 |
| FILES CLOSED FOR INCOMPLETENESS | 2 | $431,625 | 1 | $1,085,290 | 27 | $372,104 | 1 | $350,000 | 0 | $0 | 7 | $319,064 |
Detailed HMDA statistics for the following Tracts: 0125.00 , 0126.00, 0127.00, 0128.00, 0130.00, 0131.00, 0132.00, 0133.00
| Private Mortgage Insurance Companies Aggregated Statistics For Year 2009 (Based on 4 full and 2 partial tracts) | ||||
| A) Conventional Home Purchase Loans | B) Refinancings | |||
|---|---|---|---|---|
| Number | Average Value | Number | Average Value | |
| LOANS ORIGINATED | 10 | $373,757 | 1 | $468,000 |
| APPLICATIONS APPROVED, NOT ACCEPTED | 2 | $341,775 | 2 | $710,690 |
| APPLICATIONS DENIED | 2 | $337,790 | 1 | $417,000 |
| APPLICATIONS WITHDRAWN | 0 | $0 | 0 | $0 |
| FILES CLOSED FOR INCOMPLETENESS | 0 | $0 | 0 | $0 |
Detailed PMIC statistics for the following Tracts: 0125.00 , 0127.00, 0128.00, 0130.00, 0132.00, 0133.00
2002 - 2018 National Fire Incident Reporting System (NFIRS) incidents
- Fire incident types reported to NFIRS in Monterey, CA
- 61543.5%Outside Fires
- 51336.3%Structure Fires
- 21915.5%Mobile Property/Vehicle Fires
- 674.7%Other
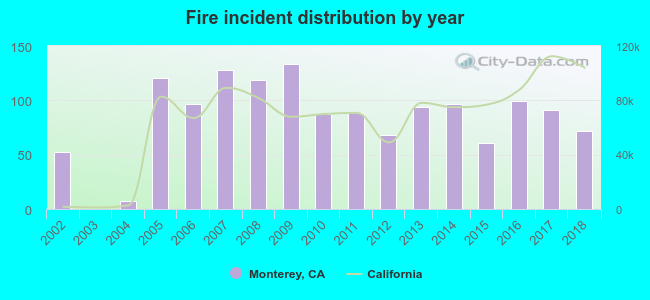 According to the data from the years 2002 - 2018 the average number of fires per year is 83. The highest number of fires - 133 took place in 2009, and the least - 0 in 2003. The data has a growing trend.
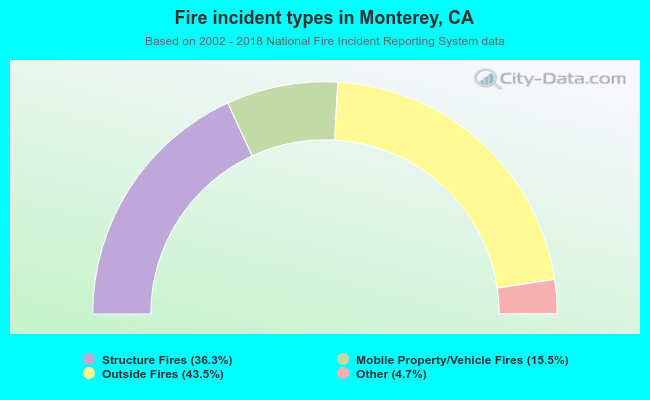 When looking into fire subcategories, the most incidents belonged to: Outside Fires (43.5%), and Structure Fires (36.3%).
Fire-safe hotels and motels in Monterey, California:
- Monterey Downtown Travelodge, 675 Munras Ave, Monterey, California 93940 , Phone: (831) 373-1876, Fax: (831) 373-8693
- Hotel Abrego, 755 Abrego St, Monterey, California 93940 , Phone: (831) 372-7551, Fax: (831) 372-0916
- The Monterey Hotel, 406 Alvarado St, Monterey, California 93940 , Phone: (831) 375-3184, Fax: (831) 373-2899
- Monterey Bay Inn, 242 Cannery Row, Monterey, California 93940 , Phone: (831) 658-3333, Fax: (831) 373-7603
- Victorian Inn, 487 Foam St, Monterey, California 93950 , Phone: (831) 373-8000
- Portola Plaza Hotel, 2 Portola Plz, Monterey, California 93940 , Phone: (831) 649-4511, Fax: (831) 649-4115
- Hyatt Regency Monterey, One Golf Course Rd, Monterey, California 93940 , Phone: (831) 372-1234, Fax: (831) 375-6985
- Quality Inn, 1058 Munras Ave, Monterey, California 93940 , Phone: (831) 372-3381, Fax: (831) 372-4687
- 23 other hotels and motels
| Most common first names in Monterey, CA among deceased individuals | ||
| Name | Count | Lived (average) |
|---|---|---|
| John | 203 | 75.2 years |
| Mary | 193 | 81.3 years |
| William | 160 | 75.3 years |
| Robert | 128 | 71.9 years |
| Frank | 111 | 77.7 years |
| Helen | 109 | 82.9 years |
| James | 107 | 69.3 years |
| George | 98 | 77.8 years |
| Joseph | 87 | 73.7 years |
| Dorothy | 84 | 79.3 years |
| Most common last names in Monterey, CA among deceased individuals | ||
| Last name | Count | Lived (average) |
|---|---|---|
| Smith | 68 | 77.3 years |
| Johnson | 49 | 77.4 years |
| Brown | 34 | 76.9 years |
| Jones | 33 | 74.6 years |
| Russo | 31 | 79.6 years |
| Balesteri | 30 | 78.3 years |
| Bruno | 28 | 78.1 years |
| Williams | 28 | 80.2 years |
| Ferrante | 27 | 79.2 years |
| Anderson | 27 | 74.7 years |
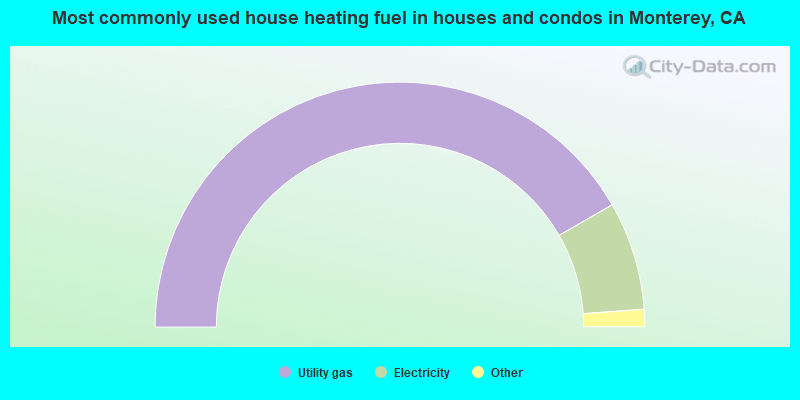
- 83.4%Utility gas
- 14.3%Electricity
- 0.9%No fuel used
- 0.8%Bottled, tank, or LP gas
- 0.3%Wood
- 0.3%Solar energy
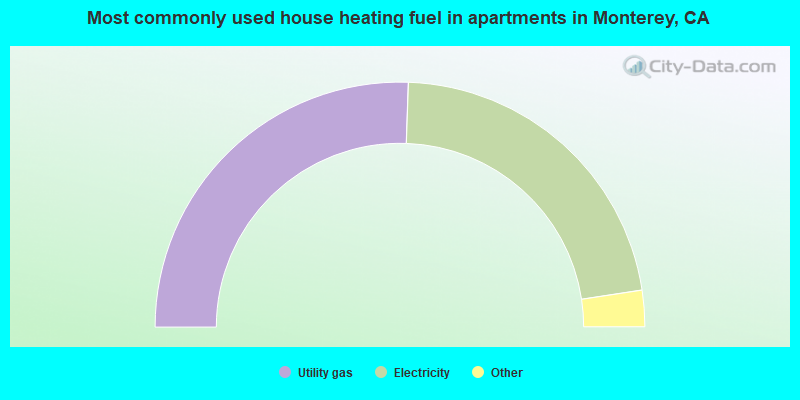
- 51.1%Utility gas
- 44.1%Electricity
- 2.8%No fuel used
- 1.0%Bottled, tank, or LP gas
- 0.4%Other fuel
- 0.4%Wood
- 0.3%Fuel oil, kerosene, etc.
Monterey compared to California state average:
- Unemployed percentage significantly below state average.
- Black race population percentage below state average.
- Hispanic race population percentage below state average.
- Median age above state average.
- Foreign-born population percentage below state average.
- Length of stay since moving in above state average.
- Percentage of population with a bachelor's degree or higher above state average.
Monterey on our top lists:
- #11 on the list of "Top 101 cities with the most local government spending on current operations of parking facilities per resident (population 10,000+)"
- #18 on the list of "Top 101 cities with the most local government spending on current operations of parks and recreation per resident (population 10,000+)"
- #19 on the list of "Top 101 cities with the most residents born in Other South Eastern Asia (population 500+)"
- #30 on the list of "Top 101 cities with the most local government spending on current operations of libraries per resident (population 10,000+)"
- #32 on the list of "Top 101 cities with the largest percentage of people in military transient quarters for temporary residents (population 1,000+)"
- #54 on the list of "Top 100 cities with highest ratio of median house value to median household income (pop. 5,000+)"
- #66 on the list of "Top 101 cities with the largest percentage of people in military ships (population 1,000+)"
- #71 on the list of "Top 101 cities with the largest percentage of people in military barracks, etc. (population 1,000+)"
- #15 on the list of "Top 101 counties with the highest Nitrogen Dioxide air pollution readings in 2012 (ppm)"
- #20 on the list of "Top 101 counties with the lowest surface withdrawal of fresh water for public supply (pop. 50,000+)"
- #33 on the list of "Top 101 counties with the highest number of births per 1000 residents 2007-2013"
- #44 on the list of "Top 101 counties with the lowest Particulate Matter (PM2.5) Annual air pollution readings in 2012 (µg/m3)"
- #54 on the list of "Top 101 counties with the highest Particulate Matter (PM10) Annual air pollution readings in 2012 (µg/m3)"

|
|
Total of 176 patent applications in 2008-2024.