Newnan, Georgia Submit your own pictures of this city and show them to the world
OSM Map
General Map
Google Map
MSN Map
OSM Map
General Map
Google Map
MSN Map
OSM Map
General Map
Google Map
MSN Map
OSM Map
General Map
Google Map
MSN Map
Please wait while loading the map...
Population in 2022: 44,485 (100% urban, 0% rural). Population change since 2000: +173.9%Males: 20,275 Females: 24,210
March 2022 cost of living index in Newnan: 101.3 (near average, U.S. average is 100) Percentage of residents living in poverty in 2022: 9.8%for White Non-Hispanic residents , 12.8% for Black residents , 15.4% for Hispanic or Latino residents , 24.4% for other race residents , 12.3% for two or more races residents )
Profiles of local businesses
Business Search - 14 Million verified businesses
Data:
Median household income ($)
Median household income (% change since 2000)
Household income diversity
Ratio of average income to average house value (%)
Ratio of average income to average rent
Median household income ($) - White
Median household income ($) - Black or African American
Median household income ($) - Asian
Median household income ($) - Hispanic or Latino
Median household income ($) - American Indian and Alaska Native
Median household income ($) - Multirace
Median household income ($) - Other Race
Median household income for houses/condos with a mortgage ($)
Median household income for apartments without a mortgage ($)
Races - White alone (%)
Races - White alone (% change since 2000)
Races - Black alone (%)
Races - Black alone (% change since 2000)
Races - American Indian alone (%)
Races - American Indian alone (% change since 2000)
Races - Asian alone (%)
Races - Asian alone (% change since 2000)
Races - Hispanic (%)
Races - Hispanic (% change since 2000)
Races - Native Hawaiian and Other Pacific Islander alone (%)
Races - Native Hawaiian and Other Pacific Islander alone (% change since 2000)
Races - Two or more races (%)
Races - Two or more races (% change since 2000)
Races - Other race alone (%)
Races - Other race alone (% change since 2000)
Racial diversity
Unemployment (%)
Unemployment (% change since 2000)
Unemployment (%) - White
Unemployment (%) - Black or African American
Unemployment (%) - Asian
Unemployment (%) - Hispanic or Latino
Unemployment (%) - American Indian and Alaska Native
Unemployment (%) - Multirace
Unemployment (%) - Other Race
Population density (people per square mile)
Population - Males (%)
Population - Females (%)
Population - Males (%) - White
Population - Males (%) - Black or African American
Population - Males (%) - Asian
Population - Males (%) - Hispanic or Latino
Population - Males (%) - American Indian and Alaska Native
Population - Males (%) - Multirace
Population - Males (%) - Other Race
Population - Females (%) - White
Population - Females (%) - Black or African American
Population - Females (%) - Asian
Population - Females (%) - Hispanic or Latino
Population - Females (%) - American Indian and Alaska Native
Population - Females (%) - Multirace
Population - Females (%) - Other Race
Coronavirus confirmed cases (Apr 26, 2024)
Deaths caused by coronavirus (Apr 26, 2024)
Coronavirus confirmed cases (per 100k population) (Apr 26, 2024)
Deaths caused by coronavirus (per 100k population) (Apr 26, 2024)
Daily increase in number of cases (Apr 26, 2024)
Weekly increase in number of cases (Apr 26, 2024)
Cases doubled (in days) (Apr 26, 2024)
Hospitalized patients (Apr 18, 2022)
Negative test results (Apr 18, 2022)
Total test results (Apr 18, 2022)
COVID Vaccine doses distributed (per 100k population) (Sep 19, 2023)
COVID Vaccine doses administered (per 100k population) (Sep 19, 2023)
COVID Vaccine doses distributed (Sep 19, 2023)
COVID Vaccine doses administered (Sep 19, 2023)
Likely homosexual households (%)
Likely homosexual households (% change since 2000)
Likely homosexual households - Lesbian couples (%)
Likely homosexual households - Lesbian couples (% change since 2000)
Likely homosexual households - Gay men (%)
Likely homosexual households - Gay men (% change since 2000)
Cost of living index
Median gross rent ($)
Median contract rent ($)
Median monthly housing costs ($)
Median house or condo value ($)
Median house or condo value ($ change since 2000)
Mean house or condo value by units in structure - 1, detached ($)
Mean house or condo value by units in structure - 1, attached ($)
Mean house or condo value by units in structure - 2 ($)
Mean house or condo value by units in structure by units in structure - 3 or 4 ($)
Mean house or condo value by units in structure - 5 or more ($)
Mean house or condo value by units in structure - Boat, RV, van, etc. ($)
Mean house or condo value by units in structure - Mobile home ($)
Median house or condo value ($) - White
Median house or condo value ($) - Black or African American
Median house or condo value ($) - Asian
Median house or condo value ($) - Hispanic or Latino
Median house or condo value ($) - American Indian and Alaska Native
Median house or condo value ($) - Multirace
Median house or condo value ($) - Other Race
Median resident age
Resident age diversity
Median resident age - Males
Median resident age - Females
Median resident age - White
Median resident age - Black or African American
Median resident age - Asian
Median resident age - Hispanic or Latino
Median resident age - American Indian and Alaska Native
Median resident age - Multirace
Median resident age - Other Race
Median resident age - Males - White
Median resident age - Males - Black or African American
Median resident age - Males - Asian
Median resident age - Males - Hispanic or Latino
Median resident age - Males - American Indian and Alaska Native
Median resident age - Males - Multirace
Median resident age - Males - Other Race
Median resident age - Females - White
Median resident age - Females - Black or African American
Median resident age - Females - Asian
Median resident age - Females - Hispanic or Latino
Median resident age - Females - American Indian and Alaska Native
Median resident age - Females - Multirace
Median resident age - Females - Other Race
Commute - mean travel time to work (minutes)
Travel time to work - Less than 5 minutes (%)
Travel time to work - Less than 5 minutes (% change since 2000)
Travel time to work - 5 to 9 minutes (%)
Travel time to work - 5 to 9 minutes (% change since 2000)
Travel time to work - 10 to 19 minutes (%)
Travel time to work - 10 to 19 minutes (% change since 2000)
Travel time to work - 20 to 29 minutes (%)
Travel time to work - 20 to 29 minutes (% change since 2000)
Travel time to work - 30 to 39 minutes (%)
Travel time to work - 30 to 39 minutes (% change since 2000)
Travel time to work - 40 to 59 minutes (%)
Travel time to work - 40 to 59 minutes (% change since 2000)
Travel time to work - 60 to 89 minutes (%)
Travel time to work - 60 to 89 minutes (% change since 2000)
Travel time to work - 90 or more minutes (%)
Travel time to work - 90 or more minutes (% change since 2000)
Marital status - Never married (%)
Marital status - Now married (%)
Marital status - Separated (%)
Marital status - Widowed (%)
Marital status - Divorced (%)
Median family income ($)
Median family income (% change since 2000)
Median non-family income ($)
Median non-family income (% change since 2000)
Median per capita income ($)
Median per capita income (% change since 2000)
Median family income ($) - White
Median family income ($) - Black or African American
Median family income ($) - Asian
Median family income ($) - Hispanic or Latino
Median family income ($) - American Indian and Alaska Native
Median family income ($) - Multirace
Median family income ($) - Other Race
Median year house/condo built
Median year apartment built
Year house built - Built 2005 or later (%)
Year house built - Built 2000 to 2004 (%)
Year house built - Built 1990 to 1999 (%)
Year house built - Built 1980 to 1989 (%)
Year house built - Built 1970 to 1979 (%)
Year house built - Built 1960 to 1969 (%)
Year house built - Built 1950 to 1959 (%)
Year house built - Built 1940 to 1949 (%)
Year house built - Built 1939 or earlier (%)
Average household size
Household density (households per square mile)
Average household size - White
Average household size - Black or African American
Average household size - Asian
Average household size - Hispanic or Latino
Average household size - American Indian and Alaska Native
Average household size - Multirace
Average household size - Other Race
Occupied housing units (%)
Vacant housing units (%)
Owner occupied housing units (%)
Renter occupied housing units (%)
Vacancy status - For rent (%)
Vacancy status - For sale only (%)
Vacancy status - Rented or sold, not occupied (%)
Vacancy status - For seasonal, recreational, or occasional use (%)
Vacancy status - For migrant workers (%)
Vacancy status - Other vacant (%)
Residents with income below the poverty level (%)
Residents with income below 50% of the poverty level (%)
Children below poverty level (%)
Poor families by family type - Married-couple family (%)
Poor families by family type - Male, no wife present (%)
Poor families by family type - Female, no husband present (%)
Poverty status for native-born residents (%)
Poverty status for foreign-born residents (%)
Poverty among high school graduates not in families (%)
Poverty among people who did not graduate high school not in families (%)
Residents with income below the poverty level (%) - White
Residents with income below the poverty level (%) - Black or African American
Residents with income below the poverty level (%) - Asian
Residents with income below the poverty level (%) - Hispanic or Latino
Residents with income below the poverty level (%) - American Indian and Alaska Native
Residents with income below the poverty level (%) - Multirace
Residents with income below the poverty level (%) - Other Race
Air pollution - Air Quality Index (AQI)
Air pollution - CO
Air pollution - NO2
Air pollution - SO2
Air pollution - Ozone
Air pollution - PM10
Air pollution - PM25
Air pollution - Pb
Crime - Murders per 100,000 population
Crime - Rapes per 100,000 population
Crime - Robberies per 100,000 population
Crime - Assaults per 100,000 population
Crime - Burglaries per 100,000 population
Crime - Thefts per 100,000 population
Crime - Auto thefts per 100,000 population
Crime - Arson per 100,000 population
Crime - City-data.com crime index
Crime - Violent crime index
Crime - Property crime index
Crime - Murders per 100,000 population (5 year average)
Crime - Rapes per 100,000 population (5 year average)
Crime - Robberies per 100,000 population (5 year average)
Crime - Assaults per 100,000 population (5 year average)
Crime - Burglaries per 100,000 population (5 year average)
Crime - Thefts per 100,000 population (5 year average)
Crime - Auto thefts per 100,000 population (5 year average)
Crime - Arson per 100,000 population (5 year average)
Crime - City-data.com crime index (5 year average)
Crime - Violent crime index (5 year average)
Crime - Property crime index (5 year average)
1996 Presidential Elections Results (%) - Democratic Party (Clinton)
1996 Presidential Elections Results (%) - Republican Party (Dole)
1996 Presidential Elections Results (%) - Other
2000 Presidential Elections Results (%) - Democratic Party (Gore)
2000 Presidential Elections Results (%) - Republican Party (Bush)
2000 Presidential Elections Results (%) - Other
2004 Presidential Elections Results (%) - Democratic Party (Kerry)
2004 Presidential Elections Results (%) - Republican Party (Bush)
2004 Presidential Elections Results (%) - Other
2008 Presidential Elections Results (%) - Democratic Party (Obama)
2008 Presidential Elections Results (%) - Republican Party (McCain)
2008 Presidential Elections Results (%) - Other
2012 Presidential Elections Results (%) - Democratic Party (Obama)
2012 Presidential Elections Results (%) - Republican Party (Romney)
2012 Presidential Elections Results (%) - Other
2016 Presidential Elections Results (%) - Democratic Party (Clinton)
2016 Presidential Elections Results (%) - Republican Party (Trump)
2016 Presidential Elections Results (%) - Other
2020 Presidential Elections Results (%) - Democratic Party (Biden)
2020 Presidential Elections Results (%) - Republican Party (Trump)
2020 Presidential Elections Results (%) - Other
Ancestries Reported - Arab (%)
Ancestries Reported - Czech (%)
Ancestries Reported - Danish (%)
Ancestries Reported - Dutch (%)
Ancestries Reported - English (%)
Ancestries Reported - French (%)
Ancestries Reported - French Canadian (%)
Ancestries Reported - German (%)
Ancestries Reported - Greek (%)
Ancestries Reported - Hungarian (%)
Ancestries Reported - Irish (%)
Ancestries Reported - Italian (%)
Ancestries Reported - Lithuanian (%)
Ancestries Reported - Norwegian (%)
Ancestries Reported - Polish (%)
Ancestries Reported - Portuguese (%)
Ancestries Reported - Russian (%)
Ancestries Reported - Scotch-Irish (%)
Ancestries Reported - Scottish (%)
Ancestries Reported - Slovak (%)
Ancestries Reported - Subsaharan African (%)
Ancestries Reported - Swedish (%)
Ancestries Reported - Swiss (%)
Ancestries Reported - Ukrainian (%)
Ancestries Reported - United States (%)
Ancestries Reported - Welsh (%)
Ancestries Reported - West Indian (%)
Ancestries Reported - Other (%)
Educational Attainment - No schooling completed (%)
Educational Attainment - Less than high school (%)
Educational Attainment - High school or equivalent (%)
Educational Attainment - Less than 1 year of college (%)
Educational Attainment - 1 or more years of college (%)
Educational Attainment - Associate degree (%)
Educational Attainment - Bachelor's degree (%)
Educational Attainment - Master's degree (%)
Educational Attainment - Professional school degree (%)
Educational Attainment - Doctorate degree (%)
School Enrollment - Nursery, preschool (%)
School Enrollment - Kindergarten (%)
School Enrollment - Grade 1 to 4 (%)
School Enrollment - Grade 5 to 8 (%)
School Enrollment - Grade 9 to 12 (%)
School Enrollment - College undergrad (%)
School Enrollment - Graduate or professional (%)
School Enrollment - Not enrolled in school (%)
School enrollment - Public schools (%)
School enrollment - Private schools (%)
School enrollment - Not enrolled (%)
Median number of rooms in houses and condos
Median number of rooms in apartments
Housing units lacking complete plumbing facilities (%)
Housing units lacking complete kitchen facilities (%)
Density of houses
Urban houses (%)
Rural houses (%)
Households with people 60 years and over (%)
Households with people 65 years and over (%)
Households with people 75 years and over (%)
Households with one or more nonrelatives (%)
Households with no nonrelatives (%)
Population in households (%)
Family households (%)
Nonfamily households (%)
Population in families (%)
Family households with own children (%)
Median number of bedrooms in owner occupied houses
Mean number of bedrooms in owner occupied houses
Median number of bedrooms in renter occupied houses
Mean number of bedrooms in renter occupied houses
Median number of vehichles in owner occupied houses
Mean number of vehichles in owner occupied houses
Median number of vehichles in renter occupied houses
Mean number of vehichles in renter occupied houses
Mortgage status - with mortgage (%)
Mortgage status - with second mortgage (%)
Mortgage status - with home equity loan (%)
Mortgage status - with both second mortgage and home equity loan (%)
Mortgage status - without a mortgage (%)
Average family size
Average family size - White
Average family size - Black or African American
Average family size - Asian
Average family size - Hispanic or Latino
Average family size - American Indian and Alaska Native
Average family size - Multirace
Average family size - Other Race
Geographical mobility - Same house 1 year ago (%)
Geographical mobility - Moved within same county (%)
Geographical mobility - Moved from different county within same state (%)
Geographical mobility - Moved from different state (%)
Geographical mobility - Moved from abroad (%)
Place of birth - Born in state of residence (%)
Place of birth - Born in other state (%)
Place of birth - Native, outside of US (%)
Place of birth - Foreign born (%)
Housing units in structures - 1, detached (%)
Housing units in structures - 1, attached (%)
Housing units in structures - 2 (%)
Housing units in structures - 3 or 4 (%)
Housing units in structures - 5 to 9 (%)
Housing units in structures - 10 to 19 (%)
Housing units in structures - 20 to 49 (%)
Housing units in structures - 50 or more (%)
Housing units in structures - Mobile home (%)
Housing units in structures - Boat, RV, van, etc. (%)
House/condo owner moved in on average (years ago)
Renter moved in on average (years ago)
Year householder moved into unit - Moved in 1999 to March 2000 (%)
Year householder moved into unit - Moved in 1995 to 1998 (%)
Year householder moved into unit - Moved in 1990 to 1994 (%)
Year householder moved into unit - Moved in 1980 to 1989 (%)
Year householder moved into unit - Moved in 1970 to 1979 (%)
Year householder moved into unit - Moved in 1969 or earlier (%)
Means of transportation to work - Drove car alone (%)
Means of transportation to work - Carpooled (%)
Means of transportation to work - Public transportation (%)
Means of transportation to work - Bus or trolley bus (%)
Means of transportation to work - Streetcar or trolley car (%)
Means of transportation to work - Subway or elevated (%)
Means of transportation to work - Railroad (%)
Means of transportation to work - Ferryboat (%)
Means of transportation to work - Taxicab (%)
Means of transportation to work - Motorcycle (%)
Means of transportation to work - Bicycle (%)
Means of transportation to work - Walked (%)
Means of transportation to work - Other means (%)
Working at home (%)
Industry diversity
Most Common Industries - Agriculture, forestry, fishing and hunting, and mining (%)
Most Common Industries - Agriculture, forestry, fishing and hunting (%)
Most Common Industries - Mining, quarrying, and oil and gas extraction (%)
Most Common Industries - Construction (%)
Most Common Industries - Manufacturing (%)
Most Common Industries - Wholesale trade (%)
Most Common Industries - Retail trade (%)
Most Common Industries - Transportation and warehousing, and utilities (%)
Most Common Industries - Transportation and warehousing (%)
Most Common Industries - Utilities (%)
Most Common Industries - Information (%)
Most Common Industries - Finance and insurance, and real estate and rental and leasing (%)
Most Common Industries - Finance and insurance (%)
Most Common Industries - Real estate and rental and leasing (%)
Most Common Industries - Professional, scientific, and management, and administrative and waste management services (%)
Most Common Industries - Professional, scientific, and technical services (%)
Most Common Industries - Management of companies and enterprises (%)
Most Common Industries - Administrative and support and waste management services (%)
Most Common Industries - Educational services, and health care and social assistance (%)
Most Common Industries - Educational services (%)
Most Common Industries - Health care and social assistance (%)
Most Common Industries - Arts, entertainment, and recreation, and accommodation and food services (%)
Most Common Industries - Arts, entertainment, and recreation (%)
Most Common Industries - Accommodation and food services (%)
Most Common Industries - Other services, except public administration (%)
Most Common Industries - Public administration (%)
Occupation diversity
Most Common Occupations - Management, business, science, and arts occupations (%)
Most Common Occupations - Management, business, and financial occupations (%)
Most Common Occupations - Management occupations (%)
Most Common Occupations - Business and financial operations occupations (%)
Most Common Occupations - Computer, engineering, and science occupations (%)
Most Common Occupations - Computer and mathematical occupations (%)
Most Common Occupations - Architecture and engineering occupations (%)
Most Common Occupations - Life, physical, and social science occupations (%)
Most Common Occupations - Education, legal, community service, arts, and media occupations (%)
Most Common Occupations - Community and social service occupations (%)
Most Common Occupations - Legal occupations (%)
Most Common Occupations - Education, training, and library occupations (%)
Most Common Occupations - Arts, design, entertainment, sports, and media occupations (%)
Most Common Occupations - Healthcare practitioners and technical occupations (%)
Most Common Occupations - Health diagnosing and treating practitioners and other technical occupations (%)
Most Common Occupations - Health technologists and technicians (%)
Most Common Occupations - Service occupations (%)
Most Common Occupations - Healthcare support occupations (%)
Most Common Occupations - Protective service occupations (%)
Most Common Occupations - Fire fighting and prevention, and other protective service workers including supervisors (%)
Most Common Occupations - Law enforcement workers including supervisors (%)
Most Common Occupations - Food preparation and serving related occupations (%)
Most Common Occupations - Building and grounds cleaning and maintenance occupations (%)
Most Common Occupations - Personal care and service occupations (%)
Most Common Occupations - Sales and office occupations (%)
Most Common Occupations - Sales and related occupations (%)
Most Common Occupations - Office and administrative support occupations (%)
Most Common Occupations - Natural resources, construction, and maintenance occupations (%)
Most Common Occupations - Farming, fishing, and forestry occupations (%)
Most Common Occupations - Construction and extraction occupations (%)
Most Common Occupations - Installation, maintenance, and repair occupations (%)
Most Common Occupations - Production, transportation, and material moving occupations (%)
Most Common Occupations - Production occupations (%)
Most Common Occupations - Transportation occupations (%)
Most Common Occupations - Material moving occupations (%)
People in Group quarters - Institutionalized population (%)
People in Group quarters - Correctional institutions (%)
People in Group quarters - Federal prisons and detention centers (%)
People in Group quarters - Halfway houses (%)
People in Group quarters - Local jails and other confinement facilities (including police lockups) (%)
People in Group quarters - Military disciplinary barracks (%)
People in Group quarters - State prisons (%)
People in Group quarters - Other types of correctional institutions (%)
People in Group quarters - Nursing homes (%)
People in Group quarters - Hospitals/wards, hospices, and schools for the handicapped (%)
People in Group quarters - Hospitals/wards and hospices for chronically ill (%)
People in Group quarters - Hospices or homes for chronically ill (%)
People in Group quarters - Military hospitals or wards for chronically ill (%)
People in Group quarters - Other hospitals or wards for chronically ill (%)
People in Group quarters - Hospitals or wards for drug/alcohol abuse (%)
People in Group quarters - Mental (Psychiatric) hospitals or wards (%)
People in Group quarters - Schools, hospitals, or wards for the mentally retarded (%)
People in Group quarters - Schools, hospitals, or wards for the physically handicapped (%)
People in Group quarters - Institutions for the deaf (%)
People in Group quarters - Institutions for the blind (%)
People in Group quarters - Orthopedic wards and institutions for the physically handicapped (%)
People in Group quarters - Wards in general hospitals for patients who have no usual home elsewhere (%)
People in Group quarters - Wards in military hospitals for patients who have no usual home elsewhere (%)
People in Group quarters - Juvenile institutions (%)
People in Group quarters - Long-term care (%)
People in Group quarters - Homes for abused, dependent, and neglected children (%)
People in Group quarters - Residential treatment centers for emotionally disturbed children (%)
People in Group quarters - Training schools for juvenile delinquents (%)
People in Group quarters - Short-term care, detention or diagnostic centers for delinquent children (%)
People in Group quarters - Type of juvenile institution unknown (%)
People in Group quarters - Noninstitutionalized population (%)
People in Group quarters - College dormitories (includes college quarters off campus) (%)
People in Group quarters - Military quarters (%)
People in Group quarters - On base (%)
People in Group quarters - Barracks, unaccompanied personnel housing (UPH), (Enlisted/Officer), ;and similar group living quarters for military personnel (%)
People in Group quarters - Transient quarters for temporary residents (%)
People in Group quarters - Military ships (%)
People in Group quarters - Group homes (%)
People in Group quarters - Homes or halfway houses for drug/alcohol abuse (%)
People in Group quarters - Homes for the mentally ill (%)
People in Group quarters - Homes for the mentally retarded (%)
People in Group quarters - Homes for the physically handicapped (%)
People in Group quarters - Other group homes (%)
People in Group quarters - Religious group quarters (%)
People in Group quarters - Dormitories (%)
People in Group quarters - Agriculture workers' dormitories on farms (%)
People in Group quarters - Job Corps and vocational training facilities (%)
People in Group quarters - Other workers' dormitories (%)
People in Group quarters - Crews of maritime vessels (%)
People in Group quarters - Other nonhousehold living situations (%)
People in Group quarters - Other noninstitutional group quarters (%)
Residents speaking English at home (%)
Residents speaking English at home - Born in the United States (%)
Residents speaking English at home - Native, born elsewhere (%)
Residents speaking English at home - Foreign born (%)
Residents speaking Spanish at home (%)
Residents speaking Spanish at home - Born in the United States (%)
Residents speaking Spanish at home - Native, born elsewhere (%)
Residents speaking Spanish at home - Foreign born (%)
Residents speaking other language at home (%)
Residents speaking other language at home - Born in the United States (%)
Residents speaking other language at home - Native, born elsewhere (%)
Residents speaking other language at home - Foreign born (%)
Class of Workers - Employee of private company (%)
Class of Workers - Self-employed in own incorporated business (%)
Class of Workers - Private not-for-profit wage and salary workers (%)
Class of Workers - Local government workers (%)
Class of Workers - State government workers (%)
Class of Workers - Federal government workers (%)
Class of Workers - Self-employed workers in own not incorporated business and Unpaid family workers (%)
House heating fuel used in houses and condos - Utility gas (%)
House heating fuel used in houses and condos - Bottled, tank, or LP gas (%)
House heating fuel used in houses and condos - Electricity (%)
House heating fuel used in houses and condos - Fuel oil, kerosene, etc. (%)
House heating fuel used in houses and condos - Coal or coke (%)
House heating fuel used in houses and condos - Wood (%)
House heating fuel used in houses and condos - Solar energy (%)
House heating fuel used in houses and condos - Other fuel (%)
House heating fuel used in houses and condos - No fuel used (%)
House heating fuel used in apartments - Utility gas (%)
House heating fuel used in apartments - Bottled, tank, or LP gas (%)
House heating fuel used in apartments - Electricity (%)
House heating fuel used in apartments - Fuel oil, kerosene, etc. (%)
House heating fuel used in apartments - Coal or coke (%)
House heating fuel used in apartments - Wood (%)
House heating fuel used in apartments - Solar energy (%)
House heating fuel used in apartments - Other fuel (%)
House heating fuel used in apartments - No fuel used (%)
Armed forces status - In Armed Forces (%)
Armed forces status - Civilian (%)
Armed forces status - Civilian - Veteran (%)
Armed forces status - Civilian - Nonveteran (%)
Fatal accidents locations in years 2005-2021
Fatal accidents locations in 2005
Fatal accidents locations in 2006
Fatal accidents locations in 2007
Fatal accidents locations in 2008
Fatal accidents locations in 2009
Fatal accidents locations in 2010
Fatal accidents locations in 2011
Fatal accidents locations in 2012
Fatal accidents locations in 2013
Fatal accidents locations in 2014
Fatal accidents locations in 2015
Fatal accidents locations in 2016
Fatal accidents locations in 2017
Fatal accidents locations in 2018
Fatal accidents locations in 2019
Fatal accidents locations in 2020
Fatal accidents locations in 2021
Alcohol use - People drinking some alcohol every month (%)
Alcohol use - People not drinking at all (%)
Alcohol use - Average days/month drinking alcohol
Alcohol use - Average drinks/week
Alcohol use - Average days/year people drink much
Audiometry - Average condition of hearing (%)
Audiometry - People that can hear a whisper from across a quiet room (%)
Audiometry - People that can hear normal voice from across a quiet room (%)
Audiometry - Ears ringing, roaring, buzzing (%)
Audiometry - Had a job exposure to loud noise (%)
Audiometry - Had off-work exposure to loud noise (%)
Blood Pressure & Cholesterol - Has high blood pressure (%)
Blood Pressure & Cholesterol - Checking blood pressure at home (%)
Blood Pressure & Cholesterol - Frequently checking blood cholesterol (%)
Blood Pressure & Cholesterol - Has high cholesterol level (%)
Consumer Behavior - Money monthly spent on food at supermarket/grocery store
Consumer Behavior - Money monthly spent on food at other stores
Consumer Behavior - Money monthly spent on eating out
Consumer Behavior - Money monthly spent on carryout/delivered foods
Consumer Behavior - Income spent on food at supermarket/grocery store (%)
Consumer Behavior - Income spent on food at other stores (%)
Consumer Behavior - Income spent on eating out (%)
Consumer Behavior - Income spent on carryout/delivered foods (%)
Current Health Status - General health condition (%)
Current Health Status - Blood donors (%)
Current Health Status - Has blood ever tested for HIV virus (%)
Current Health Status - Left-handed people (%)
Dermatology - People using sunscreen (%)
Diabetes - Diabetics (%)
Diabetes - Had a blood test for high blood sugar (%)
Diabetes - People taking insulin (%)
Diet Behavior & Nutrition - Diet health (%)
Diet Behavior & Nutrition - Milk product consumption (# of products/month)
Diet Behavior & Nutrition - Meals not home prepared (#/week)
Diet Behavior & Nutrition - Meals from fast food or pizza place (#/week)
Diet Behavior & Nutrition - Ready-to-eat foods (#/month)
Diet Behavior & Nutrition - Frozen meals/pizza (#/month)
Drug Use - People that ever used marijuana or hashish (%)
Drug Use - Ever used hard drugs (%)
Drug Use - Ever used any form of cocaine (%)
Drug Use - Ever used heroin (%)
Drug Use - Ever used methamphetamine (%)
Health Insurance - People covered by health insurance (%)
Kidney Conditions-Urology - Avg. # of times urinating at night
Medical Conditions - People with asthma (%)
Medical Conditions - People with anemia (%)
Medical Conditions - People with psoriasis (%)
Medical Conditions - People with overweight (%)
Medical Conditions - Elderly people having difficulties in thinking or remembering (%)
Medical Conditions - People who ever received blood transfusion (%)
Medical Conditions - People having trouble seeing even with glass/contacts (%)
Medical Conditions - People with arthritis (%)
Medical Conditions - People with gout (%)
Medical Conditions - People with congestive heart failure (%)
Medical Conditions - People with coronary heart disease (%)
Medical Conditions - People with angina pectoris (%)
Medical Conditions - People who ever had heart attack (%)
Medical Conditions - People who ever had stroke (%)
Medical Conditions - People with emphysema (%)
Medical Conditions - People with thyroid problem (%)
Medical Conditions - People with chronic bronchitis (%)
Medical Conditions - People with any liver condition (%)
Medical Conditions - People who ever had cancer or malignancy (%)
Mental Health - People who have little interest in doing things (%)
Mental Health - People feeling down, depressed, or hopeless (%)
Mental Health - People who have trouble sleeping or sleeping too much (%)
Mental Health - People feeling tired or having little energy (%)
Mental Health - People with poor appetite or overeating (%)
Mental Health - People feeling bad about themself (%)
Mental Health - People who have trouble concentrating on things (%)
Mental Health - People moving or speaking slowly or too fast (%)
Mental Health - People having thoughts they would be better off dead (%)
Oral Health - Average years since last visit a dentist
Oral Health - People embarrassed because of mouth (%)
Oral Health - People with gum disease (%)
Oral Health - General health of teeth and gums (%)
Oral Health - Average days a week using dental floss/device
Oral Health - Average days a week using mouthwash for dental problem
Oral Health - Average number of teeth
Pesticide Use - Households using pesticides to control insects (%)
Pesticide Use - Households using pesticides to kill weeds (%)
Physical Activity - People doing vigorous-intensity work activities (%)
Physical Activity - People doing moderate-intensity work activities (%)
Physical Activity - People walking or bicycling (%)
Physical Activity - People doing vigorous-intensity recreational activities (%)
Physical Activity - People doing moderate-intensity recreational activities (%)
Physical Activity - Average hours a day doing sedentary activities
Physical Activity - Average hours a day watching TV or videos
Physical Activity - Average hours a day using computer
Physical Functioning - People having limitations keeping them from working (%)
Physical Functioning - People limited in amount of work they can do (%)
Physical Functioning - People that need special equipment to walk (%)
Physical Functioning - People experiencing confusion/memory problems (%)
Physical Functioning - People requiring special healthcare equipment (%)
Prescription Medications - Average number of prescription medicines taking
Preventive Aspirin Use - Adults 40+ taking low-dose aspirin (%)
Reproductive Health - Vaginal deliveries (%)
Reproductive Health - Cesarean deliveries (%)
Reproductive Health - Deliveries resulted in a live birth (%)
Reproductive Health - Pregnancies resulted in a delivery (%)
Reproductive Health - Women breastfeeding newborns (%)
Reproductive Health - Women that had a hysterectomy (%)
Reproductive Health - Women that had both ovaries removed (%)
Reproductive Health - Women that have ever taken birth control pills (%)
Reproductive Health - Women taking birth control pills (%)
Reproductive Health - Women that have ever used Depo-Provera or injectables (%)
Reproductive Health - Women that have ever used female hormones (%)
Sexual Behavior - People 18+ that ever had sex (vaginal, anal, or oral) (%)
Sexual Behavior - Males 18+ that ever had vaginal sex with a woman (%)
Sexual Behavior - Males 18+ that ever performed oral sex on a woman (%)
Sexual Behavior - Males 18+ that ever had anal sex with a woman (%)
Sexual Behavior - Males 18+ that ever had any sex with a man (%)
Sexual Behavior - Females 18+ that ever had vaginal sex with a man (%)
Sexual Behavior - Females 18+ that ever performed oral sex on a man (%)
Sexual Behavior - Females 18+ that ever had anal sex with a man (%)
Sexual Behavior - Females 18+ that ever had any kind of sex with a woman (%)
Sexual Behavior - Average age people first had sex
Sexual Behavior - Average number of female sex partners in lifetime (males 18+)
Sexual Behavior - Average number of female vaginal sex partners in lifetime (males 18+)
Sexual Behavior - Average age people first performed oral sex on a woman (18+)
Sexual Behavior - Average number of woman performed oral sex on in lifetime (18+)
Sexual Behavior - Average number of male sex partners in lifetime (males 18+)
Sexual Behavior - Average number of male anal sex partners in lifetime (males 18+)
Sexual Behavior - Average age people first performed oral sex on a man (18+)
Sexual Behavior - Average number of male oral sex partners in lifetime (18+)
Sexual Behavior - People using protection when performing oral sex (%)
Sexual Behavior - Average number of times people have vaginal or anal sex a year
Sexual Behavior - People having sex without condom (%)
Sexual Behavior - Average number of male sex partners in lifetime (females 18+)
Sexual Behavior - Average number of male vaginal sex partners in lifetime (females 18+)
Sexual Behavior - Average number of female sex partners in lifetime (females 18+)
Sexual Behavior - Circumcised males 18+ (%)
Sleep Disorders - Average hours sleeping at night
Sleep Disorders - People that has trouble sleeping (%)
Smoking-Cigarette Use - People smoking cigarettes (%)
Taste & Smell - People 40+ having problems with smell (%)
Taste & Smell - People 40+ having problems with taste (%)
Taste & Smell - People 40+ that ever had wisdom teeth removed (%)
Taste & Smell - People 40+ that ever had tonsils teeth removed (%)
Taste & Smell - People 40+ that ever had a loss of consciousness because of a head injury (%)
Taste & Smell - People 40+ that ever had a broken nose or other serious injury to face or skull (%)
Taste & Smell - People 40+ that ever had two or more sinus infections (%)
Weight - Average height (inches)
Weight - Average weight (pounds)
Weight - Average BMI
Weight - People that are obese (%)
Weight - People that ever were obese (%)
Weight - People trying to lose weight (%)
Officers per 1,000 residents here:
1.98Georgia average:
2.45
Latest news from Newnan, GA collected exclusively by city-data.com from local newspapers, TV, and radio stations
Ancestries: American (12.0%), German (6.3%), English (4.8%), Irish (4.6%), British West Indian (2.5%), Italian (1.7%).
Current Local Time:
Land area: 17.9 square miles.
Population density: 2,482 people per square mile (low).
4,001 residents are foreign born (5.3% Latin America , 2.6% Asia ).
This city:
9.0%Georgia:
10.4%
Median real estate property taxes paid for housing units with mortgages in 2022: $2,598 (0.7%)Median real estate property taxes paid for housing units with no mortgage in 2022: $1,899 (0.6%)
Nearest city with pop. 50,000+: Atlanta, GA
Nearest city with pop. 1,000,000+: Chicago, IL
Nearest cities:
Turin, GA (3.1 miles),
Latitude: 33.38 N, Longitude: 84.79 W
Nickname or alias (official or unofficial): City of Homes
Daytime population change due to commuting: +511 (+1.2%)Workers who live and work in this city: 7,958 (37.3%)
Single-family new house construction building permits:
2022: 71 buildings , average cost: $321,9002021: 208 buildings , average cost: $366,6002020: 162 buildings , average cost: $303,3002019: 338 buildings , average cost: $292,9002018: 335 buildings , average cost: $348,0002017: 305 buildings , average cost: $280,2002016: 345 buildings , average cost: $291,4002015: 336 buildings , average cost: $293,1002014: 316 buildings , average cost: $298,0002013: 324 buildings , average cost: $249,7002012: 152 buildings , average cost: $254,3002011: 103 buildings , average cost: $225,6002010: 124 buildings , average cost: $227,6002009: 91 buildings , average cost: $224,8002008: 182 buildings , average cost: $223,6002007: 345 buildings , average cost: $223,0002006: 806 buildings , average cost: $199,3002005: 1035 buildings , average cost: $177,0002004: 799 buildings , average cost: $132,2002003: 661 buildings , average cost: $117,8002002: 566 buildings , average cost: $112,4002001: 708 buildings , average cost: $101,7002000: 310 buildings , average cost: $128,2001999: 388 buildings , average cost: $129,4001998: 230 buildings , average cost: $98,3001997: 94 buildings , average cost: $104,900Unemployment in December 2023:
Population change in the 1990s: +3,396 (+26.4%).
Most common occupations in Newnan, GA (%)
Both Males Females
Other production occupations, including supervisors (5.4%)
Other management occupations, except farmers and farm managers (4.3%)
Preschool, kindergarten, elementary, and middle school teachers (3.8%)
Retail sales workers, except cashiers (3.3%)
Other sales and related occupations, including supervisors (3.1%)
Building and grounds cleaning and maintenance occupations (3.1%)
Other office and administrative support workers, including supervisors (2.9%)
Other management occupations, except farmers and farm managers (5.9%)
Other production occupations, including supervisors (5.9%)
Vehicle and mobile equipment mechanics, installers, and repairers (4.3%)
Electrical equipment mechanics and other installation, maintenance, and repair workers, including supervisors (3.7%)
Construction laborers (3.4%)
Other material moving workers, except laborers (3.2%)
Driver/sales workers and truck drivers (3.1%)
Preschool, kindergarten, elementary, and middle school teachers (5.7%)
Other office and administrative support workers, including supervisors (5.2%)
Other production occupations, including supervisors (4.8%)
Secretaries and administrative assistants (4.5%)
Retail sales workers, except cashiers (4.1%)
Building and grounds cleaning and maintenance occupations (3.5%)
Material recording, scheduling, dispatching, and distributing workers (3.5%)
Air pollution and air quality trends(lower is better)
AQI Ozone PM2.5
Tornado activity:
Newnan-area historical tornado activity is slightly above Georgia state average. It is 62% greater than the overall U.S. average.
On 4/2/1970, a category F3 (max. wind speeds 158-206 mph) tornado 3.3 miles away from the Newnan city center caused between $5000 and $50,000 in damages.
On 3/5/1989, a category F3 tornado 7.0 miles away from the city center injured 23 people and caused between $5,000,000 and $50,000,000 in damages.
Earthquake activity:
Newnan-area historical earthquake activity is significantly above Georgia state average. It is 55% greater than the overall U.S. average. On 4/29/2003 at 08:59:39, a magnitude 4.9 (4.4 MB, 4.6 MW, 4.9 LG, Class: Light, Intensity: IV - V) earthquake occurred 91.1 miles away from Newnan center On 8/2/1974 at 08:52:09, a magnitude 4.9 (4.3 MB, 4.9 LG) earthquake occurred 136.9 miles away from the city center On 4/29/2003 at 08:59:39, a magnitude 4.6 (4.6 MW, Depth: 12.3 mi) earthquake occurred 91.1 miles away from the city center On 1/18/1999 at 07:00:53, a magnitude 4.8 (4.8 MB, 4.0 LG, Depth: 0.6 mi) earthquake occurred 142.4 miles away from the city center On 10/24/1997 at 08:35:17, a magnitude 4.9 (4.8 MB, 4.2 MS, 4.9 LG, Depth: 6.2 mi) earthquake occurred 213.0 miles away from the city center On 11/30/1973 at 07:48:41, a magnitude 4.7 (4.7 MB, 4.6 ML) earthquake occurred 174.0 miles away from the city center Magnitude types: regional Lg-wave magnitude (LG), body-wave magnitude (MB), local magnitude (ML), surface-wave magnitude (MS), moment magnitude (MW) Natural disasters: The number of natural disasters in Coweta County (9) is smaller than the US average (15).Major Disasters (Presidential) Declared: 5Emergencies Declared: 3Floods: 3, Hurricanes: 2, Storms: 2, Tornadoes: 2, Winter Storms: 2, Drought: 1, Heavy Rain: 1, Tropical Storm: 1, Wind: 1, Other: 1 (Note: some incidents may be assigned to more than one category). Hospitals in Newnan: COUNTRYSIDE HOSPICE CARE, INC. (37-G CALUMET PARKWAY, SUITE 202) CROSSPOINT HEALTH CARE, INC (19 WEST BROAD STREET) GEORGIA BAPTIST HOSPICE (2 LEE ST) NEWNAN HOSPITAL (PO BOX 997) NEWNAN HOSPITAL WEST (provides emergency services, 60 HOSPITAL ROAD) PIEDMONT NEWNAN HOSPITAL, INC (Voluntary non-profit - Private, 745 POPLAR ROAD) SOUTHEASTERN REGIONAL MEDICAL CENTER (Proprietary, 600 PARKWAY NORTH) Nursing Homes in Newnan: AVALON HEALTH AND REHABILITATION (120 SPRING STREET) NEWNAN HEALTH AND REHABILITATION (244 EAST BROAD STREET) STARCREST OF NEWNAN (120 SPRING STREET) Dialysis Facilities in Newnan: DAVITA NEWNAN DIALYSIS (242 BULLSBORO DR) NEWNAN DIALYSIS UNIT (101 WERZ INDUSTRIAL DRIVE) Colleges/universities with over 2000 students nearest to Newnan:
University of West Georgia (about 23 miles; Carrollton, GA ; Full-time enrollment: 10,358)
Southern Crescent Technical College (about 30 miles; Griffin, GA ; FT enrollment: 4,168)
Clayton State University (about 31 miles; Morrow, GA ; FT enrollment: 5,844)
West Georgia Technical College (about 32 miles; Waco, GA ; FT enrollment: 4,768)
Atlanta Metropolitan State College (about 32 miles; Atlanta, GA ; FT enrollment: 2,437)
Atlanta Technical College (about 33 miles; Atlanta, GA ; FT enrollment: 4,217)
Morehouse College (about 34 miles; Atlanta, GA ; FT enrollment: 2,379)
Public high schools in Newnan:
Private high schools in Newnan: THE HERITAGE SCHOOL Students: 436, Location: 2093 HIGHWAY 29 N, Grades: PK-12)
NEWNAN CHRISTIAN SCHOOL Students: 18, Location: 1485 HIGHWAY 34 E STE B2, Grades: 2-12)
Biggest public elementary/middle schools in Newnan: ODYSSEY SCHOOL Students: 4,366, Location: 14 SAINT JOHN CIR, Grades: KG-8, Charter school )MADRAS MIDDLE SCHOOL Students: 1,021, Location: 240 EDGEWORTH RD, Grades: 6-8)WELCH ELEMENTARY SCHOOL Students: 909, Location: 240 MARY FREEMAN RD, Grades: PK-5)ARNALL MIDDLE SCHOOL Students: 883, Location: 700 LORA SMITH RD, Grades: 6-8)NEWNAN CROSSING ELEMENTARY SCHOOL Students: 835, Location: 1267 LOWER FAYETTEVILLE RD, Grades: PK-5)SMOKEY ROAD MIDDLE SCHOOL Students: 814, Location: 965 SMOKEY RD, Grades: 6-8)WHITE OAK ELEMENTARY SCHOOL Students: 695, Location: 770 LORA SMITH RD, Grades: PK-5)ARBOR SPRINGS ELEMENTARY Students: 673, Location: 4840 HIGHWAY 29 N, Grades: PK-5)JEFFERSON PARKWAY ELEMENTARY SCHOOL Students: 532, Location: 154 MILLARD FARMER IND BLVD, Grades: PK-5)NORTHSIDE ELEMENTARY SCHOOL Students: 530, Location: 720 COUNTRY CLUB RD, Grades: PK-5)Private elementary/middle school in Newnan: CAROLYN BARRON MONTESSORI SCHOOL Students: 94, Location: 195 JACKSON ST, Grades: PK-7)
See full list of schools located in Newnan Library in Newnan: COWETA COUNTY PUBLIC LIBRARY SYSTEM Operating income: $1,653,029; Location: 85 LITERARY LANE; 179,831 books ; 5,360 audio materials ; 4,685 video materials ; 146 state licensed databases ; 301 print serial subscriptions ; 3 electronic serial subscriptions )
User-submitted facts and corrections:
Newnan Christian School, 1608 N. Hwy. 29
Birthplace of Alan Jackson
Carolyn Barron Montessori School - 195 Jackson Street Serves children 18 months - 14 years
Notable locations in Newnan: (A) , Coweta County Courthouse (B) , Newnan City Hall (C) . Display/hide their locations on the map
Churches in Newnan include: (A) , Burns Chapel Methodist Episcopal Church (B) , First Baptist Church (C) , First Christian Church (D) , First Presbyterian Church (E) , Friendship Baptist Church (F) , Zion Hill Baptist Church (G) , Holiness Church (H) , Newnan Presbyterian Church (I) . Display/hide their locations on the map
Cemeteries: (1) , Davis Cemetery (2) , Eastview Cemetery (3) , Oak Hill Cemetery (4) , Westview Cemetery (5) . Display/hide their locations on the map
Reservoirs: (A) , Newnan Water and Light Lake Number Four (B) , Newnan Water and Light Lake Number Six (C) , Newnan Waterworks Reservoir Number 5 (D) , Newnan Waterworks Reservoir Number One (E) , Newnan Waterworks Reservoir Number Two (F) , Newnan Waterworks Reservoir Number Three (G) . Display/hide their locations on the map
Parks in Newnan include: (1) , Lambert Field (2) , Newnan Commercial Historic District (3) , Northwest Newnan Residential Historic District (4) . Display/hide their locations on the map
Tourist attractions: (1) , African American Heritage Museum (92 Farmer Street) (2) , Newnan Coweta Historical Society (Cultural Attractions- Events- & Facilities; 30 Temple Avenue) (3) , Dunaway Gardens (Botanical Gardens; 3218 Roscoe Road) (4) , Jack's Burgers & Billiards (Amusement & Theme Parks; 59 Old Corinth Road) (5) . Display/hide their approximate locations on the map
Hotels: (1) , Hampton Inn Atlanta/Newnan (50 Hampton Way) (2) , Comfort Inn Newnan (590 Bullsboro Drive) (3) . Display/hide their approximate locations on the map
Courts: (1) , Coweta County Government - Courthouse- Clerk of State Court (9 East Broad Street) (2) , Courts - Federal - District Court- Clerk's Office (18 Greenville Street) (3) , Coweta County Government - Courthouse- Judge Of State Court (100 Court Square) (4) , Coweta County Government - State Court Judges (22 East Broad Street) (5) , Coweta County Government - State Court Judges- Public Defender State C (100 Court Square) (6) , Coweta County Government - Superior Court Public Defender (8 Madison Street # A) (7) , Savannah Court Of Newman (27 Belk) (8) , Courts - Federal - Bankruptcy Court- Clerk's Office (18 Greenville Street) (9) . Display/hide their approximate locations on the map
Birthplace of: Calvin Johnson - College football player, Doug Stone - Male singer, Jack Tarpley Camp Jr. - Federal judge, Alton H. Maddox, Jr. - Lawyer, Carlos Brown (American football) - Football player, Ellis Arnall - Governor of Georgia, Hamilton Bohannon - Musician, Jack Brod - Business executive, Joe M. Jackson - Air Force Medal of Honor recipient, John J. Young, Jr. - US Department of Defense official.
Coweta County has a predicted average indoor radon screening level between 2 and 4 pCi/L (pico curies per liter) - Moderate Potential Drinking water stations with addresses in Newnan and their reported violations in the past:
COWETA WATER & SEWER AUTH. (Population served: 59,800, Surface water):
Past health violations:
MCL, Monthly (TCR) - In JUL-2007, Contaminant: Coliform. Follow-up actions: St Public Notif requested (JUL-26-2007), St Violation/Reminder Notice (JUL-26-2007), St Public Notif received (SEP-11-2007)
MCL, Monthly (TCR) - In JUN-2007, Contaminant: Coliform. Follow-up actions: St Public Notif requested (JUN-21-2007), St Violation/Reminder Notice (JUN-21-2007), St Public Notif received (JUL-25-2007)
Past monitoring violations:
Monitoring and Reporting (DBP) - Between JUL-2011 and SEP-2011, Contaminant: CARBON, TOTAL. Follow-up actions: St Intentional no-action (SEP-08-2011)
Average household size: This city:
2.6 peopleGeorgia:
2.6 people
Percentage of family households: This city:
67.5%Whole state:
68.5%
Percentage of households with unmarried partners: This city:
6.4%Whole state:
5.9%
Likely homosexual households (counted as self-reported same-sex unmarried-partner households)
Lesbian couples: 0.4% of all households Gay men: 0.3% of all households
People in group quarters in Newnan in 2010:
377 people in local jails and other municipal confinement facilities
135 people in nursing facilities/skilled-nursing facilities
6 people in group homes for juveniles (non-correctional)
People in group quarters in Newnan in 2000:
478 people in local jails and other confinement facilities (including police lockups)
287 people in nursing homes
7 people in other noninstitutional group quarters
Banks with most branches in Newnan (2011 data):
Synovus Bank: Temple Avenue Branch, Court Square Branch, Bank Of Coweta Branch, Thomas Crossroads Branch, Lakeside Branch. Info updated 2011/01/25: Bank assets: $26,863.3 mil, Deposits: $22,415.0 mil, headquarters in Columbus, GA, positive income , Commercial Lending Specialization, 296 total offices , Holding Company: Synovus Financial Corp.
Branch Banking and Trust Company: Thomas Crossroads Branch, Wesley Woods Branch, Newnan Main Branch, Jefferson Street Branch. Info updated 2010/03/29: Bank assets: $168,867.6 mil, Deposits: $127,549.5 mil, headquarters in Winston Salem, NC, positive income , Commercial Lending Specialization, 1793 total offices , Holding Company: Bb&T Corporation
Bank of America, National Association: Bullsboro Branch, Coweta Crossroads Bkg. Ctr. Branch, Newnan Main Branch. Info updated 2009/11/18: Bank assets: $1,451,969.3 mil, Deposits: $1,077,176.8 mil, headquarters in Charlotte, NC, positive income , 5782 total offices , Holding Company: Bank Of America Corporation
Wells Fargo Bank, National Association: Shenandoah Branch, Newnan Main Branch, Newnan Corners Branch. Info updated 2011/04/05: Bank assets: $1,161,490.0 mil, Deposits: $905,653.0 mil, headquarters in Sioux Falls, SD, positive income , 6395 total offices , Holding Company: Wells Fargo & Company
The Bank of Georgia: Avery Park Branch at 471 Highway 29 North, branch established on 2002/11/18; Summit Branch at 10 Baynard Park, branch established on 2007/10/01. Info updated 2006/11/03: Bank assets: $360.9 mil, Deposits: $332.2 mil, headquarters in Peachtree City, GA, negative income in the last year , Commercial Lending Specialization, 8 total offices , Holding Company: Georgia Bancshares, Inc.
CharterBank: Industrial Blvd Branch at 145 Millard Farmer Industrial Boulevard, branch established on 2000/04/20; Branch 02 Branch at 60 Salbide Avenue, branch established on 2003/11/12. Info updated 2011/09/12: Bank assets: $1,115.4 mil, Deposits: $869.2 mil, headquarters in West Point, GA, positive income , Commercial Lending Specialization, 23 total offices
Regions Bank: Thomas Crossroads at 3111 East Highway 34, branch established on 1999/05/30; Newnan Branch at 40 Bullsboro Drive, branch established on 1987/11/23. Info updated 2011/02/24: Bank assets: $123,368.2 mil, Deposits: $98,301.3 mil, headquarters in Birmingham, AL, positive income , Commercial Lending Specialization, 1778 total offices , Holding Company: Regions Financial Corporation
United Community Bank: Newnan Branch at 71 Bullsboro, branch established on 2004/06/01; Sullivan Road Branch at 2245 East Highway 34, branch established on 2005/04/01. Info updated 2009/06/23: Bank assets: $6,977.4 mil, Deposits: $6,170.1 mil, headquarters in Blairsville, GA, negative income in the last year , Commercial Lending Specialization, 106 total offices , Holding Company: United Community Banks, Inc.
Bank of the Ozarks: Newnan Downtown Branch at 16 E Broad St, branch established on 2002/12/16. Info updated 2011/05/03: Bank assets: $3,828.0 mil, Deposits: $2,955.2 mil, headquarters in Little Rock, AR, positive income , Commercial Lending Specialization, 115 total offices , Holding Company: Bank Of The Ozarks Inc
6 other banks with 6 local branches
For population 15 years and over in Newnan:
Never married: 32.7%Now married: 47.5%Separated: 1.0%Widowed: 6.7%Divorced: 12.2% For population 25 years and over in Newnan:
High school or higher: 90.3%Bachelor's degree or higher: 38.2%Graduate or professional degree: 14.8%Unemployed: 7.1%Mean travel time to work (commute): 23.5 minutes
Education Gini index (Inequality in education) Here:
10.8Georgia average:
12.2
Religion statistics for Newnan, GA (based on Coweta County data)
Religion Adherents Congregations Evangelical Protestant 40,586 106 Mainline Protestant 9,804 32 Catholic 5,383 2 Black Protestant 2,091 12 Other 1,671 6 None 67,782 -
Source: Clifford Grammich, Kirk Hadaway, Richard Houseal, Dale E.Jones, Alexei Krindatch, Richie Stanley and Richard H.Taylor. 2012. 2010 U.S.Religion Census: Religious Congregations & Membership Study. Association of Statisticians of American Religious Bodies. Jones, Dale E., et al. 2002. Congregations and Membership in the United States 2000. Nashville, TN: Glenmary Research Center. Graphs represent county-level data
Food Environment Statistics: Number of grocery stores : 21Coweta County :
1.77 / 10,000 pop.Georgia :
1.91 / 10,000 pop.
Number of supercenters and club stores : 1This county :
0.08 / 10,000 pop.Georgia :
0.15 / 10,000 pop.
Number of convenience stores (no gas) : 12This county :
1.01 / 10,000 pop.Georgia :
0.86 / 10,000 pop.
Number of convenience stores (with gas) : 40This county :
3.38 / 10,000 pop.Georgia :
5.12 / 10,000 pop.
Number of full-service restaurants : 64Coweta County :
5.40 / 10,000 pop.Georgia :
7.41 / 10,000 pop.
Adult diabetes rate : Coweta County :
10.6%Georgia :
10.4%
Adult obesity rate : Coweta County :
28.7%Georgia :
27.8%
Low-income preschool obesity rate : This county :
14.1%State :
14.6%
Health and Nutrition:
Average overall health of teeth and gums : This city:
46.5%Georgia:
46.5%
People feeling badly about themselves : This city:
19.1%Georgia:
20.4%
People not drinking alcohol at all : This city:
11.7%State:
10.8%
Average hours sleeping at night : General health condition : Average condition of hearing : More about Health and Nutrition of Newnan, GA Residents
Local government employment and payroll (March 2022)
Function
Full-time employees
Monthly full-time payroll
Average yearly full-time wage
Part-time employees
Monthly part-time payroll
Police Protection - Officers
87 $417,326 $57,562 0 $0 Firefighters
64 $296,050 $55,509 0 $0 Other and Unallocable
63 $401,793 $76,532 1 $889 Parks and Recreation
34 $133,626 $47,162 11 $8,061 Water Supply
30 $190,330 $76,132 0 $0 Streets and Highways
28 $109,093 $46,754 0 $0 Other Government Administration
17 $106,295 $75,032 7 $3,662 Electric Power
15 $116,112 $92,890 0 $0 Police - Other
12 $43,491 $43,491 3 $3,277 Sewerage
10 $61,760 $74,112 0 $0 Financial Administration
8 $39,806 $59,709 1 $766 Solid Waste Management
7 $27,054 $46,378 0 $0 Judicial and Legal
4 $14,949 $44,847 0 $0 Local Libraries
2 $8,361 $50,166 4 $4,103 Fire - Other
1 $3,572 $42,864 0 $0
Totals for Government
382 $1,969,618 $61,873 27 $20,758
Newnan government finances - Expenditure in 2021 (per resident):
Construction - Water Utilities: $12,767,000 ($287.00)
Parks and Recreation: $5,770,000 ($129.71)Electric Utilities: $3,614,000 ($81.24)Regular Highways: $1,496,000 ($33.63)Central Staff Services: $138,000 ($3.10)General - Other: $60,000 ($1.35)General Public Buildings: $54,000 ($1.21)Local Fire Protection: $24,000 ($0.54)Current Operations - Electric Utilities: $25,455,000 ($572.22)
Water Utilities: $15,540,000 ($349.33)Police Protection: $10,043,000 ($225.76)Local Fire Protection: $5,550,000 ($124.76)Regular Highways: $3,978,000 ($89.42)Parks and Recreation: $2,381,000 ($53.52)Central Staff Services: $2,334,000 ($52.47)General - Other: $1,810,000 ($40.69)Financial Administration: $1,199,000 ($26.95)Solid Waste Management: $1,054,000 ($23.69)Protective Inspection and Regulation - Other: $868,000 ($19.51)General Public Buildings: $703,000 ($15.80)Miscellaneous Commercial Activities - Other: $557,000 ($12.52)Judicial and Legal Services: $420,000 ($9.44)Libraries: $206,000 ($4.63)Housing and Community Development: $19,000 ($0.43)Intergovernmental to Local - Other - Electric Utilities: $1,973,000 ($44.35)
Other - Water Utilities: $564,000 ($12.68)Other Capital Outlay - Water Utilities: $1,206,000 ($27.11)
Local Fire Protection: $626,000 ($14.07)Electric Utilities: $419,000 ($9.42)Police Protection: $294,000 ($6.61)Regular Highways: $234,000 ($5.26)Miscellaneous Commercial Activities - Other: $98,000 ($2.20)Financial Administration: $13,000 ($0.29)Parks and Recreation: $8,000 ($0.18)General - Other: $6,000 ($0.13)Total Salaries and Wages: $8,663,000 ($194.74)
Water Utilities - Interest on Debt: $696,000 ($15.65)
Newnan government finances - Revenue in 2021 (per resident):
Charges - Solid Waste Management: $760,000 ($17.08)
Other: $242,000 ($5.44)Parks and Recreation: $114,000 ($2.56)Federal Intergovernmental - Other: $2,228,000 ($50.08)
Local Intergovernmental - Other: $10,834,000 ($243.54)
General Local Government Support: $9,177,000 ($206.29)Electric Utilities: $755,000 ($16.97)Miscellaneous - Interest Earnings: $1,088,000 ($24.46)
Special Assessments: $945,000 ($21.24)General Revenue - Other: $805,000 ($18.10)Fines and Forfeits: $619,000 ($13.91)Sale of Property: $195,000 ($4.38)Rents: $41,000 ($0.92)Donations From Private Sources: $35,000 ($0.79)Revenue - Water Utilities: $34,181,000 ($768.37)
Electric Utilities: $23,858,000 ($536.32)State Intergovernmental - Other: $873,000 ($19.62)
Tax - Property: $7,258,000 ($163.16)
Occupation and Business License - Other: $2,973,000 ($66.83)Insurance Premiums Sales: $2,643,000 ($59.41)Public Utilities Sales: $1,536,000 ($34.53)Alcoholic Beverage Sales: $936,000 ($21.04)Other Selective Sales: $931,000 ($20.93)Other License: $563,000 ($12.66)Other: $220,000 ($4.95)Alcoholic Beverage License: $134,000 ($3.01)
Newnan government finances - Debt in 2021 (per resident):
Long Term Debt - Beginning Outstanding - Unspecified Public Purpose: $26,049,000 ($585.57)
Outstanding Unspecified Public Purpose: $23,639,000 ($531.39)Retired Unspecified Public Purpose: $2,409,000 ($54.15)
Newnan government finances - Cash and Securities in 2021 (per resident):
Other Funds - Cash and Securities: $55,876,000 ($1256.06)
Sinking Funds - Cash and Securities: $288,000 ($6.47)
Businesses in Newnan, GA
Name Count Name Count
AT&T 2 Little Caesars Pizza 1 Academy Sports + Outdoors 1 Long John Silver's 1 Ace Hardware 1 Lowe's 1 Advance Auto Parts 3 Marriott 1 Aeropostale 1 McDonald's 5 American Eagle Outfitters 1 Men's Wearhouse 1 Applebee's 1 Motel 6 1 Arby's 2 Motherhood Maternity 1 Ashley Furniture 1 Nike 4 AutoZone 3 Office Depot 1 Avenue 1 OfficeMax 1 Barnes & Noble 1 Old Navy 1 Bath & Body Works 1 Olive Garden 1 Best Western 1 Panda Express 1 Blockbuster 2 Panera Bread 1 Burger King 1 Papa John's Pizza 1 CVS 4 Payless 1 Chevrolet 1 Penske 2 Chick-Fil-A 2 PetSmart 1 Church's Chicken 1 Pizza Hut 2 Circle K 1 Publix Super Markets 3 Cold Stone Creamery 1 Quiznos 1 Comfort Inn 1 RadioShack 1 Cracker Barrel 1 Ramada 1 Curves 1 Red Lobster 1 DHL 2 Red Robin 1 Dairy Queen 2 Rite Aid 2 Days Inn 1 Rooms To Go 2 Domino's Pizza 2 Ruby Tuesday 1 Dunkin Donuts 1 Rue21 1 FedEx 13 SAS Shoes 1 Ford 1 Sears 1 GNC 2 Shoe Carnival 1 GameStop 2 Sprint Nextel 1 Goodwill 4 Starbucks 3 H&R Block 2 Steak 'n Shake 1 Hardee's 2 Subway 1 Hilton 1 Super 8 1 Hobby Lobby 1 T-Mobile 3 Home Depot 1 T.J.Maxx 1 Howard Johnson 1 Taco Bell 1 Hyundai 1 Target 1 IHOP 1 Toyota 1 JCPenney 1 Travelodge 1 JoS. A. Bank 1 U-Haul 6 Jones New York 1 UPS 15 KFC 1 Vans 1 Kohl's 1 Verizon Wireless 1 Kroger 3 Waffle House 5 La Quinta 1 Walgreens 2 La-Z-Boy 1 Walmart 1 Lane Furniture 1 YMCA 1
Strongest AM radio stations in Newnan:
WNEA (1300 AM; 1 kW; NEWNAN, GA; Owner: WORD CHRISTIAN BROADCASTING, INC.)
WCOH (1400 AM; 1 kW; NEWNAN, GA; Owner: CITICASTERS LICENSES, L.P.)
WGST (640 AM; 50 kW; ATLANTA, GA; Owner: CITICASTERS LICENSES, L.P.)
WMLB (1160 AM; 50 kW; EAST POINT, GA; Owner: ATLANTA AREA BROADCASTING, INC.)
WGUN (1010 AM; 50 kW; ATLANTA, GA; Owner: WGUN, INC.)
WAOK (1380 AM; 50 kW; ATLANTA, GA; Owner: INFINITY BROADCASTING OPERATIONS, INC.)
WKNG (1060 AM; daytime; 50 kW; TALLAPOOSA, GA; Owner: WKNG, INC.)
WSB (750 AM; 50 kW; ATLANTA, GA; Owner: CXR HOLDINGS, INC.)
WCNN (680 AM; 50 kW; NORTH ATLANTA, GA; Owner: DICKEY BROADCASTING COMPANY)
WFTD (1080 AM; daytime; 50 kW; MARIETTA, GA; Owner: PRIETO ENTERPRISES, INC.)
WQXI (790 AM; 28 kW; ATLANTA, GA; Owner: JEFFERSON-PILOT COMMUNICATIONS COMPANY OF GEORGIA)
WAZX (1550 AM; 50 kW; SMYRNA, GA; Owner: GA-MEX BROADCASTING, INC.)
WGSE (720 AM; daytime; 8 kW; HOGANSVILLE, GA; Owner: CITICASTERS LICENSES, L.P.)
Strongest FM radio stations in Newnan:
WALR-FM (104.1 FM; LA GRANGE, GA; Owner: CXR HOLDINGS, INC.)
WBZY-FM (96.7 FM; PEACHTREE CITY, GA; Owner: CITICASTERS LICENSES, L.P.)
WHTA (107.9 FM; HAMPTON, GA; Owner: RADIO ONE LICENSES, LLC)
WPZE (97.5 FM; FAYETTEVILLE, GA; Owner: ROA LICENSES, LLC)
WBTR-FM (92.1 FM; CARROLLTON, GA; Owner: WYAI, INC.)
WMAX-FM (105.3 FM; BOWDON, GA; Owner: CLEAR CHANNEL BROADCASTING LICENSES, INC.)
WVFJ-FM (93.3 FM; MANCHESTER, GA; Owner: PROVIDENT BROADCASTING COMPANY)
WUWG (90.7 FM; CARROLLTON, GA; Owner: WEST GEORGIA COLLEGE)
WWWQ (100.5 FM; ANNISTON, AL; Owner: WNNX LICO, INC.)
WNNX (99.7 FM; ATLANTA, GA; Owner: WNNX LICO, INC.)
WRFG (89.3 FM; ATLANTA, GA; Owner: RADIO FREE GEORGIA BROADCASTING FOUNDATION INC)
WSB-FM (98.5 FM; ATLANTA, GA; Owner: CXR HOLDINGS, INC.)
WJSP-FM (88.1 FM; WARM SPRINGS, GA; Owner: GEORGIA PUBLIC TELECOMMUNICATIONS COMMISSION)
WSTR (94.1 FM; SMYRNA, GA; Owner: JEFFERSON-PILOT COMMUNICATIONS COMPANY OF GEORGIA)
WVEE (103.3 FM; ATLANTA, GA; Owner: INFINITY BROADCASTING OPERATIONS, INC.)
WZGC (92.9 FM; ATLANTA, GA; Owner: INFINITY BROADCASTING CORP. OF ATLANTA)
WKHX-FM (101.5 FM; MARIETTA, GA; Owner: ABC, INC.)
WTBJ (91.3 FM; OXFORD, AL; Owner: TRINITY CHRISTIAN ACADEMY)
WKLS (96.1 FM; ATLANTA, GA; Owner: CITICASTERS LICENSES, L.P.)
WLTM (94.9 FM; ATLANTA, GA; Owner: CITICASTERS LICENSES, L.P.)
TV broadcast stations around Newnan:
W04DB (Channel 4; ATLANTA, GA; Owner: VVILPTV, INC.)
WUVG (Channel 34; ATHENS, GA; Owner: UNIVISION ATLANTA LLC)
WSB-TV (Channel 2; ATLANTA, GA; Owner: WSB-TV HOLDINGS, INC.)
WAGA (Channel 5; ATLANTA, GA; Owner: FOX TELEVISION STATIONS, INC.)
WXIA-TV (Channel 11; ATLANTA, GA; Owner: GANNETT GEORGIA, L.P.)
WHSG (Channel 63; MONROE, GA; Owner: TRINITY BROADCASTING NETWORK)
WUPA (Channel 69; ATLANTA, GA; Owner: VIACOM STATIONS GROUP OF ATLANTA INC.)
WJSP-TV (Channel 28; COLUMBUS, GA; Owner: GEORGIA PUBLIC TELECOMMUNICATIONS COMMISSION)
WANN-LP (Channel 32; ATLANTA, GA; Owner: PRISM BROADCASTING NETWORK, INC.)
WDTA-LP (Channel 53; FAYETTEVILLE, GA; Owner: WORD OF GOD FELLOWSHIP, INC.)
WATL (Channel 36; ATLANTA, GA; Owner: WATL, LLC)
WTBS (Channel 17; ATLANTA, GA; Owner: SUPERSTATION, INC.)
WGCL-TV (Channel 46; ATLANTA, GA; Owner: MEREDITH CORPORATION)
WPBA (Channel 30; ATLANTA, GA; Owner: BOARD OF EDUCATION OF THE CITY OF ATLANTA)
WTHC-LP (Channel 42; ATLANTA, GA; Owner: THE ATLANTA CHANNEL, INC.)
WANX-LP (Channel 26; ATLANTA, GA; Owner: PRISM BROADCASTING NETWORK, INC.)
WIRE-CA (Channel 40; ATLANTA, GA; Owner: COMMERCIAL BROADCASTING CORP.)
W49AD (Channel 49; CARROLLTON, GA; Owner: GEORGIA PUBLIC TELECOMMUNICATIONS COMMISSION)
National Bridge Inventory (NBI) Statistics 62 Number of bridges663ft / 202m Total length $44,476,000 Total costs750,560 Total average daily traffic27,271 Total average daily truck traffic
New bridges - historical statistics
1 1930-1939 4 1940-1949 2 1950-1959 4 1960-1969 4 1970-1979 10 1980-1989 15 1990-1999 10 2000-2009 4 2010-2019
See full National Bridge Inventory statistics for Newnan, GA
Home Mortgage Disclosure Act Aggregated Statistics For Year 2009(Based on 5 partial tracts) A) FHA, FSA/RHS & VA B) Conventional C) Refinancings D) Home Improvement Loans F) Non-occupant Loans on Number Average Value Number Average Value Number Average Value Number Average Value Number Average Value
LOANS ORIGINATED 70 $157,069 54 $162,919 245 $175,118 8 $39,326 27 $130,866 APPLICATIONS APPROVED, NOT ACCEPTED 2 $160,390 3 $137,107 20 $194,748 1 $13,440 2 $122,270 APPLICATIONS DENIED 11 $143,168 8 $146,166 100 $174,470 9 $29,639 7 $102,970 APPLICATIONS WITHDRAWN 12 $147,417 4 $142,460 85 $180,392 3 $89,950 5 $89,604 FILES CLOSED FOR INCOMPLETENESS 0 $0 2 $138,260 16 $166,373 0 $0 3 $71,073
Aggregated Statistics For Year 2008(Based on 5 partial tracts) A) FHA, FSA/RHS & VA B) Conventional C) Refinancings D) Home Improvement Loans F) Non-occupant Loans on G) Loans On Manufactured Number Average Value Number Average Value Number Average Value Number Average Value Number Average Value Number Average Value
LOANS ORIGINATED 84 $166,687 107 $168,944 143 $169,139 11 $70,580 54 $132,347 1 $82,550 APPLICATIONS APPROVED, NOT ACCEPTED 3 $141,507 10 $167,941 24 $159,191 1 $58,720 2 $158,170 0 $0 APPLICATIONS DENIED 13 $132,769 19 $142,479 122 $163,035 18 $53,463 15 $110,117 3 $52,790 APPLICATIONS WITHDRAWN 15 $156,943 15 $160,999 54 $178,808 3 $84,403 7 $128,050 0 $0 FILES CLOSED FOR INCOMPLETENESS 1 $215,990 4 $207,280 9 $175,187 0 $0 2 $91,650 0 $0
Aggregated Statistics For Year 2007(Based on 5 partial tracts) A) FHA, FSA/RHS & VA B) Conventional C) Refinancings D) Home Improvement Loans E) Loans on Dwellings For 5+ Families F) Non-occupant Loans on G) Loans On Manufactured Number Average Value Number Average Value Number Average Value Number Average Value Number Average Value Number Average Value Number Average Value
LOANS ORIGINATED 38 $158,761 307 $145,527 167 $140,719 24 $47,122 2 $10,227,800 75 $112,460 1 $19,280 APPLICATIONS APPROVED, NOT ACCEPTED 1 $206,070 36 $148,075 44 $143,191 7 $71,237 0 $0 10 $146,914 0 $0 APPLICATIONS DENIED 10 $133,335 51 $147,085 173 $150,582 37 $71,278 0 $0 23 $117,999 1 $38,020 APPLICATIONS WITHDRAWN 3 $169,387 47 $143,967 76 $152,604 6 $101,380 0 $0 11 $130,924 0 $0 FILES CLOSED FOR INCOMPLETENESS 1 $87,200 10 $167,703 21 $167,715 1 $36,220 0 $0 4 $93,162 0 $0
Aggregated Statistics For Year 2006(Based on 5 partial tracts) A) FHA, FSA/RHS & VA B) Conventional C) Refinancings D) Home Improvement Loans E) Loans on Dwellings For 5+ Families F) Non-occupant Loans on G) Loans On Manufactured Number Average Value Number Average Value Number Average Value Number Average Value Number Average Value Number Average Value Number Average Value
LOANS ORIGINATED 35 $165,899 371 $124,723 219 $123,212 22 $51,898 2 $1,439,810 98 $95,290 1 $118,890 APPLICATIONS APPROVED, NOT ACCEPTED 1 $174,110 30 $113,534 40 $132,002 6 $26,023 0 $0 8 $97,110 1 $30,250 APPLICATIONS DENIED 2 $139,440 49 $114,514 174 $138,548 35 $48,270 0 $0 20 $90,316 2 $66,910 APPLICATIONS WITHDRAWN 6 $175,277 40 $125,371 94 $142,910 4 $52,815 0 $0 9 $117,843 0 $0 FILES CLOSED FOR INCOMPLETENESS 1 $98,520 7 $132,170 26 $147,671 2 $113,240 0 $0 2 $97,750 0 $0
Aggregated Statistics For Year 2005(Based on 5 partial tracts) A) FHA, FSA/RHS & VA B) Conventional C) Refinancings D) Home Improvement Loans E) Loans on Dwellings For 5+ Families F) Non-occupant Loans on G) Loans On Manufactured Number Average Value Number Average Value Number Average Value Number Average Value Number Average Value Number Average Value Number Average Value
LOANS ORIGINATED 34 $154,149 372 $125,901 231 $135,474 26 $59,252 1 $3,542,180 101 $101,015 2 $62,915 APPLICATIONS APPROVED, NOT ACCEPTED 1 $115,990 22 $124,485 31 $125,587 3 $55,367 0 $0 4 $129,822 1 $63,860 APPLICATIONS DENIED 4 $139,362 44 $125,155 190 $128,169 31 $48,027 0 $0 21 $115,614 1 $91,500 APPLICATIONS WITHDRAWN 3 $145,120 48 $126,690 104 $144,773 10 $136,786 0 $0 15 $123,744 1 $47,920 FILES CLOSED FOR INCOMPLETENESS 1 $89,240 13 $116,958 52 $144,008 1 $113,580 0 $0 3 $176,730 0 $0
Aggregated Statistics For Year 2004(Based on 5 partial tracts) A) FHA, FSA/RHS & VA B) Conventional C) Refinancings D) Home Improvement Loans F) Non-occupant Loans on G) Loans On Manufactured Number Average Value Number Average Value Number Average Value Number Average Value Number Average Value Number Average Value
LOANS ORIGINATED 40 $145,679 292 $124,823 249 $129,172 20 $43,968 89 $93,635 1 $56,910 APPLICATIONS APPROVED, NOT ACCEPTED 1 $163,170 24 $139,920 41 $122,332 4 $37,555 5 $80,316 0 $0 APPLICATIONS DENIED 7 $123,013 28 $126,197 138 $123,164 26 $39,430 11 $86,256 2 $57,875 APPLICATIONS WITHDRAWN 4 $134,655 31 $125,826 78 $126,638 5 $38,516 12 $94,671 0 $0 FILES CLOSED FOR INCOMPLETENESS 2 $140,025 8 $122,726 30 $148,277 2 $30,730 3 $71,060 0 $0
Aggregated Statistics For Year 2003(Based on 5 partial tracts) A) FHA, FSA/RHS & VA B) Conventional C) Refinancings D) Home Improvement Loans E) Loans on Dwellings For 5+ Families F) Non-occupant Loans on Number Average Value Number Average Value Number Average Value Number Average Value Number Average Value Number Average Value
LOANS ORIGINATED 56 $136,950 219 $135,257 519 $136,133 17 $33,187 1 $4,509,850 77 $92,321 APPLICATIONS APPROVED, NOT ACCEPTED 2 $90,190 13 $151,511 44 $146,251 2 $27,905 0 $0 4 $88,258 APPLICATIONS DENIED 5 $120,424 26 $126,968 111 $119,536 15 $22,767 0 $0 9 $76,118 APPLICATIONS WITHDRAWN 3 $147,340 26 $125,758 78 $137,567 3 $23,987 0 $0 9 $81,090 FILES CLOSED FOR INCOMPLETENESS 0 $0 3 $229,643 18 $155,788 1 $106,830 0 $0 1 $89,330
Aggregated Statistics For Year 2002(Based on 3 partial tracts) A) FHA, FSA/RHS & VA B) Conventional C) Refinancings D) Home Improvement Loans F) Non-occupant Loans on Number Average Value Number Average Value Number Average Value Number Average Value Number Average Value
LOANS ORIGINATED 27 $133,750 82 $130,242 165 $123,249 9 $23,223 37 $80,424 APPLICATIONS APPROVED, NOT ACCEPTED 1 $84,150 4 $107,035 23 $136,834 3 $22,360 2 $71,630 APPLICATIONS DENIED 3 $111,343 8 $123,831 62 $102,913 9 $16,739 6 $73,573 APPLICATIONS WITHDRAWN 2 $108,140 6 $120,085 26 $131,275 2 $41,520 1 $163,670 FILES CLOSED FOR INCOMPLETENESS 0 $0 1 $175,050 8 $123,641 0 $0 0 $0
Aggregated Statistics For Year 2001(Based on 3 partial tracts) A) FHA, FSA/RHS & VA B) Conventional C) Refinancings D) Home Improvement Loans F) Non-occupant Loans on Number Average Value Number Average Value Number Average Value Number Average Value Number Average Value
LOANS ORIGINATED 31 $123,495 79 $121,157 134 $115,231 10 $19,620 24 $78,650 APPLICATIONS APPROVED, NOT ACCEPTED 1 $83,560 6 $122,867 13 $119,353 2 $18,830 1 $20,580 APPLICATIONS DENIED 3 $126,623 8 $109,130 55 $76,461 8 $26,971 4 $69,655 APPLICATIONS WITHDRAWN 2 $103,930 6 $150,308 33 $87,873 2 $45,900 4 $78,255 FILES CLOSED FOR INCOMPLETENESS 0 $0 1 $126,910 7 $123,614 0 $0 1 $39,020
Aggregated Statistics For Year 2000(Based on 3 partial tracts) A) FHA, FSA/RHS & VA B) Conventional C) Refinancings D) Home Improvement Loans F) Non-occupant Loans on Number Average Value Number Average Value Number Average Value Number Average Value Number Average Value
LOANS ORIGINATED 24 $113,749 57 $111,967 42 $76,985 11 $16,815 13 $55,085 APPLICATIONS APPROVED, NOT ACCEPTED 1 $87,040 6 $91,310 10 $86,112 5 $26,510 2 $68,075 APPLICATIONS DENIED 4 $90,312 13 $83,637 36 $61,169 13 $18,866 7 $56,477 APPLICATIONS WITHDRAWN 1 $139,030 10 $110,907 21 $64,166 2 $25,800 2 $57,525 FILES CLOSED FOR INCOMPLETENESS 0 $0 1 $197,810 8 $84,796 0 $0 1 $44,180
Aggregated Statistics For Year 1999(Based on 5 partial tracts) A) FHA, FSA/RHS & VA B) Conventional C) Refinancings D) Home Improvement Loans F) Non-occupant Loans on Number Average Value Number Average Value Number Average Value Number Average Value Number Average Value
LOANS ORIGINATED 40 $110,318 113 $120,133 112 $87,328 16 $22,217 20 $61,840 APPLICATIONS APPROVED, NOT ACCEPTED 1 $103,720 6 $90,783 18 $79,015 7 $18,593 2 $68,800 APPLICATIONS DENIED 5 $94,156 19 $104,264 59 $69,493 16 $15,455 4 $63,368 APPLICATIONS WITHDRAWN 2 $104,745 10 $101,979 40 $71,192 4 $63,588 1 $73,730 FILES CLOSED FOR INCOMPLETENESS 0 $0 4 $139,348 12 $75,569 1 $10,110 1 $50,800
Detailed HMDA statistics for the following Tracts:
1702.00
, 1703.02 , 1704.01 , 1706.00 , 1707.00
Private Mortgage Insurance Companies Aggregated Statistics For Year 2009(Based on 5 partial tracts) A) Conventional B) Refinancings C) Non-occupant Loans on Number Average Value Number Average Value Number Average Value
LOANS ORIGINATED 12 $204,884 11 $213,613 1 $98,270 APPLICATIONS APPROVED, NOT ACCEPTED 2 $210,585 4 $169,030 0 $0 APPLICATIONS DENIED 2 $163,855 4 $180,218 0 $0 APPLICATIONS WITHDRAWN 1 $74,620 1 $100,430 0 $0 FILES CLOSED FOR INCOMPLETENESS 1 $74,690 1 $103,720 1 $74,690
Aggregated Statistics For Year 2008(Based on 5 partial tracts) A) Conventional B) Refinancings C) Non-occupant Loans on Number Average Value Number Average Value Number Average Value
LOANS ORIGINATED 42 $175,158 17 $190,246 8 $120,995 APPLICATIONS APPROVED, NOT ACCEPTED 16 $194,768 7 $210,821 2 $103,695 APPLICATIONS DENIED 4 $151,068 2 $136,710 4 $131,968 APPLICATIONS WITHDRAWN 2 $170,835 1 $171,730 0 $0 FILES CLOSED FOR INCOMPLETENESS 3 $146,550 0 $0 1 $59,820
Aggregated Statistics For Year 2007(Based on 5 partial tracts) A) Conventional B) Refinancings C) Non-occupant Loans on Number Average Value Number Average Value Number Average Value
LOANS ORIGINATED 90 $169,496 21 $186,959 12 $129,853 APPLICATIONS APPROVED, NOT ACCEPTED 9 $174,607 6 $164,657 1 $148,340 APPLICATIONS DENIED 1 $204,900 1 $294,950 0 $0 APPLICATIONS WITHDRAWN 3 $168,143 1 $244,810 0 $0 FILES CLOSED FOR INCOMPLETENESS 1 $180,160 0 $0 0 $0
Aggregated Statistics For Year 2006(Based on 5 partial tracts) A) Conventional B) Refinancings C) Non-occupant Loans on Number Average Value Number Average Value Number Average Value
LOANS ORIGINATED 61 $161,509 18 $156,168 9 $110,137 APPLICATIONS APPROVED, NOT ACCEPTED 5 $167,774 4 $149,488 1 $43,700 APPLICATIONS DENIED 0 $0 0 $0 0 $0 APPLICATIONS WITHDRAWN 2 $145,520 1 $71,120 0 $0 FILES CLOSED FOR INCOMPLETENESS 1 $198,760 0 $0 0 $0
Aggregated Statistics For Year 2005(Based on 5 partial tracts) A) Conventional B) Refinancings C) Non-occupant Loans on Number Average Value Number Average Value Number Average Value
LOANS ORIGINATED 47 $155,080 23 $152,327 9 $100,151 APPLICATIONS APPROVED, NOT ACCEPTED 6 $145,303 5 $168,456 2 $100,615 APPLICATIONS DENIED 0 $0 0 $0 0 $0 APPLICATIONS WITHDRAWN 1 $207,170 2 $190,005 1 $43,550 FILES CLOSED FOR INCOMPLETENESS 0 $0 0 $0 0 $0
Aggregated Statistics For Year 2004(Based on 5 partial tracts) A) Conventional B) Refinancings C) Non-occupant Loans on Number Average Value Number Average Value Number Average Value
LOANS ORIGINATED 45 $145,050 27 $142,920 12 $91,201 APPLICATIONS APPROVED, NOT ACCEPTED 5 $230,434 7 $167,066 2 $140,035 APPLICATIONS DENIED 1 $78,330 0 $0 0 $0 APPLICATIONS WITHDRAWN 4 $131,928 2 $137,065 1 $33,690 FILES CLOSED FOR INCOMPLETENESS 1 $82,420 0 $0 0 $0
Aggregated Statistics For Year 2003(Based on 5 partial tracts) A) Conventional B) Refinancings C) Non-occupant Loans on Number Average Value Number Average Value Number Average Value
LOANS ORIGINATED 66 $150,948 71 $149,033 15 $96,980 APPLICATIONS APPROVED, NOT ACCEPTED 4 $152,640 7 $160,057 2 $107,040 APPLICATIONS DENIED 0 $0 1 $145,580 1 $42,810 APPLICATIONS WITHDRAWN 4 $130,538 7 $139,426 3 $95,287 FILES CLOSED FOR INCOMPLETENESS 0 $0 0 $0 0 $0
Aggregated Statistics For Year 2002(Based on 3 partial tracts) A) Conventional B) Refinancings C) Non-occupant Loans on Number Average Value Number Average Value Number Average Value
LOANS ORIGINATED 25 $134,480 23 $149,547 7 $87,433 APPLICATIONS APPROVED, NOT ACCEPTED 3 $140,553 4 $152,988 1 $33,530 APPLICATIONS DENIED 0 $0 0 $0 0 $0 APPLICATIONS WITHDRAWN 0 $0 3 $182,350 0 $0 FILES CLOSED FOR INCOMPLETENESS 0 $0 0 $0 0 $0
Aggregated Statistics For Year 2001(Based on 3 partial tracts) A) Conventional B) Refinancings C) Non-occupant Loans on Number Average Value Number Average Value Number Average Value
LOANS ORIGINATED 37 $149,631 23 $142,533 4 $84,968 APPLICATIONS APPROVED, NOT ACCEPTED 6 $134,592 2 $179,370 1 $103,480 APPLICATIONS DENIED 0 $0 1 $128,480 0 $0 APPLICATIONS WITHDRAWN 1 $141,450 0 $0 0 $0 FILES CLOSED FOR INCOMPLETENESS 0 $0 0 $0 0 $0
Aggregated Statistics For Year 2000(Based on 3 partial tracts) A) Conventional B) Refinancings C) Non-occupant Loans on Number Average Value Number Average Value Number Average Value
LOANS ORIGINATED 28 $126,814 5 $109,400 4 $72,152 APPLICATIONS APPROVED, NOT ACCEPTED 3 $145,683 1 $115,780 1 $41,670 APPLICATIONS DENIED 1 $78,260 0 $0 1 $61,400 APPLICATIONS WITHDRAWN 0 $0 0 $0 0 $0 FILES CLOSED FOR INCOMPLETENESS 0 $0 0 $0 0 $0
Aggregated Statistics For Year 1999(Based on 5 partial tracts) A) Conventional B) Refinancings C) Non-occupant Loans on Number Average Value Number Average Value Number Average Value
LOANS ORIGINATED 48 $130,426 15 $111,212 2 $78,280 APPLICATIONS APPROVED, NOT ACCEPTED 4 $128,202 2 $102,110 0 $0 APPLICATIONS DENIED 0 $0 0 $0 0 $0 APPLICATIONS WITHDRAWN 1 $62,040 1 $55,660 0 $0 FILES CLOSED FOR INCOMPLETENESS 0 $0 0 $0 0 $0
Detailed PMIC statistics for the following Tracts:
1702.00
, 1703.02 , 1704.01 , 1706.00 , 1707.00 Fire-safe hotels and motels in Newnan, Georgia:
Best Western Shenandoah Inn, 620 Hwy 34 E, Newnan, Georgia 30265 Phone: (770) 304-9700, Fax: (770) 304-9700
Super 8 Newnan, 1455 Hwy 29 S, Newnan, Georgia 30263 Phone: (404) 254-0089
Days Inn, 1344 Hwy, 29 S, Newnan, Georgia 30263 Phone: (770) 253-8550, Fax: (770) 251-5898
Jameson Inn - Newnan, 40 Lakeside Way, Newnan, Georgia 30265 Phone: (770) 252-1236, Fax: (770) 502-8720
Howard Johnson, 1310 Hwy 29 S, Newnan, Georgia 30263 Phone: (770) 683-1499, Fax: (770) 683-7931
La Quinta Inn - Newnan, 600 Bullsboro Dr, Newnan, Georgia 30265 Phone: (770) 502-8430, Fax: (770) 502-8448
Country Inn & Suites, 1125 Newnan Xing Blvd E, Newnan, Georgia 30265 Phone: (770) 304-8500
Home2 Suites by Hilton, 4051 McIntosh Pkwy, Newnan, Georgia 30263 Phone: (770) 400-8830, Fax: (770) 400-8831
4 other hotels and motels
All 12 fire-safe hotels and motels in Newnan, Georgia
Most common first names in Newnan, GA among deceased individuals Name Count Lived (average)
Mary 314 77.1 years James 304 70.5 years John 263 74.2 years William 244 72.0 years Willie 223 71.0 years Robert 176 73.3 years Annie 132 80.0 years George 132 72.9 years Thomas 119 72.2 years Charles 101 70.6 years
Most common last names in Newnan, GA among deceased individuals Last name Count Lived (average)
Smith 252 74.0 years Brown 112 73.2 years Williams 100 74.5 years Jones 98 73.2 years Johnson 96 75.2 years Jackson 88 75.3 years Davis 70 76.0 years White 65 73.4 years Hill 62 71.6 years Phillips 59 76.6 years
Newnan compared to Georgia state average:
Unemployed percentage below state average. Black race population percentage above state average. Hispanic race population percentage above state average. Median age below state average. Foreign-born population percentage significantly above state average. Length of stay since moving in below state average. Percentage of population with a bachelor's degree or higher above state average.
#50 on the list of "Top 101 cities with largest percentage of males in industries: transportation and warehousing (population 5,000+)"
#80 on the list of "Top 101 cities with the largest percentage population increase from 2000 (population 5,000+)"
#82 on the list of "Top 101 counties with highest percentage of residents voting for Romney (Republican) in the 2012 Presidential Election (pop. 50,000+)"
#84 on the list of "Top 101 counties with the lowest Ozone (1-hour) air pollution readings in 2012 (ppm)"
Top Patent Applicants
Troy C. Meuninck (37)
Robert J. Henshaw (16)
Lisa Gibson (16)
Brett A. Mitchell (14)
John R. Carlson (11)
Troy Meuninck (10)
Mark Roden (9)
Jerold Alan Tickner (9)
Wilber F. Powers (9)
Thomas A. Gordy (9)
Total of 429 patent applications in 2008-2024.

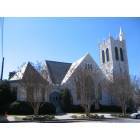
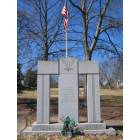

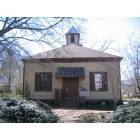
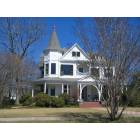

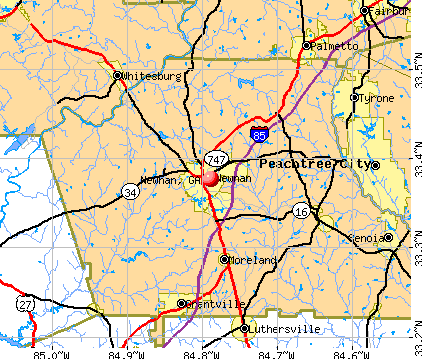


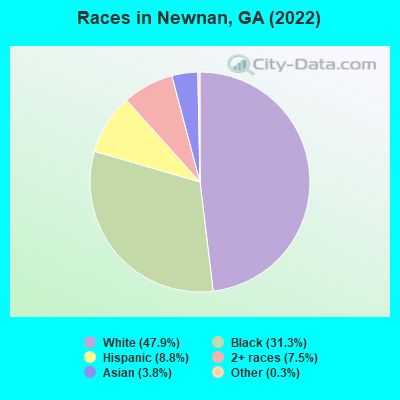
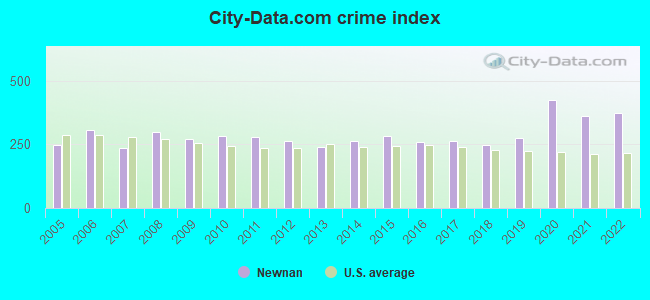
 Recent articles from our blog. Our writers, many of them Ph.D. graduates or candidates, create easy-to-read articles on a wide variety of topics.

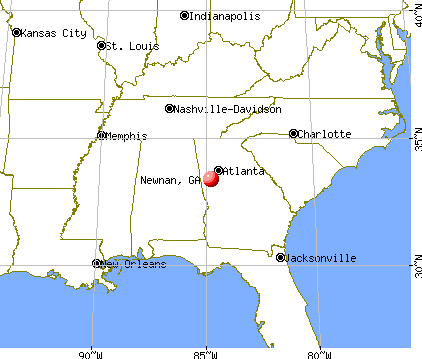
 (34.6 miles
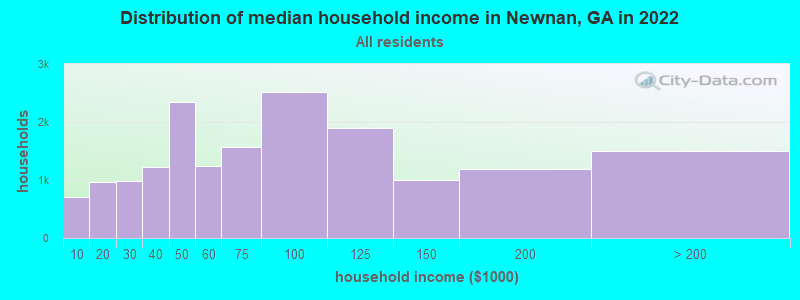
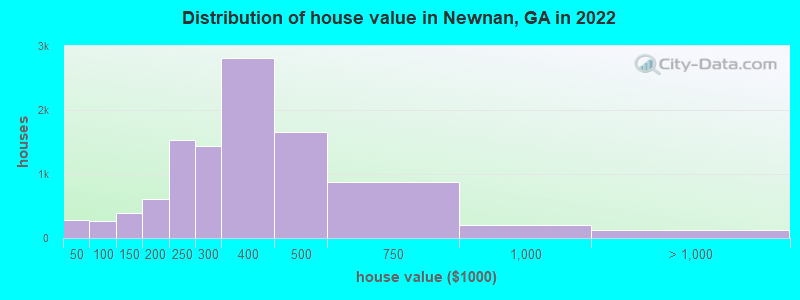
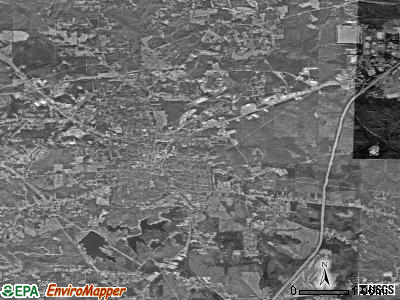
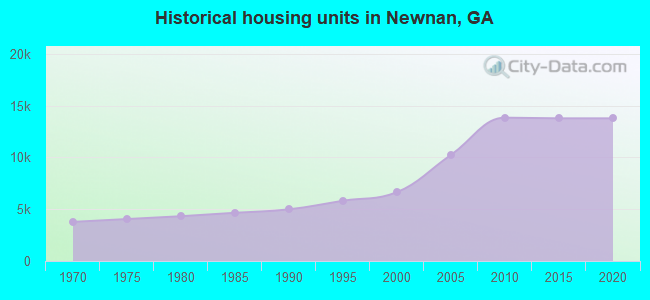
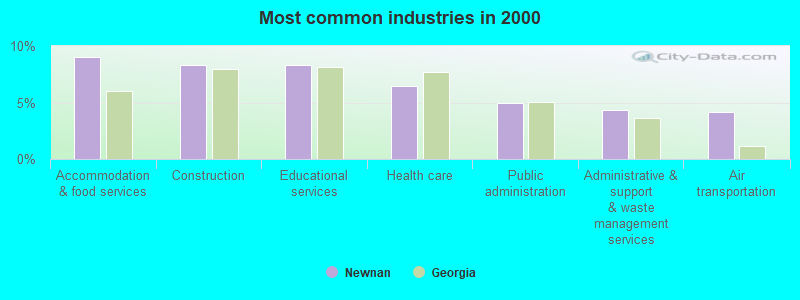
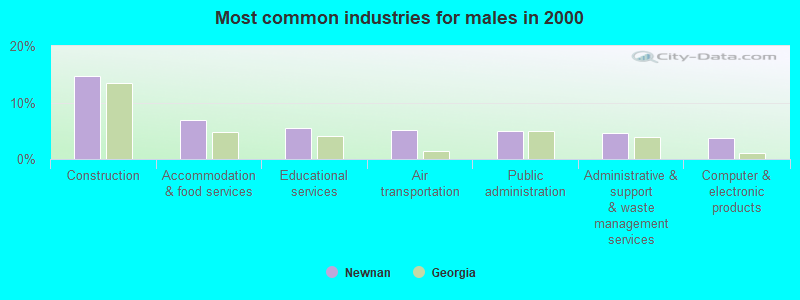
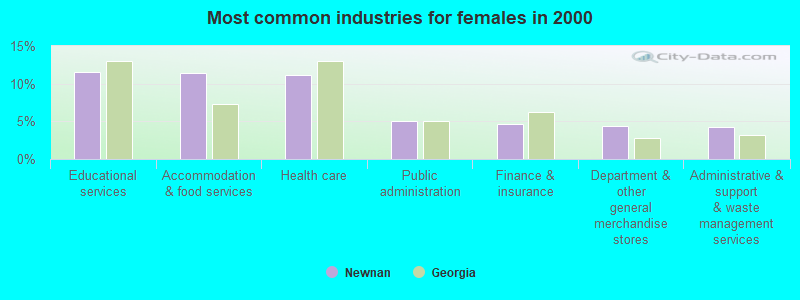
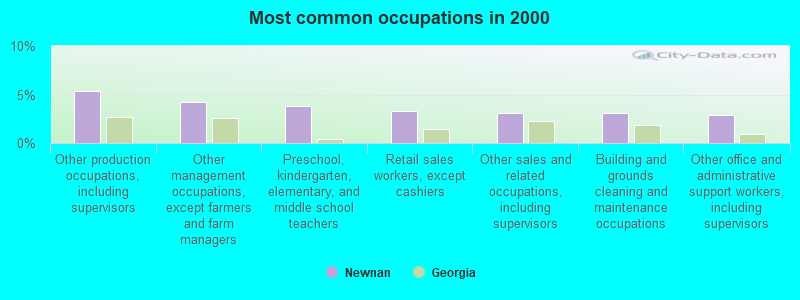
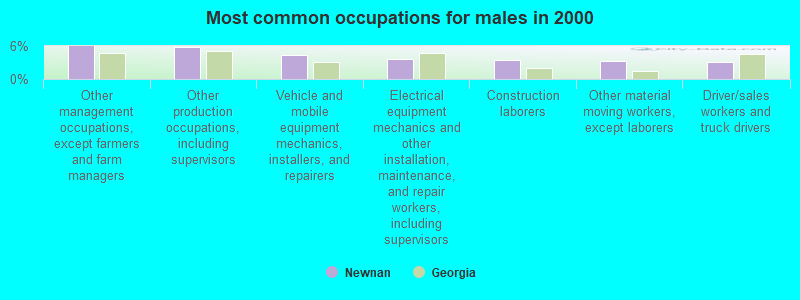
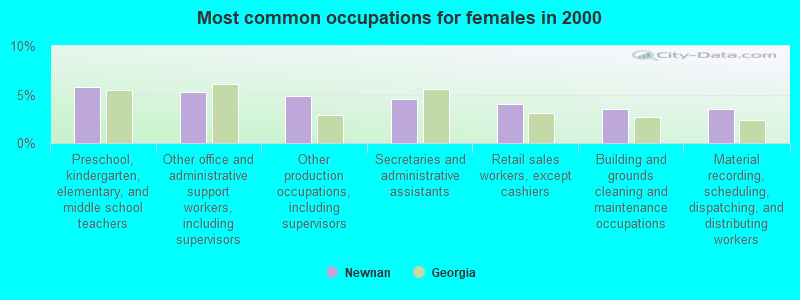
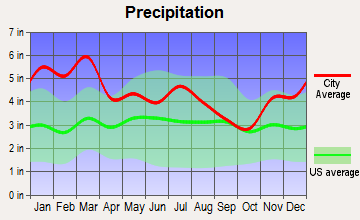
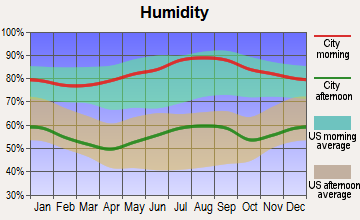
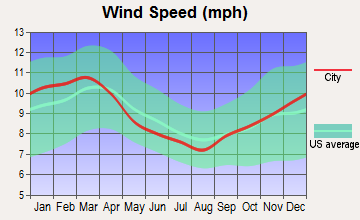
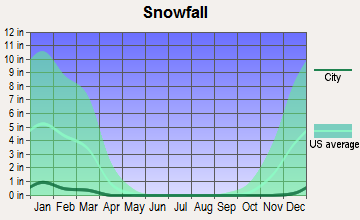
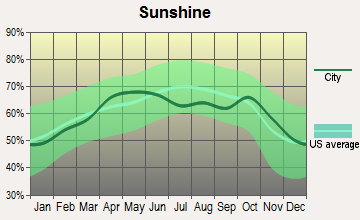
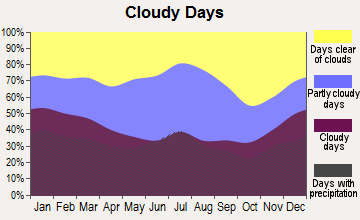
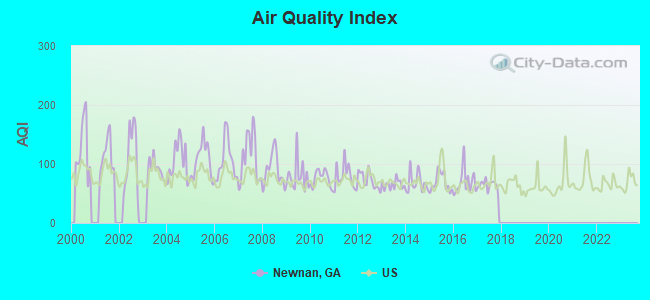
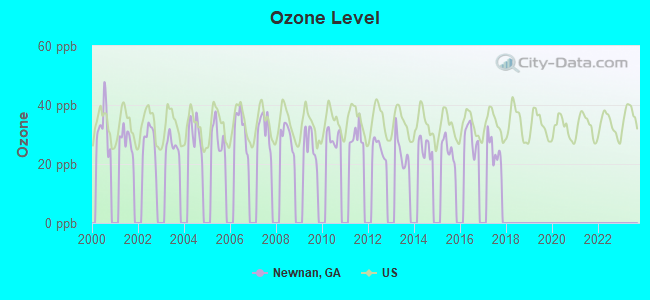
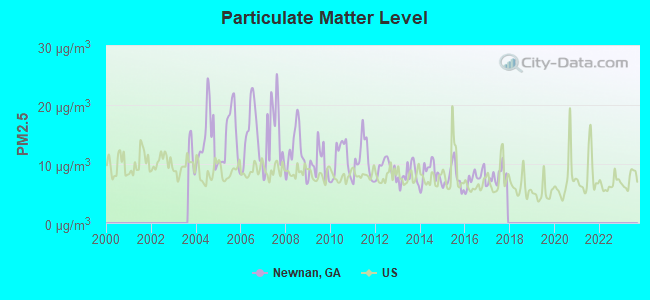
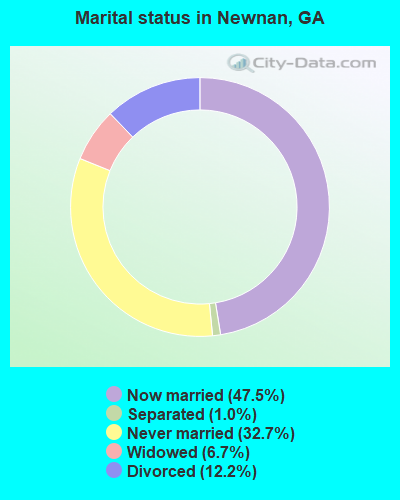
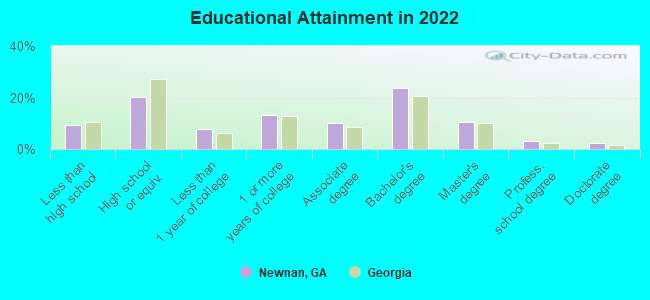
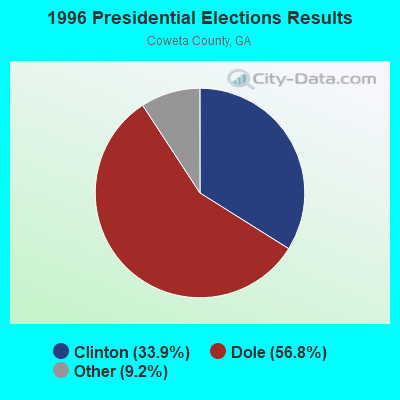

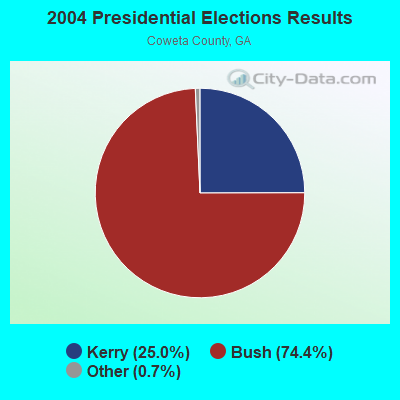

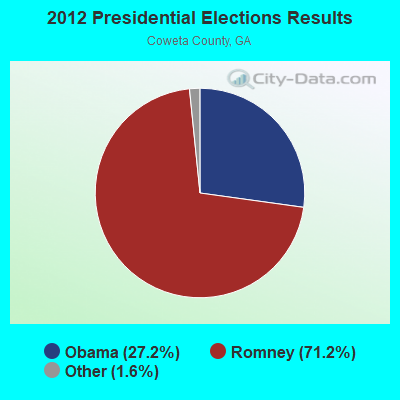
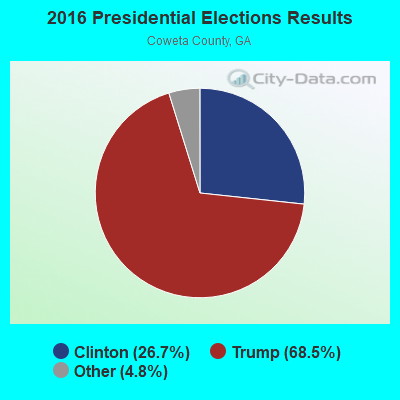
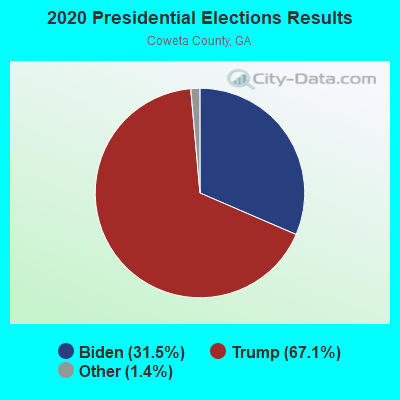
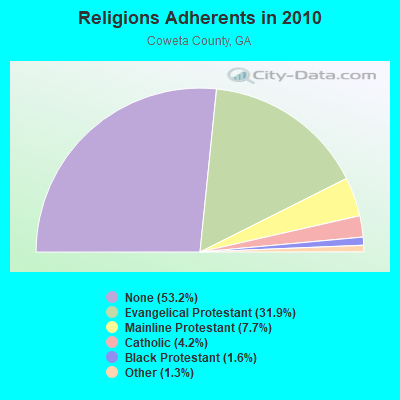
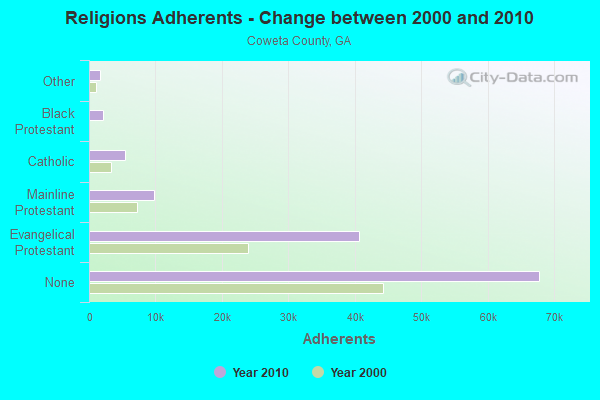
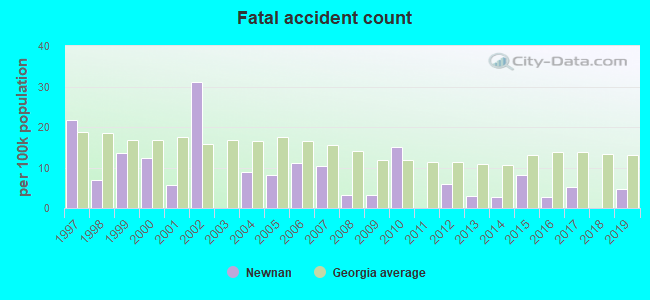
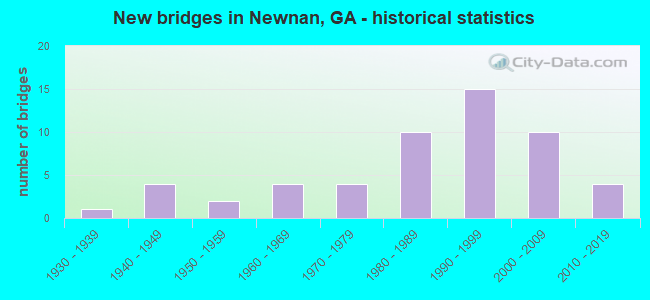
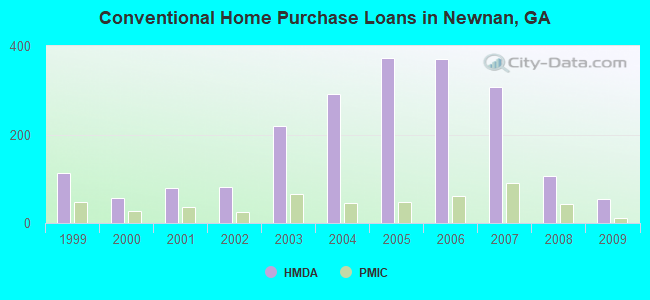
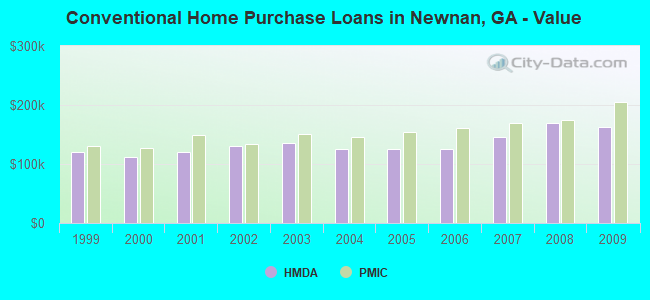
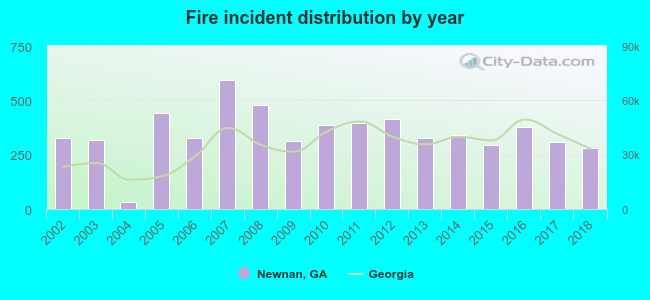 According to the data from the years 2002 - 2018 the average number of fires per year is 350. The highest number of reported fire incidents - 595 took place in 2007, and the least - 33 in 2004. The data has a decreasing trend.
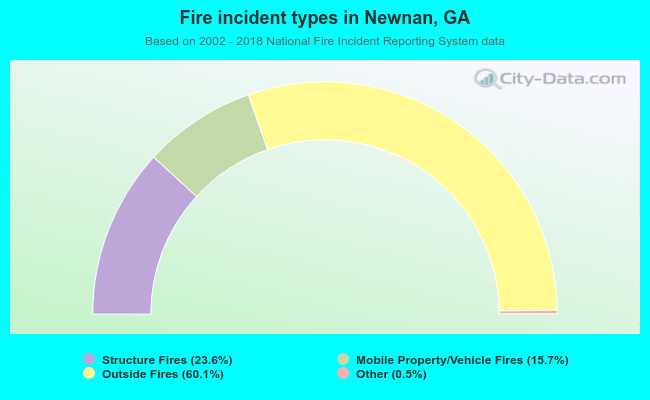 When looking into fire subcategories, the most incidents belonged to: Outside Fires (60.1%), and Structure Fires (23.6%).