Palos Verdes Estates, California
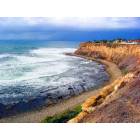
Palos Verdes Estates: Lunada Bay, Palos Verdes Estates
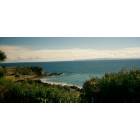
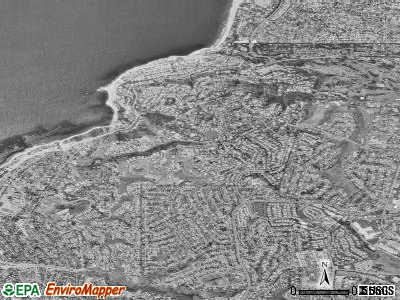
Palos Verdes Estates: from a hill in PV-faces ocean
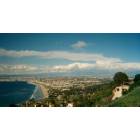
Palos Verdes Estates: view from a hill in PVE
- add
your
Submit your own pictures of this city and show them to the world
- OSM Map
- General Map
- Google Map
- MSN Map
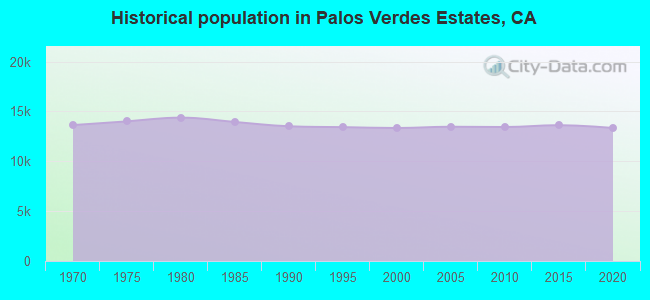
Population change since 2000: -4.1%
 |
| Males: 6,394 | |
| Females: 6,398 |
| Median resident age: | 54.4 years |
| California median age: | 37.9 years |
Zip codes: 90274.
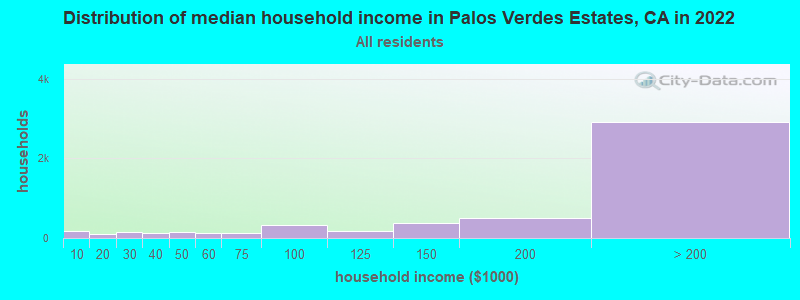
| Palos Verdes Estates: | over $200,000 |
| CA: | $91,551 |
Estimated per capita income in 2022: $137,212 (it was $69,040 in 2000)
Palos Verdes Estates city income, earnings, and wages data
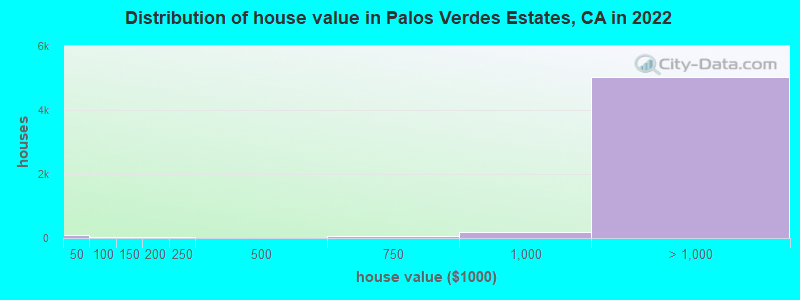
Estimated median house or condo value in 2022: over $1,000,000 (it was $789,400 in 2000)
| Palos Verdes Estates: | over $1,000,000 |
| CA: | $715,900 |
Mean prices in 2022: all housing units: over $1,000,000; detached houses: over $1,000,000; townhouses or other attached units: over $1,000,000; in 5-or-more-unit structures: $883,909
Median gross rent in 2022: $3,056.
Palos Verdes Estates, CA residents, houses, and apartments details
(3.8% for White Non-Hispanic residents, 100.0% for American Indian residents, 1.3% for two or more races residents)
Detailed information about poverty and poor residents in Palos Verdes Estates, CA

Compare current foreclosures near Palos Verdes Estates, CA:
| Photo | Address | Area | Beds / Baths | Price | Details |
|---|---|---|---|---|---|

|
#1
Marina City Dr Unit 116
Marina Del Rey, CA 90292
|
1,722 sq. feet
|
2 baths 3 beds |
show details | |

|
#2
Elburg St Unit A
Paramount, CA 90723
|
1,131 sq. feet
|
2 baths 3 beds |
show details | |

|
#3
E 60th St
Los Angeles, CA 90001
|
1,883 sq. feet
|
3 baths 5 beds |
show details | |

|
#4
W Arbor St # 57
Long Beach, CA 90805
|
1,585 sq. feet
|
2 baths 3 beds |
show details | |

|
#5
Mira Mar Ave
Long Beach, CA 90814
|
1,902 sq. feet
|
2 baths 4 beds |
show details | |

|
#6
W 110th St
Inglewood, CA 90303
|
3,481 sq. feet
|
4 baths 6 beds |
show details | |

|
#7
6th Ave
Venice, CA 90291
|
3,192 sq. feet
|
3 baths 6 beds |
show details | |

|
#8
Redondo Avenue, Units 5-8
Long Beach, CA 90804
|
3,360 sq. feet
|
4 baths 8 beds |
show details | |

|
#9
Acacia St
Los Angeles, CA 90056
|
2,186 sq. feet
|
2 baths 3 beds |
show details | |

|
#10
Cedar Ave
Lynwood, CA 90262
|
1,092 sq. feet
|
2 baths 3 beds |
show details |
| Photo | Address | Area | Beds / Baths | Price | Details |
|---|---|---|---|---|---|

|
#11
Olmsted Ave
Los Angeles, CA 90008
|
1,550 sq. feet
|
2 baths 3 beds |
show details | |

|
#12
S Cabrillo Ave
San Pedro, CA 90731
|
1,682 sq. feet
|
2 baths 4 beds |
show details | |

|
#13
Elderhall Ave
Lakewood, CA 90712
|
1,638 sq. feet
|
2 baths 3 beds |
show details | |

|
#14
E Stockwell St
Compton, CA 90222
|
848 sq. feet
|
2 baths 4 beds |
show details | |

|
#15
S Gramercy Pl
Los Angeles, CA 90047
|
1,800 sq. feet
|
2 baths 3 beds |
show details | |

|
#16
N Adelon Ln
Compton, CA 90221
|
1,900 sq. feet
|
3 baths 3 beds |
show details | |

|
#17
Missouri Ave
South Gate, CA 90280
|
1,441 sq. feet
|
2 baths 3 beds |
show details | |

|
#18
Dunrobin Ave
Lakewood, CA 90713
|
1,032 sq. feet
|
1 baths 2 beds |
show details | |

|
#19
Veragua Dr
Playa Del Rey, CA 90293
|
6,881 sq. feet
|
5 baths 5 beds |
show details | |

|
#20
Palm Ave
Lynwood, CA 90262
|
1,454 sq. feet
|
2 baths 2 beds |
show details |
| Photo | Address | Area | Beds / Baths | Price | Details |
|---|---|---|---|---|---|

|
#21
E Turmont St
Carson, CA 90746
|
1,532 sq. feet
|
2 baths 4 beds |
show details | |

|
#22
Regway Ave
Long Beach, CA 90810
|
924 sq. feet
|
1 baths 2 beds |
show details | |

|
#23
Village Way
Signal Hill, CA 90755
|
1,524 sq. feet
|
3 baths 3 beds |
show details | |

|
#24
W 105th St
Los Angeles, CA 90044
|
792 sq. feet
|
1 baths 2 beds |
show details | |

|
#25
Bonnie Brae St
Hermosa Beach, CA 90254
|
2,471 sq. feet
|
3 baths 3 beds |
show details | |

|
#26
S 5th Ave
Inglewood, CA 90305
|
1,574 sq. feet
|
2 baths 4 beds |
show details | |

|
#27
256th St
Harbor City, CA 90710
|
2,475 sq. feet
|
4 baths 5 beds |
show details | |

|
#28
-1639 W 256th St
Harbor City, CA 90710
|
2,475 sq. feet
|
4 baths 5 beds |
show details | |

|
#29
W 107th St
Inglewood, CA 90304
|
873 sq. feet
|
1 baths 2 beds |
show details | |

|
#30
4th Ave
Los Angeles, CA 90008
|
1,392 sq. feet
|
2 baths 2 beds |
show details |
| Photo | Address | Area | Beds / Baths | Price | Details |
|---|---|---|---|---|---|

|
#31
Noble View Dr
Rancho Palos Verdes, CA 90275
|
1,944 sq. feet
|
3 baths 4 beds |
show details | |

|
#32
Josephine St
Lynwood, CA 90262
|
1,414 sq. feet
|
1 baths 3 beds |
show details | |

|
#33
Alviso Ave
Los Angeles, CA 90043
|
1,330 sq. feet
|
1 baths 3 beds |
show details | |

|
#34
Strongs Dr
Venice, CA 90291
|
1,723 sq. feet
|
2 baths 2 beds |
show details | |

|
#35
W 60th St
Los Angeles, CA 90043
|
1,638 sq. feet
|
2 baths 4 beds |
show details | |

|
#36
W Santa Cruz St
San Pedro, CA 90732
|
1,748 sq. feet
|
2 baths 3 beds |
show details | |

|
#37
Frampton Ave Apt A
Harbor City, CA 90710
|
1,161 sq. feet
|
3 baths 3 beds |
show details | |

|
#38
S Budlong Ave
Los Angeles, CA 90044
|
1,201 sq. feet
|
2 baths 4 beds |
show details | |

|
#39
W 58th Pl
Los Angeles, CA 90043
|
2,417 sq. feet
|
3 baths 4 beds |
show details | |

|
#40
E Palmerstone St
Compton, CA 90221
|
1,410 sq. feet
|
2 baths 3 beds |
show details |
| Photo | Address | Area | Beds / Baths | Price | Details |
|---|---|---|---|---|---|

|
#41
W Home St
Long Beach, CA 90805
|
1,628 sq. feet
|
2 baths 3 beds |
show details | |

|
#42
E Hatchway St
Compton, CA 90222
|
634 sq. feet
|
1 baths 2 beds |
show details | |

|
#43
Eastwood Ave
Torrance, CA 90504
|
1,217 sq. feet
|
2 baths 2 beds |
show details | |

|
#44
E 113th St
Los Angeles, CA 90059
|
1,085 sq. feet
|
1 baths 3 beds |
show details | |

|
#45
Ibbetson Ave
Lakewood, CA 90713
|
1,044 sq. feet
|
1 baths 3 beds |
show details | |

|
#46
W 82nd St
Los Angeles, CA 90047
|
1,384 sq. feet
|
2 baths 3 beds |
show details | |

|
#47
Denker Ave
Los Angeles, CA 90062
|
1,196 sq. feet
|
1 baths 2 beds |
show details | |

|
#48
Wilmington Ave
Los Angeles, CA 90059
|
850 sq. feet
|
1 baths 2 beds |
show details | |

|
#49
Cortland Ave
Paramount, CA 90723
|
2,354 sq. feet
|
3 baths 4 beds |
show details | |

|
Check over 1 million property listings on Foreclosure.com!
|
browse all offers | |||


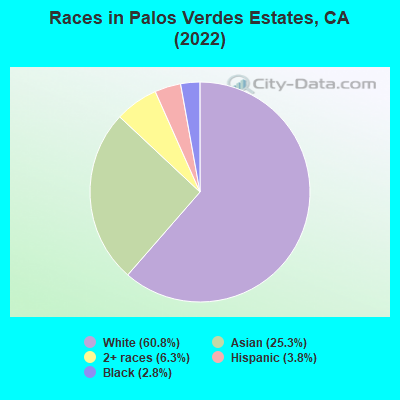
- 7,86560.8%White alone
- 3,26925.3%Asian alone
- 8166.3%Two or more races
- 4863.8%Hispanic
- 3612.8%Black alone
- 30.02%American Indian alone
According to our research of California and other state lists, there were 2 registered sex offenders living in Palos Verdes Estates, California as of April 26, 2024.
The ratio of all residents to sex offenders in Palos Verdes Estates is 6,846 to 1.
The ratio of registered sex offenders to all residents in this city is much lower than the state average.
Type |
2009 |
2010 |
2011 |
2012 |
2013 |
2014 |
2015 |
2016 |
2017 |
2018 |
2019 |
2020 |
2021 |
2022 |
|---|---|---|---|---|---|---|---|---|---|---|---|---|---|---|
| Murders (per 100,000) | 0 (0.0) | 0 (0.0) | 0 (0.0) | 0 (0.0) | 0 (0.0) | 0 (0.0) | 0 (0.0) | 0 (0.0) | 0 (0.0) | 0 (0.0) | 0 (0.0) | 0 (0.0) | 0 (0.0) | 0 (0.0) |
| Rapes (per 100,000) | 0 (0.0) | 0 (0.0) | 1 (7.4) | 1 (7.3) | 1 (7.3) | 0 (0.0) | 1 (7.3) | 0 (0.0) | 1 (7.3) | 1 (7.4) | 0 (0.0) | 0 (0.0) | 3 (23.0) | 0 (0.0) |
| Robberies (per 100,000) | 2 (14.7) | 1 (7.4) | 1 (7.4) | 0 (0.0) | 0 (0.0) | 0 (0.0) | 4 (29.1) | 1 (7.3) | 2 (14.7) | 4 (29.5) | 1 (7.5) | 1 (7.5) | 1 (7.7) | 1 (7.8) |
| Assaults (per 100,000) | 5 (36.7) | 4 (29.8) | 3 (22.1) | 5 (36.6) | 5 (36.6) | 5 (36.6) | 2 (14.6) | 3 (21.8) | 0 (0.0) | 1 (7.4) | 3 (22.4) | 3 (22.6) | 1 (7.7) | 3 (23.5) |
| Burglaries (per 100,000) | 43 (315.9) | 44 (327.4) | 40 (294.2) | 48 (351.4) | 54 (395.4) | 52 (380.5) | 82 (596.8) | 28 (203.9) | 43 (315.9) | 33 (243.4) | 36 (268.7) | 22 (166.0) | 48 (368.0) | 48 (376.0) |
| Thefts (per 100,000) | 49 (360.0) | 69 (513.5) | 71 (522.2) | 80 (585.6) | 89 (651.6) | 64 (468.2) | 78 (567.7) | 76 (553.5) | 77 (565.7) | 69 (508.9) | 49 (365.7) | 58 (437.6) | 71 (544.3) | 79 (618.8) |
| Auto thefts (per 100,000) | 4 (29.4) | 3 (22.3) | 7 (51.5) | 8 (58.6) | 4 (29.3) | 5 (36.6) | 9 (65.5) | 7 (51.0) | 5 (36.7) | 2 (14.8) | 3 (22.4) | 6 (45.3) | 19 (145.7) | 11 (86.2) |
| Arson (per 100,000) | 0 (0.0) | 2 (14.9) | 0 (0.0) | 1 (7.3) | 2 (14.6) | 1 (7.3) | 2 (14.6) | 1 (7.3) | 0 (0.0) | 0 (0.0) | 0 (0.0) | 0 (0.0) | 2 (15.3) | 0 (0.0) |
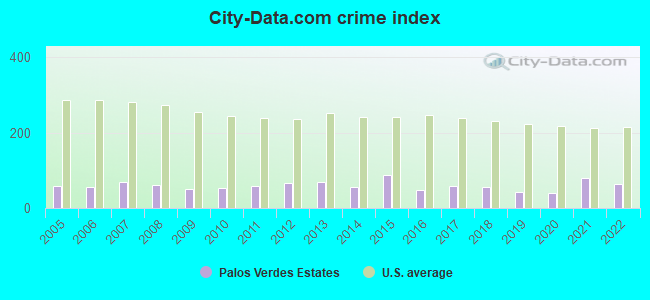
| City-Data.com crime index | 50.6 | 53.4 | 58.1 | 65.9 | 69.3 | 55.6 | 87.2 | 47.1 | 58.0 | 54.8 | 41.9 | 39.5 | 81.4 | 65.0 |
The City-Data.com crime index weighs serious crimes and violent crimes more heavily. Higher means more crime, U.S. average is 246.1. It adjusts for the number of visitors and daily workers commuting into cities.
Crime rate in Palos Verdes Estates detailed stats: murders, rapes, robberies, assaults, burglaries, thefts, arson
Full-time law enforcement employees in 2021, including police officers: 26 (16 officers - 16 male; 0 female).
| Officers per 1,000 residents here: | 1.23 |
| California average: | 2.30 |
 Recent articles from our blog. Our writers, many of them Ph.D. graduates or candidates, create easy-to-read articles on a wide variety of topics.


Latest news from Palos Verdes Estates, CA collected exclusively by city-data.com from local newspapers, TV, and radio stations
Ancestries: Irish (6.7%), English (5.2%), American (4.7%), European (4.1%), Italian (3.7%), German (2.6%).
Current Local Time: PST time zone
Elevation: 217 feet
Land area: 4.79 square miles.
Population density: 2,671 people per square mile (average).
2,837 residents are foreign born (17.1% Asia, 2.7% Europe).
| This city: | 21.9% |
| California: | 26.5% |
Median real estate property taxes paid for housing units with mortgages in 2022: $10,281 (0.5%)
Median real estate property taxes paid for housing units with no mortgage in 2022: $10,472 (0.5%)
Nearest city with pop. 50,000+: Torrance, CA  (4.6 miles , pop. 137,946).
Nearest city with pop. 200,000+: Long Beach, CA (13.8 miles , pop. 461,522).
Nearest city with pop. 1,000,000+: Los Angeles, CA (20.7 miles , pop. 3,694,820).
Nearest cities:
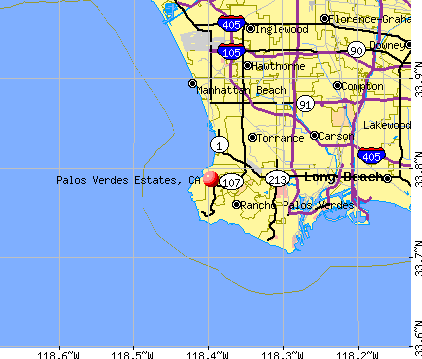
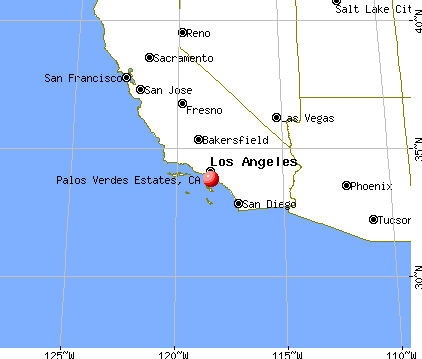
Latitude: 33.79 N, Longitude: 118.40 W
Daytime population change due to commuting: -1,843 (-14.3%)
Workers who live and work in this city: 1,612 (31.3%)
Area code commonly used in this area: 310
Property values in Palos Verdes Estates, CA
Palos Verdes Estates tourist attractions:
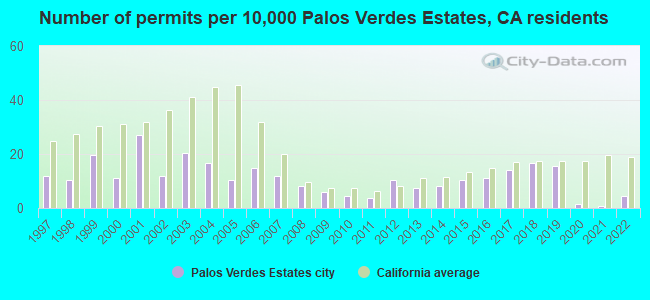
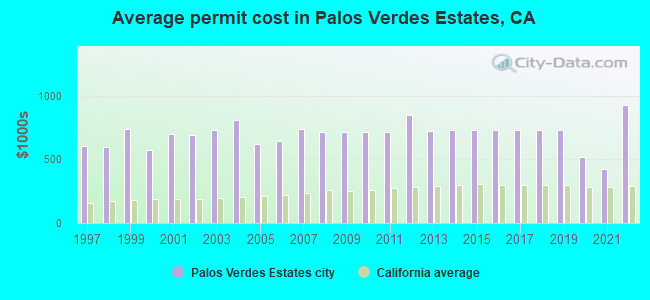
Single-family new house construction building permits:
- 2022: 6 buildings, average cost: $929,200
- 2021: 1 building, cost: $427,600
- 2020: 2 buildings, average cost: $522,000
- 2019: 21 buildings, average cost: $730,500
- 2018: 22 buildings, average cost: $730,500
- 2017: 19 buildings, average cost: $730,500
- 2016: 15 buildings, average cost: $730,600
- 2015: 14 buildings, average cost: $730,100
- 2014: 11 buildings, average cost: $732,400
- 2013: 10 buildings, average cost: $721,600
- 2012: 14 buildings, average cost: $850,100
- 2011: 5 buildings, average cost: $715,100
- 2010: 6 buildings, average cost: $715,100
- 2009: 8 buildings, average cost: $715,100
- 2008: 11 buildings, average cost: $715,100
- 2007: 16 buildings, average cost: $742,400
- 2006: 20 buildings, average cost: $642,300
- 2005: 14 buildings, average cost: $623,900
- 2004: 22 buildings, average cost: $812,900
- 2003: 27 buildings, average cost: $735,700
- 2002: 16 buildings, average cost: $693,000
- 2001: 36 buildings, average cost: $699,900
- 2000: 15 buildings, average cost: $577,000
- 1999: 26 buildings, average cost: $741,200
- 1998: 14 buildings, average cost: $599,100
- 1997: 16 buildings, average cost: $608,300
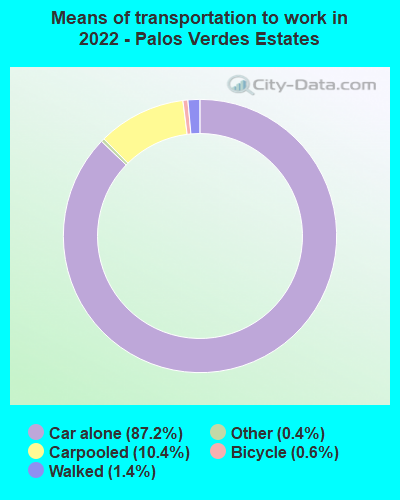
| Here: | 5.0% |
| California: | 5.1% |
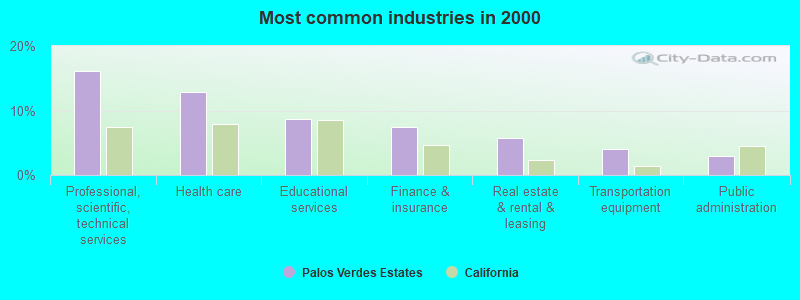
- Professional, scientific, technical services (16.1%)
- Health care (12.9%)
- Educational services (8.6%)
- Finance & insurance (7.4%)
- Real estate & rental & leasing (5.7%)
- Transportation equipment (4.0%)
- Public administration (2.9%)
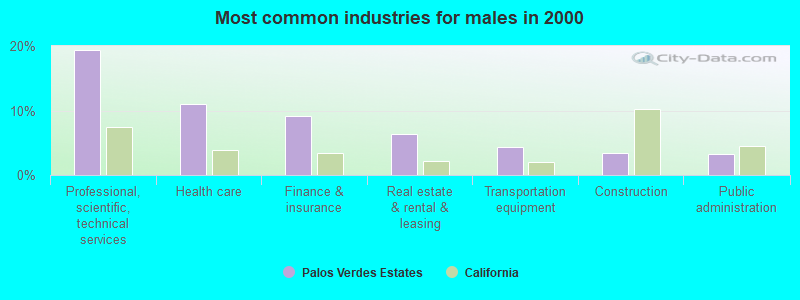
- Professional, scientific, technical services (19.4%)
- Health care (11.0%)
- Finance & insurance (9.2%)
- Real estate & rental & leasing (6.3%)
- Transportation equipment (4.4%)
- Construction (3.4%)
- Public administration (3.2%)
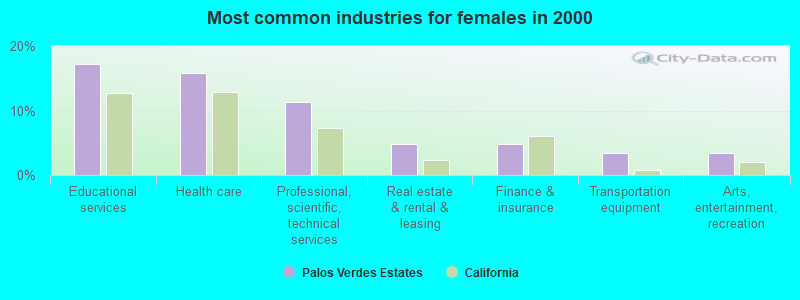
- Educational services (17.3%)
- Health care (15.8%)
- Professional, scientific, technical services (11.3%)
- Real estate & rental & leasing (4.8%)
- Finance & insurance (4.8%)
- Transportation equipment (3.5%)
- Arts, entertainment, recreation (3.4%)
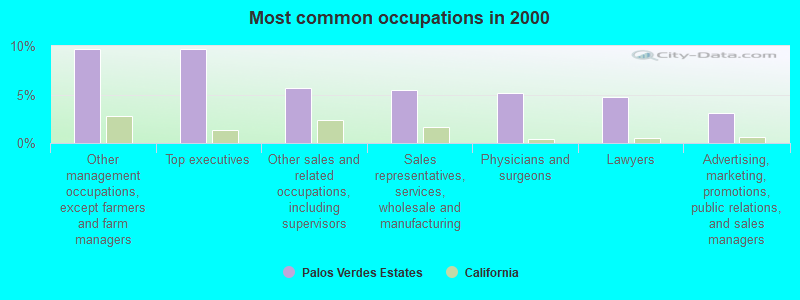
- Other management occupations, except farmers and farm managers (9.7%)
- Top executives (9.7%)
- Other sales and related occupations, including supervisors (5.7%)
- Sales representatives, services, wholesale and manufacturing (5.5%)
- Physicians and surgeons (5.2%)
- Lawyers (4.7%)
- Advertising, marketing, promotions, public relations, and sales managers (3.1%)
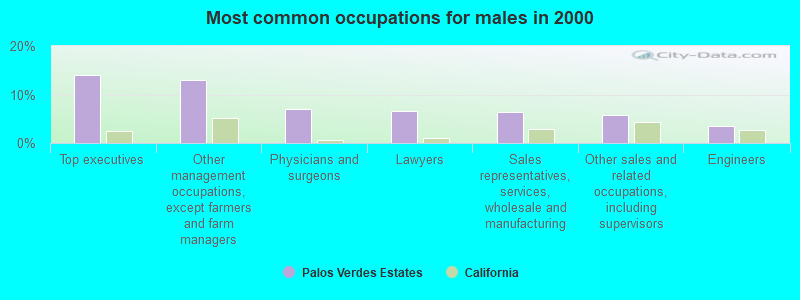
- Top executives (13.9%)
- Other management occupations, except farmers and farm managers (13.0%)
- Physicians and surgeons (7.0%)
- Lawyers (6.6%)
- Sales representatives, services, wholesale and manufacturing (6.5%)
- Other sales and related occupations, including supervisors (5.7%)
- Engineers (3.5%)
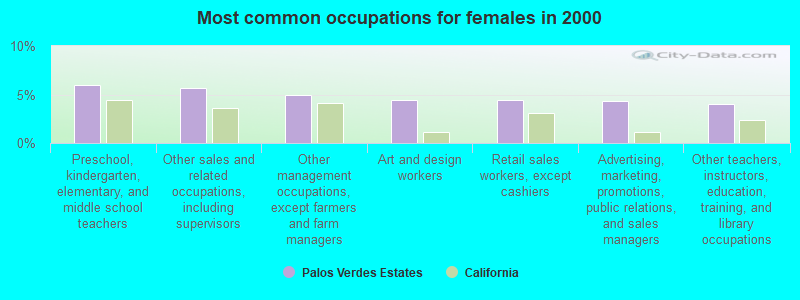
- Preschool, kindergarten, elementary, and middle school teachers (6.0%)
- Other sales and related occupations, including supervisors (5.7%)
- Other management occupations, except farmers and farm managers (4.9%)
- Art and design workers (4.5%)
- Retail sales workers, except cashiers (4.4%)
- Advertising, marketing, promotions, public relations, and sales managers (4.3%)
- Other teachers, instructors, education, training, and library occupations (4.0%)
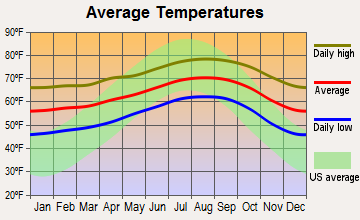
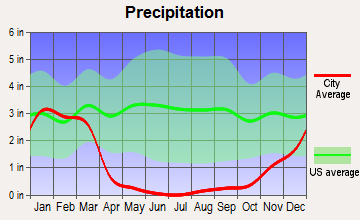
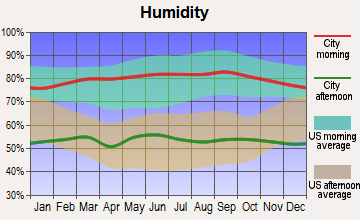
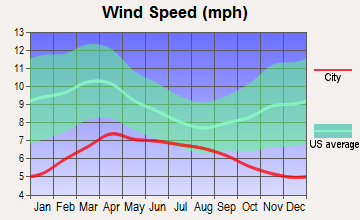
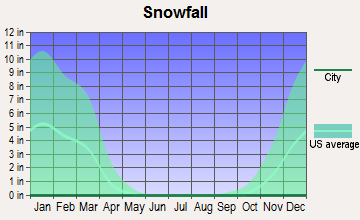
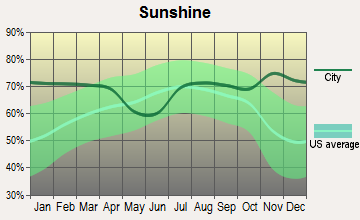
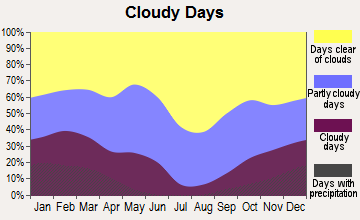
Average climate in Palos Verdes Estates, California
Based on data reported by over 4,000 weather stations
|
|


(lower is better)
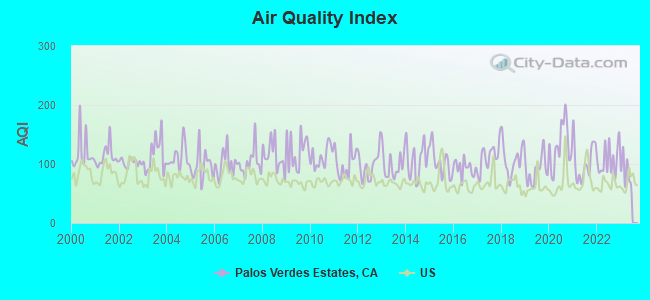
Air Quality Index (AQI) level in 2022 was 107. This is significantly worse than average.
| City: | 107 |
| U.S.: | 73 |
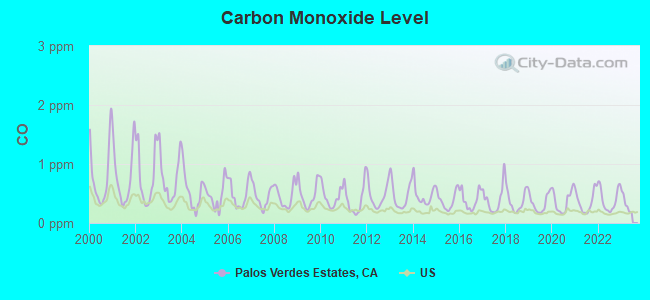
Carbon Monoxide (CO) [ppm] level in 2022 was 0.398. This is significantly worse than average. Closest monitor was 8.6 miles away from the city center.
| City: | 0.398 |
| U.S.: | 0.251 |
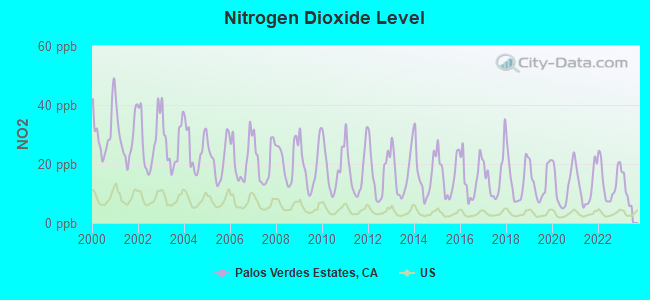
Nitrogen Dioxide (NO2) [ppb] level in 2022 was 14.1. This is significantly worse than average. Closest monitor was 5.1 miles away from the city center.
| City: | 14.1 |
| U.S.: | 5.1 |
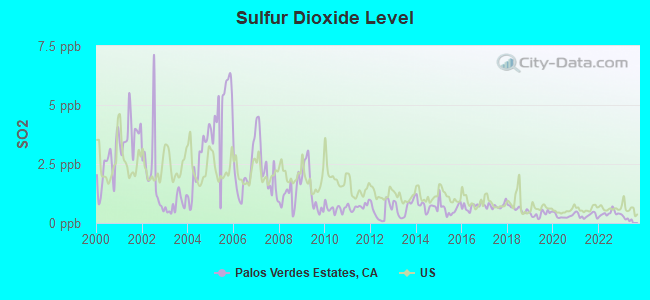
Sulfur Dioxide (SO2) [ppb] level in 2022 was 0.412. This is significantly better than average. Closest monitor was 4.8 miles away from the city center.
| City: | 0.412 |
| U.S.: | 1.515 |
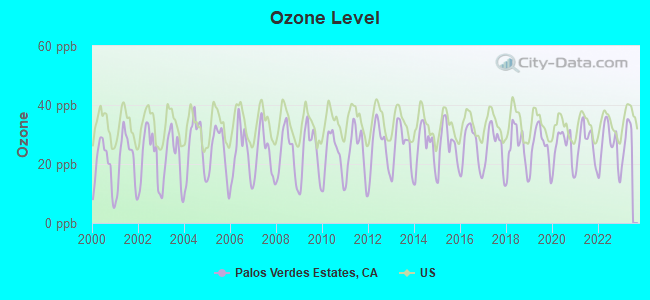
Ozone [ppb] level in 2022 was 26.1. This is better than average. Closest monitor was 8.6 miles away from the city center.
| City: | 26.1 |
| U.S.: | 33.3 |
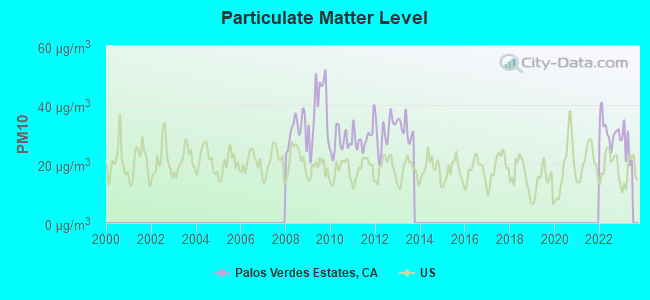
Particulate Matter (PM10) [µg/m3] level in 2022 was 31.2. This is significantly worse than average. Closest monitor was 9.5 miles away from the city center.
| City: | 31.2 |
| U.S.: | 19.2 |
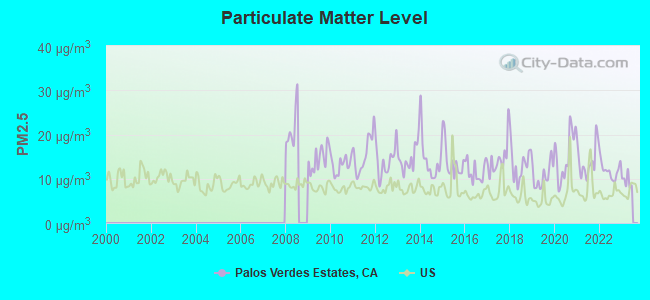
Particulate Matter (PM2.5) [µg/m3] level in 2022 was 11.9. This is significantly worse than average. Closest monitor was 12.2 miles away from the city center.
| City: | 11.9 |
| U.S.: | 8.1 |
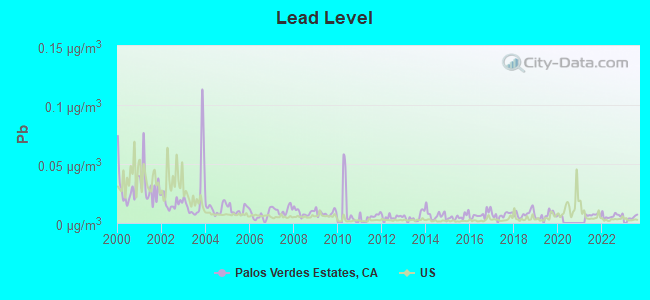
Lead (Pb) [µg/m3] level in 2022 was 0.00604. This is significantly better than average. Closest monitor was 5.1 miles away from the city center.
| City: | 0.00604 |
| U.S.: | 0.00931 |
Earthquake activity:
Palos Verdes Estates-area historical earthquake activity is significantly above California state average. It is 6628% greater than the overall U.S. average.On 7/21/1952 at 11:52:14, a magnitude 7.7 (7.7 UK, Class: Major, Intensity: VIII - XII) earthquake occurred 90.7 miles away from the city center, causing $50,000,000 total damage
On 6/28/1992 at 11:57:34, a magnitude 7.6 (6.2 MB, 7.6 MS, 7.3 MW, Depth: 0.7 mi) earthquake occurred 110.4 miles away from the city center, causing 3 deaths (1 shaking deaths, 2 other deaths) and 400 injuries, causing $100,000,000 total damage and $40,000,000 insured losses
On 10/16/1999 at 09:46:44, a magnitude 7.4 (6.3 MB, 7.4 MS, 7.2 MW, 7.3 ML) earthquake occurred 123.1 miles away from the city center
On 11/4/1927 at 13:51:53, a magnitude 7.5 (7.5 UK) earthquake occurred 169.5 miles away from the city center
On 1/17/1994 at 12:30:55, a magnitude 6.8 (6.4 MB, 6.8 MS, 6.7 MW, Depth: 11.4 mi, Class: Strong, Intensity: VII - IX) earthquake occurred 27.5 miles away from the city center, causing 60 deaths (60 shaking deaths) and 7000 injuries
On 4/21/1918 at 22:32:30, a magnitude 6.8 (6.8 UK) earthquake occurred 55.0 miles away from Palos Verdes Estates center
Magnitude types: body-wave magnitude (MB), local magnitude (ML), surface-wave magnitude (MS), moment magnitude (MW)
Natural disasters:
The number of natural disasters in Los Angeles County (57) is a lot greater than the US average (15).Major Disasters (Presidential) Declared: 27
Emergencies Declared: 3
Causes of natural disasters: Fires: 37, Floods: 16, Storms: 9, Winter Storms: 6, Landslides: 5, Mudslides: 5, Earthquakes: 3, Freeze: 1, Heavy Rain: 1, Hurricane: 1, Snow: 1, Tornado: 1, Wind: 1, Other: 1 (Note: some incidents may be assigned to more than one category).
Hospitals and medical centers near Palos Verdes Estates:
- CANTERBURY,THE (Nursing Home, about 2 miles away; RANCHO PALOS VERDES, CA)
- SKYPARK DIALYSIS (Dialysis Facility, about 4 miles away; TORRANCE, CA)
- LITTLE COMPANY OF MARY SUB-ACUTE CARE CENTER (Nursing Home, about 4 miles away; TORRANCE, CA)
- DEL AMO GARDENS CONVALESCENT (Nursing Home, about 4 miles away; TORRANCE, CA)
- SUNCREST HOSPITAL OF SOUTH BAY (Hospital, about 4 miles away; TORRANCE, CA)
- TORRANCE MEMORIAL HOME HEALTH (Home Health Center, about 4 miles away; TORRANCE, CA)
- TORRANCE MEMORIAL MEDICAL CENTER Acute Care Hospitals (about 4 miles away; TORRANCE, CA)
Amtrak stations near Palos Verdes Estates:
- 8 miles: SAN PEDRO (CATALINA TERMINAL, BERTH 95) - Bus Station . Services: partially wheelchair accessible, enclosed waiting area, public restrooms, public payphones, snack bar, paid short-term parking, paid long-term parking, call for taxi service.
- 12 miles: LONG BEACH (601 N. LONG BEACH BLVD.) - Bus Station . Services: fully wheelchair accessible, public restrooms, public payphones, full-service food facilities, paid short-term parking, paid long-term parking, call for taxi service, public transit connection.
Colleges/universities with over 2000 students nearest to Palos Verdes Estates:
- Los Angeles Harbor College (about 7 miles; Wilmington, CA; Full-time enrollment: 5,285)
- El Camino Community College District (about 8 miles; Torrance, CA; FT enrollment: 13,952)
- California State University-Dominguez Hills (about 10 miles; Carson, CA; FT enrollment: 9,862)
- Wyotech-Long Beach (about 11 miles; Long Beach, CA; FT enrollment: 2,453)
- Los Angeles Southwest College (about 12 miles; Los Angeles, CA; FT enrollment: 3,247)
- El Camino College-Compton Center (about 13 miles; Compton, CA; FT enrollment: 4,506)
- Loyola Marymount University (about 13 miles; Los Angeles, CA; FT enrollment: 7,720)
Public high schools in Palos Verdes Estates:
- PALOS VERDES HIGH (Students: 1,338, Location: 600 CLOYDEN RD., Grades: 9-12)
- MALAGA COVE SCHOOL - SUCCESS LEARNING CENTER (Location: 300 PASEO DEL MAR, Grades: KG-12)
Public elementary/middle schools in Palos Verdes Estates:
- PALOS VERDES INTERMEDIATE (Students: 944, Location: 2161 VIA OLIVERA, Grades: 6-8)
- MONTEMALAGA ELEMENTARY (Students: 324, Location: 1121 VIA NOGALES, Grades: KG-5)
- LUNADA BAY ELEMENTARY (Students: 298, Location: 520 PASEO LUNADO, Grades: KG-5)
User-submitted facts and corrections:
- pro tennis champ Pete Sampras and ice skating champ Michelle Kwan are from pv
Points of interest:
Notable locations in Palos Verdes Estates: Palos Verdes Country Club (A), Roessler Memorial Swimming Pool (B), Palos Verdes Public Library (C), Palos Verdes Estates City Hall (D), Los Angeles County Fire Department Station 2 (E). Display/hide their locations on the map
Shopping Center: Malaga Cove Plaza Shopping Center (1). Display/hide its location on the map
Church in Palos Verdes Estates: Neighborhood Church (A). Display/hide its location on the map
Parks in Palos Verdes Estates include: Coronel Plaza (1), Plaza Andres (2), Plaza Blanca (3). Display/hide their locations on the map
Beach: Rat Beach (A). Display/hide its location on the map
Birthplace of: Chris Smith (racing driver) - Racing driver, Kurt Graeber - College basketball player (Arizona State Sun Devils).
| This city: | 2.6 people |
| California: | 2.9 people |
| This city: | 80.6% |
| Whole state: | 68.7% |
| This city: | 2.3% |
| Whole state: | 7.2% |
Likely homosexual households (counted as self-reported same-sex unmarried-partner households)
- Lesbian couples: 0.3% of all households
- Gay men: 0.2% of all households
3 people in residential treatment centers for adults in 2010
5 people in nursing homes in 2000
Banks with branches in Palos Verdes Estates (2011 data):
- Bank of America, National Association: Palos Verdes Estates Branch at 22 Malaga Cove Plaza, branch established on 1957/05/17. Info updated 2009/11/18: Bank assets: $1,451,969.3 mil, Deposits: $1,077,176.8 mil, headquarters in Charlotte, NC, positive income, 5782 total offices, Holding Company: Bank Of America Corporation
For population 15 years and over in Palos Verdes Estates:
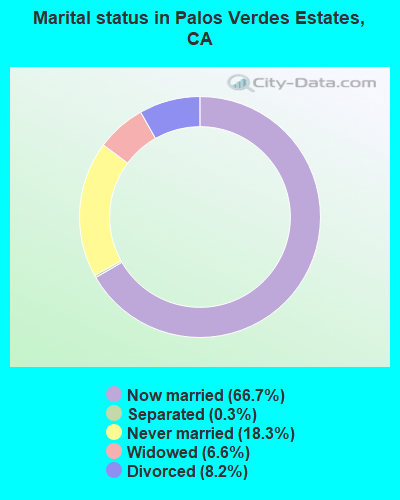
- Never married: 18.3%
- Now married: 66.7%
- Separated: 0.3%
- Widowed: 6.6%
- Divorced: 8.2%
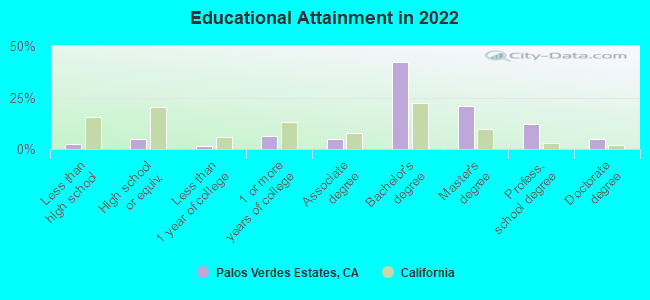
For population 25 years and over in Palos Verdes Estates:
- High school or higher: 97.6%
- Bachelor's degree or higher: 79.9%
- Graduate or professional degree: 37.4%
- Unemployed: 1.6%
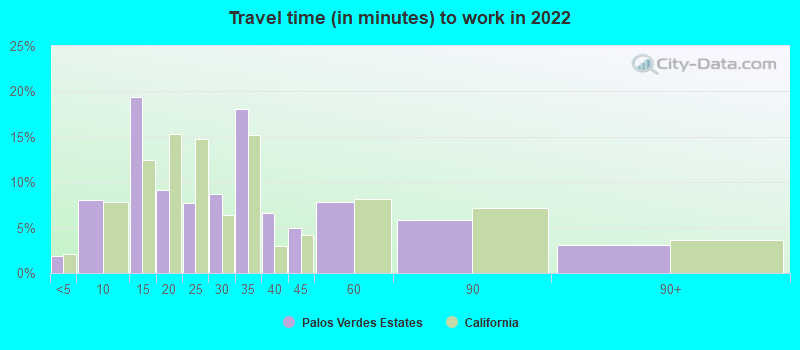
- Mean travel time to work (commute): 24.2 minutes
| Here: | 8.6 |
| California average: | 15.5 |


Graphs represent county-level data. Detailed 2008 Election Results
Political contributions by individuals in Palos Verdes Estates, CA
Religion statistics for Palos Verdes Estates, CA (based on Los Angeles County data)


| Religion | Adherents | Congregations |
|---|---|---|
| Catholic | 3,542,994 | 275 |
| Evangelical Protestant | 814,611 | 3,249 |
| Other | 451,594 | 1,023 |
| Mainline Protestant | 229,056 | 860 |
| Black Protestant | 112,338 | 290 |
| Orthodox | 63,517 | 76 |
| None | 4,604,495 | - |
Food Environment Statistics:
| Los Angeles County: | 2.12 / 10,000 pop. |
| State: | 2.14 / 10,000 pop. |
| This county: | 0.03 / 10,000 pop. |
| California: | 0.04 / 10,000 pop. |
| This county: | 0.58 / 10,000 pop. |
| State: | 0.62 / 10,000 pop. |
| Los Angeles County: | 1.23 / 10,000 pop. |
| California: | 1.49 / 10,000 pop. |
| Here: | 7.15 / 10,000 pop. |
| State: | 7.42 / 10,000 pop. |
| This county: | 7.5% |
| California: | 7.3% |
| This county: | 20.4% |
| California: | 21.3% |
| Here: | 18.6% |
| California: | 17.9% |
Health and Nutrition:
| Palos Verdes Estates: | 59.1% |
| State: | 49.4% |
| Palos Verdes Estates: | 57.3% |
| California: | 48.0% |
| Palos Verdes Estates: | 27.5 |
| State: | 28.1 |
| Palos Verdes Estates: | 15.7% |
| California: | 20.2% |
| Here: | 10.3% |
| California: | 11.2% |
| This city: | 7.0 |
| California: | 6.8 |
| Palos Verdes Estates: | 34.1% |
| State: | 31.5% |
| Palos Verdes Estates: | 62.3% |
| State: | 56.4% |
| Here: | 79.4% |
| California: | 80.9% |
More about Health and Nutrition of Palos Verdes Estates, CA Residents
| Local government employment and payroll (March 2022) | |||||
| Function | Full-time employees | Monthly full-time payroll | Average yearly full-time wage | Part-time employees | Monthly part-time payroll |
|---|---|---|---|---|---|
| Police Protection - Officers | 15 | $213,292 | $170,634 | 0 | $0 |
| Police - Other | 13 | $150,627 | $139,040 | 6 | $4,258 |
| Streets and Highways | 5 | $53,446 | $128,270 | 0 | $0 |
| Housing and Community Development (Local) | 4 | $36,656 | $109,968 | 0 | $0 |
| Financial Administration | 3 | $26,257 | $105,028 | 1 | $300 |
| Other Government Administration | 3 | $32,758 | $131,032 | 1 | $3,110 |
| Parks and Recreation | 1 | $8,092 | $97,104 | 0 | $0 |
| Other and Unallocable | 1 | $5,392 | $64,704 | 1 | $2,376 |
| Totals for Government | 45 | $526,521 | $140,406 | 9 | $10,044 |
Palos Verdes Estates government finances - Expenditure in 2017 (per resident):
- Construction - Regular Highways: $2,989,000 ($233.66)
- Current Operations - Police Protection: $7,135,000 ($557.77)
Local Fire Protection: $4,689,000 ($366.56)
Central Staff Services: $2,853,000 ($223.03)
Regular Highways: $2,675,000 ($209.12)
Parks and Recreation: $815,000 ($63.71)
Protective Inspection and Regulation - Other: $757,000 ($59.18)
Financial Administration: $719,000 ($56.21)
General - Other: $170,000 ($13.29)
Health - Other: $17,000 ($1.33)
Sewerage: $10,000 ($0.78)
- Other Capital Outlay - Police Protection: $38,000 ($2.97)
Palos Verdes Estates government finances - Revenue in 2017 (per resident):
- Charges - Other: $5,267,000 ($411.74)
Regular Highways: $5,000 ($0.39)
- Local Intergovernmental - Other: $238,000 ($18.61)
- Miscellaneous - Rents: $1,308,000 ($102.25)
General Revenue - Other: $582,000 ($45.50)
Fines and Forfeits: $135,000 ($10.55)
Interest Earnings: $49,000 ($3.83)
Donations From Private Sources: $11,000 ($0.86)
- State Intergovernmental - Other: $354,000 ($27.67)
Highways: $264,000 ($20.64)
General Local Government Support: $47,000 ($3.67)
- Tax - Property: $9,042,000 ($706.85)
General Sales and Gross Receipts: $866,000 ($67.70)
Other License: $670,000 ($52.38)
Public Utilities Sales: $541,000 ($42.29)
Documentary and Stock Transfer: $287,000 ($22.44)
Occupation and Business License - Other: $213,000 ($16.65)
Other: $1,000 ($0.08)
Palos Verdes Estates government finances - Cash and Securities in 2017 (per resident):
- Bond Funds - Cash and Securities: $10,055,000 ($786.04)
- Other Funds - Cash and Securities: $14,744,000 ($1152.60)
2.98% of this county's 2021 resident taxpayers lived in other counties in 2020 ($81,235 average adjusted gross income)
| Here: | 2.98% |
| California average: | 5.19% |
0.01% of residents moved from foreign countries ($155 average AGI)
Los Angeles County: 0.01% California average: 0.03%
Top counties from which taxpayers relocated into this county between 2020 and 2021:
| from Orange County, CA | |
| from San Bernardino County, CA | |
| from Riverside County, CA |
4.68% of this county's 2020 resident taxpayers moved to other counties in 2021 ($97,324 average adjusted gross income)
| Here: | 4.68% |
| California average: | 6.14% |
0.01% of residents moved to foreign countries ($196 average AGI)
Los Angeles County: 0.01% California average: 0.02%
Top counties to which taxpayers relocated from this county between 2020 and 2021:
| to Orange County, CA | |
| to San Bernardino County, CA | |
| to Riverside County, CA |
Businesses in Palos Verdes Estates, CA
- UPS: 1
Strongest AM radio stations in Palos Verdes Estates:
- KNX (1070 AM; 50 kW; LOS ANGELES, CA; Owner: INFINITY BROADCASTING OPERATIONS, INC.)
- KFI (640 AM; 50 kW; LOS ANGELES, CA; Owner: CAPSTAR TX LIMITED PARTNERSHIP)
- KFWB (980 AM; 50 kW; LOS ANGELES, CA; Owner: INFINITY BROADCASTING OPERATIONS, INC.)
- KSPN (710 AM; 50 kW; LOS ANGELES, CA; Owner: KABC-AM RADIO, INC.)
- KLAC (570 AM; 50 kW; LOS ANGELES, CA; Owner: AMFM RADIO LICENSES, L.L.C.)
- KBLA (1580 AM; 50 kW; SANTA MONICA, CA)
- KMPC (1540 AM; 50 kW; LOS ANGELES, CA; Owner: ROSE CITY RADIO CORPORATION)
- KTNQ (1020 AM; 50 kW; LOS ANGELES, CA; Owner: KTNQ-AM LICENSE CORP.)
- KXTA (1150 AM; 50 kW; LOS ANGELES, CA; Owner: CITICASTERS LICENSES, L.P.)
- KDIS (1110 AM; 50 kW; PASADENA, CA; Owner: ABC,INC.)
- KXMX (1190 AM; 25 kW; ANAHEIM, CA; Owner: NEW INSPIRATION BROADCASTING COMPANY)
- KRLA (870 AM; 20 kW; GLENDALE, CA; Owner: NEW INSPIRATION BROADCASTING COMPANY)
- KPLS (830 AM; 50 kW; ORANGE, CA; Owner: CRN LICENSES, LLC)
Strongest FM radio stations in Palos Verdes Estates:
- KZAB (93.5 FM; REDONDO BEACH, CA; Owner: KZAB LICENSING, INC.)
- KKBT (100.3 FM; LOS ANGELES, CA; Owner: RADIO ONE LICENSES, LLC)
- KZLA-FM (93.9 FM; LOS ANGELES, CA; Owner: EMMIS RADIO LICENSE CORPORATION)
- KPWR (105.9 FM; LOS ANGELES, CA; Owner: EMMIS RADIO LICENSE CORPORATION)
- KLSX (97.1 FM; LOS ANGELES, CA; Owner: INFINITY BROADCASTING OPERATIONS, INC.)
- KRTH-FM (101.1 FM; LOS ANGELES, CA; Owner: INFINITY BROADCASTING OPERATIONS, INC.)
- KUSC (91.5 FM; LOS ANGELES, CA; Owner: UNIVERSITY OF SOUTHERN CALIFORNIA)
- KKLA-FM (99.5 FM; LOS ANGELES, CA; Owner: NEW INSPIRATION BROADCASTING CO., INC.)
- KCBS-FM (93.1 FM; LOS ANGELES, CA; Owner: INFINITY BROADCASTING OPERATIONS, INC.)
- KSCA (101.9 FM; GLENDALE, CA; Owner: HBC LICENSE CORPORATION)
- K212FA (90.3 FM; TEMPLE CITY, CA; Owner: EDUCATIONAL MEDIA FOUNDATION)
- KLOS (95.5 FM; LOS ANGELES, CA; Owner: KLOS-FM RADIO, INC.)
- KOST (103.5 FM; LOS ANGELES, CA; Owner: CAPSTAR TX LIMITED PARTNERSHIP)
- KLVE (107.5 FM; LOS ANGELES, CA; Owner: KLVE-FM LICENSE CORP.)
- KIIS-FM (102.7 FM; LOS ANGELES, CA; Owner: CITICASTERS LICENSES, L.P.)
- KPCC (89.3 FM; PASADENA, CA; Owner: PASADENA AREA COMMUNITY COLLEGE DISTRICT)
- KHHT (92.3 FM; LOS ANGELES, CA; Owner: AMFM RADIO LICENSES, L.L.C.)
- KBIG-FM (104.3 FM; LOS ANGELES, CA; Owner: AMFM RADIO LICENSES, L.L.C.)
- KMZT-FM (105.1 FM; LOS ANGELES, CA; Owner: MOUNT WILSON FM BROADCASTERS, INC.)
- KPFK (90.7 FM; LOS ANGELES, CA; Owner: PACIFICA FOUNDATION, INC)
TV broadcast stations around Palos Verdes Estates:
- KTRO-LP (Channel 50; LANCASTER, CA; Owner: ROBERT D. ADELMAN)
- KCBS-TV (Channel 2; LOS ANGELES, CA; Owner: CBS BROADCASTING INC.)
- National Bridge Inventory (NBI) Statistics
- 1Number of bridges
- 10ft / 3.4mTotal length
- 1,122Total average daily traffic
- 11Total average daily truck traffic
- 1,234Total future (year 2038) average daily traffic
FCC Registered Broadcast Land Mobile Towers: 11 (See the full list of FCC Registered Broadcast Land Mobile Towers in Palos Verdes Estates, CA)
FCC Registered Microwave Towers: 6 (See the full list of FCC Registered Microwave Towers in this town)
FCC Registered Paging Towers: 1 (See the full list of FCC Registered Paging Towers)
FCC Registered Maritime Coast & Aviation Ground Towers: 1 (See the full list of FCC Registered Maritime Coast & Aviation Ground Towers)
FCC Registered Amateur Radio Licenses: 119 (See the full list of FCC Registered Amateur Radio Licenses in Palos Verdes Estates)
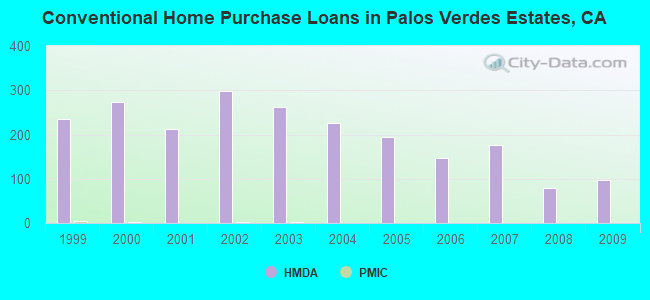
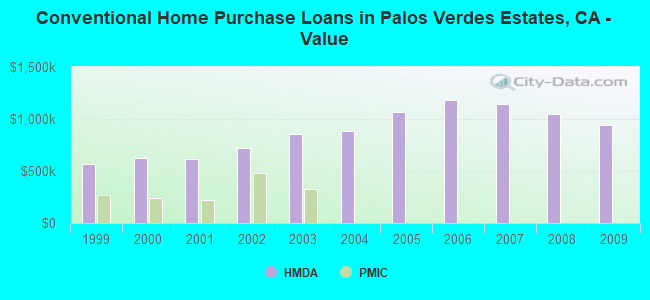
| Home Mortgage Disclosure Act Aggregated Statistics For Year 2009 (Based on 2 full and 1 partial tracts) | ||||||||||
| A) FHA, FSA/RHS & VA Home Purchase Loans | B) Conventional Home Purchase Loans | C) Refinancings | D) Home Improvement Loans | F) Non-occupant Loans on < 5 Family Dwellings (A B C & D) | ||||||
|---|---|---|---|---|---|---|---|---|---|---|
| Number | Average Value | Number | Average Value | Number | Average Value | Number | Average Value | Number | Average Value | |
| LOANS ORIGINATED | 1 | $827,510 | 98 | $937,686 | 539 | $586,180 | 34 | $664,747 | 20 | $709,968 |
| APPLICATIONS APPROVED, NOT ACCEPTED | 0 | $0 | 9 | $1,147,457 | 50 | $575,891 | 4 | $347,092 | 0 | $0 |
| APPLICATIONS DENIED | 0 | $0 | 21 | $1,230,597 | 114 | $879,022 | 3 | $303,510 | 7 | $803,407 |
| APPLICATIONS WITHDRAWN | 0 | $0 | 24 | $1,248,614 | 80 | $543,239 | 4 | $534,050 | 2 | $392,800 |
| FILES CLOSED FOR INCOMPLETENESS | 0 | $0 | 3 | $2,543,727 | 26 | $736,962 | 1 | $739,270 | 1 | $246,420 |
Detailed HMDA statistics for the following Tracts: 6703.01 , 6703.21, 6703.22
| Private Mortgage Insurance Companies Aggregated Statistics For Year 2008 (Based on 1 full tract) | ||
| B) Refinancings | ||
|---|---|---|
| Number | Average Value | |
| LOANS ORIGINATED | 0 | $0 |
| APPLICATIONS APPROVED, NOT ACCEPTED | 1 | $207,000 |
| APPLICATIONS DENIED | 0 | $0 |
| APPLICATIONS WITHDRAWN | 0 | $0 |
| FILES CLOSED FOR INCOMPLETENESS | 0 | $0 |
Detailed PMIC statistics for the following Tracts: 6703.01 , 6703.21, 6703.22
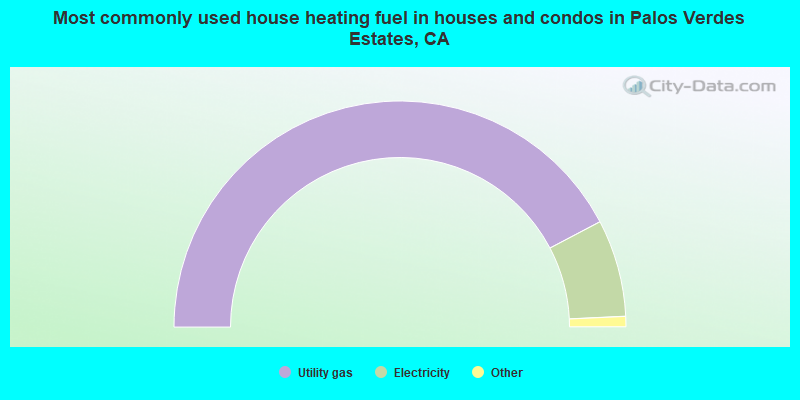
- 84.6%Utility gas
- 13.9%Electricity
- 0.6%Other fuel
- 0.5%Solar energy
- 0.2%No fuel used
- 0.2%Bottled, tank, or LP gas
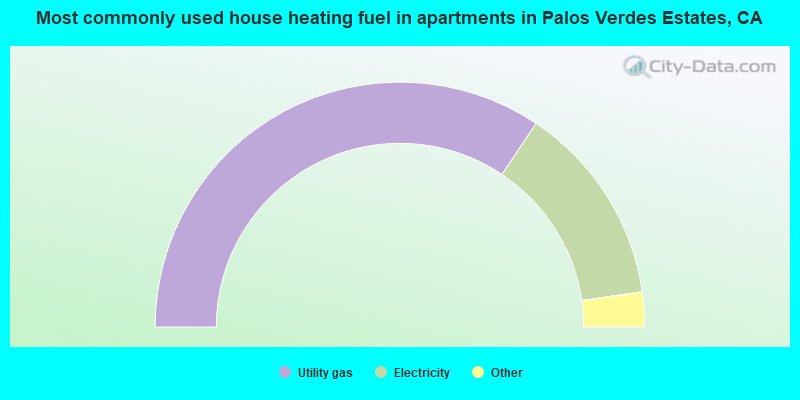
- 68.9%Utility gas
- 26.7%Electricity
- 2.7%Bottled, tank, or LP gas
- 1.8%No fuel used
Palos Verdes Estates compared to California state average:
- Median household income above state average.
- Median house value significantly above state average.
- Unemployed percentage significantly below state average.
- Black race population percentage below state average.
- Hispanic race population percentage significantly below state average.
- Median age significantly above state average.
- Renting percentage significantly below state average.
- Length of stay since moving in above state average.
- Number of rooms per house significantly above state average.
- Number of college students below state average.
- Percentage of population with a bachelor's degree or higher significantly above state average.
Palos Verdes Estates on our top lists:
- #24 on the list of "Top 101 cities with the most residents born in Taiwan (population 500+)"
- #47 on the list of "Top 100 cities with highest median household income (pop. 5,000+)"
- #50 on the list of "Top 101 cities with the most local government spending on highway construction per resident (population 10,000+)"
- #53 on the list of "Top 101 cities with the highest cost per building permit(population 5,000+)"
- #61 on the list of "Top 100 best educated cities (highest percentage of bachelor degree holding residents) (pop. 5,000+)"
- #62 on the list of "Top 101 cities with the most residents born in Japan (population 500+)"
- #68 on the list of "Top 101 cities with largest percentage of males in occupations: legal occupations (population 5,000+)"
- #69 on the list of "Top 101 cities with largest percentage of males in occupations: management occupations (population 5,000+)"
- #80 on the list of "Top 100 cities with highest median house value"
- #96 on the list of "Top 101 cities with largest percentage of males in industries: professional, scientific, and technical services (population 5,000+)"
- #96 on the list of "Top 101 cities with largest percentage of males in industries: real estate and rental and leasing (population 5,000+)"
- #97 on the list of "Top 101 cities with the lowest percentage of single-parent households, population 5,000+"
- #47 (90274) on the list of "Top 101 zip codes with the largest percentage of taxpayers reporting taxable interest in 2012 (pop 5,000+)"
- #60 (90274) on the list of "Top 101 zip codes with the highest 2012 average Adjusted Gross Income (AGI) for individuals (pop 5,000+)"
- #68 (90274) on the list of "Top 101 zip codes with the largest percentage of taxpayers using charity contributions deductions in 2012 (pop 5,000+)"
- #76 (90274) on the list of "Top 101 zip codes with the largest percentage of taxpayers reporting net capital gain/loss in 2012 (pop 5,000+)"
- #81 (90274) on the list of "Top 101 zip codes with the highest 2012 average reported profit/loss from business (pop 5,000+)"
- #92 (90274) on the list of "Top 101 zip codes with the highest average reported salary/wage in 2012 (pop 5,000+)"
- #1 on the list of "Top 101 counties with the most Evangelical Protestant congregations"
- #1 on the list of "Top 101 counties with the most Mainline Protestant congregations"
- #1 on the list of "Top 101 counties with the most Orthodox adherents"
- #1 on the list of "Top 101 counties with the highest ground withdrawal of fresh water for public supply (pop. 50,000+)"
- #1 on the list of "Top 101 counties with the most Catholic adherents (pop. 50,000+)"

|
|
Total of 317 patent applications in 2008-2024.