Estimated zip code population in 2022: 11,427 Zip code population in 2010: 11,442 Zip code population in 2000: 11,326
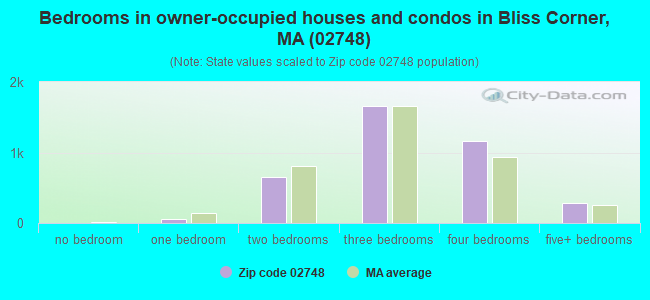
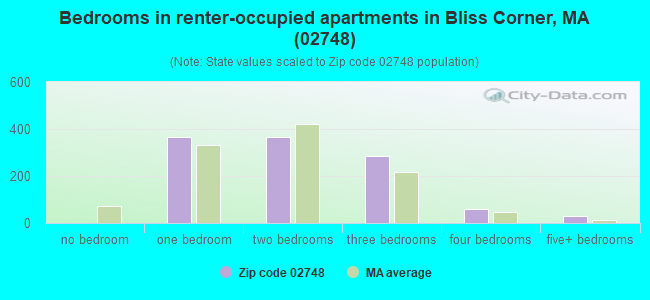
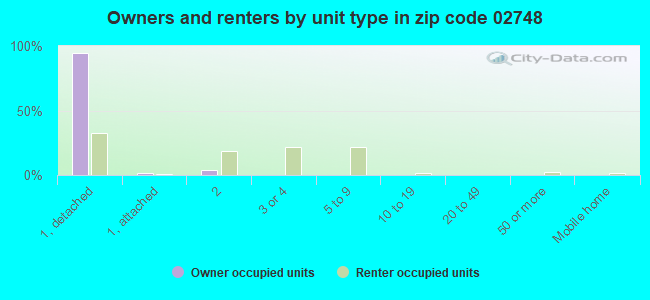
Houses and condos: 5,405 Renter-occupied apartments: 1,106
% of renters here:
22%
State:
38%
March 2022 cost of living index in zip code 02748: 130.1 (high, U.S. average is 100)
Land area: 22.5 sq. mi. Water area: 3.1 sq. mi.
Population density: 508 people per square mile
(low).
OSM Map
Google Map
MSN Map
OSM Map
General Map
Google Map
MSN Map
OSM Map
Google Map
MSN Map
OSM Map
Google Map
MSN Map
Please wait while loading the map...
Real estate property taxes paid for housing units in 2022:
This zip code:
0.8% ($4,034)
Massachusetts:
1.0% ($5,536)
Median real estate property taxes paid for housing units with mortgages in 2022: $4,143 (0.8%) Median real estate property taxes paid for housing units with no mortgage in 2022: $3,919 (0.9%)
Business Search- 14 Million verified businesses
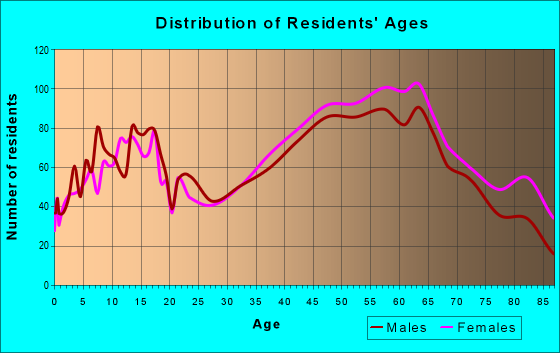
Males: 5,585
(48.9%)
Females: 5,842
(51.1%)
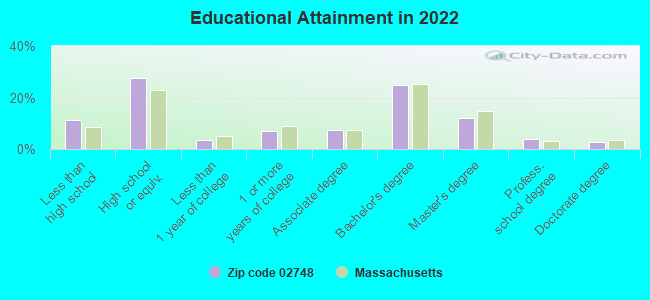
For population 25 years and over in 02748:
High school or higher: 88.8%
Bachelor's degree or higher: 43.3%
Graduate or professional degree: 18.7%
Unemployed: 1.8%
Mean travel time to work (commute): 25.0 minutes
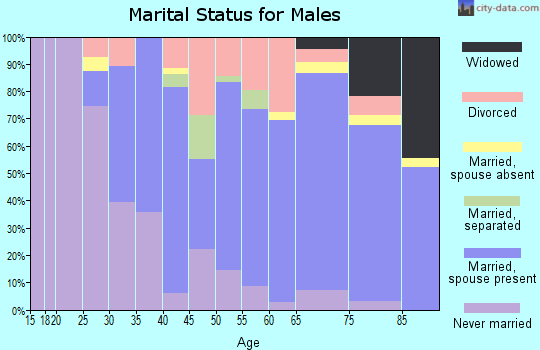
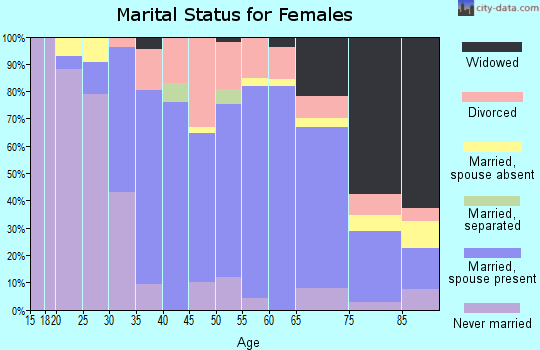
For population 15 years and over in 02748:
Never married: 27.4%
Now married: 54.2%
Separated: 1.1%
Widowed: 7.4%
Divorced: 9.9%
Zip code 02748 compared to state average:
Unemployed percentage below state average.
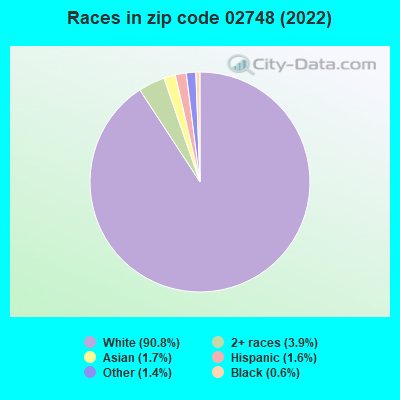
Black race population percentage significantly below state average.
Hispanic race population percentage significantly below state average.
Median age significantly above state average.
Foreign-born population percentage below state average.
Renting percentage below state average.
Length of stay since moving in significantly above state average.
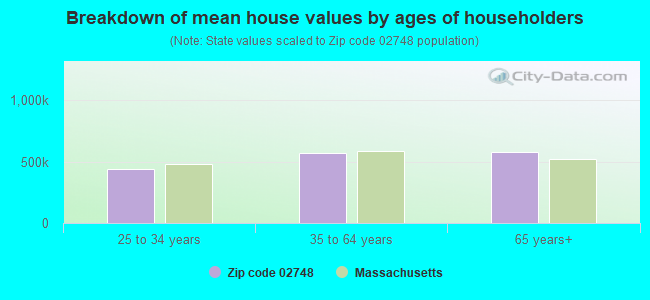
Estimated median house/condo value in 2022: $498,015
02748:
$498,015
Massachusetts:
$534,700
According to our research of Massachusetts and other state lists, there were 2 registered sex offenders living in 02748 zip code as of April 27, 2024. The ratio of all residents to sex offenders in zip code 02748 is 6,009 to 1. The ratio of registered sex offenders to all residents in this zip code is much lower than the state average.
Median resident age:
This zip code:
50.6 years
Massachusetts median age:
40.3 years
Average household size:
This zip code:
2.3 people
Massachusetts:
2.4 people
Averages for the 2020 tax year for zip code 02748, filed in 2021:
Average Adjusted Gross Income (AGI) in 2020: $110,840 (Individual Income Tax Returns)
Here:
$110,840
State:
$105,130
Salary/wage: $79,641 (reported on 75.4% of returns)
Here:
$79,641
State:
$82,951
(% of AGI for various income ranges: 1108.2% for AGIs below $25k, 3413.9% for AGIs $25k-50k, 6147.8% for AGIs $50k-75k, 9262.2% for AGIs $75k-100k, 18335.8% for AGIs $100k-200k, 84946.1% for AGIs over 200k)
Taxable interest for individuals: $2,195 (reported on 45.1% of returns)
This zip code:
$2,195
Massachusetts:
$2,361
(% of AGI for various income ranges: 27.2% for AGIs below $25k, 34.5% for AGIs $25k-50k, 72.0% for AGIs $50k-75k, 101.5% for AGIs $75k-100k, 183.7% for AGIs $100k-200k, 2065.6% for AGIs over 200k)
Ordinary dividends: $17,125 (reported on 30.9% of returns)
Here:
$17,125
State:
$10,365
(% of AGI for various income ranges: 64.2% for AGIs below $25k, 90.0% for AGIs $25k-50k, 249.2% for AGIs $50k-75k, 381.0% for AGIs $75k-100k, 902.8% for AGIs $100k-200k, 12941.1% for AGIs over 200k)
Net capital gain/loss in AGI: +$45,118 (reported on 27.4% of returns)
Here:
+$45,118
State:
+$48,178
(% of AGI for various income ranges: 27.9% for AGIs below $25k, 56.4% for AGIs $25k-50k, 196.4% for AGIs $50k-75k, 416.5% for AGIs $75k-100k, 1225.8% for AGIs $100k-200k, 36800.6% for AGIs over 200k)
Profit/loss from business: +$26,057 (reported on 16.8% of returns)
Here:
+$26,057
State:
+$20,792
(% of AGI for various income ranges: 106.3% for AGIs below $25k, 172.1% for AGIs $25k-50k, 490.7% for AGIs $50k-75k, 540.0% for AGIs $75k-100k, 1064.5% for AGIs $100k-200k, 7496.7% for AGIs over 200k)
Taxable individual retirement arrangement distribution: $27,400 (reported on 14.1% of returns)
02748:
$27,400
Massachusetts:
$22,790
(% of AGI for various income ranges: 116.3% for AGIs below $25k, 142.3% for AGIs $25k-50k, 324.6% for AGIs $50k-75k, 370.2% for AGIs $75k-100k, 1388.0% for AGIs $100k-200k, 5623.9% for AGIs over 200k)
Self-employed (Keogh) retirement plans: $21,800 (reported on 1.3% of returns)
02748:
$21,800
Massachusetts:
$26,868
(% of AGI for various income ranges: 78.5% for AGIs $100k-200k, 707.2% for AGIs over 200k)
Total itemized deductions: $35,267 (reported on 13.3% of returns)
Here:
$35,267
State:
$36,722
(% of AGI for various income ranges: 112.3% for AGIs below $25k, 212.6% for AGIs $25k-50k, 395.8% for AGIs $50k-75k, 644.2% for AGIs $75k-100k, 1248.2% for AGIs $100k-200k, 7806.7% for AGIs over 200k)
Charity contributions: $11,252 (reported on 11.0% of returns)
Here:
$11,252
State:
$12,529
(% of AGI for various income ranges: 4.0% for AGIs below $25k, 9.4% for AGIs $25k-50k, 32.7% for AGIs $50k-75k, 55.0% for AGIs $75k-100k, 228.8% for AGIs $100k-200k, 3256.7% for AGIs over 200k)
Taxes paid: $8,659 (reported on 13.1% of returns)
02748:
$8,659
State:
$8,782
(% of AGI for various income ranges: 15.7% for AGIs below $25k, 40.0% for AGIs $25k-50k, 113.9% for AGIs $50k-75k, 218.8% for AGIs $75k-100k, 380.5% for AGIs $100k-200k, 1550.0% for AGIs over 200k)
Earned income credit: $1,707 (reported on 7.0% of returns)
Here:
$1,707
State:
$1,909
(% of AGI for various income ranges: 48.5% for AGIs below $25k, 36.3% for AGIs $25k-50k)
Percentage of individuals using paid preparers for their 2020 taxes: 93.6%
Here:
94%
State:
92%
(% for various income ranges: 91.7% for AGIs below $25k, 94.1% for AGIs $25k-50k, 93.6% for AGIs $50k-75k, 93.9% for AGIs $75k-100k, 94.2% for AGIs $100k-200k, 95.6% for AGIs over 200k)
Averages for the 2012 tax year for zip code 02748, filed in 2013:
Average Adjusted Gross Income (AGI) in 2012: $87,971 (Individual Income Tax Returns)
Here:
$87,971
State:
$81,425
Salary/wage: $64,035 (reported on 79.2% of returns)
Here:
$64,035
State:
$64,752
(% of AGI for various income ranges: 66.4% for AGIs below $25k, 70.8% for AGIs $25k-50k, 70.9% for AGIs $50k-75k, 70.6% for AGIs $75k-100k, 69.3% for AGIs $100k-200k, 42.1% for AGIs over 200k)
Taxable interest for individuals: $2,281 (reported on 48.1% of returns)
This zip code:
$2,281
Massachusetts:
$2,136
(% of AGI for various income ranges: 1.7% for AGIs below $25k, 1.1% for AGIs $25k-50k, 1.2% for AGIs $50k-75k, 0.9% for AGIs $75k-100k, 1.3% for AGIs $100k-200k, 1.3% for AGIs over 200k)
Ordinary dividends: $10,313 (reported on 32.2% of returns)
Here:
$10,313
State:
$9,473
(% of AGI for various income ranges: 4.5% for AGIs below $25k, 2.1% for AGIs $25k-50k, 2.1% for AGIs $50k-75k, 2.4% for AGIs $75k-100k, 3.3% for AGIs $100k-200k, 5.0% for AGIs over 200k)
Net capital gain/loss in AGI: +$32,801 (reported on 25.3% of returns)
Here:
+$32,801
State:
+$31,437
(% of AGI for various income ranges: 0.1% for AGIs below $25k, 0.4% for AGIs $25k-50k, 0.5% for AGIs $50k-75k, 0.8% for AGIs $75k-100k, 2.8% for AGIs $100k-200k, 19.7% for AGIs over 200k)
Profit/loss from business: +$23,760 (reported on 16.3% of returns)
Here:
+$23,760
State:
+$20,662
(% of AGI for various income ranges: 6.5% for AGIs below $25k, 4.6% for AGIs $25k-50k, 3.5% for AGIs $50k-75k, 4.2% for AGIs $75k-100k, 5.4% for AGIs $100k-200k, 3.9% for AGIs over 200k)
Taxable individual retirement arrangement distribution: $24,382 (reported on 13.5% of returns)
02748:
$24,382
Massachusetts:
$18,892
(% of AGI for various income ranges: 4.1% for AGIs below $25k, 3.0% for AGIs $25k-50k, 2.9% for AGIs $50k-75k, 3.6% for AGIs $75k-100k, 3.6% for AGIs $100k-200k, 4.1% for AGIs over 200k)
Self-employment retirement plans: $18,888 (reported on 1.4% of returns)
02748:
$18,888
Massachusetts:
$20,669
Total itemized deductions: $29,527 (18% of AGI, reported on 41.8% of returns)
Here:
$29,527
State:
$28,907
Here:
18.0% of AGI
State:
18.2% of AGI
(% of AGI for various income ranges: 16.4% for AGIs below $25k, 11.4% for AGIs $25k-50k, 14.4% for AGIs $50k-75k, 15.1% for AGIs $75k-100k, 16.5% for AGIs $100k-200k, 12.6% for AGIs over 200k)
Charity contributions: $4,267 (reported on 35.1% of returns)
Here:
$4,267
State:
$4,208
(% of AGI for various income ranges: 0.7% for AGIs below $25k, 0.7% for AGIs $25k-50k, 0.9% for AGIs $50k-75k, 1.0% for AGIs $75k-100k, 1.3% for AGIs $100k-200k, 2.5% for AGIs over 200k)
Taxes paid: $13,410 (reported on 41.8% of returns)
02748:
$13,410
State:
$13,303
(% of AGI for various income ranges: 3.5% for AGIs below $25k, 3.3% for AGIs $25k-50k, 5.1% for AGIs $50k-75k, 5.7% for AGIs $75k-100k, 7.4% for AGIs $100k-200k, 7.1% for AGIs over 200k)
Earned income credit: $1,642 (reported on 9.6% of returns)
Here:
$1,642
State:
$1,971
(% of AGI for various income ranges: 3.2% for AGIs below $25k, 0.5% for AGIs $25k-50k)
Percentage of individuals using paid preparers for their 2012 taxes: 67.0%
Here:
67%
State:
56%
(% for various income ranges: 59.4% for AGIs below $25k, 61.1% for AGIs $25k-50k, 71.3% for AGIs $50k-75k, 69.6% for AGIs $75k-100k, 73.9% for AGIs $100k-200k, 90.2% for AGIs over 200k)
Averages for the 2004 tax year for zip code 02748, filed in 2005:
Average Adjusted Gross Income (AGI) in 2004: $72,347 (Individual Income Tax Returns)
Here:
$72,347
State:
$62,877
Salary/wage: $54,824 (reported on 79.6% of returns)
Here:
$54,824
State:
$52,969
(% of AGI for various income ranges: 163.8% for AGIs below $10k, 66.7% for AGIs $10k-25k, 75.3% for AGIs $25k-50k, 77.3% for AGIs $50k-75k, 74.6% for AGIs $75k-100k, 49.6% for AGIs over 100k)
Taxable interest for individuals: $2,452 (reported on 64.5% of returns)
This zip code:
$2,452
Massachusetts:
$1,945
(% of AGI for various income ranges: 17.8% for AGIs below $10k, 3.4% for AGIs $10k-25k, 2.1% for AGIs $25k-50k, 1.8% for AGIs $50k-75k, 1.8% for AGIs $75k-100k, 2.1% for AGIs over 100k)
Taxable dividends: $6,655 (reported on 37.2% of returns)
Here:
$6,655
State:
$5,323
(% of AGI for various income ranges: 14.2% for AGIs below $10k, 3.2% for AGIs $10k-25k, 1.9% for AGIs $25k-50k, 1.9% for AGIs $50k-75k, 2.7% for AGIs $75k-100k, 4.1% for AGIs over 100k)
Net capital gain/loss: +$20,540 (reported on 30.2% of returns)
Here:
+$20,540
State:
+$20,377
(% of AGI for various income ranges: -5.8% for AGIs below $10k, 1.2% for AGIs $10k-25k, 0.9% for AGIs $25k-50k, 0.9% for AGIs $50k-75k, 2.8% for AGIs $75k-100k, 13.5% for AGIs over 100k)
Profit/loss from business: +$25,993 (reported on 16.8% of returns)
Here:
+$25,993
State:
+$17,837
(% of AGI for various income ranges: 11.1% for AGIs below $10k, 6.3% for AGIs $10k-25k, 6.0% for AGIs $25k-50k, 4.2% for AGIs $50k-75k, 5.4% for AGIs $75k-100k, 6.5% for AGIs over 100k)
IRA payment deduction: $3,575 (reported on 4.4% of returns)
02748:
$3,575
Massachusetts:
$3,100
(% of AGI for various income ranges: 0.6% for AGIs $10k-25k, 0.5% for AGIs $25k-50k, 0.4% for AGIs $50k-75k, 0.3% for AGIs $75k-100k, 0.1% for AGIs over 100k)
Self-employed pension: $18,150 (reported on 1.9% of returns)
Here:
$18,150
Massachusetts:
$14,516
Total itemized deductions: $23,411 (18% of AGI, reported on 43.6% of returns)
Here:
$23,411
State:
$22,573
Here:
18.0% of AGI
State:
19.5% of AGI
(% of AGI for various income ranges: 32.3% for AGIs below $10k, 13.9% for AGIs $10k-25k, 13.5% for AGIs $25k-50k, 15.7% for AGIs $50k-75k, 18.3% for AGIs $75k-100k, 12.9% for AGIs over 100k)
Charity contributions deductions: $3,457 (3% of AGI, reported on 40.6% of returns)
Here:
$3,457
State:
$3,295
Here:
2.6% of AGI
State:
2.7% of AGI
(% of AGI for various income ranges: 1.4% for AGIs below $10k, 0.8% for AGIs $10k-25k, 1.0% for AGIs $25k-50k, 1.3% for AGIs $50k-75k, 1.7% for AGIs $75k-100k, 2.4% for AGIs over 100k)
Total tax: $14,131 (reported on 82.8% of returns)
02748:
$14,131
State:
$11,494
(% of AGI for various income ranges: 6.4% for AGIs below $10k, 5.0% for AGIs $10k-25k, 8.0% for AGIs $25k-50k, 9.1% for AGIs $50k-75k, 10.2% for AGIs $75k-100k, 21.3% for AGIs over 100k)
Earned income credit: $1,295 (reported on 6.8% of returns)
Here:
$1,295
State:
$1,518
Percentage of individuals using paid preparers for their 2004 taxes: 69.8%
Here:
70%
State:
58%
(% for various income ranges: 58.5% for AGIs below $10k, 65.1% for AGIs $10k-25k, 69.6% for AGIs $25k-50k, 75.3% for AGIs $50k-75k, 74.2% for AGIs $75k-100k, 81.3% for AGIs over 100k)
Household received Food Stamps/SNAP in the past 12 months: 818 Household did not receive Food Stamps/SNAP in the past 12 months: 4,126
Women who had a birth in the past 12 months: 62 (54 now married, 9 unmarried) Women who did not have a birth in the past 12 months: 2,027 (827 now married, 1,194 unmarried)
Housing units in zip code 02748 with a mortgage: 2,186 (428 second mortgage, 12 home equity loan, 407 both second mortgage and home equity loan) Houses without a mortgage: 80
Median monthly owner costs for units with a mortgage: $2,179 Median monthly owner costs for units without a mortgage: $809
Residents with income below the poverty level in 2022:
This zip code:
5.6%
Whole state:
10.4%
Residents with income below 50% of the poverty level in 2022:
This zip code:
3.5%
Whole state:
5.1%
Median number of rooms in houses and condos:
Here:
6.7
State:
6.5
Median number of rooms in apartments:
Here:
4.6
State:
4.0
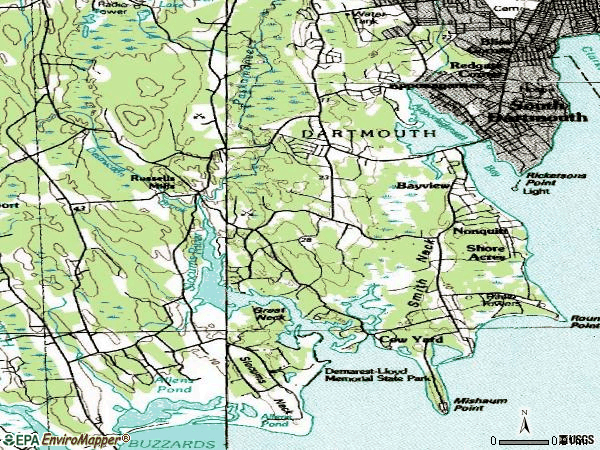
Notable locations in this zip code not listed on our city pages
Notable locations in zip code 02748: Dartmouth Fire Department District 2 (A), Dartmouth Fire Department District 1 Station 1 Headquarters (B), Doll Museum (C). Display/hide their locations on the map
Parks in zip code 02748 include: Demarest Lloyd Memorial State Park (1), Apponagansett Point Recreation Area (2), Jones Park (3). Display/hide their locations on the map
Tourist attraction (not listed on the city page) : Dartmouth Town - Libraries- Main-Southworth (Cultural Attractions- Events- & Facilities; 732 Dartmouth Street) (1). Display/hide its approximate location on the map
In group quarters: 127 (-1 institutionalized population)
Size of family households: 1,605 2-persons, 742 3-persons, 728 4-persons, 158 5-persons, 18 6-persons, 37 7-or-more-persons
Size of nonfamily households: 1,453 1-person, 169 2-persons, 9 3-persons
1,225 married couples with children.
209 single-parent households (26 men, 183 women).
80.1% of residents of 02748 zip code speak English at home.
1.3% of residents speak Spanish at home (92% very well, 4% well, 4% not well).
17.7% of residents speak other Indo-European language at home (78% very well, 14% well, 5% not well, 3% not at all).
0.9% of residents speak Asian or Pacific Island language at home (92% very well, 8% not well).
0.2% of residents speak other language at home (100% well).
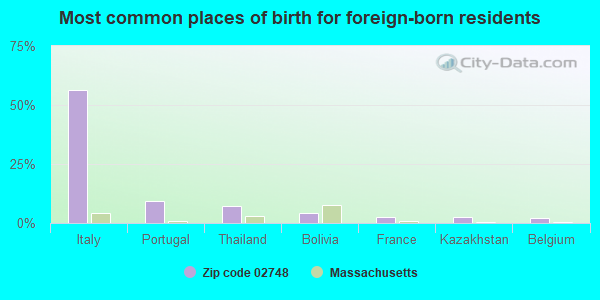
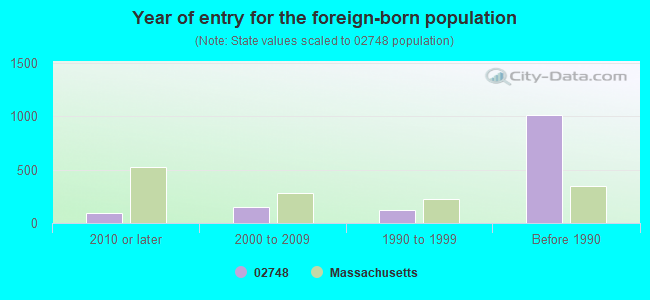
Foreign born population: 1,275 (11.2%) (92.2% of them are naturalized citizens)
This zip code:
11.2%
Whole state:
18.0%
56%Italy
9%Portugal
7%Thailand
4%Bolivia
3%France
3%Kazakhstan
2%Belgium
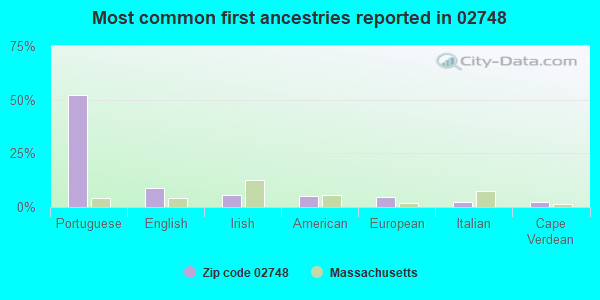
52%Portuguese
9%English
6%Irish
5%American
5%European
2%Italian
2%Cape Verdean
Year of entry for the foreign-born population
912010 or later
1542000 to 2009
1181990 to 1999
1,011Before 1990
Facilities with environmental interests located in this zip code:
JOSEPH DEMELLO SCHOOL (654 DARTMOUTH STREET in DARTMOUTH, MA)
AIR MINOR (AIRS/AFS) (National Center for Education Statistics) - STATE ID-072015 CRITERIA AND HAZARDOUS AIR POLLUTANT INVENTORY (Inventory of air pollution sources) Business SIC classification: ELEMENTARY AND SECONDARY SCHOOLS Organizations: DARTMOUTH (SCHOOL DISTRICT)
ANDREW B CUSHMAN (746 DARTMOUTH STREET in SOUTH DARTMOUTH, MA)
(National Center for Education Statistics) - STATE ID-072010 Organizations: DARTMOUTH (SCHOOL DISTRICT)
MARSHALL MARINE CORP (SHIPYARD LN in DARTMOUTH, MA)
(Resource Conservation and Recovery Act (tracking hazardous waste))
BLUE EAGLE PRESS INC (10 KRASEMAN ST in DARTMOUTH, MA)
(Resource Conservation and Recovery Act (tracking hazardous waste))
OWENS ILLINOIS (P.O. BOX 624 in DARTMOUTH, MA)
AIR MINOR (AIRS/AFS) Business SIC classification: NONCLASSIFIABLE ESTABLISHMENTS
LEDGE THE (757-782 STATE ROAD in DARTMOUTH, MA)
SUPERFUND (Superfund database) Alternative names: AKA CECIL SMITH PROPERTY, AKA H & M DRUM
Housing units lacking complete plumbing facilities: 2.2% Housing units lacking complete kitchen facilities: 0.9%
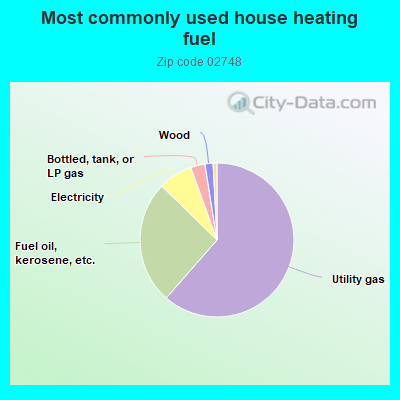
61.5%Utility gas
25.9%Fuel oil, kerosene, etc.
7.2%Electricity
3.0%Bottled, tank, or LP gas
1.7%Wood
Population in 1990: 10,980. Population change in the 1990s: +346 (+3.2%).
Place of birth for U.S.-born residents:
This state: 7,729
Northeast: 1,623
Midwest: 197
South: 239
West: 147
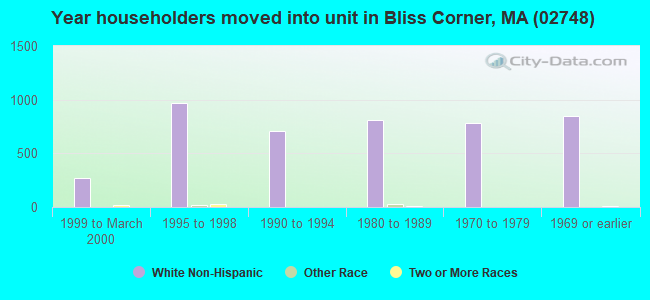
72% of the 02748 zip code residents lived in the same house 5 years ago. Out of people who lived in different houses, 78% lived in this county. Out of people who lived in different counties, 50% lived in Massachusetts.
92% of the 02748 zip code residents lived in the same house 1 year ago. Out of people who lived in different houses, 61% moved from this county. Out of people who lived in different houses, 20% moved from different county within same state. Out of people who lived in different houses, 18% moved from different state.
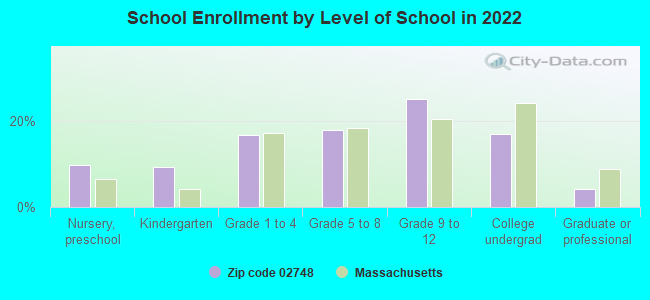
Private vs. public school enrollment:
Students in private schools in grades 1 to 8 (elementary and middle school): 30
Here:
4.9%
Massachusetts:
10.3%
Students in private schools in grades 9 to 12 (high school): 60
Here:
13.4%
Massachusetts:
12.3%
Students in private undergraduate colleges: 153
Here:
50.1%
Massachusetts:
51.2%
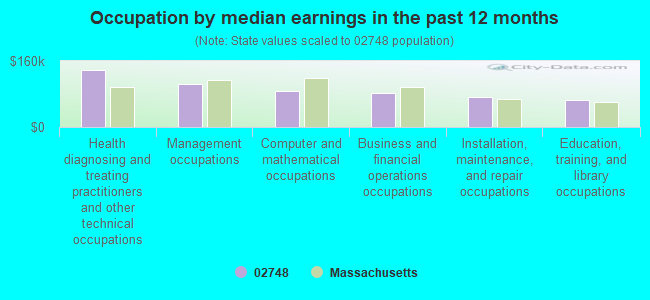
Occupation by median earnings in the past 12 months ($)
137,260Health diagnosing and treating practitioners and other technical occupations
104,048Management occupations
88,238Computer and mathematical occupations
82,969Business and financial operations occupations
73,106Installation, maintenance, and repair occupations
66,411Education, training, and library occupations
Companies with federal contracts located in this zip code:
PADANARAM ASSOCIATES INC (441 ELM ST in SOUTH DARTMOUT, MA; small business)
$35,988 with U.S. Army Corps of Engineers - civil program financing only for Other Professional Services. Taking place in DC. Signed on 2000-06-26. Completion date: 2000-10-30.
Top industries in this zip code by the number of employees in 2005:
Health Care and Social Assistance: Nursing Care Facilities (100-249 employees: 1 establishment)
2002 - 2018 National Fire Incident Reporting System (NFIRS) incidents
According to the data from the years 2002 - 2018 the average number of fire incidents per year is 34. The highest number of reported fire incidents - 53 took place in 2003, and the least - 10 in 2005. The data has a dropping trend.
When looking into fire subcategories, the most reports belonged to: Structure Fires (46.3%), and Outside Fires (37.1%).
Fire incident types reported to NFIRS in Zip Code 02748


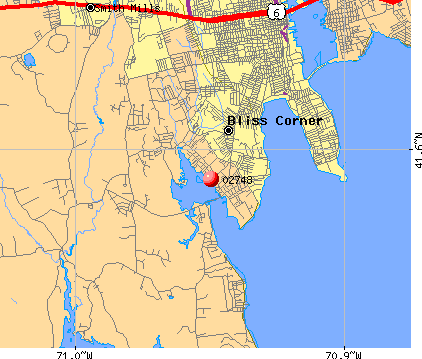 Nearest zip codes: 02744, 02740, 02791, 02746, 02747, 02790.


 According to the data from the years 2002 - 2018 the average number of fire incidents per year is 34. The highest number of reported fire incidents - 53 took place in 2003, and the least - 10 in 2005. The data has a dropping trend.
 When looking into fire subcategories, the most reports belonged to: Structure Fires (46.3%), and Outside Fires (37.1%).