Estimated zip code population in 2022: 9,626 Zip code population in 2010: 9,283 Zip code population in 2000: 9,665
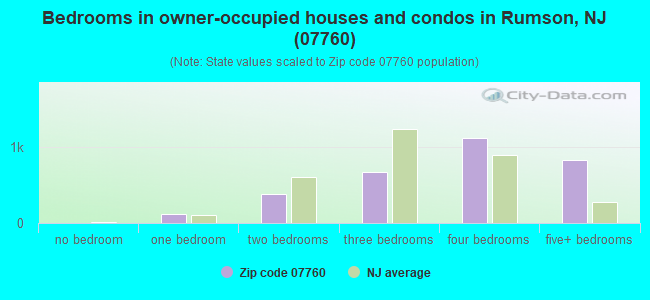
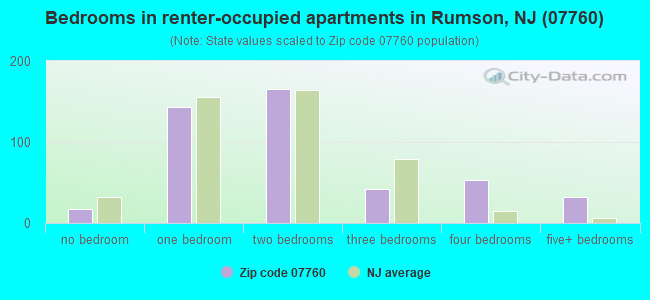
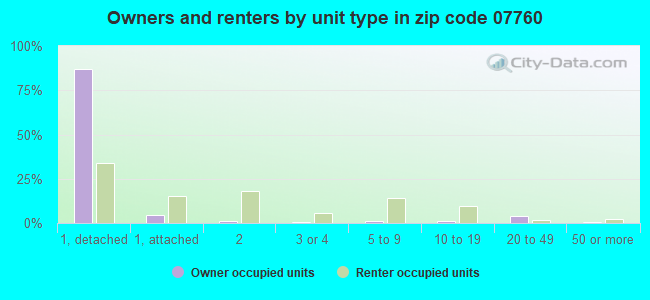
Houses and condos: 3,930 Renter-occupied apartments: 453
% of renters here:
13%
State:
35%
March 2022 cost of living index in zip code 07760: 121.1 (high, U.S. average is 100)
Land area: 7.6 sq. mi. Water area: 3.4 sq. mi.
Population density: 1,270 people per square mile
(low).
OSM Map
Google Map
MSN Map
OSM Map
General Map
Google Map
MSN Map
OSM Map
Google Map
MSN Map
OSM Map
Google Map
MSN Map
Please wait while loading the map...
Real estate property taxes paid for housing units in 2022:
This zip code:
0.8% ($9,521)
New Jersey:
2.1% ($8,897)
Median real estate property taxes paid for housing units with mortgages in 2022: $9,557 (0.7%) Median real estate property taxes paid for housing units with no mortgage in 2022: $9,483 (0.9%)
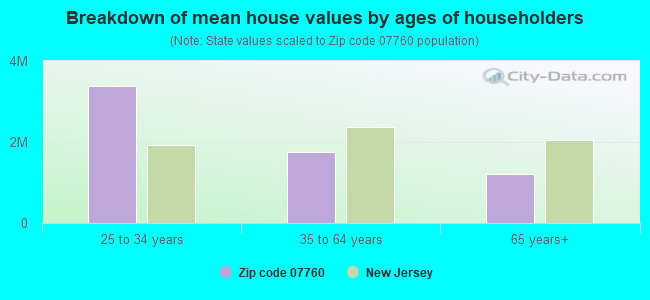
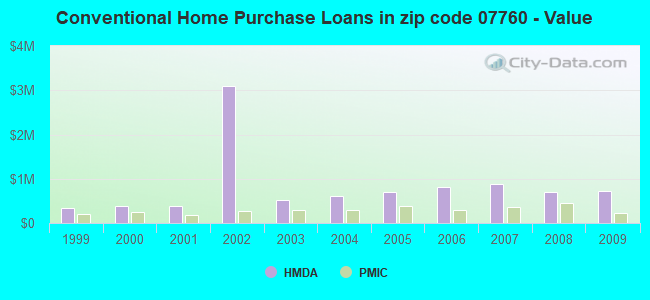
Estimated median house/condo value in 2022: $1,258,919
07760:
$1,258,919
New Jersey:
$428,900
According to our research of New Jersey and other state lists, there was 1 registered sex offender living in 07760 zip code as of May 08, 2024. The ratio of all residents to sex offenders in zip code 07760 is 9,073 to 1. The ratio of registered sex offenders to all residents in this zip code is much lower than the state average.
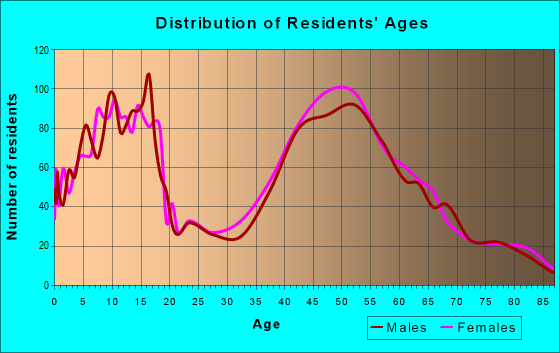
Median resident age:
This zip code:
46.3 years
New Jersey median age:
40.4 years
Average household size:
This zip code:
2.7 people
New Jersey:
2.6 people
Averages for the 2020 tax year for zip code 07760, filed in 2021:
Average Adjusted Gross Income (AGI) in 2020: $467,782 (Individual Income Tax Returns)
Here:
$467,782
State:
$95,247
Salary/wage: $316,009 (reported on 76.2% of returns)
Here:
$316,009
State:
$80,635
(% of AGI for various income ranges: 1406.1% for AGIs below $25k, 4470.4% for AGIs $25k-50k, 7402.3% for AGIs $50k-75k, 11325.7% for AGIs $75k-100k, 21707.3% for AGIs $100k-200k, 290602.9% for AGIs over 200k)
Taxable interest for individuals: $11,872 (reported on 56.8% of returns)
This zip code:
$11,872
New Jersey:
$2,414
(% of AGI for various income ranges: 46.8% for AGIs below $25k, 244.8% for AGIs $25k-50k, 123.6% for AGIs $50k-75k, 212.9% for AGIs $75k-100k, 434.3% for AGIs $100k-200k, 8292.0% for AGIs over 200k)
Ordinary dividends: $41,701 (reported on 60.0% of returns)
Here:
$41,701
State:
$8,057
(% of AGI for various income ranges: 274.9% for AGIs below $25k, 423.2% for AGIs $25k-50k, 516.8% for AGIs $50k-75k, 947.9% for AGIs $75k-100k, 1954.7% for AGIs $100k-200k, 30595.1% for AGIs over 200k)
Net capital gain/loss in AGI: +$168,426 (reported on 55.1% of returns)
Here:
+$168,426
State:
+$25,022
(% of AGI for various income ranges: 148.0% for AGIs below $25k, 623.2% for AGIs $25k-50k, 693.2% for AGIs $50k-75k, 856.4% for AGIs $75k-100k, 1789.0% for AGIs $100k-200k, 121705.1% for AGIs over 200k)
Profit/loss from business: +$53,505 (reported on 21.7% of returns)
Here:
+$53,505
State:
+$18,035
(% of AGI for various income ranges: 143.4% for AGIs below $25k, 442.0% for AGIs $25k-50k, 697.3% for AGIs $50k-75k, 1194.3% for AGIs $75k-100k, 2090.7% for AGIs $100k-200k, 12401.1% for AGIs over 200k)
Taxable individual retirement arrangement distribution: $38,537 (reported on 10.9% of returns)
07760:
$38,537
New Jersey:
$21,558
(% of AGI for various income ranges: 60.7% for AGIs below $25k, 206.4% for AGIs $25k-50k, 221.8% for AGIs $50k-75k, 443.6% for AGIs $75k-100k, 2160.3% for AGIs $100k-200k, 3228.3% for AGIs over 200k)
Self-employed (Keogh) retirement plans: $42,024 (reported on 4.5% of returns)
07760:
$42,024
New Jersey:
$30,844
(% of AGI for various income ranges: 177.0% for AGIs $100k-200k, 2369.7% for AGIs over 200k)
Total itemized deductions: $56,212 (reported on 37.0% of returns)
Here:
$56,212
State:
$32,863
(% of AGI for various income ranges: 283.9% for AGIs below $25k, 718.4% for AGIs $25k-50k, 869.1% for AGIs $50k-75k, 1560.0% for AGIs $75k-100k, 2943.3% for AGIs $100k-200k, 23406.6% for AGIs over 200k)
Charity contributions: $23,455 (reported on 33.2% of returns)
Here:
$23,455
State:
$7,880
(% of AGI for various income ranges: 15.1% for AGIs below $25k, 56.8% for AGIs $25k-50k, 86.4% for AGIs $50k-75k, 142.9% for AGIs $75k-100k, 304.3% for AGIs $100k-200k, 10023.7% for AGIs over 200k)
Taxes paid: $9,640 (reported on 37.0% of returns)
07760:
$9,640
State:
$9,183
(% of AGI for various income ranges: 81.5% for AGIs below $25k, 221.2% for AGIs $25k-50k, 276.8% for AGIs $50k-75k, 495.7% for AGIs $75k-100k, 870.7% for AGIs $100k-200k, 3420.3% for AGIs over 200k)
Earned income credit: $1,067 (reported on 2.6% of returns)
Here:
$1,067
State:
$2,148
(% of AGI for various income ranges: 19.0% for AGIs below $25k, 20.0% for AGIs $25k-50k)
Percentage of individuals using paid preparers for their 2020 taxes: 93.8%
Here:
94%
State:
92%
(% for various income ranges: 92.3% for AGIs below $25k, 93.6% for AGIs $25k-50k, 90.7% for AGIs $50k-75k, 93.5% for AGIs $75k-100k, 92.2% for AGIs $100k-200k, 96.4% for AGIs over 200k)
Averages for the 2012 tax year for zip code 07760, filed in 2013:
Average Adjusted Gross Income (AGI) in 2012: $340,779 (Individual Income Tax Returns)
Here:
$340,779
State:
$79,688
Salary/wage: $237,946 (reported on 75.7% of returns)
Here:
$237,946
State:
$68,122
(% of AGI for various income ranges: 64.6% for AGIs below $25k, 62.0% for AGIs $25k-50k, 60.2% for AGIs $50k-75k, 59.9% for AGIs $75k-100k, 62.3% for AGIs $100k-200k, 51.6% for AGIs over 200k)
Taxable interest for individuals: $13,353 (reported on 60.1% of returns)
This zip code:
$13,353
New Jersey:
$2,193
(% of AGI for various income ranges: 4.1% for AGIs below $25k, 2.3% for AGIs $25k-50k, 2.5% for AGIs $50k-75k, 2.2% for AGIs $75k-100k, 1.4% for AGIs $100k-200k, 2.4% for AGIs over 200k)
Ordinary dividends: $32,549 (reported on 56.0% of returns)
Here:
$32,549
State:
$6,828
(% of AGI for various income ranges: 10.6% for AGIs below $25k, 7.0% for AGIs $25k-50k, 5.4% for AGIs $50k-75k, 5.0% for AGIs $75k-100k, 4.8% for AGIs $100k-200k, 5.3% for AGIs over 200k)
Net capital gain/loss in AGI: +$93,178 (reported on 51.6% of returns)
Here:
+$93,178
State:
+$15,358
(% of AGI for various income ranges: 1.5% for AGIs below $25k, 1.2% for AGIs $25k-50k, 2.1% for AGIs $50k-75k, 2.0% for AGIs $75k-100k, 2.6% for AGIs $100k-200k, 15.8% for AGIs over 200k)
Profit/loss from business: +$48,977 (reported on 20.2% of returns)
Here:
+$48,977
State:
+$19,577
(% of AGI for various income ranges: 9.6% for AGIs below $25k, 6.0% for AGIs $25k-50k, 6.5% for AGIs $50k-75k, 7.0% for AGIs $75k-100k, 5.5% for AGIs $100k-200k, 2.4% for AGIs over 200k)
Taxable individual retirement arrangement distribution: $49,756 (reported on 14.4% of returns)
07760:
$49,756
New Jersey:
$18,214
(% of AGI for various income ranges: 2.6% for AGIs below $25k, 3.6% for AGIs $25k-50k, 4.5% for AGIs $50k-75k, 4.8% for AGIs $75k-100k, 7.0% for AGIs $100k-200k, 1.6% for AGIs over 200k)
Self-employment retirement plans: $35,073 (reported on 3.4% of returns)
07760:
$35,073
New Jersey:
$24,511
Total itemized deductions: $98,786 (19% of AGI, reported on 63.1% of returns)
Here:
$98,786
State:
$30,827
Here:
18.9% of AGI
State:
21.2% of AGI
(% of AGI for various income ranges: 42.8% for AGIs below $25k, 28.6% for AGIs $25k-50k, 27.4% for AGIs $50k-75k, 27.9% for AGIs $75k-100k, 30.4% for AGIs $100k-200k, 16.6% for AGIs over 200k)
Charity contributions: $10,279 (reported on 56.7% of returns)
Here:
$10,279
State:
$3,451
(% of AGI for various income ranges: 1.3% for AGIs below $25k, 1.5% for AGIs $25k-50k, 1.8% for AGIs $50k-75k, 1.9% for AGIs $75k-100k, 1.8% for AGIs $100k-200k, 1.7% for AGIs over 200k)
Taxes paid: $57,686 (reported on 63.1% of returns)
07760:
$57,686
State:
$15,801
(% of AGI for various income ranges: 13.7% for AGIs below $25k, 10.4% for AGIs $25k-50k, 9.7% for AGIs $50k-75k, 11.0% for AGIs $75k-100k, 12.5% for AGIs $100k-200k, 10.5% for AGIs over 200k)
Earned income credit: $1,487 (reported on 3.4% of returns)
Here:
$1,487
State:
$2,182
(% of AGI for various income ranges: 1.7% for AGIs below $25k, 0.3% for AGIs $25k-50k)
Percentage of individuals using paid preparers for their 2012 taxes: 75.7%
Here:
76%
State:
65%
(% for various income ranges: 68.7% for AGIs below $25k, 69.2% for AGIs $25k-50k, 69.0% for AGIs $50k-75k, 75.0% for AGIs $75k-100k, 77.1% for AGIs $100k-200k, 86.4% for AGIs over 200k)
Averages for the 2004 tax year for zip code 07760, filed in 2005:
Average Adjusted Gross Income (AGI) in 2004: $266,381 (Individual Income Tax Returns)
Here:
$266,381
State:
$64,921
Salary/wage: $204,851 (reported on 73.6% of returns)
Here:
$204,851
State:
$57,755
(% of AGI for various income ranges: 58.3% for AGIs $10k-25k, 68.1% for AGIs $25k-50k, 59.7% for AGIs $50k-75k, 70.3% for AGIs $75k-100k, 55.6% for AGIs over 100k)
Taxable interest for individuals: $12,437 (reported on 68.5% of returns)
This zip code:
$12,437
New Jersey:
$2,068
(% of AGI for various income ranges: 5.2% for AGIs $10k-25k, 3.0% for AGIs $25k-50k, 3.7% for AGIs $50k-75k, 2.7% for AGIs $75k-100k, 3.1% for AGIs over 100k)
Taxable dividends: $15,493 (reported on 60.7% of returns)
Here:
$15,493
State:
$3,959
(% of AGI for various income ranges: 9.2% for AGIs $10k-25k, 4.4% for AGIs $25k-50k, 4.8% for AGIs $50k-75k, 3.9% for AGIs $75k-100k, 3.4% for AGIs over 100k)
Net capital gain/loss: +$67,172 (reported on 55.1% of returns)
Here:
+$67,172
State:
+$13,591
(% of AGI for various income ranges: 1.9% for AGIs $10k-25k, 1.5% for AGIs $25k-50k, 3.3% for AGIs $50k-75k, 3.2% for AGIs $75k-100k, 14.8% for AGIs over 100k)
Profit/loss from business: +$36,408 (reported on 19.0% of returns)
Here:
+$36,408
State:
+$17,520
(% of AGI for various income ranges: 8.0% for AGIs $10k-25k, 6.6% for AGIs $25k-50k, 7.3% for AGIs $50k-75k, 5.6% for AGIs $75k-100k, 2.3% for AGIs over 100k)
IRA payment deduction: $4,026 (reported on 3.3% of returns)
07760:
$4,026
New Jersey:
$3,270
(% of AGI for various income ranges: 0.3% for AGIs $25k-50k, 0.2% for AGIs $50k-75k, 0.3% for AGIs $75k-100k, 0.0% for AGIs over 100k)
Self-employed pension: $21,549 (reported on 4.4% of returns)
Here:
$21,549
New Jersey:
$17,258
(% of AGI for various income ranges: 0.8% for AGIs $10k-25k, 0.6% for AGIs $50k-75k, 0.3% for AGIs $75k-100k, 0.4% for AGIs over 100k)
Total itemized deductions: $64,867 (15% of AGI, reported on 60.0% of returns)
Here:
$64,867
State:
$23,924
Here:
15.0% of AGI
State:
21.1% of AGI
(% of AGI for various income ranges: 27.3% for AGIs $10k-25k, 21.0% for AGIs $25k-50k, 24.5% for AGIs $50k-75k, 24.4% for AGIs $75k-100k, 13.8% for AGIs over 100k)
Charity contributions deductions: $11,303 (3% of AGI, reported on 56.8% of returns)
Here:
$11,303
State:
$3,242
Here:
2.5% of AGI
State:
2.7% of AGI
(% of AGI for various income ranges: 2.0% for AGIs $10k-25k, 1.8% for AGIs $25k-50k, 2.6% for AGIs $50k-75k, 2.4% for AGIs $75k-100k, 2.4% for AGIs over 100k)
Total tax: $78,079 (reported on 81.7% of returns)
07760:
$78,079
State:
$12,321
(% of AGI for various income ranges: 5.5% for AGIs $10k-25k, 8.5% for AGIs $25k-50k, 10.3% for AGIs $50k-75k, 10.9% for AGIs $75k-100k, 25.0% for AGIs over 100k)
Earned income credit: $962 (reported on 2.8% of returns)
Here:
$962
State:
$1,711
Percentage of individuals using paid preparers for their 2004 taxes: 74.8%
Here:
75%
State:
65%
(% for various income ranges: 73.5% for AGIs below $10k, 66.1% for AGIs $10k-25k, 62.5% for AGIs $25k-50k, 73.5% for AGIs $50k-75k, 72.7% for AGIs $75k-100k, 83.0% for AGIs over 100k)
Household received Food Stamps/SNAP in the past 12 months: 94 Household did not receive Food Stamps/SNAP in the past 12 months: 3,425
Women who had a birth in the past 12 months: 23 (24 now married, 0 unmarried) Women who did not have a birth in the past 12 months: 1,740 (812 now married, 925 unmarried)
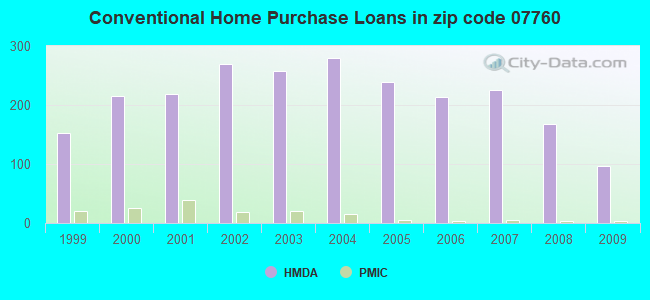
Housing units in zip code 07760 with a mortgage: 1,866 (258 second mortgage, 5 home equity loan, 231 both second mortgage and home equity loan) Houses without a mortgage: 19
Median monthly owner costs for units with a mortgage: $3,744 Median monthly owner costs for units without a mortgage: $1,425
Residents with income below the poverty level in 2022:
This zip code:
4.3%
Whole state:
9.7%
Residents with income below 50% of the poverty level in 2022:
This zip code:
1.9%
Whole state:
5.2%
Median number of rooms in houses and condos:
Here:
10.0
State:
6.8
Median number of rooms in apartments:
Here:
4.5
State:
3.9
Notable locations in this zip code not listed on our city pages
Notable locations in zip code 07760: Sea Bright First Aid Squad (A), Rumson Volunteer Fire Department Oceanic Hook and Ladder Company 1 (B), Rumson First Aid Squad (C), Rumson Volunteer Fire Department Rumson Fire Company 42 - 2 (D), Sea Bright Borough Fire Department (E). Display/hide their locations on the map
Churches in zip code 07760 include: Holy Cross Church (A), Saint George's By The River Church (B), Sea Bright United Methodist Church (C). Display/hide their locations on the map
In group quarters: 15 (-1 institutionalized population)
Size of family households: 943 2-persons, 480 3-persons, 691 4-persons, 299 5-persons, 29 6-persons, 11 7-or-more-persons
Size of nonfamily households: 660 1-person, 432 2-persons, 16 3-persons
1,945 married couples with children.
233 single-parent households (29 men, 204 women).
92.7% of residents of 07760 zip code speak English at home.
2.9% of residents speak Spanish at home (73% very well, 22% well, 5% not well).
2.3% of residents speak other Indo-European language at home (98% very well, 2% not well).
0.7% of residents speak Asian or Pacific Island language at home (82% very well, 18% not well).
1.0% of residents speak other language at home (100% very well).
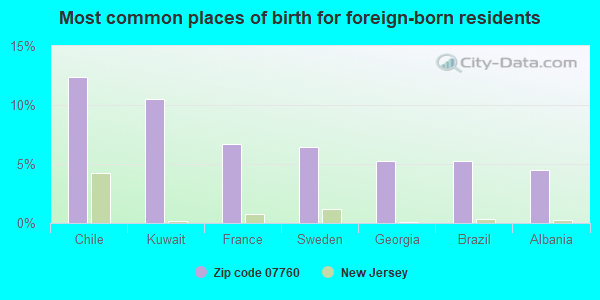
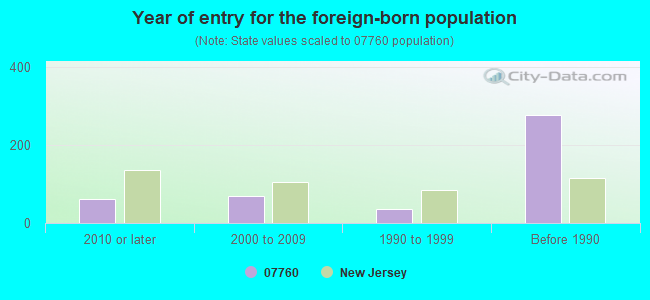
Foreign born population: 422 (4.4%) (83.5% of them are naturalized citizens)
This zip code:
4.4%
Whole state:
23.5%
12%Chile
10%Kuwait
7%France
6%Sweden
5%Georgia
5%Brazil
5%Albania
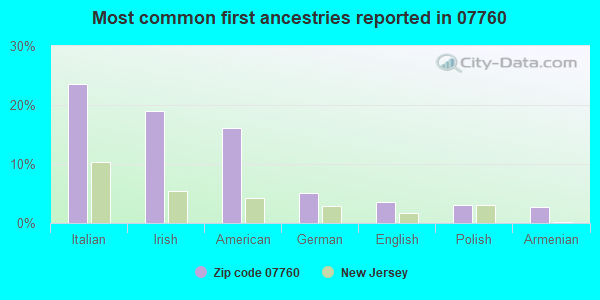
24%Italian
19%Irish
16%American
5%German
4%English
3%Polish
3%Armenian
Year of entry for the foreign-born population
612010 or later
682000 to 2009
361990 to 1999
277Before 1990
Facilities with environmental interests located in this zip code:
NAVESINK MARINA (1410 OCEAN AVE in SEA BRIGHT, NJ)
STATE MASTER (New Jersey environmental info) - NJEMS-012420, STATE CLEANUP SITE, NJEMS-1343-04-0008.1, LAND USE - COASTAL AND LAND USE, NJEMS-1343-04-0008.2, NJEMS-48255, National Pollutant Discharge Elimination System Permit, NJEMS-A2033, AIR PROGRAM, NJEMS-NJ0000003285, HAZARDOUS WASTE PROGRAM National Pollutant Discharge Elimination System NON-MAJOR (Tracking pollutant discharge elimination systems) - permit (Resource Conservation and Recovery Act (tracking hazardous waste)) Business SIC classification: GASOLINE SERVICE STATIONS Organizations: NAVESINK PARTNERS LP, NAVESINK PARTNERS LLC D/B/A NAVESINK MARINA, NAVESINK PARTNERS LP (CONTACT/OWNER)
Alternative names: NAVESINK YACHT SALES & MARINA
OCEANIC MARINA (8 WASHINGTON ST in RUMSON, NJ)
STATE MASTER (New Jersey environmental info) - NJEMS-002523, STATE CLEANUP SITE, NJEMS-1342-05-0005.1, LAND USE - COASTAL AND LAND USE, NJEMS-48327, National Pollutant Discharge Elimination System Permit, NJEMS-NJS000135640, HAZARDOUS WASTE PROGRAM National Pollutant Discharge Elimination System NON-MAJOR (Tracking pollutant discharge elimination systems) - permit Organizations: PAWLIKOWSKI PETER, NOVAL MARINE INC, LYNNE COPPOLETTA PRESIDENT (CONTACT/OWNER)
EXXON SERVICE STATION #30902 (27 WEST RIVER ROAD in RUMSON, NJ)
STATE MASTER (New Jersey environmental info) - NJEMS-007963, STATE CLEANUP SITE, NJEMS-54722700000, EPCRA, NJEMS-A2161, AIR PROGRAM (Resource Conservation and Recovery Act (tracking hazardous waste)) Business SIC classification: GASOLINE SERVICE STATIONS Organizations: EXXON MOBIL CORP, EXXON CO USA (CONTACT/OPERATOR)
, EXXON MOBIL CORP USA (CONTACT/OWNER)
Alternative names: EXXON CO USA 30902
ANGLERS MARINA (1300 OCEAN AVE in SEA BRIGHT, NJ)
STATE MASTER (New Jersey environmental info) - NJEMS-54776, National Pollutant Discharge Elimination System Permit, NJEMS-NRG100000322, HAZARDOUS WASTE PROGRAM National Pollutant Discharge Elimination System NON-MAJOR (Tracking pollutant discharge elimination systems) - permit Business SIC classification: MARINAS Organizations: LEONARDIS FRED (CONTACT/OWNER)
ONCE REMOVED INC (1 CHURCH ST in RUMSON, NJ)
STATE MASTER (New Jersey environmental info) - NJEMS-229695, STATE CLEANUP SITE, NJEMS-NJD063159966, HAZARDOUS WASTE PROGRAM Small Quantity Generators, between 100 kg and 1000 kg of hazardous waste/month (Resource Conservation and Recovery Act (tracking hazardous waste))
FORRESTDALE (FORREST AVENUE in RUMSON, NJ)
(National Center for Education Statistics) - STATE ID-050 Organizations: RUMSON BORO (SCHOOL DISTRICT)
ATLANTIC OCEAN (40.37605, 73.8858; LOCUST, NJ in LOCUST, NJ)
(Resource Conservation and Recovery Act (tracking hazardous waste)) Organizations: STATE OF NEW JERSEY (CONTACT/OWNER)
HENDERSON PETER JR (13 FAIR HAVEN RD in RUMSON, NJ)
(Resource Conservation and Recovery Act (tracking hazardous waste))
FORSTER TOWING (11 S CHERRY LANE in RUMSON, NJ)
TRANSPORTER (Resource Conservation and Recovery Act (tracking hazardous waste)) - notification Organizations: BOBOWICZ CHARLES (CONTACT/OWNER)
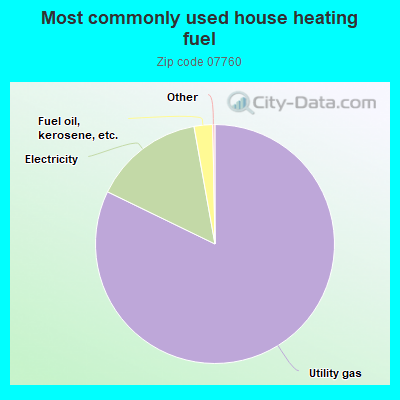
82.2%Utility gas
15.0%Electricity
2.5%Fuel oil, kerosene, etc.
Population in 1990: 9,700.
Place of birth for U.S.-born residents:
This state: 4,976
Northeast: 3,120
Midwest: 373
South: 456
West: 257
61% of the 07760 zip code residents lived in the same house 5 years ago. Out of people who lived in different houses, 63% lived in this county. Out of people who lived in different counties, 50% lived in New Jersey.
91% of the 07760 zip code residents lived in the same house 1 year ago. Out of people who lived in different houses, 73% moved from this county. Out of people who lived in different houses, 6% moved from different county within same state. Out of people who lived in different houses, 17% moved from different state.
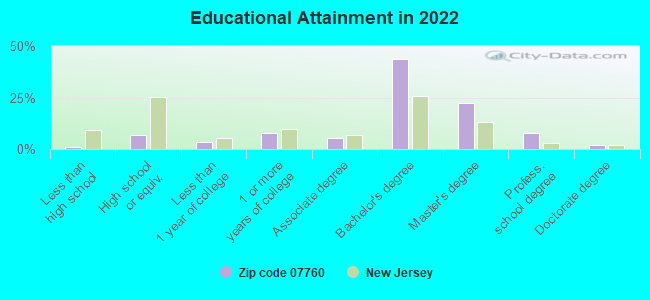
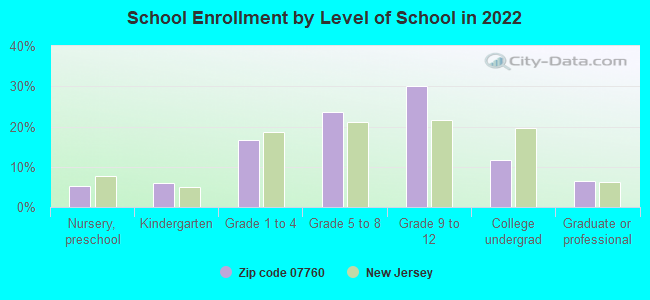
Private vs. public school enrollment:
Students in private schools in grades 1 to 8 (elementary and middle school): 329
Here:
29.7%
New Jersey:
12.3%
Students in private schools in grades 9 to 12 (high school): 190
Here:
23.2%
New Jersey:
13.1%
Students in private undergraduate colleges: 159
Here:
49.8%
New Jersey:
33.2%
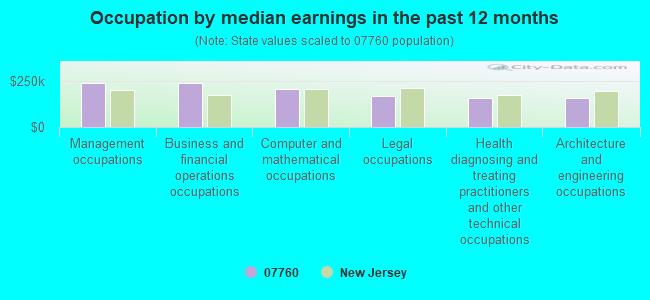
Occupation by median earnings in the past 12 months ($)
239,838Management occupations
237,691Business and financial operations occupations
206,396Computer and mathematical occupations
167,621Legal occupations
160,285Health diagnosing and treating practitioners and other technical occupations
158,344Architecture and engineering occupations
Companies with federal contracts located in this zip code:
EXPLOSIVE ORDINANCE TECHNOLOGI (185 RUMSON RD in RUMSON, NJ; small business) : $3,725,434 in 32 contractsfrom 2001 to 2006
Contracts for Engineering and Technical Services, Technical Representation Services -- Ammunition and Explosives, Other Professional Services, Development of Environmental Impact Statements and Assessments, and moreby Army Signed by year:2000: $0; 2001: $6,000; 2002: $272,956; 2003: $127,649; 2004: $174,070; 2005: $1,928,260; 2006: $1,216,499.
Biggest contracts:
$956,332 with Army for Engineering and Technical Services. Taking place in AL. Signed on 2006-01-27. Completion date: 2006-04-17.
$566,758, same as above.Signed on 2005-09-15. Completion date: 2006-01-31.
$566,359, same as above.Signed on 2005-04-07. Completion date: 2005-12-31.
$445,433, same as above.Signed on 2005-04-26. Completion date: 2005-12-31.
MONMOUTH AREA OFFICIALS ASSOC (11 WOODS END ROAD in RUMSON, NJ) : $171,863 in 45 contractsfrom 2001 to 2006
Contracts for Recreational Services, Athletic and Sporting Equipment, Gas Services, Chaplain Services by Army Signed by year:2000: $0; 2001: $42,630; 2002: $41,806; 2003: $39,070; 2004: $54,295; 2005: -$6,880; 2006: $942.
Biggest contracts:
$29,884 with Army for Recreational Services. Signed on 2004-12-01. Completion date: 2005-11-30.
$29,866, same as above.Signed on 2003-12-01. Completion date: 2004-11-30.
$17,500 with Army for Athletic and Sporting Equipment. Signed on 2002-12-10. Completion date: 2003-09-30.
$14,735, same as above.Signed on 2002-12-16. Completion date: 2003-09-30.
COMMERCIUM TECHNOLOGY INC (148 AVENUE OF TWO RIVERS in RUMSON, NJ; small business) : $132,377 in 12 contractsfrom 2001 to 2004
Contracts for ADP Input/Output and Storage Devices, ADP System Acquisition Support Services. Includes preparation of statement of work, benchmarks, specifications, etc., ADP Software, ADP Support Equipment by Federal Technology Service, Army Signed by year:2000: $0; 2001: $12,213; 2002: $71,121; 2003: $28,235; 2004: $20,808; 2005: $0; 2006: $0.
Biggest contracts:
$29,000 with Federal Technology Service for ADP Input/Output and Storage Devices. Signed on 2002-01-15. Completion date: 2002-02-15.
$24,735 with Army for ADP System Acquisition Support Services. Includes preparation of statement of work, benchmarks, specifications, etc.. Signed on 2003-09-08. Completion date: 2004-09-24.
$24,000, same as above.Signed on 2002-09-12. Completion date: 2003-09-13.
$14,000, same as above.Signed on 2002-11-21. Completion date: 2003-09-30.
DEACON JIM KELLY (146 E RIVER ROAD in RUMSON, NJ; small business) : $25,670 in 7 contractsfrom 1999 to 2002
Contracts for Other Social Services, Chaplain Services by Army Signed by year:2000: $0; 2001: $0; 2002: -$1,163; 2003: $0; 2004: $0; 2005: $0; 2006: $0.
Biggest contracts:
$38,883 with Army for Other Social Services. Signed on 2001-10-15. Completion date: 2002-09-30.
$26,833 with Army for Chaplain Services. Signed on 1999-12-30. Completion date: 2000-09-30.
$0 with Army for Other Social Services. Signed on 2001-10-15. Completion date: 2002-09-30.
$0, same as above.Signed on 2002-05-16. Completion date: 1998-09-30.
INDUSTRIAL MARINE FABRICATORS (15 SOUTH ST in SEA BRIGHT, NJ; small business)
$3,479 with Army for Maintenance, Repair or Alteration of Real Property -- Office Buildings. Signed on 2004-06-14. Completion date: 2004-07-30.
Top industries in this zip code by the number of employees in 2005:
2004 - 2018 National Fire Incident Reporting System (NFIRS) incidents
Based on the data from the years 2004 - 2018 the average number of fires per year is 45. The highest number of fires - 84 took place in 2007, and the least - 16 in 2005. The data has an increasing trend.
When looking into fire subcategories, the most reports belonged to: Structure Fires (60.2%), and Outside Fires (30.9%).
Fire incident types reported to NFIRS in Zip Code 07760


 Nearest zip codes: 07704, 07750, 07716, 07739, 07757, 07732.


 Based on the data from the years 2004 - 2018 the average number of fires per year is 45. The highest number of fires - 84 took place in 2007, and the least - 16 in 2005. The data has an increasing trend.
 When looking into fire subcategories, the most reports belonged to: Structure Fires (60.2%), and Outside Fires (30.9%).