Estimated zip code population in 2022: 29,277 Zip code population in 2010: 28,615 Zip code population in 2000: 32,482
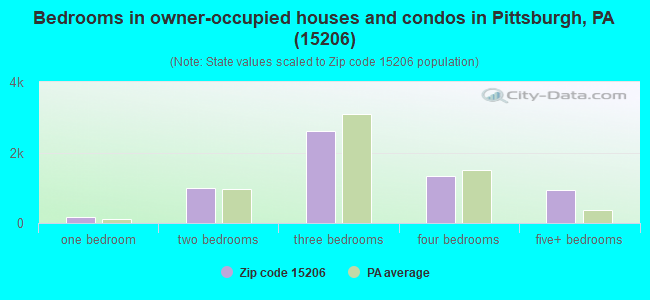
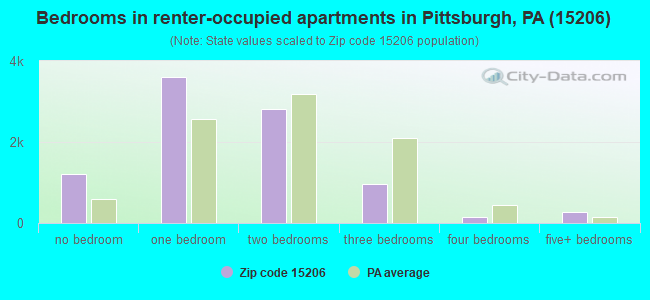
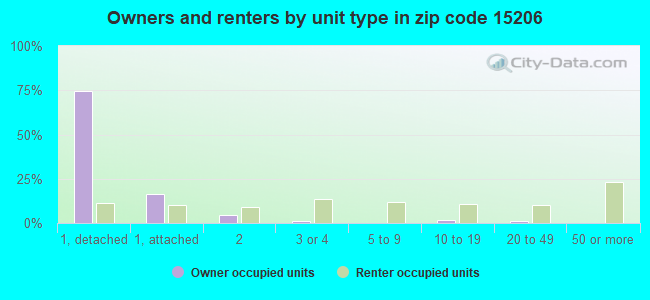
Houses and condos: 16,987 Renter-occupied apartments: 8,866
% of renters here:
60%
State:
31%
March 2022 cost of living index in zip code 15206: 96.5 (near average, U.S. average is 100)
Land area: 4.8 sq. mi. Water area: 0.3 sq. mi.
Population density: 6,130 people per square mile
(high).
OSM Map
General Map
Google Map
MSN Map
OSM Map
General Map
Google Map
MSN Map
OSM Map
General Map
Google Map
MSN Map
OSM Map
General Map
Google Map
MSN Map
Please wait while loading the map...
Real estate property taxes paid for housing units in 2022:
This zip code:
0.9% ($2,622)
Pennsylvania:
1.3% ($3,094)
Median real estate property taxes paid for housing units with mortgages in 2022: $2,983 (0.9%) Median real estate property taxes paid for housing units with no mortgage in 2022: $2,281 (0.9%)
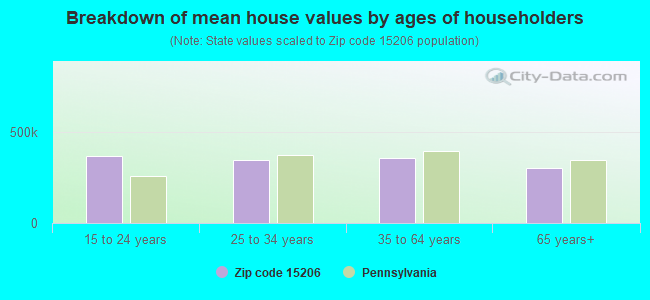
Estimated median house/condo value in 2022: $305,518
15206:
$305,518
Pennsylvania:
$245,500
According to our research of Pennsylvania and other state lists, there were 35 registered sex offenders living in 15206 zip code as of April 26, 2024. The ratio of all residents to sex offenders in zip code 15206 is 839 to 1. The ratio of registered sex offenders to all residents in this zip code is lower than the state average.
Median resident age:
This zip code:
35.7 years
Pennsylvania median age:
40.9 years
Average household size:
This zip code:
1.9 people
Pennsylvania:
2.4 people
Averages for the 2020 tax year for zip code 15206, filed in 2021:
Average Adjusted Gross Income (AGI) in 2020: $75,640 (Individual Income Tax Returns)
Here:
$75,640
State:
$75,707
Salary/wage: $66,855 (reported on 84.9% of returns)
Here:
$66,855
State:
$62,806
(% of AGI for various income ranges: 1090.9% for AGIs below $25k, 3585.7% for AGIs $25k-50k, 6775.6% for AGIs $50k-75k, 10673.4% for AGIs $75k-100k, 19989.6% for AGIs $100k-200k, 87701.8% for AGIs over 200k)
Taxable interest for individuals: $1,162 (reported on 29.3% of returns)
This zip code:
$1,162
Pennsylvania:
$1,633
(% of AGI for various income ranges: 10.6% for AGIs below $25k, 10.2% for AGIs $25k-50k, 26.5% for AGIs $50k-75k, 45.1% for AGIs $75k-100k, 90.1% for AGIs $100k-200k, 793.2% for AGIs over 200k)
Ordinary dividends: $7,011 (reported on 23.3% of returns)
Here:
$7,011
State:
$7,382
(% of AGI for various income ranges: 24.7% for AGIs below $25k, 25.2% for AGIs $25k-50k, 111.9% for AGIs $50k-75k, 210.1% for AGIs $75k-100k, 453.4% for AGIs $100k-200k, 4320.0% for AGIs over 200k)
Net capital gain/loss in AGI: +$14,152 (reported on 20.5% of returns)
Here:
+$14,152
State:
+$23,522
(% of AGI for various income ranges: 13.9% for AGIs below $25k, 26.4% for AGIs $25k-50k, 86.9% for AGIs $50k-75k, 290.4% for AGIs $75k-100k, 772.8% for AGIs $100k-200k, 8908.2% for AGIs over 200k)
Profit/loss from business: +$14,800 (reported on 14.7% of returns)
Here:
+$14,800
State:
+$16,274
(% of AGI for various income ranges: 94.8% for AGIs below $25k, 78.6% for AGIs $25k-50k, 168.1% for AGIs $50k-75k, 339.3% for AGIs $75k-100k, 745.0% for AGIs $100k-200k, 4114.4% for AGIs over 200k)
Taxable individual retirement arrangement distribution: $22,429 (reported on 6.2% of returns)
15206:
$22,429
Pennsylvania:
$18,583
(% of AGI for various income ranges: 39.8% for AGIs below $25k, 48.2% for AGIs $25k-50k, 111.8% for AGIs $50k-75k, 289.7% for AGIs $75k-100k, 551.0% for AGIs $100k-200k, 2455.3% for AGIs over 200k)
Self-employed (Keogh) retirement plans: $25,118 (reported on 0.8% of returns)
15206:
$25,118
Pennsylvania:
$25,407
(% of AGI for various income ranges: 56.1% for AGIs $100k-200k, 657.6% for AGIs over 200k)
Total itemized deductions: $31,327 (reported on 6.8% of returns)
Here:
$31,327
State:
$34,850
(% of AGI for various income ranges: 27.6% for AGIs below $25k, 42.1% for AGIs $25k-50k, 103.8% for AGIs $50k-75k, 359.3% for AGIs $75k-100k, 902.4% for AGIs $100k-200k, 4757.1% for AGIs over 200k)
Charity contributions: $12,449 (reported on 5.5% of returns)
Here:
$12,449
State:
$12,392
(% of AGI for various income ranges: 2.9% for AGIs below $25k, 5.9% for AGIs $25k-50k, 25.3% for AGIs $50k-75k, 63.1% for AGIs $75k-100k, 218.5% for AGIs $100k-200k, 1980.3% for AGIs over 200k)
Taxes paid: $8,397 (reported on 6.8% of returns)
15206:
$8,397
State:
$8,200
(% of AGI for various income ranges: 5.6% for AGIs below $25k, 8.3% for AGIs $25k-50k, 29.8% for AGIs $50k-75k, 114.7% for AGIs $75k-100k, 293.5% for AGIs $100k-200k, 1129.7% for AGIs over 200k)
Earned income credit: $1,881 (reported on 13.6% of returns)
Here:
$1,881
State:
$2,100
(% of AGI for various income ranges: 71.5% for AGIs below $25k, 42.0% for AGIs $25k-50k)
Percentage of individuals using paid preparers for their 2020 taxes: 92.2%
Here:
92%
State:
92%
(% for various income ranges: 91.4% for AGIs below $25k, 93.1% for AGIs $25k-50k, 92.2% for AGIs $50k-75k, 91.3% for AGIs $75k-100k, 91.3% for AGIs $100k-200k, 94.3% for AGIs over 200k)
Averages for the 2012 tax year for zip code 15206, filed in 2013:
Average Adjusted Gross Income (AGI) in 2012: $51,267 (Individual Income Tax Returns)
Here:
$51,267
State:
$61,346
Salary/wage: $45,285 (reported on 86.0% of returns)
Here:
$45,285
State:
$51,902
(% of AGI for various income ranges: 79.0% for AGIs below $25k, 85.1% for AGIs $25k-50k, 80.0% for AGIs $50k-75k, 79.7% for AGIs $75k-100k, 77.9% for AGIs $100k-200k, 63.1% for AGIs over 200k)
Taxable interest for individuals: $1,082 (reported on 27.6% of returns)
This zip code:
$1,082
Pennsylvania:
$1,588
(% of AGI for various income ranges: 0.7% for AGIs below $25k, 0.4% for AGIs $25k-50k, 0.6% for AGIs $50k-75k, 0.6% for AGIs $75k-100k, 0.5% for AGIs $100k-200k, 0.8% for AGIs over 200k)
Ordinary dividends: $5,614 (reported on 18.5% of returns)
Here:
$5,614
State:
$5,827
(% of AGI for various income ranges: 1.0% for AGIs below $25k, 0.8% for AGIs $25k-50k, 1.5% for AGIs $50k-75k, 2.1% for AGIs $75k-100k, 2.3% for AGIs $100k-200k, 3.4% for AGIs over 200k)
Net capital gain/loss in AGI: +$12,249 (reported on 13.3% of returns)
Here:
+$12,249
State:
+$14,495
(% of AGI for various income ranges: 0.1% for AGIs below $25k, 0.3% for AGIs $25k-50k, 0.5% for AGIs $50k-75k, 0.9% for AGIs $75k-100k, 1.4% for AGIs $100k-200k, 10.1% for AGIs over 200k)
Profit/loss from business: +$13,068 (reported on 13.0% of returns)
Here:
+$13,068
State:
+$16,268
(% of AGI for various income ranges: 4.9% for AGIs below $25k, 2.3% for AGIs $25k-50k, 2.6% for AGIs $50k-75k, 2.5% for AGIs $75k-100k, 3.6% for AGIs $100k-200k, 3.8% for AGIs over 200k)
Taxable individual retirement arrangement distribution: $15,147 (reported on 7.4% of returns)
15206:
$15,147
Pennsylvania:
$14,550
(% of AGI for various income ranges: 1.8% for AGIs below $25k, 1.4% for AGIs $25k-50k, 2.6% for AGIs $50k-75k, 2.7% for AGIs $75k-100k, 3.2% for AGIs $100k-200k, 1.7% for AGIs over 200k)
Self-employment retirement plans: $19,400 (reported on 0.6% of returns)
15206:
$19,400
Pennsylvania:
$20,922
(% of AGI for various income ranges: 0.2% for AGIs $25k-50k, 0.2% for AGIs $100k-200k, 0.6% for AGIs over 200k)
Total itemized deductions: $21,985 (17% of AGI, reported on 21.7% of returns)
Here:
$21,985
State:
$23,538
Here:
16.6% of AGI
State:
18.4% of AGI
(% of AGI for various income ranges: 4.1% for AGIs below $25k, 4.2% for AGIs $25k-50k, 8.7% for AGIs $50k-75k, 11.1% for AGIs $75k-100k, 12.9% for AGIs $100k-200k, 12.1% for AGIs over 200k)
Charity contributions: $4,138 (reported on 17.9% of returns)
Here:
$4,138
State:
$4,025
(% of AGI for various income ranges: 0.3% for AGIs below $25k, 0.6% for AGIs $25k-50k, 1.4% for AGIs $50k-75k, 1.7% for AGIs $75k-100k, 1.9% for AGIs $100k-200k, 2.1% for AGIs over 200k)
Taxes paid: $10,830 (reported on 21.4% of returns)
15206:
$10,830
State:
$9,982
(% of AGI for various income ranges: 0.7% for AGIs below $25k, 1.4% for AGIs $25k-50k, 3.4% for AGIs $50k-75k, 5.1% for AGIs $75k-100k, 6.8% for AGIs $100k-200k, 7.0% for AGIs over 200k)
Earned income credit: $1,994 (reported on 20.0% of returns)
Here:
$1,994
State:
$2,106
(% of AGI for various income ranges: 5.9% for AGIs below $25k, 0.8% for AGIs $25k-50k)
Percentage of individuals using paid preparers for their 2012 taxes: 40.0%
Here:
40%
State:
53%
(% for various income ranges: 37.0% for AGIs below $25k, 34.7% for AGIs $25k-50k, 43.1% for AGIs $50k-75k, 44.6% for AGIs $75k-100k, 54.6% for AGIs $100k-200k, 71.7% for AGIs over 200k)
Averages for the 2004 tax year for zip code 15206, filed in 2005:
Average Adjusted Gross Income (AGI) in 2004: $39,288 (Individual Income Tax Returns)
Here:
$39,288
State:
$48,049
Salary/wage: $34,522 (reported on 85.2% of returns)
Here:
$34,522
State:
$42,646
(% of AGI for various income ranges: 136.0% for AGIs below $10k, 81.5% for AGIs $10k-25k, 84.0% for AGIs $25k-50k, 79.9% for AGIs $50k-75k, 79.6% for AGIs $75k-100k, 60.5% for AGIs over 100k)
Taxable interest for individuals: $1,905 (reported on 35.2% of returns)
This zip code:
$1,905
Pennsylvania:
$1,657
(% of AGI for various income ranges: 6.9% for AGIs below $10k, 1.6% for AGIs $10k-25k, 1.3% for AGIs $25k-50k, 1.4% for AGIs $50k-75k, 1.2% for AGIs $75k-100k, 2.0% for AGIs over 100k)
Taxable dividends: $4,568 (reported on 20.5% of returns)
Here:
$4,568
State:
$3,566
(% of AGI for various income ranges: 6.6% for AGIs below $10k, 1.1% for AGIs $10k-25k, 1.2% for AGIs $25k-50k, 1.8% for AGIs $50k-75k, 2.5% for AGIs $75k-100k, 3.6% for AGIs over 100k)
Net capital gain/loss: +$8,252 (reported on 15.1% of returns)
Here:
+$8,252
State:
+$9,716
(% of AGI for various income ranges: -1.1% for AGIs below $10k, 0.1% for AGIs $10k-25k, 0.3% for AGIs $25k-50k, 0.5% for AGIs $50k-75k, 1.2% for AGIs $75k-100k, 7.9% for AGIs over 100k)
Profit/loss from business: +$12,228 (reported on 11.5% of returns)
Here:
+$12,228
State:
+$14,267
(% of AGI for various income ranges: 2.4% for AGIs below $10k, 2.3% for AGIs $10k-25k, 2.1% for AGIs $25k-50k, 2.7% for AGIs $50k-75k, 4.0% for AGIs $75k-100k, 5.2% for AGIs over 100k)
IRA payment deduction: $2,366 (reported on 2.2% of returns)
15206:
$2,366
Pennsylvania:
$2,903
(% of AGI for various income ranges: 0.3% for AGIs below $10k, 0.2% for AGIs $10k-25k, 0.2% for AGIs $25k-50k, 0.1% for AGIs $50k-75k, 0.2% for AGIs $75k-100k, 0.1% for AGIs over 100k)
Self-employed pension: $14,026 (reported on 0.9% of returns)
Here:
$14,026
Pennsylvania:
$14,674
(% of AGI for various income ranges: 0.1% for AGIs $25k-50k, 0.2% for AGIs $50k-75k, 0.3% for AGIs $75k-100k, 0.6% for AGIs over 100k)
Total itemized deductions: $20,272 (22% of AGI, reported on 24.0% of returns)
Here:
$20,272
State:
$18,804
Here:
21.7% of AGI
State:
19.5% of AGI
(% of AGI for various income ranges: 9.7% for AGIs below $10k, 4.4% for AGIs $10k-25k, 7.8% for AGIs $25k-50k, 11.5% for AGIs $50k-75k, 15.0% for AGIs $75k-100k, 17.9% for AGIs over 100k)
Charity contributions deductions: $3,784 (4% of AGI, reported on 20.9% of returns)
Here:
$3,784
State:
$3,337
Here:
4.0% of AGI
State:
3.3% of AGI
(% of AGI for various income ranges: 0.8% for AGIs below $10k, 0.6% for AGIs $10k-25k, 1.2% for AGIs $25k-50k, 2.0% for AGIs $50k-75k, 2.3% for AGIs $75k-100k, 3.0% for AGIs over 100k)
Total tax: $6,828 (reported on 69.6% of returns)
15206:
$6,828
State:
$8,008
(% of AGI for various income ranges: 2.9% for AGIs below $10k, 3.9% for AGIs $10k-25k, 7.7% for AGIs $25k-50k, 11.2% for AGIs $50k-75k, 12.3% for AGIs $75k-100k, 18.6% for AGIs over 100k)
Earned income credit: $1,697 (reported on 22.3% of returns)
Here:
$1,697
State:
$1,643
Percentage of individuals using paid preparers for their 2004 taxes: 51.1%
Here:
51%
State:
56%
(% for various income ranges: 48.1% for AGIs below $10k, 53.6% for AGIs $10k-25k, 48.3% for AGIs $25k-50k, 51.4% for AGIs $50k-75k, 48.6% for AGIs $75k-100k, 62.9% for AGIs over 100k)
Likely homosexual households (counted as self-reported same-sex unmarried-partner households)
Lesbian couples: 0.2% of all households
Gay men: 0.2% of all households
Household received Food Stamps/SNAP in the past 12 months: 2,294 Household did not receive Food Stamps/SNAP in the past 12 months: 12,597
Women who had a birth in the past 12 months: 271 (230 now married, 47 unmarried) Women who did not have a birth in the past 12 months: 7,653 (2,329 now married, 5,349 unmarried)
Housing units in zip code 15206 with a mortgage: 3,390 (377 second mortgage, 13 home equity loan, 309 both second mortgage and home equity loan) Houses without a mortgage: 392
Median monthly owner costs for units with a mortgage: $1,539 Median monthly owner costs for units without a mortgage: $603
Residents with income below the poverty level in 2022:
This zip code:
13.5%
Whole state:
11.8%
Residents with income below 50% of the poverty level in 2022:
This zip code:
7.4%
Whole state:
6.1%
Median number of rooms in houses and condos:
Here:
6.9
State:
6.8
Median number of rooms in apartments:
Here:
3.6
State:
4.3
Notable locations in this zip code not listed on our city pages
Notable locations in zip code 15206: Roup Station (A), King Museum (B), Abraxas Center For Adolescent Females (C), Coalition for Christian Outreach (D), Craig Academy Library (E), DePaul School for Hearing and Speech Library (F), Dilworth Traditional Academy Library (G), Eastminster Child Care Center (H), Ellis School Library (I), Family Resources Therapy and Counseling Center (J), Pittsburgh Bureau of Fire Station 15 (K), For Kids Only Day Care Center (L), Friendship Elementary School Library (M), Fulton Academy of Science Library (N), Lemington Center Interegional Day Care Center (O), Lemington Elementary School Library (P), Lincoln Elementary School Library (Q), Lisa Moores Child Development Center (R), Carnegie Mellon University Computer Science Education (S), Morningside Elementary School Library (T). Display/hide their locations on the map
Churches in zip code 15206 include: Triumph Church and Kingdom of God (A), Salvation Army (B), Saint James African Methodist Episcopal Church (C), Pentecostal Temple Church of God in Christ (D), New Jerusalem Holiness Church (E), New Day Ministries of Pittsburgh (F), Nabhi Christian Ministries (G), Mount Ararat Baptist Church (H), Missionary Temple Church of God in Christ (I). Display/hide their locations on the map
2,358 married couples with children.
1,578 single-parent households (176 men, 1,402 women).
86.4% of residents of 15206 zip code speak English at home.
3.5% of residents speak Spanish at home (73% very well, 21% well, 6% not well).
4.8% of residents speak other Indo-European language at home (85% very well, 9% well, 6% not well).
4.0% of residents speak Asian or Pacific Island language at home (51% very well, 35% well, 12% not well, 2% not at all).
0.9% of residents speak other language at home (87% very well, 13% well).
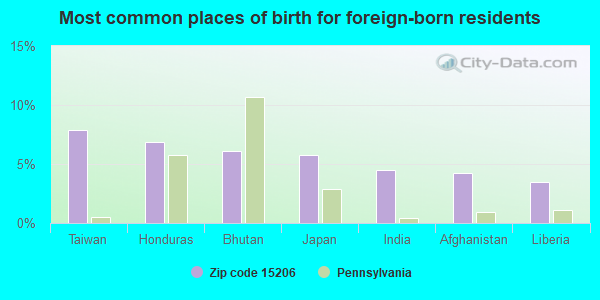
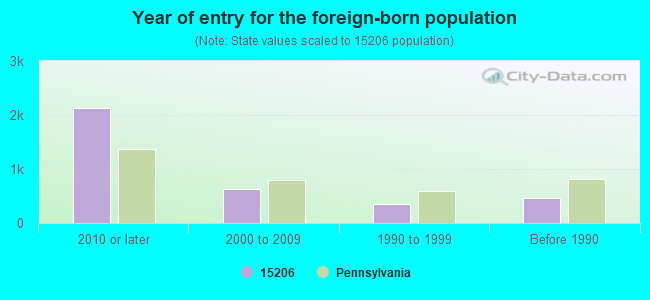
Foreign born population: 3,026 (10.3%) (36.8% of them are naturalized citizens)
Major facilities with environmental interests located in this zip code:
BAUM BLVD DODGE (5625 BAUM BLVD in PITTSBURGH, PA)
AIR MINOR (AIRS/AFS) STATE MASTER (Pennsylvania database) - RCRIS-PAD051136505, HAZARDOUS WASTE PROGRAM Small Quantity Generators, between 100 kg and 1000 kg of hazardous waste/month (Resource Conservation and Recovery Act (tracking hazardous waste)) - notification Business SIC classification: GASOLINE SERVICE STATIONS Organizations: OPERNAME (CONTACT/OPERATOR)
, UTLEY, MARK (CONTACT/OWNER)
Alternative names: BAUM BOULEVARD DODGE, INC
BETHLEHEM TEMPLE CHRISTIAN ACADEMY (401-405 PAULSON AVENUE in PITTSBURGH, PA)
(Integrated Compliance Information System) - ICIS-03-1990-0484, FORMAL ENFORCEMENT ACTION, ICIS-03-1989-0880, COMPLIANCE ACTIVITY (Tracking inspections of insecticide, fungicide, and rodenticide, and toxic substances) Alternative names: BETHLEHEM TEMPLE SCHOOL, BETHLEM TEMPLE CHRISTIAN ACADEMY
AC ACLD REMEDIAL LEARNING CTR (325 N HIGHLAND AVE in PITTSBURGH, PA)
(Integrated Compliance Information System) - ICIS-03-1989-0858, FORMAL ENFORCEMENT ACTION COMPLIANCE ACTIVITY (Tracking inspections of insecticide, fungicide, and rodenticide, and toxic substances)
AMOCO 366 (200 LARIMER AVE in PITTSBURGH, PA)
AIR MINOR (AIRS/AFS) Small Quantity Generators, between 100 kg and 1000 kg of hazardous waste/month (Resource Conservation and Recovery Act (tracking hazardous waste)) - notification Small Quantity Generators, between 100 kg and 1000 kg of hazardous waste/month (Resource Conservation and Recovery Act (tracking hazardous waste)) - notification Business SIC classification: GASOLINE SERVICE STATIONS Organizations: AMOCO OIL COMPANY (CONTACT/OWNER)
, AMOCO OIL CO (CONTACT/OWNER)
Alternative names: AMOCO 366 TANKS, MAUROS'S AMOCO
ANGELUS CONVALESCENT CENTER# (200 AMBER ST in PITTSBURGH, PA)
AAMCO TRANSMISSIONS (5748 BAUM BOULEVARD in PITTSBURGH, PA)
Small Quantity Generators, between 100 kg and 1000 kg of hazardous waste/month (Resource Conservation and Recovery Act (tracking hazardous waste)) - notification Business NAICS classification: AUTOMOTIVE TRANSMISSION REPAIR. Organizations: OPERNAME (CONTACT/OPERATOR)
, WEINBERG, LARRY (CONTACT/OWNER)
ACME WINDOW SHADE & VENETIAN BLIND CO. (6629 HAMILTON AVENUE in PITTSBURGH, PA)
AIR MINOR (AIRS/AFS) Business SIC classification: MILLWORK
ANITA KIMBALL CLEANERS (1412 LINCOLN AVENUE in PITTSBURGH, PA)
AIR MINOR (AIRS/AFS) Business SIC classification: DRYCLEANING PLANTS, EXCEPT RUG CLEANING
ATLANTIC SERVICE STATION (6481 FRANKSTOWN ROAD-TANKS in PITTSBURGH, PA)
Conditionally Exempt Small Quantity Generators, less than 100 kg/month of hazardous waste (Resource Conservation and Recovery Act (tracking hazardous waste)) - notification Organizations: OPERNAME (CONTACT/OPERATOR)
, ATLANTIC REFINING & MARKETING (CONTACT/OWNER)
BASTONE AUTO SERVICE (235 1/2 CARRON ST in PITTSBURGH, PA)
AIR MINOR (AIRS/AFS) Business SIC classification: GASOLINE SERVICE STATIONS
BIODECISION LABORATORIES (5900 PENN AVE in PITTSBURGH, PA)
Small Quantity Generators, between 100 kg and 1000 kg of hazardous waste/month (Resource Conservation and Recovery Act (tracking hazardous waste)) - notification Organizations: OPERNAME (CONTACT/OPERATOR)
, SOGOLOFF, LEONARD (CONTACT/OWNER)
ACEOMATIC RECON LLC (6545 & 6550 HAMILTON AVE in PITTSBURGH, PA)
Small Quantity Generators, between 100 kg and 1000 kg of hazardous waste/month (Resource Conservation and Recovery Act (tracking hazardous waste)) - notification Business NAICS classification: MECHANICAL POWER TRANSMISSION EQUIPMENT MANUFACTURING.
AFL CIO VOCH TON PROGRAM (HIGHLAND DR in PITTSBURGH, PA) . Federal Facility. UNDETERMINED OR UNKNOWN AGENCY AFFILIATION
Small Quantity Generators, between 100 kg and 1000 kg of hazardous waste/month (Resource Conservation and Recovery Act (tracking hazardous waste)) - notification Organizations: AFL CIO APPALACHIAN COUNCIL (CONTACT/OWNER)
Housing units lacking complete plumbing facilities: 2.1% Housing units lacking complete kitchen facilities: 2.1%
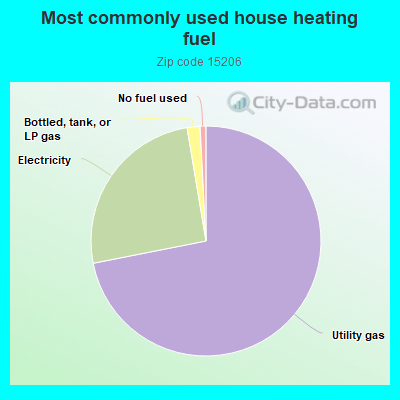
70.9%Utility gas
25.1%Electricity
1.8%Bottled, tank, or LP gas
0.8%No fuel used
Population in 1990: 37,220.
Place of birth for U.S.-born residents:
This state: 17,979
Northeast: 2,640
Midwest: 2,292
South: 2,213
West: 901
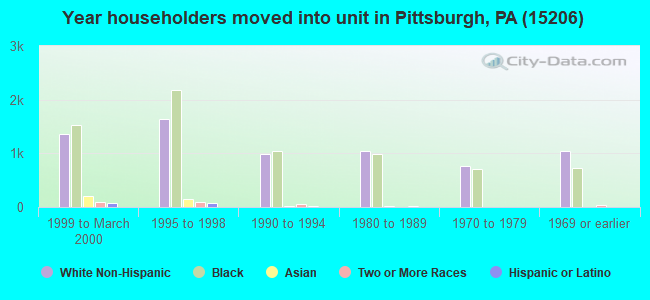
55% of the 15206 zip code residents lived in the same house 5 years ago. Out of people who lived in different houses, 75% lived in this county. Out of people who lived in different counties, 50% lived in Pennsylvania.
85% of the 15206 zip code residents lived in the same house 1 year ago. Out of people who lived in different houses, 46% moved from this county. Out of people who lived in different houses, 10% moved from different county within same state. Out of people who lived in different houses, 32% moved from different state. Out of people who lived in different houses, 13% moved from abroad.
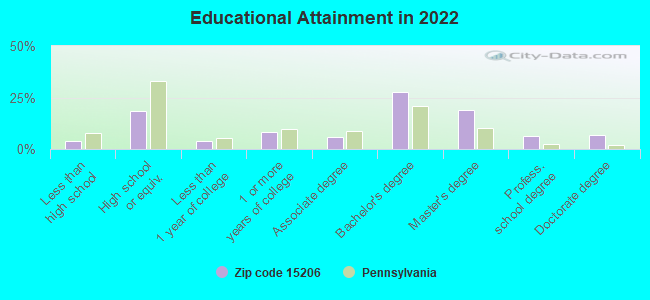
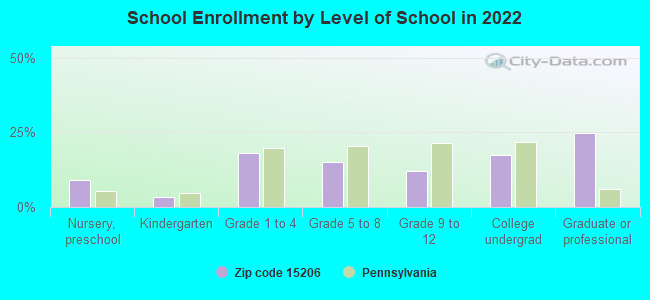
Private vs. public school enrollment:
Students in private schools in grades 1 to 8 (elementary and middle school): 512
Here:
24.7%
Pennsylvania:
15.7%
Students in private schools in grades 9 to 12 (high school): 192
Here:
25.7%
Pennsylvania:
13.4%
Students in private undergraduate colleges: 330
Here:
30.1%
Pennsylvania:
39.8%
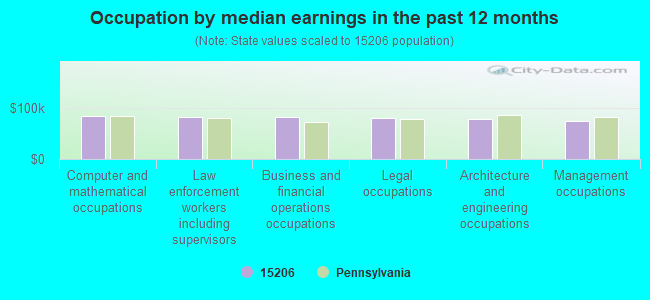
Occupation by median earnings in the past 12 months ($)
84,715Computer and mathematical occupations
82,375Law enforcement workers including supervisors
81,490Business and financial operations occupations
80,488Legal occupations
78,552Architecture and engineering occupations
75,466Management occupations
Companies with federal contracts located in this zip code (PITTSBURGH, PA):
HOMEWOOD PRODUCTS CORPORATION (820 WASHINGTON BLVD; small business) : $3,101,839 in 23 contractsfrom 2000 to 2006
Contracts for Converters, Electrical, Rotating, Circuit Breakers, Electrical Control Equipment, Miscellaneous Electric Power and Distribution Equipment, and moreby Bureau of Reclamation, Army, Defense Logistics Agency, Navy, and others Signed by year:2000: $359,000; 2001: $508,792; 2002: $895,028; 2003: $1,129,454; 2004: -$126; 2005: $12,629; 2006: $197,062.
Biggest contracts:
$1,041,168 with Bureau of Reclamation for Converters, Electrical, Rotating. Taking place in CA. Signed on 2003-09-15. Completion date: 2003-12-15.
$405,000, same as above.Signed on 2002-06-15. Completion date: 2002-12-15.
$359,000 with Bureau of Reclamation for Circuit Breakers. Signed on 2000-05-15. Completion date: 2000-09-15.
$216,000 with Bureau of Reclamation for Electrical Control Equipment. Taking place in CA. Signed on 2001-12-15. Completion date: 2002-10-15.
ATLANTIC BAKING GROUP (6425 PENN AVENUE) 260 employees, $25000000 revenue. Hist. Underutilized Business Zone (HUBZone) Firm: $468,157 in 5 contractsfrom 2001 to 2003
Contracts for Bakery and Cereal Products by Agricultural Stabilization and Conservation Service (disused code), Farm Service Agency Signed by year:2000: $0; 2001: $196,000; 2002: $136,000; 2003: $136,157; 2004: $0; 2005: $0; 2006: $0.
Biggest contracts:
$136,000 with Agricultural Stabilization and Conservation Service (disused code) for Bakery and Cereal Products. Signed on 2002-02-15. Completion date: 2002-06-15.
$136,000, same as above.Signed on 2001-08-15. Completion date: 2001-12-15.
$122,000 with Farm Service Agency for Bakery and Cereal Products. Taking place in IL. Signed on 2003-05-15. Completion date: 2003-09-15.
$60,000 with Agricultural Stabilization and Conservation Service (disused code) for Bakery and Cereal Products. Signed on 2001-11-15. Completion date: 2002-03-15.
PEOPLES CAB CO (1140 WASHINGTON BLVD; small business) : $185,421 in 19 contractsfrom 2001 to 2005
Contracts for Passenger Motor Charter Service, Ambulance Service, Taxicab Services, Motor Passenger Services by Army, Department of Veterans Affairs Signed by year:2000: $0; 2001: $13,860; 2002: $63,990; 2003: $58,820; 2004: $26,403; 2005: $22,348; 2006: $0.
Biggest contracts:
$18,240 with Army for Passenger Motor Charter Service. Signed on 2005-11-03. Completion date: 2006-09-30.
$17,340 with Department of Veterans Affairs for Ambulance Service. Signed on 2003-04-15. Completion date: 2003-10-15.
$16,000, same as above.Signed on 2002-05-15. Completion date: 2003-09-15.
$15,840 with Army for Taxicab Services. Signed on 2004-11-01. Completion date: 2005-09-30.
margaret pettigrew, md (; small business)
$43,012 with Offices, Boards and Divisions (includes Attorney General, Deputy Attorney General, etc.) for Expert Witness. Signed on 2004-01-30. Completion date: 2004-03-05.
BEARING DISTRIBUTORS INC (120 PUTNAM ST; small business) : $34,326 in 3 contractsfrom 2003 to 2004
$12,687 with Army for Bearings, Plain, Unmounted. Signed on 2004-01-20. Completion date: 2004-02-20.
$12,687 with U.S. Army Corps of Engineers - civil program financing only for Bearings, Plain, Unmounted. Signed on 2004-01-20. Completion date: 2004-02-20.
$8,952 with U.S. Army Corps of Engineers - civil program financing only for Bearings, Mounted. Signed on 2003-02-21. Completion date: 2003-03-11.
Top industries in this zip code by the number of employees in 2005:
Health Care and Social Assistance: General Medical and Surgical Hospitals (500-999 employees: 1 establishment)
Information: Data Processing, Hosting, and Related Services (500-999: 1)
2004 - 2018 National Fire Incident Reporting System (NFIRS) incidents
Based on the data from the years 2004 - 2018 the average number of fire incidents per year is 67. The highest number of reported fire incidents - 134 took place in 2006, and the least - 0 in 2012. The data has a rising trend.
When looking into fire subcategories, the most incidents belonged to: Structure Fires (55.3%), and Outside Fires (30.5%).
Fire incident types reported to NFIRS in Zip Code 15206


 Nearest zip codes: 15208, 15232, 15215, 15224, 15201, 15217.


 Based on the data from the years 2004 - 2018 the average number of fire incidents per year is 67. The highest number of reported fire incidents - 134 took place in 2006, and the least - 0 in 2012. The data has a rising trend.
 When looking into fire subcategories, the most incidents belonged to: Structure Fires (55.3%), and Outside Fires (30.5%).