Estimated zip code population in 2022: 29,489 Zip code population in 2010: 24,582 Zip code population in 2000: 22,256
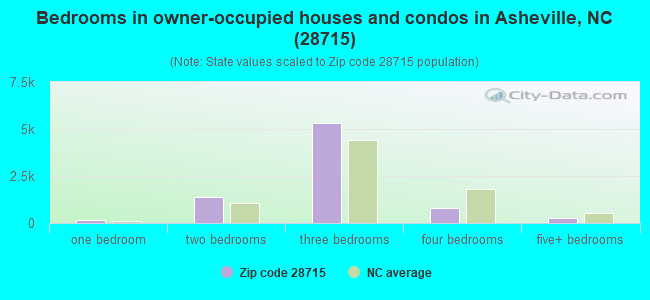
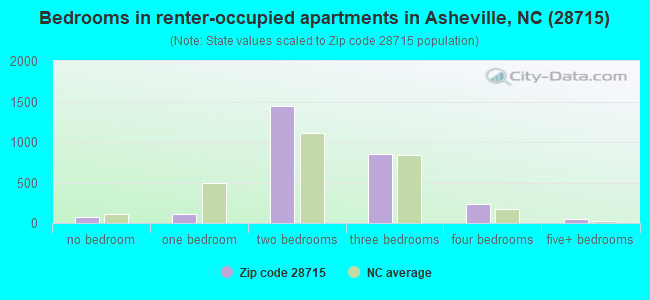
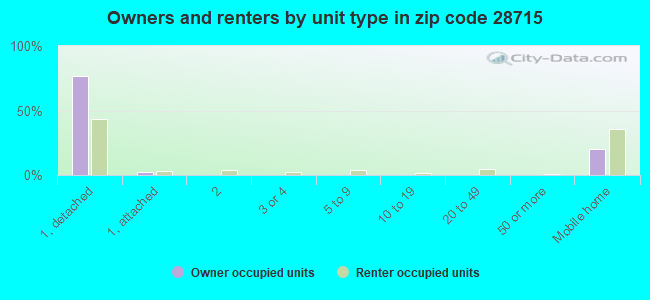
Houses and condos: 12,669 Renter-occupied apartments: 2,764
% of renters here:
26%
State:
33%
March 2022 cost of living index in zip code 28715: 91.5 (less than average, U.S. average is 100)
Land area: 77.9 sq. mi. Water area: 0.1 sq. mi.
Population density: 379 people per square mile
(very low).
OSM Map
General Map
Google Map
MSN Map
OSM Map
General Map
Google Map
MSN Map
OSM Map
General Map
Google Map
MSN Map
OSM Map
General Map
Google Map
MSN Map
Please wait while loading the map...
Real estate property taxes paid for housing units in 2022:
This zip code:
0.5% ($1,601)
North Carolina:
0.6% ($1,769)
Median real estate property taxes paid for housing units with mortgages in 2022: $1,740 (0.5%) Median real estate property taxes paid for housing units with no mortgage in 2022: $1,462 (0.5%)
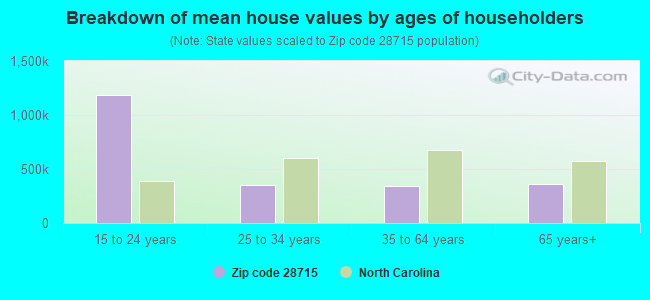
Estimated median house/condo value in 2022: $322,648
28715:
$322,648
North Carolina:
$280,600
According to our research of North Carolina and other state lists, there were 58 registered sex offenders living in 28715 zip code as of April 27, 2024. The ratio of all residents to sex offenders in zip code 28715 is 455 to 1. The ratio of registered sex offenders to all residents in this zip code is near the state average.
Median resident age:
This zip code:
42.1 years
North Carolina median age:
39.2 years
Average household size:
This zip code:
2.7 people
North Carolina:
2.4 people
Averages for the 2020 tax year for zip code 28715, filed in 2021:
Average Adjusted Gross Income (AGI) in 2020: $60,797 (Individual Income Tax Returns)
Here:
$60,797
State:
$70,020
Salary/wage: $49,228 (reported on 79.4% of returns)
Here:
$49,228
State:
$58,387
(% of AGI for various income ranges: 1124.4% for AGIs below $25k, 3631.0% for AGIs $25k-50k, 6341.1% for AGIs $50k-75k, 10003.7% for AGIs $75k-100k, 15959.3% for AGIs $100k-200k, 55473.6% for AGIs over 200k)
Taxable interest for individuals: $1,211 (reported on 30.8% of returns)
This zip code:
$1,211
North Carolina:
$1,479
(% of AGI for various income ranges: 18.2% for AGIs below $25k, 15.2% for AGIs $25k-50k, 33.1% for AGIs $50k-75k, 59.2% for AGIs $75k-100k, 212.1% for AGIs $100k-200k, 803.6% for AGIs over 200k)
Ordinary dividends: $8,489 (reported on 16.6% of returns)
Here:
$8,489
State:
$7,888
(% of AGI for various income ranges: 27.6% for AGIs below $25k, 35.9% for AGIs $25k-50k, 123.0% for AGIs $50k-75k, 220.8% for AGIs $75k-100k, 577.1% for AGIs $100k-200k, 5892.1% for AGIs over 200k)
Net capital gain/loss in AGI: +$19,220 (reported on 15.3% of returns)
Here:
+$19,220
State:
+$23,652
(% of AGI for various income ranges: 13.9% for AGIs below $25k, 23.4% for AGIs $25k-50k, 83.8% for AGIs $50k-75k, 202.5% for AGIs $75k-100k, 844.4% for AGIs $100k-200k, 19502.9% for AGIs over 200k)
Profit/loss from business: +$13,998 (reported on 18.6% of returns)
Here:
+$13,998
State:
+$11,710
(% of AGI for various income ranges: 215.5% for AGIs below $25k, 251.2% for AGIs $25k-50k, 331.4% for AGIs $50k-75k, 448.2% for AGIs $75k-100k, 540.2% for AGIs $100k-200k, 5636.4% for AGIs over 200k)
Taxable individual retirement arrangement distribution: $21,760 (reported on 9.6% of returns)
28715:
$21,760
North Carolina:
$20,247
(% of AGI for various income ranges: 62.4% for AGIs below $25k, 73.4% for AGIs $25k-50k, 234.0% for AGIs $50k-75k, 473.4% for AGIs $75k-100k, 1168.8% for AGIs $100k-200k, 4561.4% for AGIs over 200k)
Self-employed (Keogh) retirement plans: $16,225 (reported on 0.3% of returns)
28715:
$16,225
North Carolina:
$26,749
(% of AGI for various income ranges: 72.9% for AGIs $100k-200k)
Total itemized deductions: $36,103 (reported on 6.9% of returns)
Here:
$36,103
State:
$34,549
(% of AGI for various income ranges: 40.2% for AGIs below $25k, 98.7% for AGIs $25k-50k, 247.7% for AGIs $50k-75k, 472.8% for AGIs $75k-100k, 1087.0% for AGIs $100k-200k, 8721.4% for AGIs over 200k)
Charity contributions: $14,114 (reported on 5.8% of returns)
Here:
$14,114
State:
$13,360
(% of AGI for various income ranges: 4.0% for AGIs below $25k, 12.8% for AGIs $25k-50k, 47.0% for AGIs $50k-75k, 88.3% for AGIs $75k-100k, 358.5% for AGIs $100k-200k, 4150.7% for AGIs over 200k)
Taxes paid: $6,873 (reported on 6.9% of returns)
28715:
$6,873
State:
$7,586
(% of AGI for various income ranges: 4.3% for AGIs below $25k, 13.3% for AGIs $25k-50k, 46.7% for AGIs $50k-75k, 102.7% for AGIs $75k-100k, 285.7% for AGIs $100k-200k, 1282.9% for AGIs over 200k)
Earned income credit: $2,181 (reported on 17.4% of returns)
Here:
$2,181
State:
$2,337
(% of AGI for various income ranges: 97.0% for AGIs below $25k, 69.9% for AGIs $25k-50k, 1.6% for AGIs $50k-75k)
Percentage of individuals using paid preparers for their 2020 taxes: 93.0%
Here:
93%
State:
93%
(% for various income ranges: 91.4% for AGIs below $25k, 94.4% for AGIs $25k-50k, 92.5% for AGIs $50k-75k, 93.9% for AGIs $75k-100k, 93.9% for AGIs $100k-200k, 95.2% for AGIs over 200k)
Averages for the 2012 tax year for zip code 28715, filed in 2013:
Average Adjusted Gross Income (AGI) in 2012: $47,675 (Individual Income Tax Returns)
Here:
$47,675
State:
$54,937
Salary/wage: $40,740 (reported on 83.2% of returns)
Here:
$40,740
State:
$46,336
(% of AGI for various income ranges: 73.3% for AGIs below $25k, 80.2% for AGIs $25k-50k, 75.9% for AGIs $50k-75k, 74.4% for AGIs $75k-100k, 69.2% for AGIs $100k-200k, 52.7% for AGIs over 200k)
Taxable interest for individuals: $1,128 (reported on 32.5% of returns)
This zip code:
$1,128
North Carolina:
$1,298
(% of AGI for various income ranges: 0.9% for AGIs below $25k, 0.5% for AGIs $25k-50k, 0.6% for AGIs $50k-75k, 0.7% for AGIs $75k-100k, 0.9% for AGIs $100k-200k, 1.0% for AGIs over 200k)
Ordinary dividends: $4,617 (reported on 14.6% of returns)
Here:
$4,617
State:
$6,213
(% of AGI for various income ranges: 1.1% for AGIs below $25k, 0.6% for AGIs $25k-50k, 1.0% for AGIs $50k-75k, 1.2% for AGIs $75k-100k, 1.5% for AGIs $100k-200k, 3.2% for AGIs over 200k)
Net capital gain/loss in AGI: +$9,523 (reported on 12.0% of returns)
Here:
+$9,523
State:
+$12,740
(% of AGI for various income ranges: 0.3% for AGIs $25k-50k, 0.5% for AGIs $50k-75k, 1.1% for AGIs $75k-100k, 2.3% for AGIs $100k-200k, 10.1% for AGIs over 200k)
Profit/loss from business: +$10,796 (reported on 17.3% of returns)
Here:
+$10,796
State:
+$10,311
(% of AGI for various income ranges: 8.8% for AGIs below $25k, 3.8% for AGIs $25k-50k, 2.9% for AGIs $50k-75k, 2.5% for AGIs $75k-100k, 2.8% for AGIs $100k-200k, 4.4% for AGIs over 200k)
Taxable individual retirement arrangement distribution: $17,178 (reported on 9.6% of returns)
28715:
$17,178
North Carolina:
$15,575
(% of AGI for various income ranges: 2.3% for AGIs below $25k, 2.4% for AGIs $25k-50k, 2.4% for AGIs $50k-75k, 3.0% for AGIs $75k-100k, 5.1% for AGIs $100k-200k, 5.0% for AGIs over 200k)
Self-employment retirement plans: $19,100 (reported on 0.4% of returns)
28715:
$19,100
North Carolina:
$21,078
(% of AGI for various income ranges: 0.7% for AGIs $100k-200k)
Total itemized deductions: $21,988 (24% of AGI, reported on 30.4% of returns)
Here:
$21,988
State:
$23,438
Here:
23.6% of AGI
State:
21.5% of AGI
(% of AGI for various income ranges: 8.7% for AGIs below $25k, 10.7% for AGIs $25k-50k, 14.1% for AGIs $50k-75k, 15.4% for AGIs $75k-100k, 17.6% for AGIs $100k-200k, 15.7% for AGIs over 200k)
Charity contributions: $4,482 (reported on 24.8% of returns)
Here:
$4,482
State:
$4,687
(% of AGI for various income ranges: 0.9% for AGIs below $25k, 1.6% for AGIs $25k-50k, 2.0% for AGIs $50k-75k, 2.5% for AGIs $75k-100k, 3.1% for AGIs $100k-200k, 3.4% for AGIs over 200k)
Taxes paid: $7,219 (reported on 30.4% of returns)
28715:
$7,219
State:
$8,823
(% of AGI for various income ranges: 1.2% for AGIs below $25k, 2.2% for AGIs $25k-50k, 3.6% for AGIs $50k-75k, 4.9% for AGIs $75k-100k, 6.6% for AGIs $100k-200k, 7.9% for AGIs over 200k)
Earned income credit: $2,205 (reported on 21.5% of returns)
Here:
$2,205
State:
$2,376
(% of AGI for various income ranges: 6.6% for AGIs below $25k, 1.3% for AGIs $25k-50k)
Percentage of individuals using paid preparers for their 2012 taxes: 52.7%
Here:
53%
State:
53%
(% for various income ranges: 49.7% for AGIs below $25k, 51.8% for AGIs $25k-50k, 54.4% for AGIs $50k-75k, 54.9% for AGIs $75k-100k, 60.5% for AGIs $100k-200k, 80.0% for AGIs over 200k)
Averages for the 2004 tax year for zip code 28715, filed in 2005:
Average Adjusted Gross Income (AGI) in 2004: $37,136 (Individual Income Tax Returns)
Here:
$37,136
State:
$45,376
Salary/wage: $34,217 (reported on 85.6% of returns)
Here:
$34,217
State:
$39,442
(% of AGI for various income ranges: 126.0% for AGIs below $10k, 76.8% for AGIs $10k-25k, 83.0% for AGIs $25k-50k, 81.9% for AGIs $50k-75k, 81.1% for AGIs $75k-100k, 66.8% for AGIs over 100k)
Taxable interest for individuals: $1,381 (reported on 38.0% of returns)
This zip code:
$1,381
North Carolina:
$1,515
(% of AGI for various income ranges: 5.2% for AGIs below $10k, 1.7% for AGIs $10k-25k, 1.0% for AGIs $25k-50k, 1.1% for AGIs $50k-75k, 1.4% for AGIs $75k-100k, 1.8% for AGIs over 100k)
Taxable dividends: $1,978 (reported on 15.1% of returns)
Here:
$1,978
State:
$4,016
(% of AGI for various income ranges: 2.2% for AGIs below $10k, 0.8% for AGIs $10k-25k, 0.5% for AGIs $25k-50k, 0.7% for AGIs $50k-75k, 0.6% for AGIs $75k-100k, 1.4% for AGIs over 100k)
Net capital gain/loss: +$6,275 (reported on 12.4% of returns)
Here:
+$6,275
State:
+$11,152
(% of AGI for various income ranges: -1.0% for AGIs below $10k, -0.3% for AGIs $10k-25k, 0.5% for AGIs $25k-50k, 0.7% for AGIs $50k-75k, 1.4% for AGIs $75k-100k, 7.7% for AGIs over 100k)
Profit/loss from business: +$8,404 (reported on 16.7% of returns)
Here:
+$8,404
State:
+$9,490
(% of AGI for various income ranges: 11.8% for AGIs below $10k, 5.8% for AGIs $10k-25k, 3.5% for AGIs $25k-50k, 3.2% for AGIs $50k-75k, 2.5% for AGIs $75k-100k, 3.8% for AGIs over 100k)
IRA payment deduction: $2,789 (reported on 2.2% of returns)
28715:
$2,789
North Carolina:
$2,967
(% of AGI for various income ranges: 0.2% for AGIs $10k-25k, 0.2% for AGIs $25k-50k, 0.2% for AGIs $50k-75k, 0.2% for AGIs $75k-100k, 0.1% for AGIs over 100k)
Self-employed pension: $5,536 (reported on 0.3% of returns)
Here:
$5,536
North Carolina:
$14,754
Total itemized deductions: $17,424 (26% of AGI, reported on 32.7% of returns)
Here:
$17,424
State:
$19,464
Here:
26.3% of AGI
State:
22.7% of AGI
(% of AGI for various income ranges: 16.2% for AGIs below $10k, 11.0% for AGIs $10k-25k, 13.0% for AGIs $25k-50k, 16.5% for AGIs $50k-75k, 18.5% for AGIs $75k-100k, 17.4% for AGIs over 100k)
Charity contributions deductions: $3,771 (5% of AGI, reported on 27.3% of returns)
Here:
$3,771
State:
$4,035
Here:
5.4% of AGI
State:
4.5% of AGI
(% of AGI for various income ranges: 1.5% for AGIs below $10k, 1.5% for AGIs $10k-25k, 1.9% for AGIs $25k-50k, 3.0% for AGIs $50k-75k, 3.2% for AGIs $75k-100k, 4.1% for AGIs over 100k)
Total tax: $4,577 (reported on 74.1% of returns)
28715:
$4,577
State:
$7,257
(% of AGI for various income ranges: 4.7% for AGIs below $10k, 4.0% for AGIs $10k-25k, 6.4% for AGIs $25k-50k, 8.2% for AGIs $50k-75k, 9.8% for AGIs $75k-100k, 16.5% for AGIs over 100k)
Earned income credit: $1,731 (reported on 18.6% of returns)
Here:
$1,731
State:
$1,851
Percentage of individuals using paid preparers for their 2004 taxes: 58.5%
Here:
59%
State:
62%
(% for various income ranges: 52.5% for AGIs below $10k, 60.6% for AGIs $10k-25k, 59.0% for AGIs $25k-50k, 59.9% for AGIs $50k-75k, 56.1% for AGIs $75k-100k, 66.6% for AGIs over 100k)
Likely homosexual households (counted as self-reported same-sex unmarried-partner households)
Lesbian couples: 0.3% of all households
Gay men: 0.1% of all households
Household received Food Stamps/SNAP in the past 12 months: 1,164 Household did not receive Food Stamps/SNAP in the past 12 months: 9,610
Women who had a birth in the past 12 months: 110 (83 now married, 27 unmarried) Women who did not have a birth in the past 12 months: 6,471 (3,008 now married, 3,467 unmarried)
Housing units in zip code 28715 with a mortgage: 4,322 (248 second mortgage, 230 both second mortgage and home equity loan) Houses without a mortgage: 129
Median monthly owner costs for units with a mortgage: $1,387 Median monthly owner costs for units without a mortgage: $421
Residents with income below the poverty level in 2022:
This zip code:
10.6%
Whole state:
12.8%
Residents with income below 50% of the poverty level in 2022:
This zip code:
5.9%
Whole state:
6.8%
Median number of rooms in houses and condos:
Here:
6.0
State:
6.4
Median number of rooms in apartments:
Here:
5.1
State:
4.4
Notable locations in this zip code not listed on our city pages
Churches in zip code 28715 include: Hominy Church (A), Mount Pisgah Church (B), Liberty Church (C), Laurel Hill Church (D), Montmorenci Church (E), White Rock Church (F), Davis Chapel Church (G), Mount Moriah Church (H), New Morgan Hill Church (I). Display/hide their locations on the map
Cemeteries: Trull Cemetery (1), Hice Hill Cemetery (2), Brooks Cemetery (3), Harkins Cemetery (4), Luther Cemetery (5), Forest Lawn Cemetery (6), Justice Cemetery (7). Display/hide their locations on the map
Streams, rivers, and creeks: Hogpen Branch (A), George Branch (B), Glady Fork (C), Curtis Creek (D), Bryson Branch (E), Chestnut Creek (F), Baldwin Field Branch (G), Beaverdam Creek (H), Stony Fork (I). Display/hide their locations on the map
In group quarters: 263 (-1 institutionalized population)
Size of family households: 4,262 2-persons, 1,349 3-persons, 1,261 4-persons, 554 5-persons, 135 6-persons, 165 7-or-more-persons
Size of nonfamily households: 2,497 1-person, 556 2-persons, 41 3-persons
4,001 married couples with children.
1,438 single-parent households (241 men, 1,197 women).
92.6% of residents of 28715 zip code speak English at home.
6.5% of residents speak Spanish at home (55% very well, 22% well, 12% not well, 11% not at all).
0.6% of residents speak other Indo-European language at home (65% very well, 11% well, 23% not well).
0.2% of residents speak Asian or Pacific Island language at home (94% very well, 4% well, 2% not well).
0.1% of residents speak other language at home (100% very well).
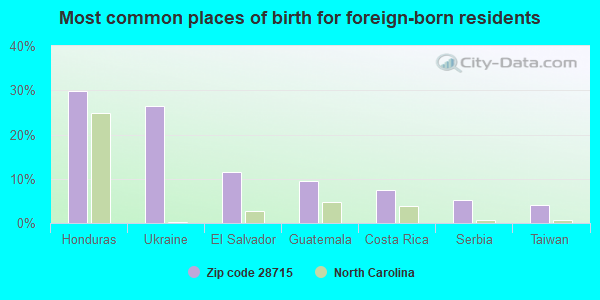
Foreign born population: 1,768 (6.0%) (40.2% of them are naturalized citizens)
This zip code:
6.0%
Whole state:
8.6%
30%Honduras
26%Ukraine
11%El Salvador
9%Guatemala
7%Costa Rica
5%Serbia
4%Taiwan
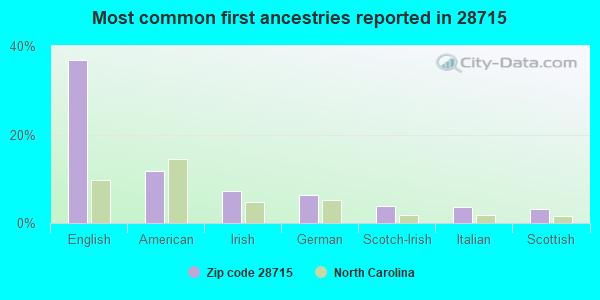
37%English
12%American
7%Irish
6%German
4%Scotch-Irish
4%Italian
3%Scottish
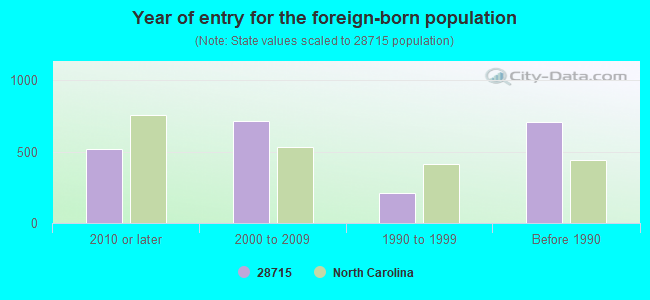
Year of entry for the foreign-born population
5162010 or later
7122000 to 2009
2071990 to 1999
708Before 1990
Facilities with environmental interests located in this zip code:
ASHEVILLE VAULT SERVICE (2239 SMOKY PARKS HIGHWAY in CANDLER, NC)
STATE MASTER (North Carolina facility info) - -115DA4YG00M29W84AY3V06AB0B, WASTEWATER FACILITY National Pollutant Discharge Elimination System NON-MAJOR (Tracking pollutant discharge elimination systems) - permit Business SIC classification: CONCRETE PRODUCTS, EXCEPT BLOCK AND BRICK
CLARK, JERRY - RESIDENCE (SAMS BRANCH ROAD in CANDLER, NC)
STATE MASTER (North Carolina facility info) - -115DA4YG00PXWD64FBEM06E218, WASTEWATER FACILITY National Pollutant Discharge Elimination System NON-MAJOR (Tracking pollutant discharge elimination systems) - permit Business SIC classification: SEWERAGE SYSTEMS
DIVERSIFIED LABORATORIES INC. (PISGAH HIGHWAY 151 in CANDLER, NC)
(Resource Conservation and Recovery Act (tracking hazardous waste)) Organizations: GARY GRANT (CONTACT/OWNER)
APAC ATLANTIC INC-ENKA (1188 SMOKY PARK HWY in CANDLER, NC)
National Pollutant Discharge Elimination System NON-MAJOR (Tracking pollutant discharge elimination systems) - permit Business SIC classification: ASPHALT PAVING MIXTURES AND BLOCKS
BRAD RAGAN INC #1708 (RT 5 GEORG'S BRANCH RD in CANDLER, NC)
Small Quantity Generators, between 100 kg and 1000 kg of hazardous waste/month (Resource Conservation and Recovery Act (tracking hazardous waste)) - notification Organizations: GOODYEAR TIRE & RUBBER (CONTACT/OWNER)
CHEM DESIGNS (HWY NC 151 in CANDLER, NC)
COMPLIANCE ACTIVITY (Tracking inspections of insecticide, fungicide, and rodenticide, and toxic substances)
APAC OF CAROLINA ENKA (HIGHWAY 1923 SOUTH in CANDLER, NC)
AIR SYNTHETIC MINOR (AIRS/AFS) Business SIC classification: ASPHALT PAVING MIXTURES AND BLOCKS
Housing units lacking complete plumbing facilities: 2.2% Housing units lacking complete kitchen facilities: 2.2%
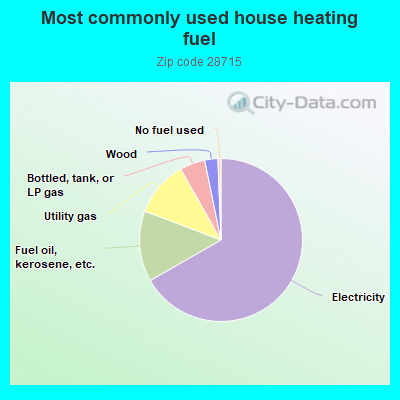
66.6%Electricity
14.0%Fuel oil, kerosene, etc.
11.0%Utility gas
5.0%Bottled, tank, or LP gas
2.6%Wood
0.6%No fuel used
Population in 1990: 15,823. Population change in the 1990s: +6,433 (+40.7%).
Place of birth for U.S.-born residents:
This state: 17,257
Northeast: 2,610
Midwest: 2,250
South: 4,251
West: 863
57% of the 28715 zip code residents lived in the same house 5 years ago. Out of people who lived in different houses, 66% lived in this county. Out of people who lived in different counties, 50% lived in North Carolina.
94% of the 28715 zip code residents lived in the same house 1 year ago. Out of people who lived in different houses, 56% moved from this county. Out of people who lived in different houses, 7% moved from different county within same state. Out of people who lived in different houses, 39% moved from different state. Out of people who lived in different houses, 4% moved from abroad.
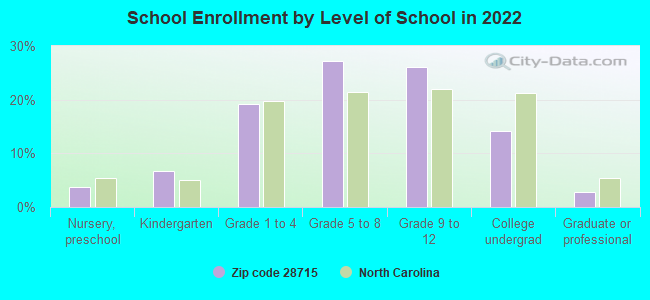
Private vs. public school enrollment:
Students in private schools in grades 1 to 8 (elementary and middle school): 460
Here:
16.9%
North Carolina:
13.8%
Students in private schools in grades 9 to 12 (high school): 123
Here:
8.2%
North Carolina:
11.9%
Students in private undergraduate colleges: 73
Here:
8.9%
North Carolina:
19.3%
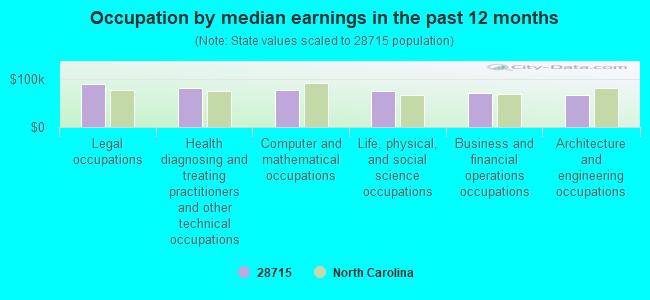
Occupation by median earnings in the past 12 months ($)
88,892Legal occupations
81,582Health diagnosing and treating practitioners and other technical occupations
75,966Computer and mathematical occupations
74,675Life, physical, and social science occupations
70,296Business and financial operations occupations
66,614Architecture and engineering occupations
Companies with federal contracts located in this zip code (CANDLER, NC):
ENERGY TECHNOLOGY SERVICES INT (648 MONTE VISTA ROAD; small business)
$59,600 with Army for Energy Studies. Signed on 2003-02-14. Completion date: 2003-07-09.
MOUNTAIN GEAR SURPLUS SALES (60 SAW BRANCH RD; small business) : $58,067 in 4 contractsfrom 2002 to 2005
$41,683 with Air Force for Tents and Tarpaulins. Signed on 2005-11-16. Completion date: 2005-12-02.
$11,877 with Navy for Athletic and Sporting Equipment. Signed on 2002-11-26. Completion date: 2002-12-09.
$3,838 with Army for Tents and Tarpaulins. Signed on 2005-01-05. Completion date: 2005-01-15.
$669, same as above.Signed on 2005-02-03. Completion date: 2005-01-15.
FERRISWHEEL TRUCKING CO (24 MACIE LANE; small business) : $35,760 in 2 contractsin 2000
$35,760 with Defense Logistics Agency for Miscellaneous Items. Signed on 2000-11-09. Completion date: 2001-01-09.
$0, same as above.Signed on 2000-11-09. Completion date: 2001-01-09.
WNC WOODWORKS INC (9 FERN FORREST DR; small business)
$7,475 with Army for Office Furniture. Taking place in SC. Signed on 2003-12-11. Completion date: 2004-01-12.
Top industries in this zip code by the number of employees in 2005:
2004 - 2018 National Fire Incident Reporting System (NFIRS) incidents
According to the data from the years 2004 - 2018 the average number of fires per year is 74. The highest number of fire incidents - 154 took place in 2014, and the least - 23 in 2013. The data has a growing trend.
When looking into fire subcategories, the most incidents belonged to: Structure Fires (45.5%), and Outside Fires (37.9%).
Fire incident types reported to NFIRS in Zip Code 28715

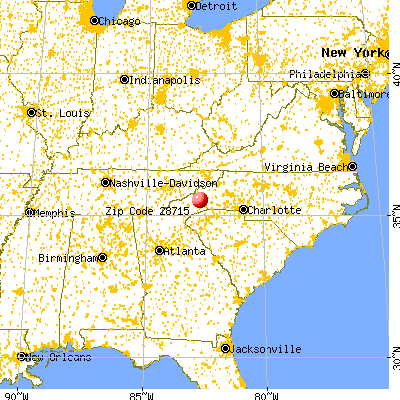


 Nearest zip codes: 28806, 28704, 28742, 28748, 28716, 28801.


 According to the data from the years 2004 - 2018 the average number of fires per year is 74. The highest number of fire incidents - 154 took place in 2014, and the least - 23 in 2013. The data has a growing trend.
 When looking into fire subcategories, the most incidents belonged to: Structure Fires (45.5%), and Outside Fires (37.9%).