Estimated zip code population in 2022: 39,268 Zip code population in 2010: 26,147 Zip code population in 2000: 12,062
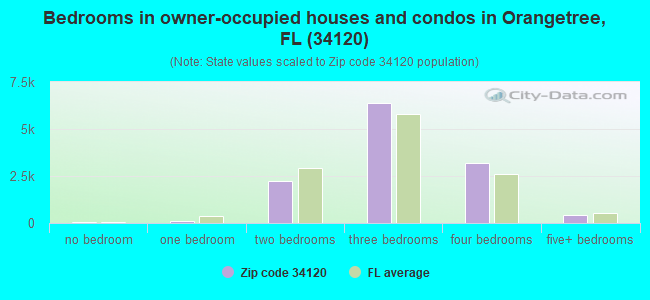
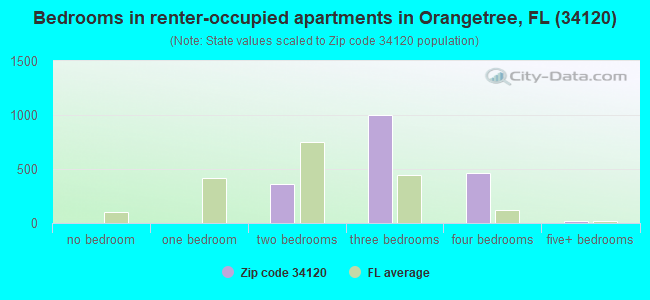
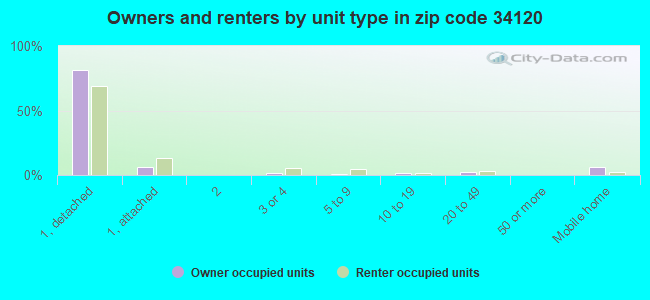
Houses and condos: 17,383 Renter-occupied apartments: 1,865
% of renters here:
13%
State:
33%
March 2022 cost of living index in zip code 34120: 97.2 (near average, U.S. average is 100)
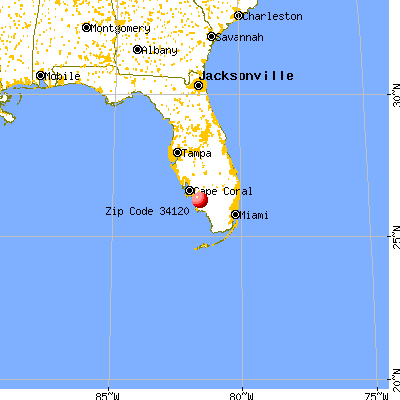
Land area: 151.2 sq. mi. Water area: 3.9 sq. mi.
Population density: 260 people per square mile
(very low).
OSM Map
General Map
Google Map
MSN Map
OSM Map
General Map
Google Map
MSN Map
OSM Map
General Map
Google Map
MSN Map
OSM Map
General Map
Google Map
MSN Map
Please wait while loading the map...
Real estate property taxes paid for housing units in 2022:
This zip code:
0.6% ($3,075)
Florida:
0.7% ($2,529)
Median real estate property taxes paid for housing units with mortgages in 2022: $3,149 (0.6%) Median real estate property taxes paid for housing units with no mortgage in 2022: $2,852 (0.6%)
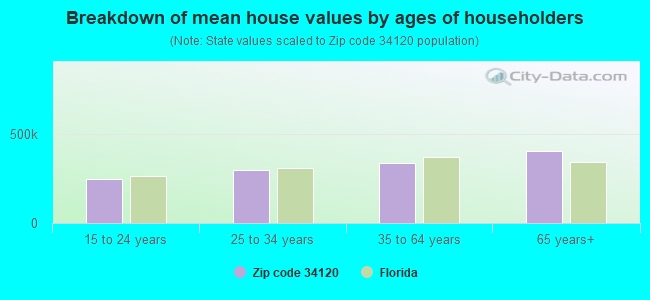
Estimated median house/condo value in 2022: $495,158
34120:
$495,158
Florida:
$354,100
According to our research of Florida and other state lists, there were 46 registered sex offenders living in 34120 zip code as of April 28, 2024. The ratio of all residents to sex offenders in zip code 34120 is 689 to 1. The ratio of registered sex offenders to all residents in this zip code is near the state average.
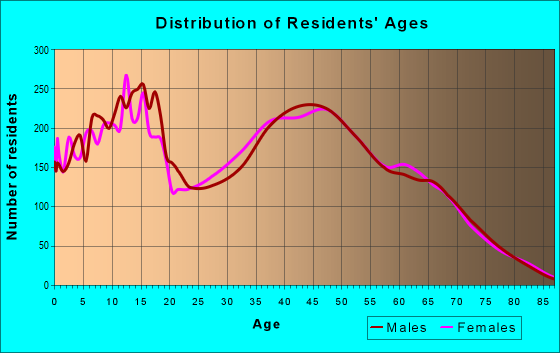
Median resident age:
This zip code:
43.0 years
Florida median age:
42.7 years
Average household size:
This zip code:
2.8 people
Florida:
2.5 people
Averages for the 2020 tax year for zip code 34120, filed in 2021:
Average Adjusted Gross Income (AGI) in 2020: $90,124 (Individual Income Tax Returns)
Here:
$90,124
State:
$82,200
Salary/wage: $64,914 (reported on 79.8% of returns)
Here:
$64,914
State:
$58,347
(% of AGI for various income ranges: 1251.1% for AGIs below $25k, 3807.2% for AGIs $25k-50k, 7012.8% for AGIs $50k-75k, 9353.5% for AGIs $75k-100k, 16770.4% for AGIs $100k-200k, 74464.3% for AGIs over 200k)
Taxable interest for individuals: $2,959 (reported on 27.1% of returns)
This zip code:
$2,959
Florida:
$4,272
(% of AGI for various income ranges: 14.3% for AGIs below $25k, 19.8% for AGIs $25k-50k, 41.6% for AGIs $50k-75k, 73.6% for AGIs $75k-100k, 215.8% for AGIs $100k-200k, 2336.8% for AGIs over 200k)
Ordinary dividends: $14,142 (reported on 19.7% of returns)
Here:
$14,142
State:
$15,863
(% of AGI for various income ranges: 26.7% for AGIs below $25k, 45.8% for AGIs $25k-50k, 116.8% for AGIs $50k-75k, 210.3% for AGIs $75k-100k, 597.1% for AGIs $100k-200k, 9541.8% for AGIs over 200k)
Net capital gain/loss in AGI: +$59,289 (reported on 19.9% of returns)
Here:
+$59,289
State:
+$62,983
(% of AGI for various income ranges: 9.1% for AGIs below $25k, 32.5% for AGIs $25k-50k, 87.2% for AGIs $50k-75k, 284.9% for AGIs $75k-100k, 814.9% for AGIs $100k-200k, 54263.2% for AGIs over 200k)
Profit/loss from business: +$15,153 (reported on 23.3% of returns)
Here:
+$15,153
State:
+$9,719
(% of AGI for various income ranges: 264.7% for AGIs below $25k, 301.4% for AGIs $25k-50k, 321.2% for AGIs $50k-75k, 378.6% for AGIs $75k-100k, 753.2% for AGIs $100k-200k, 6184.1% for AGIs over 200k)
Taxable individual retirement arrangement distribution: $36,810 (reported on 9.3% of returns)
34120:
$36,810
Florida:
$24,823
(% of AGI for various income ranges: 48.1% for AGIs below $25k, 66.0% for AGIs $25k-50k, 213.4% for AGIs $50k-75k, 411.5% for AGIs $75k-100k, 1451.1% for AGIs $100k-200k, 7497.0% for AGIs over 200k)
Self-employed (Keogh) retirement plans: $34,485 (reported on 0.6% of returns)
34120:
$34,485
Florida:
$29,694
(% of AGI for various income ranges: 6.8% for AGIs $25k-50k, 32.7% for AGIs $100k-200k, 814.3% for AGIs over 200k)
Total itemized deductions: $34,323 (reported on 10.4% of returns)
Here:
$34,323
State:
$45,393
(% of AGI for various income ranges: 59.9% for AGIs below $25k, 195.2% for AGIs $25k-50k, 437.5% for AGIs $50k-75k, 496.7% for AGIs $75k-100k, 1079.2% for AGIs $100k-200k, 7136.4% for AGIs over 200k)
Charity contributions: $9,611 (reported on 8.0% of returns)
Here:
$9,611
State:
$20,178
(% of AGI for various income ranges: 3.3% for AGIs below $25k, 18.8% for AGIs $25k-50k, 39.7% for AGIs $50k-75k, 57.8% for AGIs $75k-100k, 210.1% for AGIs $100k-200k, 2401.1% for AGIs over 200k)
Taxes paid: $6,807 (reported on 10.3% of returns)
34120:
$6,807
State:
$6,967
(% of AGI for various income ranges: 11.3% for AGIs below $25k, 47.1% for AGIs $25k-50k, 86.4% for AGIs $50k-75k, 107.8% for AGIs $75k-100k, 226.5% for AGIs $100k-200k, 1215.5% for AGIs over 200k)
Earned income credit: $2,203 (reported on 16.3% of returns)
Here:
$2,203
State:
$2,306
(% of AGI for various income ranges: 107.6% for AGIs below $25k, 74.2% for AGIs $25k-50k, 1.6% for AGIs $50k-75k)
Percentage of individuals using paid preparers for their 2020 taxes: 92.2%
Here:
92%
State:
92%
(% for various income ranges: 90.4% for AGIs below $25k, 93.0% for AGIs $25k-50k, 92.6% for AGIs $50k-75k, 93.5% for AGIs $75k-100k, 92.9% for AGIs $100k-200k, 92.4% for AGIs over 200k)
Averages for the 2012 tax year for zip code 34120, filed in 2013:
Average Adjusted Gross Income (AGI) in 2012: $59,453 (Individual Income Tax Returns)
Here:
$59,453
State:
$60,316
Salary/wage: $47,094 (reported on 83.1% of returns)
Here:
$47,094
State:
$45,277
(% of AGI for various income ranges: 75.3% for AGIs below $25k, 83.0% for AGIs $25k-50k, 81.2% for AGIs $50k-75k, 73.9% for AGIs $75k-100k, 62.7% for AGIs $100k-200k, 41.2% for AGIs over 200k)
Taxable interest for individuals: $2,341 (reported on 25.7% of returns)
This zip code:
$2,341
Florida:
$3,587
(% of AGI for various income ranges: 0.9% for AGIs below $25k, 0.7% for AGIs $25k-50k, 0.6% for AGIs $50k-75k, 0.8% for AGIs $75k-100k, 0.8% for AGIs $100k-200k, 1.8% for AGIs over 200k)
Ordinary dividends: $9,368 (reported on 16.2% of returns)
Here:
$9,368
State:
$12,831
(% of AGI for various income ranges: 1.5% for AGIs below $25k, 1.2% for AGIs $25k-50k, 1.1% for AGIs $50k-75k, 1.3% for AGIs $75k-100k, 2.0% for AGIs $100k-200k, 5.8% for AGIs over 200k)
Net capital gain/loss in AGI: +$20,547 (reported on 14.1% of returns)
Here:
+$20,547
State:
+$33,493
(% of AGI for various income ranges: 0.3% for AGIs $25k-50k, 0.5% for AGIs $50k-75k, 0.3% for AGIs $75k-100k, 1.4% for AGIs $100k-200k, 17.9% for AGIs over 200k)
Profit/loss from business: +$10,614 (reported on 20.5% of returns)
Here:
+$10,614
State:
+$10,012
(% of AGI for various income ranges: 13.8% for AGIs below $25k, 4.3% for AGIs $25k-50k, 2.2% for AGIs $50k-75k, 1.6% for AGIs $75k-100k, 3.2% for AGIs $100k-200k, 2.4% for AGIs over 200k)
Taxable individual retirement arrangement distribution: $27,724 (reported on 9.2% of returns)
34120:
$27,724
Florida:
$21,544
(% of AGI for various income ranges: 2.2% for AGIs below $25k, 1.6% for AGIs $25k-50k, 2.3% for AGIs $50k-75k, 3.8% for AGIs $75k-100k, 7.4% for AGIs $100k-200k, 5.1% for AGIs over 200k)
Self-employment retirement plans: $21,620 (reported on 0.4% of returns)
34120:
$21,620
Florida:
$20,611
Total itemized deductions: $22,572 (20% of AGI, reported on 31.6% of returns)
Here:
$22,572
State:
$25,533
Here:
20.2% of AGI
State:
18.0% of AGI
(% of AGI for various income ranges: 10.7% for AGIs below $25k, 12.3% for AGIs $25k-50k, 13.5% for AGIs $50k-75k, 13.4% for AGIs $75k-100k, 13.5% for AGIs $100k-200k, 9.1% for AGIs over 200k)
Charity contributions: $3,537 (reported on 23.9% of returns)
Here:
$3,537
State:
$5,698
(% of AGI for various income ranges: 0.6% for AGIs below $25k, 0.9% for AGIs $25k-50k, 1.2% for AGIs $50k-75k, 1.4% for AGIs $75k-100k, 1.8% for AGIs $100k-200k, 1.7% for AGIs over 200k)
Taxes paid: $5,756 (reported on 30.9% of returns)
34120:
$5,756
State:
$6,203
(% of AGI for various income ranges: 1.6% for AGIs below $25k, 2.5% for AGIs $25k-50k, 2.4% for AGIs $50k-75k, 2.5% for AGIs $75k-100k, 3.4% for AGIs $100k-200k, 4.0% for AGIs over 200k)
Earned income credit: $2,282 (reported on 21.1% of returns)
Here:
$2,282
State:
$2,372
(% of AGI for various income ranges: 7.6% for AGIs below $25k, 1.3% for AGIs $25k-50k)
Percentage of individuals using paid preparers for their 2012 taxes: 54.3%
Here:
54%
State:
54%
(% for various income ranges: 52.7% for AGIs below $25k, 53.6% for AGIs $25k-50k, 53.2% for AGIs $50k-75k, 53.8% for AGIs $75k-100k, 58.3% for AGIs $100k-200k, 77.1% for AGIs over 200k)
Averages for the 2004 tax year for zip code 34120, filed in 2005:
Average Adjusted Gross Income (AGI) in 2004: $47,863 (Individual Income Tax Returns)
Here:
$47,863
State:
$50,523
Salary/wage: $40,433 (reported on 86.7% of returns)
Here:
$40,433
State:
$39,563
(% of AGI for various income ranges: 140.5% for AGIs below $10k, 79.3% for AGIs $10k-25k, 84.7% for AGIs $25k-50k, 83.4% for AGIs $50k-75k, 80.1% for AGIs $75k-100k, 51.7% for AGIs over 100k)
Taxable interest for individuals: $1,466 (reported on 37.3% of returns)
This zip code:
$1,466
Florida:
$3,211
(% of AGI for various income ranges: 4.0% for AGIs below $10k, 1.2% for AGIs $10k-25k, 0.6% for AGIs $25k-50k, 0.7% for AGIs $50k-75k, 1.0% for AGIs $75k-100k, 1.7% for AGIs over 100k)
Taxable dividends: $2,583 (reported on 15.9% of returns)
Here:
$2,583
State:
$6,129
(% of AGI for various income ranges: 2.7% for AGIs below $10k, 0.8% for AGIs $10k-25k, 0.6% for AGIs $25k-50k, 0.7% for AGIs $50k-75k, 0.6% for AGIs $75k-100k, 1.2% for AGIs over 100k)
Net capital gain/loss: +$24,512 (reported on 14.8% of returns)
Here:
+$24,512
State:
+$27,205
(% of AGI for various income ranges: -1.1% for AGIs below $10k, 0.5% for AGIs $10k-25k, 1.0% for AGIs $25k-50k, 1.7% for AGIs $50k-75k, 2.5% for AGIs $75k-100k, 20.5% for AGIs over 100k)
Profit/loss from business: +$9,674 (reported on 20.0% of returns)
Here:
+$9,674
State:
+$10,634
(% of AGI for various income ranges: 27.2% for AGIs below $10k, 12.2% for AGIs $10k-25k, 4.7% for AGIs $25k-50k, 2.2% for AGIs $50k-75k, 2.4% for AGIs $75k-100k, 2.9% for AGIs over 100k)
IRA payment deduction: $3,018 (reported on 2.5% of returns)
34120:
$3,018
Florida:
$3,082
(% of AGI for various income ranges: 0.1% for AGIs $10k-25k, 0.2% for AGIs $25k-50k, 0.2% for AGIs $50k-75k, 0.2% for AGIs $75k-100k, 0.1% for AGIs over 100k)
Self-employed pension: $9,091 (reported on 0.2% of returns)
Here:
$9,091
Florida:
$15,857
Total itemized deductions: $17,901 (27% of AGI, reported on 46.0% of returns)
Here:
$17,901
State:
$20,370
Here:
26.5% of AGI
State:
20.7% of AGI
(% of AGI for various income ranges: 29.5% for AGIs below $10k, 18.3% for AGIs $10k-25k, 21.3% for AGIs $25k-50k, 20.3% for AGIs $50k-75k, 17.6% for AGIs $75k-100k, 11.6% for AGIs over 100k)
Charity contributions deductions: $2,088 (3% of AGI, reported on 34.2% of returns)
Here:
$2,088
State:
$4,064
Here:
2.8% of AGI
State:
3.8% of AGI
(% of AGI for various income ranges: 0.8% for AGIs below $10k, 1.0% for AGIs $10k-25k, 1.3% for AGIs $25k-50k, 1.5% for AGIs $50k-75k, 1.6% for AGIs $75k-100k, 1.7% for AGIs over 100k)
Total tax: $6,423 (reported on 76.4% of returns)
34120:
$6,423
State:
$9,431
(% of AGI for various income ranges: 7.2% for AGIs below $10k, 4.5% for AGIs $10k-25k, 5.9% for AGIs $25k-50k, 7.3% for AGIs $50k-75k, 9.5% for AGIs $75k-100k, 17.0% for AGIs over 100k)
Earned income credit: $1,795 (reported on 17.4% of returns)
Here:
$1,795
State:
$1,808
Percentage of individuals using paid preparers for their 2004 taxes: 58.6%
Here:
59%
State:
60%
(% for various income ranges: 48.3% for AGIs below $10k, 58.0% for AGIs $10k-25k, 60.7% for AGIs $25k-50k, 60.9% for AGIs $50k-75k, 58.1% for AGIs $75k-100k, 69.8% for AGIs over 100k)
Household received Food Stamps/SNAP in the past 12 months: 1,021 Household did not receive Food Stamps/SNAP in the past 12 months: 13,186
Women who had a birth in the past 12 months: 359 (198 now married, 155 unmarried) Women who did not have a birth in the past 12 months: 7,548 (3,923 now married, 3,628 unmarried)
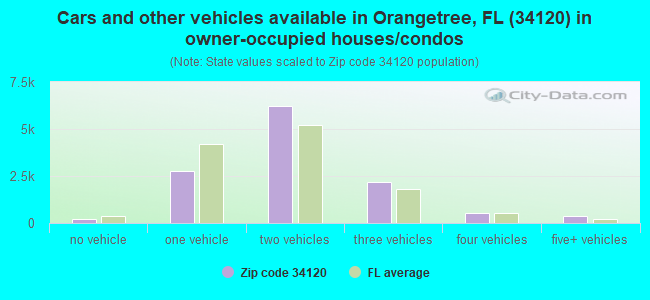
Housing units in zip code 34120 with a mortgage: 7,667 (497 second mortgage, 482 both second mortgage and home equity loan) Median monthly owner costs for units with a mortgage: $2,019 Median monthly owner costs for units without a mortgage: $628
Residents with income below the poverty level in 2022:
This zip code:
10.5%
Whole state:
12.7%
Residents with income below 50% of the poverty level in 2022:
This zip code:
7.7%
Whole state:
6.6%
Median number of rooms in houses and condos:
Here:
6.0
State:
5.9
Median number of rooms in apartments:
Here:
5.4
State:
4.2
Notable locations in this zip code not listed on our city pages
Notable locations in zip code 34120: Corkscrew Sanctuary Camp (A), Pine Tree Golf Course (B), Mount Dora Golf Club (C), Big Corkscrew Fire Department Station 11 Maintenance (D), Big Corkscrew Island Fire Control and Rescue District Station 10 (E), Big Corkscrew Island Fire Control and Rescue District Station 12 (F), Collier County Emergency Medical Services Station 10 (G), Collier County Sheriff's Office Golden Gate Estates Substation District 4 (H). Display/hide their locations on the map
Swamps: Bird Rookery Swamp (A), Winchester Strand (B), Winchester Head (C), Horseshoe Marsh (D), Horsepen Strand (E), Baucom Cypress Strand (F), Poggie Strand (G). Display/hide their locations on the map
Size of family households: 5,232 2-persons, 2,476 3-persons, 1,993 4-persons, 662 5-persons, 974 6-persons, 112 7-or-more-persons
Size of nonfamily households: 2,344 1-person, 308 2-persons, 49 3-persons
5,385 married couples with children.
1,497 single-parent households (571 men, 926 women).
57.8% of residents of 34120 zip code speak English at home.
33.0% of residents speak Spanish at home (60% very well, 14% well, 14% not well, 12% not at all).
8.8% of residents speak other Indo-European language at home (75% very well, 15% well, 7% not well, 3% not at all).
0.2% of residents speak Asian or Pacific Island language at home (16% very well, 47% well, 21% not well, 16% not at all).
0.4% of residents speak other language at home (100% very well).
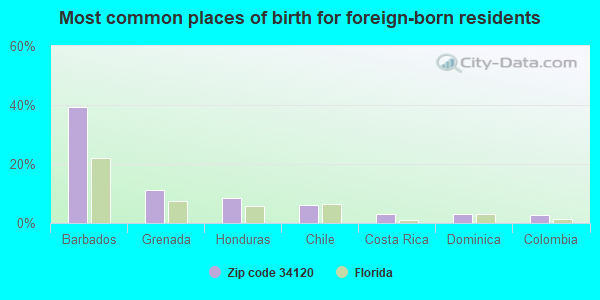
Foreign born population: 11,544 (29.4%) (61.0% of them are naturalized citizens)
This zip code:
29.4%
Whole state:
21.7%
39%Barbados
11%Grenada
8%Honduras
6%Chile
3%Costa Rica
3%Dominica
3%Colombia
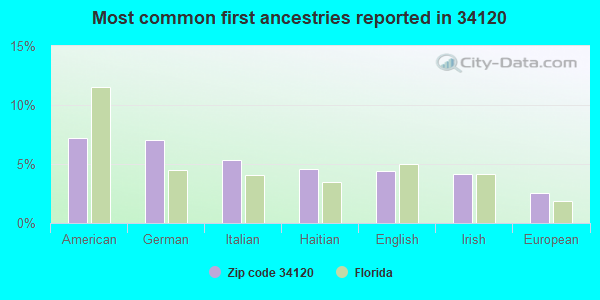
7%American
7%German
5%Italian
5%Haitian
4%English
4%Irish
3%European
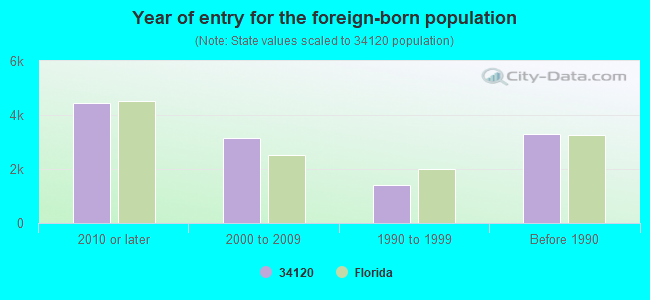
Year of entry for the foreign-born population
4,4412010 or later
3,1642000 to 2009
1,4001990 to 1999
3,278Before 1990
Major facilities with environmental interests located in this zip code:
LAKE PARK ELEMENTARY SCHOOL (1295 14TH AVE N in NAPLES, FL)
(National Center for Education Statistics) - STATE ID-0121 Organizations: COLLIER COUNTY SCHOOL DISTRICT (SCHOOL DISTRICT)
CORKSCREW ELEMENTARY SCHOOL (1065 COUNTY ROAD 858 in NAPLES, FL)
(National Center for Education Statistics) - STATE ID-0441 Organizations: COLLIER COUNTY SCHOOL DISTRICT (SCHOOL DISTRICT)
CORKSCREW MIDDLE SCHOOL (1165 COUNTY ROAD 858 in NAPLES, FL)
(National Center for Education Statistics) - STATE ID-0442 Organizations: COLLIER COUNTY SCHOOL DISTRICT (SCHOOL DISTRICT)
AVE MARIA UNIVERSITY CAMPUS (OIL WELL ROAD AT KEAIS ROAD in NAPLES, FL)
National Pollutant Discharge Elimination System NON-MAJOR (Tracking pollutant discharge elimination systems) - permit Organizations: DAVID GENSON (CONTACT/OWNER)
AVE MARIA WATER AND WASTEWATER (OIL WELL ROAD AT CAMP KEAIS RO in NAPLES, FL)
National Pollutant Discharge Elimination System NON-MAJOR (Tracking pollutant discharge elimination systems) - permit Organizations: DAVID GENSON (CONTACT/OWNER)
AVE MARIA--ENTRY ROAD (OIL WELL ROAD AT CAMP KEAIS RO in NAPLES, FL)
National Pollutant Discharge Elimination System NON-MAJOR (Tracking pollutant discharge elimination systems) - permit Organizations: DAVID GENSON (CONTACT/OWNER)
AVE MARIA--K-12 SCHOOL SITE (OIL WELL ROAD AND CAMP KEAIS R in NAPLES, FL)
National Pollutant Discharge Elimination System NON-MAJOR (Tracking pollutant discharge elimination systems) - permit Organizations: DAVID GENSON (CONTACT/OWNER)
AVE MARIA--TOWN CORE (OIL WELL ROAD AND CAMP KEAIS R in NAPLES, FL)
National Pollutant Discharge Elimination System NON-MAJOR (Tracking pollutant discharge elimination systems) - permit Organizations: DAVID GENSON (CONTACT/OWNER)
AVE MARIA--TOWN RESIDENTIAL (OIL WELL ROAD AT CAMP KEAIS RO in NAPLES, FL)
National Pollutant Discharge Elimination System NON-MAJOR (Tracking pollutant discharge elimination systems) - permit Organizations: DAVID GENSON (CONTACT/OWNER)
1200 MINGO DRIVE PROPERTY (1200 MINGO DR in NAPLES, FL)
(Resource Conservation and Recovery Act (tracking hazardous waste)) Organizations: LARRY PARKS OWNER (CONTACT/OWNER)
ORANGE BLOSSOM RANCH PHASE 1A (OIL WELL RD AND BIG ISLAND RAN in NAPLES, FL)
National Pollutant Discharge Elimination System NON-MAJOR (Tracking pollutant discharge elimination systems) - permit Organizations: DEAN REGAZZI (CONTACT/OWNER)
DE OCA PROPERTY (2861 22ND AVE NE in NAPLES, FL)
(Resource Conservation and Recovery Act (tracking hazardous waste)) Organizations: ROBERTO MONTES DE OCA (CONTACT/OWNER)
GOLDEN GATE BOULEVARD (RECONSTRUCT EXISTING ROAD in NAPLES, FL)
National Pollutant Discharge Elimination System NON-MAJOR (Tracking pollutant discharge elimination systems) - permit Alternative names: APAC-FLORIDA INC
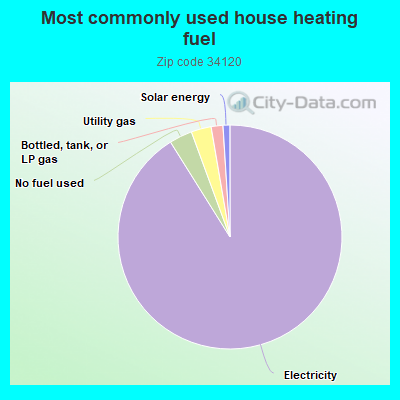
Housing units lacking complete plumbing facilities: 1.4% Housing units lacking complete kitchen facilities: 0.5%
91.1%Electricity
3.3%No fuel used
2.9%Utility gas
1.7%Bottled, tank, or LP gas
1.0%Solar energy
Place of birth for U.S.-born residents:
This state: 10,962
Northeast: 6,048
Midwest: 6,598
South: 2,281
West: 1,134
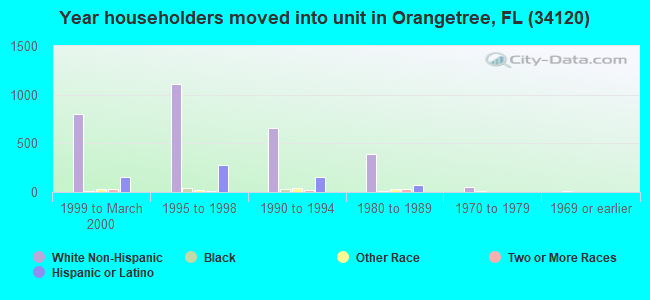
45% of the 34120 zip code residents lived in the same house 5 years ago. Out of people who lived in different houses, 50% lived in this county. Out of people who lived in different counties, 50% lived in Florida.
89% of the 34120 zip code residents lived in the same house 1 year ago. Out of people who lived in different houses, 50% moved from this county. Out of people who lived in different houses, 5% moved from different county within same state. Out of people who lived in different houses, 32% moved from different state. Out of people who lived in different houses, 15% moved from abroad.
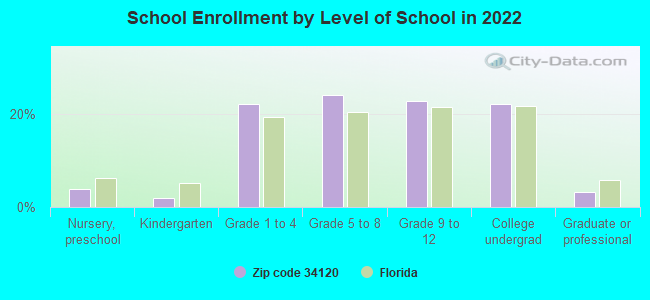
Private vs. public school enrollment:
Students in private schools in grades 1 to 8 (elementary and middle school): 461
Here:
12.3%
Florida:
15.8%
Students in private schools in grades 9 to 12 (high school): 149
Here:
8.1%
Florida:
12.9%
Students in private undergraduate colleges: 526
Here:
29.1%
Florida:
23.6%
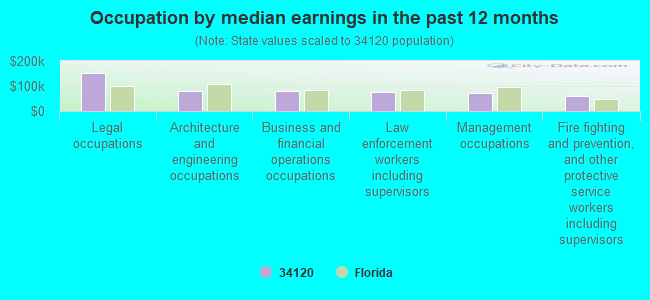
Occupation by median earnings in the past 12 months ($)
151,392Legal occupations
80,805Architecture and engineering occupations
80,777Business and financial operations occupations
76,406Law enforcement workers including supervisors
71,068Management occupations
60,551Fire fighting and prevention, and other protective service workers including supervisors
Companies with federal contracts located in this zip code:
HIGH SCORE INSTALLATIONS INC (3310 1ST AVE NW in NAPLES, FL; small business)
$41,421 with Air Force for Recreational and Gymnastic Equipment. Signed on 2002-07-15. Completion date: 2002-08-10.
Top industries in this zip code by the number of employees in 2005:
Arts, Entertainment, and Recreation: Golf Courses and Country Clubs (100-249 employees: 1 establishment, 50-99 employees: 3 establishments)
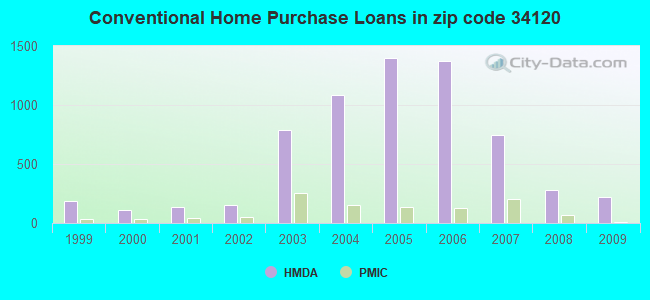
Detailed PMIC statistics for the following Tracts:0104.12
, 0112.02
2002 - 2018 National Fire Incident Reporting System (NFIRS) incidents
Based on the data from the years 2002 - 2018 the average number of fire incidents per year is 126. The highest number of reported fire incidents - 188 took place in 2011, and the least - 37 in 2005. The data has a declining trend.
When looking into fire subcategories, the most incidents belonged to: Outside Fires (66.8%), and Structure Fires (19.6%).
Fire incident types reported to NFIRS in Zip Code 34120


 Nearest zip codes: 34117, 33928, 34119, 34135, 34116, 34109.
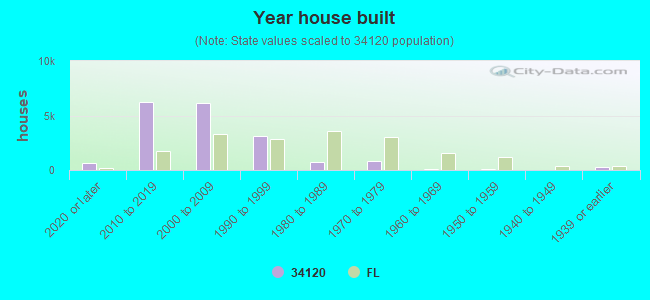


 Based on the data from the years 2002 - 2018 the average number of fire incidents per year is 126. The highest number of reported fire incidents - 188 took place in 2011, and the least - 37 in 2005. The data has a declining trend.
 When looking into fire subcategories, the most incidents belonged to: Outside Fires (66.8%), and Structure Fires (19.6%).